

Abstract
Taste perception begins in the oral cavity by interactions of taste stimuli with specific receptors. Specific subsets of taste receptor cells (TRCs) are activated upon tastant stimulation and transmit taste signals to afferent nerve fibers and ultimately to the brain. How specific TRCs impinge on the innervating nerves and how the activation of a subset of TRCs leads to the discrimination of tastants of different qualities and intensities is incompletely understood. To investigate the organization of taste circuits, we used gene targeting to express the transsynaptic tracer barley lectin (BL) in the gustatory system of mice. Because TRCs are not synaptically connected with the afferent nerve fibers, we first analyzed tracer production and transfer within the taste buds (TBs). Surprisingly, we found that BL is laterally transferred across all cell types in TBs of mice expressing the tracer under control of the endogenous Tas1r1 and Tas2r131 promotor, respectively. Furthermore, although we detected the BL tracer in both ganglia and brain, we also found local low-level Tas1r1 and Tas2r131 gene, and thus tracer expression in these tissues. Finally, we identified the Tas1r1 and Tas2r131-expressing cells in the peripheral and CNS using a binary genetic approach. Together, our data demonstrate that genetic transsynaptic tracing from bitter and umami receptor cells does not selectively label taste-specific neuronal circuits and reveal local taste receptor gene expression in the gustatory ganglia and the brain.
SIGNIFICANCE STATEMENT Previous papers described the organization of taste pathways in mice expressing a transsynaptic tracer from transgenes in bitter or sweet/umami-sensing taste receptor cells. However, reported results differ dramatically regarding the numbers of synapses crossed and the reduction of signal intensity after each transfer step. Nevertheless, all groups claimed this approach appropriate for quality-specific visualization of taste pathways. In the present study, we demonstrate that genetic transsynaptic tracing originating from umami and bitter taste receptor cells does not selectively label taste quality-specific neuronal circuits due to lateral transfer of the tracer in the taste bud and taste receptor expression in sensory ganglia and brain. Moreover, we visualized for the first time taste receptor-expressing cells in the PNS and CNS.
Keywords: bitter, gene-targeting, genetic labeling, genetic transsynaptic tracing, knock-in, umami
Introduction
Sweet and umami sensing cells in the mouth express hetero-oligomers formed by G-protein-coupled receptors (GPCRs) of the taste receptor family 1, Tas1r2/Tas1r3, or Tas1r1/Tas1r3, respectively, whereas bitter sensing cells express taste family 2 receptors (Tas2r; Yarmolinsky et al., 2009; Chaudhari and Roper, 2010). Taste receptor (type II) cells (TRCs) share signaling proteins, such as phospholipase C-β2 (PLC-β2), and release ATP in a nonsynaptic manner upon tastant stimulation (Huang et al., 2007; Romanov et al., 2007). ATP acts on P2X2/3 ionotropic purinergic receptors of afferent gustatory nerve fibers (Bo et al., 1999; Finger et al., 2005). Taste buds (TBs) also contain presynaptic/type III and type I/supportive cells in addition to TRCs (Chaudhari and Roper, 2010).
Whereas the lingual TBs are located in fungiform (FuP), foliate (FoP), and vallate papillae (VP) the palatal TBs are embedded in the epithelia of the naso-incisior duct (NID) and soft palate (SP). TBs of the anterior FoP and FuP are innervated by the chorda tympani, whereas palatal TBs are supplied by the greater superficial petrosal nerve, both branches of the facial nerve having its cell bodies in the geniculate ganglia. In contrast, vallate TBs are innervated by the glossopharyngeal nerve whose somata reside in the petrosal ganglia. The peripheral nerves contact first order central neurons in the nucleus of the solitary tract (Hamilton and Norgren, 1984), which project to the medial parabrachial nucleus. Gustatory information is then relayed to the parvocellular division of the ventral posterior medial thalamic nucleus and finally conveyed to the gustatory cortex in the anterior insula and frontal operculum (Norgren, 1978; Sewards and Sewards, 2001). From there taste information is also transmitted to other brain regions including the amygdala, hypothalamus, and nucleus accumbens (Norgren, 1978; Yamamoto et al., 1980; Halsell, 1992). It remains, however, poorly understood how specific TRCs impinge on the afferent fibers and how these are connected to central neurons that represent and process taste information (Chaudhari and Roper, 2010).
To label TRC-specific gustatory circuits in mice the transsynaptic tracer wheat germ agglutinin (WGA) has been expressed under the control of promoter fragments of Tas1r3, the common subunit of the sweet and umami receptor, or of the bitter receptor Tas2r105 (Sugita and Shiba, 2005; Damak et al., 2008; Ohmoto et al., 2008, 2010). Presence of WGA in the sensory ganglia and gustatory central areas in these transgenic animals indicated that the tracer visualized taste pathways connected to sweet/umami or bitter TCRs. However, the numbers of TRCs/TBs-expressing WGA and of ganglion cells labeled by the tracer were not reported in these studies. Moreover, potential lateral tracer transfer within the TBs possibly affecting its transfer to the ganglia was only partly analyzed. Importantly, WGA transfer efficiency (i.e., the number of synapses crossed by the tracer) differed remarkably in the different strains. To overcome potential effects caused by overexpression and random chromosomal integration of the tracer inherent to conventional transgenic approaches, we used a knock-in approach to express the transsynaptic tracer barley lectin (BL) from modified Tas1r1 and Tas2r131 loci in mice.
Materials and Methods
Mice.
Tas1r1+/BLiR and Tas2r131+/BLiG mice carry recombinant Tas1r1 or Tas2r131 alleles, in which the open reading frame is replaced with a bicistronic expression cassette consisting of the transsynaptic tracer BL and a fluorescent protein (Voigt et al., 2012; Kusuhara et al., 2013). Transcription of the recombinant Tas1r1 or Tas2r131 alleles yields bicistronic RNAs from which BL and the fluorescent proteins are translated. Both homozygous Tas1r1-mice (Tas1r1BLiR/BLiR) and Tas2r131-mice (Tas2r131BLiG/BLiG) lack the Tas1r1 or Tas2r131 receptor, but express BL and the fluorescent protein controlled by the endogenous Tas1r1 and Tas2r131 locus, respectively.
Tas1r1+/BLiC and Tas2r131+/BLiC mice carry recombinant Tas1r1 or Tas2r131 alleles expressing an epitope-tagged version of BL and Cre recombinase (Foster et al., 2013; Prandi et al., 2013). Tas1r1+/BLiC and Tas2r131+/BLiC mice were bred with the Rosa26-tdRFP mouse strain (Luche et al., 2007) to generate Tas1r1+/BLiC/Rosa26+/tdRFP and Tas2r131+/BLiC/Rosa26+/tdRFP mice. Cre-mediated recombination in these animals removes a transcriptional stop signal flanked by Lox-P sites and thus activates expression of tandem dimer red fluorescent protein (tdRFP) exclusively in Tas1r1 or Tas2r131-expressing cells.
Animal care and experimental procedures were performed in accordance with animal welfare committee of the Ministry of Environment, Health and Consumer Protection of the federal state of Brandenburg (State of Brandenburg, Germany, Permit No. 23-2347-A-1-1-2010). Tas1r1BLiR/BLiR and Tas2r131BLiG/BLiG mice were backcrossed for 10 generations to C57BL/6 mice. Tas1r1+/BLiC/Rosa26+/tdRFP and Tas2r131+/BLiC/Rosa26+/tdRFP mice were kept in a mixed (129/SvJ and C57BL/6J) background. Mice were housed in polycarbonate cages and kept under a standard light/dark cycle with water and food ad libitum. For the experimental procedures, we used adult mice of either sex. Littermates carrying Tas1r1 and Tas2r131 wild-type (WT) alleles and C57BL/6 mice were used as controls.
Reverse transcription-PCR.
Mice [Tas1r1+/BLiC (n = 6), C57BL/6 (n = 7)] were anesthetized using isofluran and killed by cervical dislocation. Subsequently, the posterior tongue (containing VP), the ganglia (GG, NPG), and the various brain regions were removed and shock-frozen in liquid nitrogen. RNA was extracted using TRIzol reagent (Invitrogen) and DNase I (Invitrogen) digestion was performed according to the manufacturer's protocol. Subsequently, cDNA synthesis was performed with Superscript II reverse transcriptase and random hexamers (Invitrogen). Omitting reverse transcriptase served as negative control. cDNA corresponding to 10 ng of reverse transcribed RNA was PCR-amplified (40 cycles, 63°C annealing temperature) using TITANIUM TaqDNA-polymerase (Clonetech). To control cDNA quality, a β-actin PCR was performed using primers β-actin, forward (5′-TGGGAATGGGTCAGAAGGACTCCTATG-3′) and reverse (5′-TCTTCATGAGGTAGTCTGTCAGGTCCCG-3′). Correctly synthesized cDNA resulted in an amplicon size of 441 bp, whereas genomic DNA resulted in a fragment of 895 bp.
Quantitative RT-PCR.
Real-time PCR was performed as described previously (Prandi et al., 2013) using the 7500 Fast Real-Time PCR System (Applied Biosystems). In brief, gene specific-primers combined with TaqMan probes were used to amplify Tas1r3, Tas2r105, and Tas2r131 cDNA (Table 1). β-actin served as a reference gene. The TaqMan assays were designed using Primer Express 3.0 software (Applied Biosystems) and then synthesized at Eurofins MWG Operon. To detect Tas1r1-specific cDNAs we used Assay Mm00473433_m1 (amplicon size 79 bp) purchased from Applied Biosystems. In all reactions, cDNA corresponding to 12.5 ng of total RNA served as a PCR template. +RT sample were tested in triplicates; −RT sample and water instead of template were used as control. The mean values of the investigated triplet threshold cycles (CT; reported by 7500 Software v2.0.1) were determined (single values differing ≥1 CT were excluded). The 2−ΔCT values were calculated using the mean CT of β-actin as a reference (ΔCT = CT target −CT reference).
Table 1.
Nucleotide sequences of oligonucleotides and probes used in quantitative RT-PCR experiments
| Oligonucleotide | Sequence (5′ to 3′) | Amplicon size, bp |
|---|---|---|
| Tas1r3_probe | FAM-TTCCTCATGCCACAGGTCAGCTATAGTGC-TAM | |
| Tas1r3_for | TCAGAGCTTGCCCTCATTACAG | 120 |
| Tas1r3_rev | TGTGCGGAAGAAGGATGGA | |
| Tas2r105_probe | FAM-TCATTTGTTGTGAAGGTGATGAAGGACGG-TAM | |
| Tas2r105_for | TGCTAACTTCATGGGTAATCTCCTT | 92 |
| Tas2r105_rev | GTACATCTCCGAGGTCCTGTTTCT | |
| Tas2r131_probe | FAM-TAGCCCACATTTCCCATCCCCTTTTC-TAM | |
| Tas2r131_for | CTGCCTGAGCATATTCTACTTATTCAA | 83 |
| Tas2r131_ rev | CACCTCTCAATCTCCACTTAAACCA | |
| β-actin_probe | FAM-TTGAGACCTTCAACACCCCAGCCA-TAM | |
| β-actin_for | TACGACCAGAGGCATACAG | 103 |
| β-actin_rev | GCCAACCGTGAAAAGATGAC |
Tissue preparation for IHC/IRF.
Mice [Tas1r1BLiR/BLiR (n = 15), Tas2r131BLiG/BLiG (n = 15), Tas1r1+/BLiC/Rosa26+/tdRFP (n = 5), Tas2r131+/BLiC/Rosa26+/tdRFP (n = 5), controls (n = 8)] were anesthetized with ketamine/xylazine (Bayer; Medistar) and transcardially perfused with PBS followed by 4% ice-cold paraformaldehyde in PBS. Tissues (tongues, palates, NIDs, ganglia, brains) were removed, postfixed for 2 h and incubated overnight in 30% sucrose solution. Tongues were frozen on dry ice, whereas palate, NID, ganglia, and brains were embedded in tissue freezing medium (Leica Microsystems) and snap-frozen in a dry ice/2-metylbutane bath. Using a cryostat (Microm) tissue sections of 14 or 40 μm thickness were prepared containing FuP, NID, SP, FoP, and VP. For analyzing the ganglia, the entire tissue was dissected in 10 μm (in situ hybridization), 14 μm [immunohistochemistry (IHC), intrinsic reporter fluorescence analysis (IRF)] or 25 μm (IHC) thick sections. For brain analysis, the entire brain was sectioned preparing sections of 10 μm (in situ hybridization) or 14 μm (IHC, IRF) thickness. All tissue sections were thaw-mounted onto Superfrost Plus slides (Menzel) and stored at −80°C.
IHC: tongue and palate.
Tissue sections were washed three times in PBS. For the staining with anti-aromatic amino acid decarboxylase (AADC) antiserum an additional heating step for 10 min at 80°C in targeting retrieval buffer (Dako) was included. Sections were then incubated in PBS containing 0.05% Triton X-100 for 10 min (P2X2/3 staining 20 min), rinsed three times in TNT buffer (0.15 m NaCl, 0.1 m Tris-HCl, and 0.05% Tween 20) for 5 min each, and then blocked in TNB buffer (0.15 m NaCl, 0.1 m Tris-HCl, and 0.5% tyramide signal amplification blocking reagent; PerkinElmer) for 30 min at room temperature. Simultaneously, sections were incubated with goat anti-WGA antiserum (which recognizes BL) and rabbit anti-NTPDase2, rabbit anti-PLC-β2, rabbit anti-AADC, or rabbit anti-P2X2 and P2X3 (P2X2/3) antiserum for 2 h at room temperature and then overnight at 4°C (antisera are listed in Table 2). Thorough validation in taste and neuronal tissues has been demonstrated previously for anti-NTPDase2 (Bartel et al., 2006), anti-PLC-β2 (Kim et al., 2006), anti-P2X2 (Finger et al., 2005), anti-P2X3 (Gnanasekaran et al., 2013), and anti-WGA (Horowitz et al., 1999). On the following day, slides where washed three times for 10 min in TNT buffer and then treated with donkey anti-rabbit IgG AlexaFluor 647 in TNB buffer for 1 h at room temperature. Slides were then washed three times for 10 min in TNT buffer and then incubated with either donkey anti-goat AlexaFluor 488 (Tas1r1BLiR/BLiR mice) or rabbit anti-goat AlexaFluor 561 (Tas2r131BLiG/BLiG) for additional 2 h at room temperature. Finally, slides were washed three times in TNT buffer and coverslipped using a fluorescent mounting medium (Dako). Fluorescent images were collected using a confocal laser-scanning microscope (TCS SP2, Leica) with 100× objective, 1.5 optical zoom, and 4 averages per image. To sequentially scan the entire depth of the tissue, 1 μm scanning steps were performed at excitation wavelengths of 488, 561, and 633 nm, respectively. Emissions of the fluorescent proteins humanized renilla green fluorescent protein (hrGFP), mCherry, and of the fluorochromes were detected between 505–530, 590–630, and 645–740 nm wavelengths, respectively. Negative controls were processed in parallel in every experiment, with primary antibody omitted. No nonspecific fluorescence was detected. Moreover, we did not observe mCherry or hrGFP fluorescence in WT mice.
Table 2.
List of antisera
| Species | Catalog No. | Company | Dilution | |
|---|---|---|---|---|
| anti-WGA (recognizes BL protein) | Goat | AS-20024 | Vector Laboratories | 1:500 |
| anti-NTPDase2 | Rabbit | — | (Bartel et al., 2006) | 1:1000 |
| anti-PLC-β2 | Rabbit | sc-206 | Santa Cruz Biotechnology | 1:500 |
| anti-AADC | Rabbit | GTX30448 | GeneTex | 1:500 |
| anti-P2X2 | Rabbit | APR-003 | Alomone Labs | 1:300 |
| anti-P2X3 | Rabbit | APR-016 | Alomone Labs | 1:300 |
| anti-Goat IgG biotinylated | Rabbit | BA-5000 | Vector Laboratories | 1:500 |
| anti-Goat IgG AlexaFluor 488 | Donkey | A-11055 | Molecular Probes | 1:500 |
| anti-Goat IgG AlexaFluor 546 | Rabbit | A-21085 | Molecular Probes | 1:500 |
| anti-Rabbit IgG AlexaFluor 647 | donkey | A-31573 | Invitrogen | 1:500 |
IHC: ganglia and brain.
All steps were performed at room temperature. First, cryosections were washed twice in PBS for 5 min and then incubated in methanol containing 0.6% hydrogen peroxide for 30 min. Slides were washed twice in PBS for 5 min each, subsequently incubated in PBS containing 0.05% Triton-X for 10 min, rinsed twice in TNT buffer for 5 min each, and then blocked for 30 min in TNB buffer. Sections were then incubated with goat anti-WGA antiserum for 2 h at room temperature and then overnight at 4°C. On the next day, sections were washed three times for 10 min in TNT buffer and then incubated with biotinylated rabbit anti-goat IgG in TNB buffer for 1 h. Sections were washed three times for 5 min each to remove unbound antiserum. To visualize BL in ganglia and brain tissue prepared from Tas2r131BLiG/BLiG mice, a tyramide signal amplification (TSA; PerkinElmer) step was included according to the manufacturer's protocol. Briefly, Tas2r131BLiG/BLiG sections were incubated with streptavidin-horseradish peroxidase (1:100, PerkinElmer) for 30 min in TNB buffer. After washing three times in TNT buffer, sections were incubated with biotin-TSA (1:50, PerkinElmer) in amplification diluent (PerkinElmer) for exactly 10 min and subsequently washed three times in TNT buffer for 5 min. Sections of Tas1r1BLiR/BLiR and Tas2r131BLiG/BLiG mice were then treated according to the manufacturer‘s instructions with components of the ABC (Vector Laboratories) and DAB kit (Vector Laboratories). Tissues were dehydrated and permanently mounted in nonaqueous mounting media (Vector Laboratories). Images of ganglia and brain sections were taken using a MIRAX MIDI Scan System (Zeiss). To visualize ganglionic cell structure, tissues were incubated in Phalloidin/PBS (Fluka, Sigma-Aldrich; 1.5:1000), washed in PBS and mounted with glass coverslips and mounting medium (Dako). For nuclear staining of brain tissue, sections were incubated with 4′,6-diamidino-2-phenylindole (DAPI; Sigma-Aldrich) for 10 min before mounting. Every fifth section was used for the analysis, which corresponds to a distance of 70 μm between the investigated sections. Brain structures were identified using a mouse brain atlas (Paxinos and Franklin, 2001).
Data analysis.
Z-stacks at 1 μm intervals of immunohistochemically processed tongue sections were used to analyze the BL distribution within TBs. Only TBs with at least 10 levels of IHC-labeled BL protein (≥10 μm thickness) were taken into the evaluation. The obtained images were analyzed using LCS light (Leica) and Photoshop (Adobe) software (Fig. 1A). For the evaluation, all levels of the z-stack were imported into Photoshop software and each of them was investigated manually. The three different channels were opened separately [channel 1: BL staining, channel 2: intrinsic fluorescence of reporter protein (mCherry or hrGFP), channel 3: marker proteins for cell types/fibers (NTPDase2, PLCβ2, AADC or P2X2/3); antisera listed in Table 2]. To reduce background to noise ratio the tonal value of channel 1 (BL) was set to 99%, subsequently the cell types/fibers were identified by IHC labeling (Fig. 1B). Exclusively BL signals with a pixel size of 5–9 pixels were taken into account and labeled with a green dot (Fig. 1C). Most of the signals corresponded to this size. Occasionally, BL-positive vesicular structures were seen that exceeded this size and most likely represented aggregates. Similarly, we observed a few smaller sized signals. To avoid false-positives, we omitted the larger and smaller sized structure from our calculations. The values may therefore represent slight underestimations. After counting BL signals were classified regarding their colocalization with the cell types/fibers (Fig. 1D). Only BL signals within the TBs were included in the counting. In PLC-β2+ or AADC+ cells, BL signals located intracellular and BL signal associated with the cell membrane were counted. In NTPDase2+ cells, BL signals were counted when colocalized with the NTPDase2-labeled structures.
Figure 1.

Double-immunofluorescence using antisera against BL or PLC-β2 on FuP sections prepared from Tas1r1BLiR/BLiR mice. A, Original image shows mCherry+ cells (red), PLC-β2+ cells (white), and BL protein (green). B, Identification of cell types based on their fluorescence; PLC-β2 cells white arrow, mCherry cells red arrow. C, BL signals were evaluated and marked by a green dot. D, The BL signal localization was classified based on the merged images of B and C. BL signals colocalized with BL/mCherry-expressing cells (yellow dots), as well as with PLC-β2+ cells, that do not express the BL tracer (pink dots). The image shown represents one optical layer of a 40-μm-thick tissue section. Scale bar, 15 μm.
In situ hybridization.
Sections obtained from perfused mouse tissues were postfixed for 5 min using 4% PFA in PBS (20 mm NaH2PO4, 80 mm NaHPO4, and 65 mm NaCl, pH 7.4) containing 1 mm MgCl2 and adjusted to pH 7.2, rinsed with PBS, incubated for 10 min in 0.2 m HCl and for 2 min in 1% Triton X-100. Sections were then washed twice (5 min) in PBS, and then acetylated in 0.1 m triethanolamine, pH 8.0, by drop-wise addition of acetic anhydride to a final concentration of 0.25% for 10 min and rinsed in PBS. Generation of the mCherry and hrGFP probes, prehybridization and hybridization of the sections was performed as described previously (Voigt et al., 2012). Sections were treated with 1 μg/ml RNase. The processed sections were mounted with glass coverslips using mounting medium (Dako). Probes were tested using sections containing FuP (Tas1r1BLiR/BLiR) and VP (Tas2r131BLiG/BLiG) as described previously (Voigt et al., 2012). In situ hybridization (ISH) protocol and tissue quality were controlled by hybridizing ganglia sections with a serotonin receptor antisense probe (5-HT3A). Images were taken using a MIRAX MIDI Scan System (Zeiss).
Results
Experimental strategy
In an attempt to trace gustatory pathways originating from Tas1r1- and Tas2r131-expressing cells, we used Tas1r1-BL-IRES-mCherry (Tas1r1-BLiR) and Tas2r131-BL-IRES-hrGFP (Tas2r131-BLiG) mice (Voigt et al., 2012). Tas1r1-BLiR mice carry a recombinant Tas1r1 allele, in which the Tas1r1 open reading frame is replaced with a bicistronic expression cassette consisting of the transsynaptic tracer BL and the red fluorescent protein mCherry (Voigt et al., 2012). Tas2r131-BLiG mice express BL and the hrGFP of a recombinant Tas2r131 allele.
Lateral BL transfer within the taste bud
To visualize BL in the TBs, we stained cross-sections prepared from Tas1r1BLiR/BLiR FuP (Fig. 2A) and Tas2r131BLiG/BLiG VP (Fig. 2B) with antiserum against BL. In Tas1r1BLiR/BLiR mice, BL is coexpressed with mCherry fluorescent cells, whereas Tas2r131BLiG/BLiG mice coexpress BL with hrGFP. This genetic strategy distinguishes between cells expressing the tracer (BL+/mCherry+ or BL+/hrGFP+) and cells acquiring the tracer via transfer (BL+/mCherry− or BL+/hrGFP−). We easily detected BL in those cells labeled by the fluorescent proteins in both mouse strains; however, some BL protein was also visible in nonfluorescent cells, suggesting lateral BL transfer within the TBs (Fig. 2A,B). FuP and VP of control mice did not show intrinsic reporter fluorescence or BL-labeling, demonstrating the specificity of our experimental approach (Fig. 2A,B).
Figure 2.

Lateral transfer of BL within the taste bud. A, B, Tas1r1 and Tas2r131 taste receptor cells of gene-targeted mice express the transsynaptic tracer BL and the fluorescent marker protein mCherry and hrGFP, respectively. FuP sections (14 μm) of Tas1r1BLiR/BLiR (A) and VP sections (14 μm) of Tas2r131BLiG/BLiG (B) mice stained with an antiserum against BL, show BL signal in cells labeled by the fluorescent marker proteins, as well as in other cells. TBs of control mice are labeled neither by the BL antiserum nor by intrinsic fluorescence. C, D, Double-labeling analysis on FuP (Tas1r1BLiR/BLiR) and VP (Tas2r131BLiG/BLiG) sections (40 μm) using antisera against BL and against NTPDase2, PLC-β2, AADC, and P2X2/3. Confocal images show that BL is found in fluorescent cells producing the tracer (mCherry+, red arrows; hrGFP+, green arrows), as well as in other cells in the TBs (mCherry−, hrGFP−; white arrows). E, BL distribution in TB cell types. Percentages of individual staining were summed up and set to 100% (Tables 3, 4). The adjusted values are shown as a bar chart for FuP, NID, SP, FoP, and VP of Tas1r1BLiR/BLiR and Tas2r131BLiG/BLiG mice (n = 4–6).
To determine the distribution of BL within the TBs, we next performed double-immunofluorescence (IF) analysis using antisera against BL and different taste cell markers. Sections containing lingual or palatal TBs were scanned using a confocal laser-scanning microscope to determine colocalization of BL with individual marker proteins. In TBs of FuP, NID, SP, FoP, and VP of both Tas1r1BLiR/BLiR and Tas2r131BLiG/BLiG mice, we observed colocalization of BL protein with cells expressing the type I cell marker nucleoside triphosphate diphosphohydrolase 2 (NTPDase 2), the type II taste cell marker PLC-β2 (mCherry−, hrGFP−), the type III cell marker AADC, as well as colocalization with nerve fibers labeled by the gustatory nerve marker P2X2/3 (Fig. 2C,D, white arrows).
We next quantified the data of 244 TBs (FuP, NID, and SP) in 6 Tas1r1BLiR/BLiR mice and of 341 TBs (FuP, NID, SP, FoP, and VP) in 6 Tas2r131BLiG/BLiG mice (Tables 3, 4). FoP and VP TBs of Tas1r1BLiR/BLiR mice were not analyzed due to rare occurrence of Tas1r1-expressing TBs in these structures (FoP 1.7 ± 1.2 TBs, n = 6 mice; VP 7.3 ± 2.2 TBs, n = 6 mice; Voigt et al., 2012). In Tas1r1BLiR/BLiR animals, we found similar BL distribution patterns in each taste bud (TB) type (Fig. 2D,E). In the FuP, 40.0% of the colocalized BL protein was found in mCherry+ cells, and 38.1% was colocalized with NTPDase2 (Fig. 2E). In palatal TBs, we detected 29.7% (NID) and 25.0% (SP) of the BL protein in mCherry+ cells, 24.1% (NID) and 29.9% (SP) of the BL signal was found in cells positive for NTPDase2. 22.3% (NID), and 20.2% (SP) of the BL signal was found in PLC-β2-expressing cells (these cells are mCherry−) and 22.5% (NID) and 21.3% (SP) of BL signals colocalized with the gustatory fiber marker P2X2/3. Only a small proportion of BL protein was found in cells expressing AADC (3.7–4.2%).
Table 3.
Number of BL signals, TBs, and mice used to evaluate BL distribution in TBs of Tas1r1BLiR/BLiR mice
| IF/mCherry | FuP |
NID |
SP |
|||||||||
|---|---|---|---|---|---|---|---|---|---|---|---|---|
| Sex | TB | BLT | BLc, % | Sex | TB | BLT | BLC, % | Sex | TB | BLT | BLC, % | |
| NTPDase2 | M | 4 | 373 | 36.2 | M | 5 | 1130 | 22.9 | M | 3 | 1091 | 23.4 |
| F | 9 | 1178 | 38.6 | M | 2 | 806 | 22.3 | F | 6 | 2405 | 29.6 | |
| F | 6 | 980 | 33.6 | F | 3 | 1422 | 25.6 | F | 5 | 1811 | 24.9 | |
| F | 6 | 724 | 30.8 | F | 2 | 884 | 26.6 | F | 4 | 1275 | 31.8 | |
| Total | 4 | 25 | 3255 | ∅34.2 | 4 | 12 | 4242 | ∅24.1 | 4 | 18 | 6582 | ∅27.7 |
| PLC-β2 | M | 8 | 681 | 14.4 | M | 3 | 894 | 25.6 | M | 6 | 1530 | 18.0 |
| M | 7 | 525 | 5.2 | M | 1 | 665 | 22.7 | M | 6 | 866 | 20.6 | |
| F | 14 | 1309 | 5.7 | F | 6 | 1910 | 22.9 | F | 6 | 960 | 20.9 | |
| F | 8 | 450 | 8.0 | F | 1 | 290 | 20.7 | |||||
| F | 1 | 69 | 21.7 | |||||||||
| Total | 4 | 37 | 2965 | ∅6.0 | 5 | 12 | 3828 | ∅23.3 | 3 | 18 | 3356 | ∅18.7 |
| AADC | M | 11 | 946 | 2.8 | M | 2 | 379 | 5.8 | M | 6 | 2999 | 2.7 |
| M | 8 | 542 | 5.0 | M | 2 | 231 | 3.8 | F | 6 | 2619 | 4.2 | |
| F | 12 | 859 | 5.1 | M | 2 | 611 | 6.3 | F | 5 | 677 | 2.7 | |
| F | 10 | 661 | 0.2 | F | 4 | 964 | 3.7 | F | 1 | 123 | 3.3 | |
| F | 2 | 657 | 3.9 | |||||||||
| Total | 4 | 41 | 3008 | ∅3.6 | 5 | 12 | 2842 | ∅4.4 | 4 | 18 | 6418 | ∅3.3 |
| P2X2/3 | M | 5 | 719 | 10.5 | M | 4 | 797 | 23.4 | M | 6 | 3064 | 19.5 |
| F | 11 | 1673 | 9.5 | M | 2 | 497 | 24.5 | F | 6 | 3558 | 14.6 | |
| F | 5 | 589 | 10.7 | M | 1 | 108 | 25.0 | F | 4 | 1431 | 22.3 | |
| F | 4 | 1347 | 22.5 | F | 2 | 1130 | 24.3 | |||||
| F | 1 | 55 | 20.4 | |||||||||
| Total | 3 | 21 | 2981 | ∅10.0 | 5 | 12 | 2804 | ∅23.5 | 4 | 18 | 9183 | ∅19.7 |
| mCherry | ≥6 | 124 | 12209 | 35.8 | ≥5 | 48 | 13716 | 29.1 | ≥6 | 72 | 25539 | 23.2 |
For each TB investigated, we determined the total number of BL signals (BLT) and calculated the percentage of colocalization with the marker protein (BLC). The mean value of BLC (∅) was calculated based on each individual TB analysis from the same colocalization study.
Table 4.
Number of BL signals, TBs, and mice used to evaluate BL distribution in TBs of Tas2r131BLiG/BLiG mice
| IF/hrGFP | FuP |
NID |
SP |
FoP |
VP |
|||||||||||||||
|---|---|---|---|---|---|---|---|---|---|---|---|---|---|---|---|---|---|---|---|---|
| Sex | TB | BLT | BLC, % | Sex | TB | BLT | BLC, % | Sex | TB | BLT | BLC, % | Sex | TB | BLT | BLC, % | Sex | TB | BLT | BLC, % | |
| NTPDase2 | M | 4 | 919 | 41.3 | M | 3 | 387 | 22.4 | M | 7 | 1090 | 13.3 | M | 6 | 892 | 19.8 | M | 7 | 3162 | 23.8 |
| M | 2 | 424 | 32.5 | M | 3 | 268 | 24.7 | M | 1 | 165 | 10.9 | M | 3 | 210 | 25.2 | M | 6 | 2027 | 28.7 | |
| F | 4 | 1742 | 34.2 | M | 1 | 22 | 18.2 | F | 3 | 531 | 17.3 | M | 2 | 445 | 20.8 | F | 7 | 1358 | 35.9 | |
| F | 4 | 1599 | 39.3 | F | 5 | 1069 | 15.7 | F | 3 | 499 | 17.0 | F | 4 | 511 | 24.1 | |||||
| F | 2 | 682 | 22.3 | F | 3 | 677 | 16.2 | F | 3 | 225 | 38.6 | |||||||||
| F | 1 | 196 | 38.7 | F | 1 | 122 | 13.1 | |||||||||||||
| F | 1 | 67 | 26.4 | |||||||||||||||||
| Total | 7 | 18 | 5629 | ∅30.7 | 4 | 12 | 1746 | ∅16.6 | 6 | 18 | 3084 | ∅14.5 | 5 | 18 | 2283 | ∅21.5 | 3 | 20 | 6547 | ∅32.0 |
| PLC-β2 | M | 6 | 877 | 35.3 | M | 5 | 1522 | 11.6 | M | 6 | 907 | 16.4 | M | 6 | 674 | 12.2 | M | 6 | 173 | 8.5 |
| M | 5 | 617 | 16.7 | M | 3 | 1231 | 12.9 | F | 2 | 599 | 24.4 | M | 5 | 663 | 14.9 | F | 7 | 352 | 10.3 | |
| M | 3 | 330 | 49.3 | F | 4 | 293 | 8.3 | F | 2 | 741 | 21.3 | F | 4 | 1181 | 7.1 | F | 6 | 537 | 7.7 | |
| M | 1 | 155 | 20.6 | F | 2 | 648 | 13.1 | F | 4 | 343 | 8.2 | |||||||||
| F | 3 | 327 | 24.5 | F | 3 | 273 | 27.9 | |||||||||||||
| F | 3 | 324 | 25.8 | |||||||||||||||||
| Total | 5 | 18 | 2058 | ∅33.2 | 3 | 12 | 3046 | ∅11.7 | 6 | 18 | 3492 | ∅19.5 | 4 | 19 | 2861 | ∅11.6 | 3 | 19 | 1062 | ∅8.2 |
| AADC | M | 7 | 1000 | 8.4 | M | 3 | 313 | 3.4 | M | 6 | 1054 | 3.1 | M | 5 | 936 | 0.0 | M | 8 | 2218 | 3.1 |
| F | 5 | 1063 | 13.5 | M | 2 | 450 | 3.4 | M | 2 | 243 | 2.9 | M | 3 | 257 | 0.0 | M | 5 | 2055 | 5.8 | |
| F | 3 | 565 | 11.7 | M | 1 | 216 | 4.2 | F | 6 | 999 | 3.1 | F | 8 | 973 | 0.3 | F | 6 | 1338 | 1.4 | |
| F | 3 | 515 | 9.2 | F | 4 | 416 | 2.7 | F | 1 | 133 | 0.8 | F | 2 | 229 | 0.0 | |||||
| F | 2 | 367 | 3.4 | F | 1 | 164 | 3.7 | |||||||||||||
| F | 2 | 344 | 4.4 | |||||||||||||||||
| Total | 4 | 18 | 3143 | ∅12.9 | 5 | 12 | 1762 | ∅3.3 | 6 | 18 | 2937 | ∅3.1 | 4 | 18 | 2395 | ∅0.0 | 3 | 19 | 5611 | ∅3.5 |
| P2X2/3 | M | 6 | 2008 | 14.0 | M | 4 | 1640 | 10.6 | M | 5 | 423 | 18.2 | M | 8 | 1024 | 10.5 | M | 6 | 722 | 6.5 |
| F | 6 | 1423 | 17.8 | M | 2 | 732 | 12.9 | F | 6 | 636 | 19.6 | M | 4 | 737 | 17.5 | M | 6 | 581 | 11.5 | |
| F | 6 | 1038 | 13.1 | F | 2 | 643 | 11.4 | F | 5 | 548 | 22.2 | F | 6 | 1978 | 10.3 | F | 6 | 507 | 9.3 | |
| F | 2 | 441 | 10.8 | F | 2 | 119 | 11.3 | |||||||||||||
| F | 2 | 270 | 19.4 | F | 1 | 117 | 12.8 | |||||||||||||
| Total | 3 | 18 | 4469 | ∅15.6 | 5 | 12 | 3726 | ∅15.1 | 5 | 19 | 1843 | ∅18.4 | 3 | 18 | 3739 | ∅12.6 | 3 | 18 | 1810 | ∅9.7 |
| hrGFP | ≥7 | 72 | 15103 | 30.1 | ≥5 | 48 | 9221 | 45.5 | ≥6 | 72 | 11346 | 46.6 | ≥5 | 73 | 11278 | 54.4 | ≥3 | 76 | 15030 | 47.0 |
For each TB investigated, we counted the total number of BL signals (BLT) and determined the percentage of colocalization with the marker protein (BLC). The mean value of BLC (∅) was calculated based on each individual TB analysis from the same colocalization study.
Similarly, all TB types from Tas2r131BLiG/BLiG mice analyzed revealed a similar BL distribution pattern. With the exception of the FuP (24.6%), ∼50% of the BL protein was found in the hrGFP+ cells in all other investigated TB structures. Of the BL signals, 14.2–32% colocalized with NTPDase2+ cells, 8.2−27.1% were found in PLC-β2+ cells, and 9.6–18% colocalized with P2X2/3+ gustatory nerve fibers. Only a few BL signals were detected in AADC+ cells (0–10.5%). Together, these data suggest that the BL tracer is laterally transferred from the cells of origin to other cell types within the TBs in both strains of mice.
BL is detected in neurons of the geniculate and nodose/petrosal ganglia
Next we asked whether BL is present in the somata of the ganglia of the seventh and ninth/tenth cranial nerve, which innervate TBs of the FuP, NID, SP, and FoP, VP, respectively. To this end, we isolated geniculate ganglia (GG), as well as nodose/petrosal ganglia (NPG; which are difficult to dissect separately) of Tas1r1BLiR/BLiR, Tas2r131BLiG/BLiG, and control mice. We found that a subpopulation of GG and NPG cells in Tas1r1BLiR/BLiR mice contained the BL tracer (Fig. 3A). In contrast, we first did not observe any BL labeling in sections of GG and NPG isolated from Tas2r131BLiG/BLiG mice. However when adding an additional TSA step in the IF staining protocol we detected a few GG and NPG cells in Tas2r131BLiG/BLiG but not in control mice (Fig. 3B). In total, we found that 12.6 ± 5.3 GG and 55.0 ± 7.0 NPG cells per mouse were labeled by the anti-BL antiserum in Tas1r1BLiR/BLiR mice (n = 12) and that 5.5 ± 0.7 GG and 12.7 ± 4.2 NPG cells were marked in Tas2r131BLiG/BLiG mice (n = 12; Fig. 3C). Compared with the total number of ganglion cells (GG 1025 ± 140, NPG 6412 ± 423; Liebl et al., 1997) only a small subpopulation of cells was immunoreactive for BL (Tas1r1BLiR/BLiR: GG 0.6%, NPG 0.4%; Tas2r131BLiG/BLiG: GG 0.3%, NPG 0.1%).
Figure 3.

A few ganglionic neurons contain the BL tracer. A, B, Sections (14 μm) of GG and NPG isolated from Tas1r1BLiR/BLiR and Tas2r131BLiG/BLiG mice show a few labeled ganglionic cells using antiserum against BL (arrows). No signal was observed in GG and NPG of control mice. C, Quantification of BL+ cells in GG and NPG. Results are obtained from the entire ganglia (right and left) of Tas1r1BLiR/BLiR (n = 12) and Tas2r131BLiG/BLiG (n = 12) mice. Data are mean ± SD.
Taste receptor genes are expressed in the ganglia
We next investigated whether BL is transferred from the TBs to the sensory ganglia cells or expressed locally. Although none of the BL+ cells in the sensory ganglia displayed intrinsic mCherry or hrGFP fluorescence (Fig. 4A), reverse transcription-PCR (RT-PCR) analysis however clearly demonstrated fluorescent marker protein expression in the ganglia (Fig. 4B). Furthermore, we also detected RNA for Tas1r1 and Tas1r3 in all ganglia, indicating local expression of these taste receptor genes (Fig. 4B). Sequence analysis of the PCR amplicons confirmed the identity of the Tas1r sequences. Importantly, quantitative RT-PCR using C57BL/6 WT tissue (n = 7 mice) corroborated these results (Fig. 4C). We found that the expression levels of the Tas1r1, Tas1r3, and Tas2r131 in the ganglia differed and was generally low relative to their expression levels in the VP. Tas1r1 and Tas1r3 expression levels were ∼46- and 400-fold higher in the GG and ∼55- and 170-fold higher in the NPG than those of Tas2r131. We also compared Tas1r1 expression levels in WT mice to those in heterozygous Tas1r1+/BLiR animals. Because the BL-IRES-mCherry expression cassette replaces the Tas1r1 open reading frame in the recombinant Tas1r1-BLiR allele, we expected a linear reduction of the Tas1r1 expression level by 50% in the heterozygous animals. Indeed, we found Tas1r1 expression levels in the gustatory tissue and in the sensory ganglia to be ∼50% of those in Tas1r1+/BLiR mice (Fig. 4E).
Figure 4.

Expression of Tas1r and Tas2r genes in GG and NPG. A, Fluorescence analysis of sections (25 μm) through the GG and NPG prepared from Tas1r1BLiR/BLiR, Tas2r131BLiG/BLiG, and WT mice stained with phalloidin. No intrinsic fluorescence was observed in the ganglia. B, RNA isolated from GG, NPG, and VP of WT mice (C57BL/6) was subjected to cDNA synthesis either using (+) or omitting (−) RT. Tas1r1, Tas1r3, Tas2r131, mCherry, and hrGFP-specific PCR products were detected in all +RT samples. In contrast, Tas2r105-specific PCR product was exclusively detected in +RT sample of VP. Fragments in B are quantitative RT-PCR products. Fragment specificity was verified by sequencing. Picture shows several gels sections as indicated by dividing lines. C, Quantitative RT-PCR analysis of sensory ganglia and gustatory tissue. GG and NPG show lower TR expression levels compared with VP. Taste receptors of the Tas1r-family are expressed at higher levels in GG and NPG than Tas2r131. Tas2r105 was not detected in GG and NPG. Data are mean ± SE of seven C57BL/6 mice, normalized for β-actin and presented in logarithmic scaling. D, ISH: cross-sections (10 μm) of GG and NPG obtained from Tas1r1BLiR/BLiR, Tas2r131BLiG/BLiG, and C57BL/6 mice (control) were hybridized with digoxigenin-labeled mCherry and hrGFP riboprobes. None of the hybridized sections show any labeling in the somata of the ganglia cells. E, Quantitative RT-PCR of ganglia and gustatory tissue. Tas1r1 expression levels in GG, NPG, and VP are reduced by a factor of two in heterozygous Tas1r1+/BLiR mice compared with WT mice. Data are mean ± SE of six Tas1r1+/BLiR and 6 C57BL/6 mice, normalized for β-actin. F, tdRFP fluorescence (red) identifies Tas2r131- and Tas1r1-expressing cells in GG and NPG sections (14 μm) of adult Tas2r131+/BLiC/Rosa26+/tdRFP or Tas1r1+/BLiC/Rosa26+/tdRFP mice. Scale bar, 100 μm.
To identify the TR-expressing cells in the sensory ganglia, we then performed in situ hybridization experiments using antisense probes for mCherry or hrGFP mRNA. However, we did not observe labeled cells either in GG or in NPG tissue sections of Tas1r1BLiR/BLiR and Tas2r131BLiG/BLiG mice using this technique (Fig. 4D). Together, these data suggest local low-level taste receptor (TR) and thus tracer gene expression in the sensory ganglia.
A binary genetic strategy to visualize taste receptor-expressing cells
To be able to visualize and characterize the TR-expressing cells in the ganglia, we adopted a binary genetic strategy and used gene targeting to generate new Tas1r1 and Tas2r131 alleles. In Tas1r1-BLiC and Tas2r131-BLiC animals, Cre recombinase is expressed under control of the Tas1r1 and Tas2r131 promoters, respectively (Foster et al., 2013; Prandi et al., 2013). After breeding to a Cre-dependent reporter strain (Luche et al., 2007), Cre-mediated recombination in the resulting Tas1r1+/BLiC/Rosa26+/tdRFP mice and Tas2r131+/BLiC/Rosa26+/tdRFP mice leads to excision of a transcriptional stop signal and thus activates constitutive tdRFP reporter expression exclusively in Tas1r1- or Tas2r131-expressing cells, respectively. Of note, fluorescent reporter expression is subsequently driven by the ROSA26 promoter.
Strikingly, sections of GG and NPG prepared from Tas1r1+/BLiC/Rosa26+/tdRFP and Tas2r131+/BLiC/Rosa26+/tdRFP mice revealed a subpopulation of cells labeled by tdRFP in these animals, providing genetic evidence for Tas1r1 and Tas2r131 expression in the ganglia (Fig. 4F). Specifically, we found 65.5 ± 9.3 tdRFP+ cells in the GG and 32.4 ± 5.3 tdRFP+ cells in the NPG in Tas1r1+/BLiC/Rosa26+/tdRFP mice (n = 5). In Tas2r131+/BLiC/Rosa26+/tdRFP mice we only found 5.6 ± 1.1 tdRFP+ cells in the GG and 9.6 ± 3.8 tdRFP+ cells in the NPG. The lower number of tdRFP+ cells in the Tas2r131 gene-targeted mice is consistent with the TR expression levels determined in the qRT-PCR experiments (Fig. 4C). In fact, a comparison of Tas1r1 and Tas2r131 expression levels revealed a 41- and 19-fold higher Tas1r1 expression level in GG and NPG, respectively. A comparison of the percentage of the total number of cells in the ganglia (GG 1025 ± 140, NPG 6412 ± 42; Liebl et al., 1997) to the number of cells expressing Tas1r1 or Tas2r131 receptor demonstrated that 3.2% (GG) and 0.3% (NPG) of the entire ganglion cell population expressed Tas1r1 receptor, whereas only 0.3% (GG) and 0.1% (NPG) of the entire population expressed Tas2r131 receptor, respectively.
BL is detected in different nuclei of the mouse brainstem
The gustatory neurons of the GG and NPG project to neurons in the rostral part of the nucleus of the solitary tract (rNTS) of the brainstem (Hamilton and Norgren, 1984). Projection areas of these rNTS neurons are further subdivisions of the NTS, of different brainstem areas, as well as of the parabrachial nucleus (PbN). To investigate whether BL is present in these or in additional brain regions, we stained coronal 14 μm sections through the entire brain using antiserum against BL.
We found BL+ cells in several subdivisions of the NTS Tas1r1BLiR/BLiR mice (Fig. 5A,C). Moreover, we detected many BL-labeled cells in the cerebellum (e.g., Ncl. interpositus, Ncl. medialis/lateralis cerebelli), in other brainstem regions (e.g., Ncl. reticularis parvocellularis, Ncl. reticularis gigantocellularis, Ncl. spinalis nervi trigemini, Formatio reticularis pontis), as well as in the basal forebrain (e.g., corpus striatum). However, higher projection areas known to be involved in gustatory processing, such as the PbN, Th, and GC did not show any BL labeling. The detailed mapping of all brain regions containing BL+ cells in three individual mice is summarized in Figure 5C.
Figure 5.
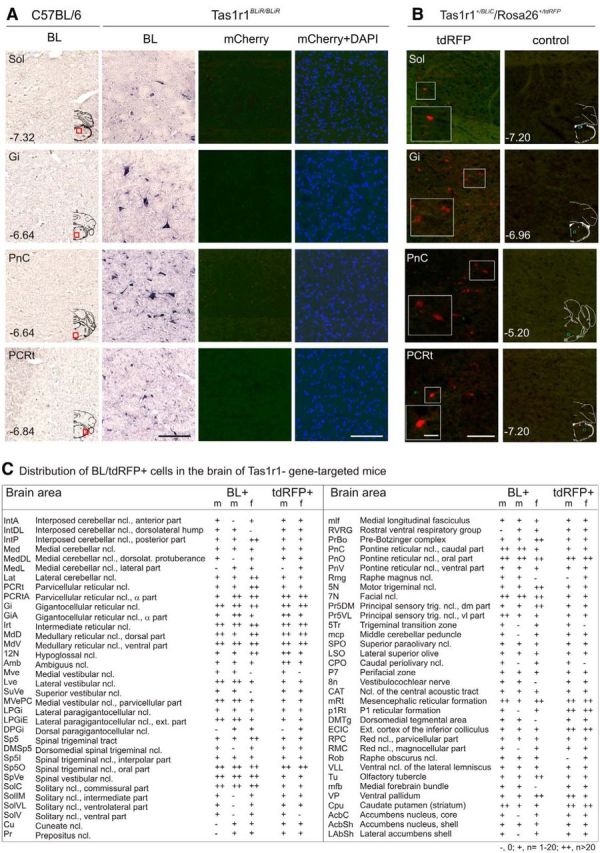
BL+ and Tas1r1+ cells in the CNS of Tas1r1 gene-targeted mice. A, IHC analysis using an antiserum against BL on coronal brain sections (14 μm) of a Tas1r1BLiR/BLiR mouse. Sections of control mice did not show any signal. Adjacent brain sections of the Tas1r1BLiR/BLiR mouse were stained with DAPI and analyzed for intrinsic fluorescence. None of the sections displayed mCherry fluorescence. Scale bar, 100 μm. B, Intrinsic reporter fluorescence (tdRFP, red) identifies Tas1r1 cells in coronal sections (14 μm) of Tas1r1+/BLiC/Rosa26+/tdRFP mice. No fluorescent cells were observed in corresponding brain regions of control mice (Tas1r1+/+/Rosa26+/tdRFP). Scale bar, 100 μm; magnified images (white squares), 25 μm. Overview images (A, B) are coronal sections taken from a mouse brain atlas (Paxinos and Franklin, 2001). Numbers indicate distance from bregma, red (A) or blue (B) squares indicate the displayed region. C, Number of BL and tdRFP-positive cells was counted in every fifth section, corresponding to intervals of 70 μm, through different brain areas of female (f) and male (m) Tas1r1 gene-targeted mouse brains. The total number of positive cells for each region was determined in three individual mouse brains. Brain regions were identified using a mouse brain atlas (Paxinos and Franklin, 2001).
Although initial analysis of brain sections prepared from Tas2r131BLiG/BLiG mice with the identical IHC protocol as used for Tas1r1BLiR/BLiR mice did not show any BL-labeled cells, a modified protocol including a TSA step revealed a few BL+ cells (Fig. 6A). In Tas2r131BLiG/BLiG mice BL+ cells were restricted to a few brainstem nuclei (e.g., Ncl. reticularis parvocellularis, Ncl. reticularis gigantocellularis, Ncl. spinalis nervi trigemini, Formatio reticularis pontis). A few BL+ cells were also detected in the ventral part of the NTS (Fig. 6C).
Figure 6.
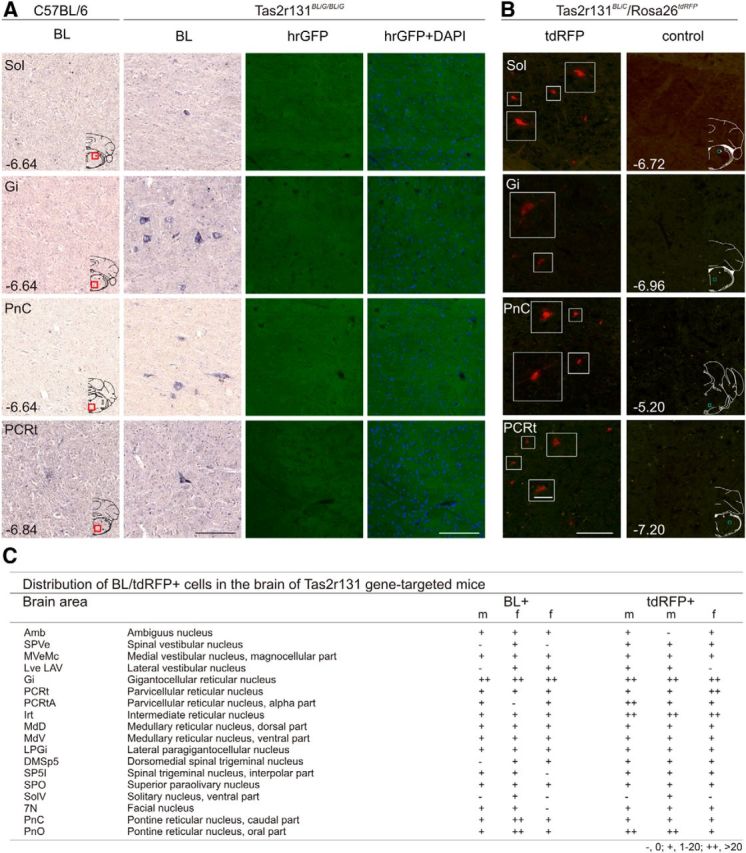
BL+ and Tas2r131+ cells in the CNS of Tas2r131 gene-targeted mice. A, IHC analysis for BL on coronal brain sections (14 μm) of Tas2r131BLiG/BLiG mice. Sections prepared from control mice did not show any signal. Adjacent sections were stained with DAPI and analyzed for intrinsic hrGFP fluorescence. None of the sections displayed cells with hrGFP fluorescence. Scale bar, 100 μm. B, Intrinsic reporter fluorescence (tdRFP, red) visualize Tas2r131 cells in coronal sections (14 μm) of Tas2r131+/BLiC/Rosa26+/tdRFP mice. No fluorescent cells were observed in corresponding brain regions of control mice (Tas2r131+/+/Rosa26+/tdRFP). Scale bar, 100 μm; magnified images (white squares), 25 μm. Overview images (A, B) are coronal sections taken from a mouse brain atlas (Paxinos and Franklin, 2001). Numbers indicate distance from bregma, red (A) or blue (B) squares indicate the displayed region. C, Number of BL and tdRFP-positive cells was counted in every fifth section, corresponding to intervals of 70 μm, through different brain areas of female (f) and male (m) Tas2r131 gene-targeted mouse brains. The total number of positive cells for each region was determined in three individual mouse brains. Brain regions were identified using a mouse brain atlas (Paxinos and Franklin, 2001).
A semiquantitative analysis of BL+ cells in three individual male and female Tas1r1BLiR/BLiR and Tas2r131BLiG/BLiG mice revealed similar numbers of cells labeled (Figs. 5C, Fig. 6C). In few cases, we observed some variability regarding cell numbers within animals of the same group likely due to the sampling frequency (every fifth brain section analyzed). Interestingly, a comparison of the numbers of BL+ cells in both mouse lines showed more BL+ cells in brains of Tas1r1BLiR/BLiR mice.
Adjacent sections did not reveal any mCherry and hrGFP fluorescence, respectively (Figs. 5A, Fig. 6A). ISH analysis using mCherry, hrGFP or TR-specific probes did also not reveal any labeling on brain slices, raising the possibility that the BL tracer is transferred to the brain.
Expression of taste receptor genes in various regions of the mouse brain
To further investigate whether BL is transferred to or locally expressed in the CNS, we performed quantitative RT-PCR analysis for Tas1r1, Tas1r3, Tas2r105, and Tas2r131 RNA on tissue punches containing brainstem (BS), cerebellum (CB), proencephalon (ProE), hypothalamus (Hyp), and olfactory bulbs, (OB) (Fig. 7A,B). Surprisingly, we obtained specific amplicons for both members of the Tas1r-family in all investigated brain areas, suggesting local expression of Tas1r1 and Tas1r3 in the brain. Quantitative RT-PCR demonstrated that the expression level of Tas1r3 is on average higher when compared with the expression level of Tas1r1 (BS 10×; CB 60×; ProE 10×; Hyp 5×; OB 20×). Moreover, we observed expression of bitter receptor Tas2r131 in BS and Hyp, but not in CB, ProE, and OB. Compared with Tas1r expression levels, Tas2r131 expression levels were markedly lower (BS 170×; Hyp 250×). In contrast, we did not observe any Tas2r105 expression in the brain at all. The RT-PCR results indicate local Tas1r1, Tas1r3, and Tas2r131 expression in the brain. We also compared Tas1r1 expression levels in BS and Hyp in WT mice to those in heterozygous Tas1r1+/BLiR animals and found Tas1r1 expression levels in BS and Hyp to be reduced [Tas1r1+/BLiR (n = 6 mice); BS 32.0%, Hyp 38.9%, VP 48%] in Tas1r1+/BLiR mice (Fig. 7C), suggesting local low-level TR (and thus tracer) gene expression in the brain.
Figure 7.

Local Tas1r and Tas2r expression in the brain. A, RNA from BS, CB, ProE, Hyp, OBs, and VP of WT mice was subjected to cDNA synthesis either using (+) or omitting (− RT. Tas1r1 and Tas1r3-specific PCR products were detected in all +RT samples. In contrast, Tas2r131-specific PCR products were exclusively detected in BS, Hyp, and VP. Tas2r105 amplicons were only detected in gustatory, but not in brain tissue. Image shows several gels sections as indicated by dividing lines. B, Quantitative RT-PCR analysis of brain tissue. Tas1r3 expression levels were higher than those for Tas1r1. Note that Tas2r131 is exclusively expressed in BS and Hyp, whereas Tas2r105 is not expressed in the brain. Data are mean ± SE of seven WT mice, normalized for β-actin and presented in logarithmic scaling. C, Quantitative RT-PCR analysis on brain and gustatory tissue. Tas1r1 expression levels in BS, Hyp, and VP are twofold lower in heterozygous Tas1r1+/BLiR mice compared with WT mice. Data are mean ± SE of six Tas1r1+/BLiR and six WT mice normalized for β-actin.
Visualization of taste receptor-expressing cells in the CNS
To confirm this possibility, we then analyzed brain sections prepared from Tas1r1+/BLiC/Rosa26+/tdRFP and Tas2r131+/BLiC/Rosa26+/tdRFP mice. Strikingly, we detected tdRFP+ cells in different brain nuclei of both strains, providing genetic evidence for local Tas1r1 and Tas2r131 expression in the brain (Fig. 5B, Fig. 6B). Furthermore, brain regions containing BL+ cells (Tas1r1BLiR/BLiR, Tas2r131BLiG/BLiG) match those containing tdRFP+ cells in the Tas1r1+/BLiC/Rosa26+/tdRFP and Tas2r131+/BLiC/Rosa26+/tdRFP animals (Fig. 5C, Fig. 6C). In fact, comparing the magnitude of BL+ and tdRFP+ cells in a certain brain region revealed similar numbers of cells labeled. Some variability regarding cell numbers within animals of the same group or between the groups is likely due to the sampling frequency, because only every fifth brain section was investigated for this analysis. Together, our data suggest that the BL signals observed in CNS neurons originate from local TR and thus tracer expression.
Discussion
TRCs are not synaptically connected with afferent neurons. Therefore, detailed analysis of the expression and distribution of the genetic transsynaptic tracer in TBs is essential to assess whether tracer uptake by gustatory fibers is quality-specific and selectively labels neuronal circuits linked to specific taste cells. We investigated the distribution of BL in lingual and palatal TBs and found the tracer protein: (1) in the producing umami or bitter cells, labeled by the fluorescent reporter proteins mCherry or hrGFP, (2) in gustatory fibers, (3) in NTPDase2+ cells, (4) in PLC-β2+ cells (mCherry-/hrGFP-), and (5) in AADC+ cells. Unexpectedly, one-half of the total tracer signal was detected in NTPDase2+, AADC+, and PLC-β2+ cells, i.e., in cells not expressing the tracer. Interestingly, the TBs of both gene-targeted mouse lines showed similar BL distribution patterns, suggesting that the tracer might be distributed in the TBs independently of the TRC subpopulation producing it. Due to its N-terminal signal peptide, the BL tracer is present in vesicles derived from the endoplasmic reticulum and released via exocytosis. Thus, the sites of BL-release may differ from those releasing ATP arguing against a visualization of taste pathways by the tracer. Binding to glycoproteins and glycolipids, located on the cell surface of neighboring cells, leads to subsequent tracer endocytosis. Therefore, exocytosis sites of the manipulated TRC, as well as the glycosylation pattern of its neighboring cells might influence lateral tracer transfer within the TBs. WGA is 98% identical to BL on the amino acid level and binds to different cells located in FuP, FoP, and VP of the rabbit (Witt and Miller, 1992). Moreover, WGA also binds to both gustducin-immunoreactive cells and to gustducin-negative cells in rat VP (Wakisaka, 2005). Whether some TB cell types are more selective for WGA binding is not yet known. Assuming that none of the different cell types in the TBs preferentially binds WGA, the distribution of either WGA or BL tracer produced in a subset of TB cells should reflect the number of cells representing each cell type. Electron microscopy and IHC analysis in rats revealed that 50% of the VP TB cells are type I cells (Pumplin et al., 1997; Ueda et al., 2003) and express NTPDase2 (Bartel et al., 2006). Approximately 40% of the VP TB cells are immunoreactive for the inositol triphosphate receptor (Ohkubo et al., 2007) and coexpress PLC-β2 (Clapp et al., 2001). Five to 15% are presynaptic cells (Ueda et al., 2003), immunoreactive for AADC (DeFazio et al., 2006). Summing up all detected BL signals to 100%, we found a BL distribution of 44% (NTPDase2), 24% (PLC-β2), and 6% (AADC) in Tas1r1BLiR/BLiR mice, and 40% (NTPDase2), 28% (PLC-β2), and 7% (AADC) in Tas2r131BLiG/BLiG mice. Together, our data suggest that the BL distribution pattern simply reflects the relative abundance of the different cell types in the TBs. In fact, our analyses do not indicate specific tracer uptake by gustatory fibers in either mouse strain. Taste pathways have been investigated in previous studies using different genetic approaches. The photomicrographs presented by Ohmoto et al. (2010) showed WGA predominantly localized in the originating Tas2r105 TRCs, but also sparse signals in other cells. Similarly, photomicrographs of Tas1r3 transgenic mice illustrated an obvious overlap of WGA with the Tas1r3 TRC population (Damak et al., 2008; Ohmoto et al., 2008). Consistent with our findings, some photomicrographs however show WGA outside the tracer-producing cells. Whether this is due to colocalization of the tracer with fibers (Damak et al., 2008) or with type I cells requires further experimental analysis.
One apparent difference between our study and previous experiments is the amount of tracer protein produced by the TBs. Although we used knock in alleles to drive tracer expression faithfully from the endogenous Tas1r1 or Tas2r131 promoters in our gene-targeted mice the analysis of the other groups were performed in transgenic mice likely carrying multiple copies of the transgenes leading to overexpression of the tracer. Moreover, the 2% sequence divergence between the BL and WGA tracers, though not likely, could account for the reported differences in tracer distribution.
Uptake of BL by nerve afferents, selective or nonselective, should lead to passive transfer to the ganglia cells and possibly to higher projection areas. Both somata of GG and of NPG cells contained BL in Tas1r1BLiR/BLiR and Tas2r131BLiG/BLiG mice. We found on average 157 Tas1r1/BL-expressing TBs in FuP, NID, and SP (Voigt et al., 2012); structures innervated by the chorda tympani and the greater superficial petrosal nerve, two branches of the seventh cranial nerve. In contrast, only nine Tas1r1/BL-expressing TBs were detected in FoP and VP (Voigt et al., 2012), which are innervated by the ninth cranial nerve. Therefore, we expected more BL-labeled cells in the GG than in the NPG of these mice. In marked contrast, however, we found four times less BL-labeled cells in the GG cells compared with the NPG. Vice versa, 106 Tas2r131/BL-expressing TBs were detected in FuP, NID, and, SP and 411 Tas2r131/BL+ TBs in FoP and VP. We therefore expected ∼4-fold less BL-labeled cells in GG than in NPG, yet the difference is only twofold. Of note, a signal amplification step was necessary to detect BL labeling in ganglia of Tas2r131BLiG/BLiG mice, although the number of Tas2r131/BL-expressing cells in the oral cavity is four times higher than the number of Tas1r1/BL-expressing cells (Voigt et al., 2012). An average of four to six GG cells innervates single TBs in the FuP and SP (Zaidi and Whitehead, 2006), suggesting that each neuron may transmit information related to only one of the five taste qualities. Based on this hypothesis, we would expect to label ∼157 GG cells in Tas1r1BLiR/BLiR mice and ∼106 GG cells in Tas2r131BLiG/BLiG mice [number of labeled TBs (FuP+NID+SP) × 4–6 GG cells labeled/5 taste qualities]. However, less than one-tenth of the expected GG cells were labeled. We did neither detect intrinsic fluorescence nor mCherry or hrGFP mRNA by ISH in the ganglia. However, quantitative RT-PCR unambiguously revealed specific Tas1r1 and Tas2r131 expression in both GG and NPG at low levels possibly precluding detection by intrinsic reporter fluorescence or ISH. Although ISH analysis using a WGA-specific riboprobe in the GG and NPG of Tas1r3-WGA (Ohmoto et al., 2008, 2010) and Tas1r3-WGA-IRES-GFP transgenic mice (Damak et al., 2008) did not yield any signal, RT-PCR analysis of the ganglia was not reported in these studies. Remarkably, we could easily detect robust Tas1r3 expression in the GG, as well as in the NPG in both gene-targeted and WT mice. Unfortunately, neither the total number of Tas1r3 or Tas2r105 cells/TB in the oral cavity nor the numbers of GG and NPG labeled cells in the transgenic mice have been reported. Sugita and Shiba did not report investigation of the ganglia at all (Sugita and Shiba, 2005; Sugita et al., 2013).
Additional evidence arguing against a selective transfer of BL stems from our brain analysis. Because the projection area of gustatory fibers is the rNTS (Bradley, 2007), we expected tracer-labeled neurons particularly present in this region. However, we detected either very few (Tas1r1BLiR/BLiR) or no cells (Tas2r131BLiG/BLiG) in the rNTS. The amount of tracer (and thus signal intensity) decreases depending on the number of synapses crossed (Yoshihara et al., 1999). Surprisingly however, we found many tracer-labeled cells displaying similar staining intensities in various brain nuclei in both Tas1r1BLiR/BLiR and Tas2r131BLiG/BLiG mice, arguing against selective labeling of gustatory pathways.
On the other hand, in transgenic mice expressing the WGA tracer in presynaptic cells of the TB, which unlike receptor cells, are synaptically linked to afferent fibers, tracer uptake by the afferents was specific and a few gustatory neurons in the rostral NTS, as well as neurons in several motor nuclei of the brainstem were labeled (Yamamoto et al., 2011). In this case, the NTS sites containing tracer were found were consistent with the projections sites of gustatory afferents. Moreover, the number of synapses crossed by the tracer and the transfer efficiency were in accordance with expectations based on experiences with tracing experiments in the olfactory system (Yoshihara et al., 1999).
Together, in line with previous tracing studies from TRC and type III cells (Sugita and Shiba, 2005; Damak et al., 2008; Ohmoto et al., 2008, 2010; Yamamoto et al., 2011), we have detected genetically encoded tracer in gustatory areas of the PNS and CNS. However, whereas the tracer could indeed partially originate from the targeted TRC it may also stem from other sources, i.e., nontarget cells through lateral transfer in the TBs or TR-expressing PNS and CNS neurons. TR expression in the brain is unambiguously demonstrated by visualizing Tas1r1 and Tas2r131-expressing neurons confirming and extending previous results (Ren et al., 2009; Shin et al., 2010; Singh et al., 2011; Dehkordi et al., 2012). The ambiguity regarding the origin of the tracer is obviously less serious when the tracer originates from type III cells, which are synaptically connected to the afferent nerves.
Footnotes
This work was supported in part by the Deutsche Forschungsgemeinschaft [BO 1743/2, to UB]. We thank Dr Thomas E. Finger (University of Colorado, Denver, CO) for teaching us the ganglia preparation, Stefanie Demgensky, Ellen Schöley-Pohl, and Josefine Würfel for expert technical assistance, and Ali Derin and Jasmin Mattern for excellent animal care. We thank Olaf Pongs for continuous support and Hans Joerg Fehling for providing Rosa26-tdRFP mice.
The authors declare no competing financial interests.
References
- Bartel DL, Sullivan SL, Lavoie EG, Sévigny J, Finger TE. Nucleoside triphosphate diphosphohydrolase-2 is the ecto-ATPase of type I cells in taste buds. J Comp Neurol. 2006;497:1–12. doi: 10.1002/cne.20954. [DOI] [PMC free article] [PubMed] [Google Scholar]
- Bo X, Alavi A, Xiang Z, Oglesby I, Ford A, Burnstock G. Localization of ATP-gated P2X2 and P2X3 receptor immunoreactive nerves in rat taste buds. Neuroreport. 1999;10:1107–1111. doi: 10.1097/00001756-199904060-00037. [DOI] [PubMed] [Google Scholar]
- Bradley RM. rNST circuits. In: Bradley RM, editor. The role of the nucleus of the solitary tract in gustatory processing. Boca Raton, FL: CRC; 2007. [PubMed] [Google Scholar]
- Chaudhari N, Roper SD. The cell biology of taste. J Cell Biol. 2010;190:285–296. doi: 10.1083/jcb.201003144. [DOI] [PMC free article] [PubMed] [Google Scholar]
- Clapp TR, Stone LM, Margolskee RF, Kinnamon SC. Immunocytochemical evidence for co-expression of type III IP3 receptor with signaling components of bitter taste transduction. BMC Neurosci. 2001;2:6. doi: 10.1186/1471-2202-2-6. [DOI] [PMC free article] [PubMed] [Google Scholar]
- Clark AA, Dotson CD, Elson AE, Voigt A, Boehm U, Meyerhof W, Steinle NI, Munger SD. TAS2R bitter taste receptors regulate thyroid function. FASEB J. 2015;29:164–172. doi: 10.1096/fj.14-262246. [DOI] [PMC free article] [PubMed] [Google Scholar]
- Damak S, Mosinger B, Margolskee RF. Transsynaptic transport of wheat germ agglutinin expressed in a subset of type II taste cells of transgenic mice. BMC Neurosci. 2008;9:96. doi: 10.1186/1471-2202-9-96. [DOI] [PMC free article] [PubMed] [Google Scholar]
- DeFazio RA, Dvoryanchikov G, Maruyama Y, Kim JW, Pereira E, Roper SD, Chaudhari N. Separate populations of receptor cells and presynaptic cells in mouse taste buds. J Neurosci. 2006;26:3971–3980. doi: 10.1523/JNEUROSCI.0515-06.2006. [DOI] [PMC free article] [PubMed] [Google Scholar]
- Dehkordi O, Rose JE, Fatemi M, Allard JS, Balan KV, Young JK, Fatima S, Millis RM, Jayam-Trouth A. Neuronal expression of bitter taste receptors and downstream signaling molecules in the rat brainstem. Brain Res. 2012;1475:1–10. doi: 10.1016/j.brainres.2012.07.038. [DOI] [PubMed] [Google Scholar]
- Finger TE, Danilova V, Barrows J, Bartel DL, Vigers AJ, Stone L, Hellekant G, Kinnamon SC. ATP signaling is crucial for communication from taste buds to gustatory nerves. Science. 2005;310:1495–1499. doi: 10.1126/science.1118435. [DOI] [PubMed] [Google Scholar]
- Foster SR, Porrello ER, Purdue B, Chan HW, Voigt A, Frenzel S, Hannan RD, Moritz KM, Simmons DG, Molenaar P, Roura E, Boehm U, Meyerhof W, Thomas WG. Expression, regulation and putative nutrient-sensing function of taste GPCRs in the heart. PLoS One. 2013;8:e64579. doi: 10.1371/journal.pone.0064579. [DOI] [PMC free article] [PubMed] [Google Scholar]
- Gnanasekaran A, Sundukova M, Hullugundi S, Birsa N, Bianchini G, Hsueh YP, Nistri A, Fabbretti E. Calcium/calmodulin-dependent serine protein kinase (CASK) is a new intracellular modulator of P2X3 receptors. J Neurochem. 2013;126:102–112. doi: 10.1111/jnc.12272. [DOI] [PubMed] [Google Scholar]
- Halsell CB. Organization of parabrachial nucleus efferents to the thalamus and amygdala in the golden hamster. J Comp Neurol. 1992;317:57–78. doi: 10.1002/cne.903170105. [DOI] [PubMed] [Google Scholar]
- Hamilton RB, Norgren R. Central projections of gustatory nerves in the rat. J Comp Neurol. 1984;222:560–577. doi: 10.1002/cne.902220408. [DOI] [PubMed] [Google Scholar]
- Horowitz LF, Montmayeur JP, Echelard Y, Buck LB. A genetic approach to trace neural circuits. Proc Natl Acad Sci U S A. 1999;96:3194–3199. doi: 10.1073/pnas.96.6.3194. [DOI] [PMC free article] [PubMed] [Google Scholar]
- Huang YJ, Maruyama Y, Dvoryanchikov G, Pereira E, Chaudhari N, Roper SD. The role of pannexin 1 hemichannels in ATP release and cell–cell communication in mouse taste buds. Proc Natl Acad Sci U S A. 2007;104:6436–6441. doi: 10.1073/pnas.0611280104. [DOI] [PMC free article] [PubMed] [Google Scholar]
- Kim JW, Roberts C, Maruyama Y, Berg S, Roper S, Chaudhari N. Faithful expression of GFP from the PLCbeta2 promoter in a functional class of taste receptor cells. Chem Senses. 2006;31:213–219. doi: 10.1093/chemse/bjj021. [DOI] [PubMed] [Google Scholar]
- Kusuhara Y, Yoshida R, Ohkuri T, Yasumatsu K, Voigt A, Hübner S, Maeda K, Boehm U, Meyerhof W, Ninomiya Y. Taste responses in mice lacking taste receptor subunit T1R1. J Physiol. 2013;591:1967–1985. doi: 10.1113/jphysiol.2012.236604. [DOI] [PMC free article] [PubMed] [Google Scholar]
- Liebl DJ, Tessarollo L, Palko ME, Parada LF. Absence of sensory neurons before target innervation in brain-derived neurotrophic factor-, neurotrophin 3-, and TrkC-deficient embryonic mice. J Neurosci. 1997;17:9113–9121. doi: 10.1523/JNEUROSCI.17-23-09113.1997. [DOI] [PMC free article] [PubMed] [Google Scholar]
- Luche H, Weber O, Nageswara Rao T, Blum C, Fehling HJ. Faithful activation of an extra-bright red fluorescent protein in “knock-in” Cre-reporter mice ideally suited for lineage tracing studies. Eur J Immunol. 2007;37:43–53. doi: 10.1002/eji.200636745. [DOI] [PubMed] [Google Scholar]
- Norgren R. Projections from the nucleus of the solitary tract in the rat. Neuroscience. 1978;3:207–218. doi: 10.1016/0306-4522(78)90102-1. [DOI] [PubMed] [Google Scholar]
- Ohkubo Y, Yokosuka H, Kumakura M, Yoshie S. Existence of subtypes of gustducin-immunoreactive cells in the vallate taste bud of guinea pigs. Arch Histol Cytol. 2007;70:291–296. doi: 10.1679/aohc.70.291. [DOI] [PubMed] [Google Scholar]
- Ohmoto M, Matsumoto I, Yasuoka A, Yoshihara Y, Abe K. Genetic tracing of the gustatory and trigeminal neural pathways originating from T1R3-expressing taste receptor cells and solitary chemoreceptor cells. Mol Cell Neurosci. 2008;38:505–517. doi: 10.1016/j.mcn.2008.04.011. [DOI] [PubMed] [Google Scholar]
- Ohmoto M, Maeda N, Abe K, Yoshihara Y, Matsumoto I. Genetic tracing of the neural pathway for bitter taste in t2r5-WGA transgenic mice. Biochem Biophys Res Commun. 2010;400:734–738. doi: 10.1016/j.bbrc.2010.08.139. [DOI] [PubMed] [Google Scholar]
- Paxinos G, Franklin K. The mouse brain in stereotaxic coordinates. Ed 2. St. Louis: Elsevier Academic; 2001. [Google Scholar]
- Prandi S, Bromke M, Hübner S, Voigt A, Boehm U, Meyerhof W, Behrens M. A subset of mouse colonic goblet cells expresses the bitter taste receptor Tas2r131. PLoS One. 2013;8:e82820. doi: 10.1371/journal.pone.0082820. [DOI] [PMC free article] [PubMed] [Google Scholar]
- Pumplin DW, Yu C, Smith DV. Light and dark cells of rat vallate taste buds are morphologically distinct cell types. J Comp Neurol. 1997;378:389–410. doi: 10.1002/(SICI)1096-9861(19970217)378:3<389::AID-CNE7>3.0.CO;2-#. [DOI] [PubMed] [Google Scholar]
- Ren X, Zhou L, Terwilliger R, Newton SS, de Araujo IE. Sweet taste signaling functions as a hypothalamic glucose sensor. Front Integr Neurosci. 2009;3:12. doi: 10.3389/neuro.07.012.2009. [DOI] [PMC free article] [PubMed] [Google Scholar]
- Romanov RA, Rogachevskaja OA, Bystrova MF, Jiang P, Margolskee RF, Kolesnikov SS. Afferent neurotransmission mediated by hemichannels in mammalian taste cells. EMBO J. 2007;26:657–667. doi: 10.1038/sj.emboj.7601526. [DOI] [PMC free article] [PubMed] [Google Scholar]
- Sewards TV, Sewards MA. Cortical association areas in the gustatory system. Neurosci Biobehav Rev. 2001;25:395–407. doi: 10.1016/S0149-7634(01)00021-5. [DOI] [PubMed] [Google Scholar]
- Shin YJ, Park JH, Choi JS, Chun MH, Moon YW, Lee MY. Enhanced expression of the sweet taste receptors and alpha-gustducin in reactive astrocytes of the rat hippocampus following ischemic injury. Neurochem Res. 2010;35:1628–1634. doi: 10.1007/s11064-010-0223-2. [DOI] [PubMed] [Google Scholar]
- Singh N, Vrontakis M, Parkinson F, Chelikani P. Functional bitter taste receptors are expressed in brain cells. Biochem Biophys Res Commun. 2011;406:146–151. doi: 10.1016/j.bbrc.2011.02.016. [DOI] [PubMed] [Google Scholar]
- Sugita M, Shiba Y. Genetic tracing shows segregation of taste neuronal circuitries for bitter and sweet. Science. 2005;309:781–785. doi: 10.1126/science.1110787. [DOI] [PubMed] [Google Scholar]
- Sugita M, Yamamoto K, Hirono C, Shiba Y. Information processing in brainstem bitter taste-relaying neurons defined by genetic tracing. Neuroscience. 2013;250:166–180. doi: 10.1016/j.neuroscience.2013.06.032. [DOI] [PubMed] [Google Scholar]
- Ueda K, Fujii M, El-Sharaby A, Honma S, Wakisaka S. Human blood group antigen H is not the specific marker for type I cells in the taste buds. Arch Histol Cytol. 2003;66:469–473. doi: 10.1679/aohc.66.469. [DOI] [PubMed] [Google Scholar]
- Voigt A, Hübner S, Lossow K, Hermans-Borgmeyer I, Boehm U, Meyerhof W. Genetic labeling of Tas1r1 and Tas2r131 taste receptor cells in mice. Chem Senses. 2012;37:897–911. doi: 10.1093/chemse/bjs082. [DOI] [PubMed] [Google Scholar]
- Wakisaka S. Lectin histochemistry of taste buds in the circumvallate papilla of the rat. Chem Senses. 2005;30:i46–47. doi: 10.1093/chemse/bjh106. [DOI] [PubMed] [Google Scholar]
- Witt M, Miller IJ., Jr Comparative lectin histochemistry on taste buds in foliate, circumvallate and fungiform papillae of the rabbit tongue. Histochemistry. 1992;98:173–182. doi: 10.1007/BF00315876. [DOI] [PubMed] [Google Scholar]
- Yamamoto K, Ishimaru Y, Ohmoto M, Matsumoto I, Asakura T, Abe K. Genetic tracing of the gustatory neural pathway originating from Pkd1l3-expressing type III taste cells in circumvallate and foliate papillae. J Neurochem. 2011;119:497–506. doi: 10.1111/j.1471-4159.2011.07443.x. [DOI] [PMC free article] [PubMed] [Google Scholar]
- Yamamoto T, Matsuo R, Kawamura Y. The pontine taste area in the rabbit. Neurosci Lett. 1980;16:5–9. doi: 10.1016/0304-3940(80)90092-0. [DOI] [PubMed] [Google Scholar]
- Yarmolinsky DA, Zuker CS, Ryba NJ. Common sense about taste: from mammals to insects. Cell. 2009;139:234–244. doi: 10.1016/j.cell.2009.10.001. [DOI] [PMC free article] [PubMed] [Google Scholar]
- Yoshihara Y, Mizuno T, Nakahira M, Kawasaki M, Watanabe Y, Kagamiyama H, Jishage K, Ueda O, Suzuki H, Tabuchi K, Sawamoto K, Okano H, Noda T, Mori K. A genetic approach to visualization of multisynaptic neural pathways using plant lectin transgene. Neuron. 1999;22:33–41. doi: 10.1016/S0896-6273(00)80676-5. [DOI] [PubMed] [Google Scholar]
- Zaidi FN, Whitehead MC. Discrete innervation of murine taste buds by peripheral taste neurons. J Neurosci. 2006;26:8243–8253. doi: 10.1523/JNEUROSCI.5142-05.2006. [DOI] [PMC free article] [PubMed] [Google Scholar]