

Abstract
Diffusion tensor imaging revealed that trait anxiety predicts the microstructural properties of a prespecified fiber tract between the amygdala and the perigenual anterior cingulate cortex. Besides this particular pathway, it is likely that other pathways are also affected. We investigated white matter differences in persons featuring an anxious or a nonanxious personality, taking into account all potential pathway connections between amygdala and anxiety-related regions of the prefrontal cortex (PFC). Diffusion-weighted images, measures of trait anxiety and of reappraisal use (an effective emotion-regulation style), were collected in 48 females. With probabilistic tractography, pathways between the amygdala and the dorsolateral PFC, dorsomedial PFC, ventromedial PFC, and orbitofrontal cortex (OFC) were delineated. The resulting network showed a direct ventral connection between amygdala and PFC and a second limbic connection following the fornix and the anterior limb of the internal capsule. Reappraisal use predicted the microstructure of pathways to all calculated PFC regions in the left hemisphere, indicating stronger pathways for persons with high reappraisal use. Trait anxiety predicted the microstructure in pathways to the ventromedial PFC and OFC, indexing weaker connections in trait-anxious persons. These effects appeared in the right hemisphere, supporting lateralization and top-down inhibition theories of emotion processing. Whereas a specific microstructure is associated with an anxious personality, a different structure subserves emotion regulation. Both are part of a broad fiber tract network between amygdala and PFC.
Keywords: amygdala, DTI, PFC, reappraisal use, top-down inhibition, trait anxiety
Introduction
The interplay between amygdala and prefrontal cortex (PFC) is central to the regulation of emotions. Crucial components of this interplay are top-down inhibition processes manifesting themselves in downregulation of the amygdala by medial PFC (mPFC; Bishop, 2007). A greater functional connectivity between the amygdala and the mPFC was reported in persons with low anxiety (Pezawas et al., 2005). Investigating fiber connections in white matter, Kim and Whalen (2009) applied diffusion tensor imaging (DTI) and found that trait anxiety, a stable tendency to respond with anxiety, predicted the microstructure of a ventral amygdala–PFC pathway. Persons high in trait anxiety showed lower values of fractional anisotropy (FA; Basser and Pierpaoli, 1996) on this tract to the perigenual anterior cingulate cortex, i.e., weaker connections. It is likely that a larger network of amygdala–PFC connections is affected in trait anxiety (for review, see Ray and Zald, 2012). Data by Kim and Whalen (2009) support the idea that anxiety is associated with ineffective top-down inhibition. These dysfunctional processes might be attributable to an attenuated use of reappraisal, a coping strategy involving reinterpretation of the emotional meaning of stimuli. Low reappraisal results in low activity in PFC regions and in high amygdala activity (Ochsner et al., 2002, 2004; Kim and Hamann, 2007). In women, the microstructural foundation for this interplay is related to the integrity of white matter pathways between amygdala and PFC (Zuurbier et al., 2013).
Anatomical knowledge about amygdala–PFC connections mostly derives from primates. Because of close cytoarchitectural homology between primates and humans (Petrides and Mackey, 2006; Jbabdi et al., 2013), a transfer of findings seems reasonable but awaits further support. The mPFC and the orbitofrontal cortex (OFC) receive direct input from the amygdala (for an overview, see Barbas and Zikopoulos, 2006), whereas the lateral PFC receives less, and mostly indirect, input via the cingulate or posterior OFC (Ray and Zald, 2012). Studies investigating amygdala–PFC connections in relation to anxiety have mostly focused on specific and direct connections, such as to the insula or via the uncinate fasciculus. They neglected indirect routes via long association fibers (Modi et al., 2013; Baur et al., 2013a,b).
Our aim was to investigate white matter alterations in persons with high and low trait anxiety, along multiple pathways connecting amygdala and PFC. We collected diffusion-weighted magnetic resonance images and applied probabilistic tractography (Behrens et al., 2007) to reconstruct all potential pathways between the amygdala and PFC regions associated with anxiety-related processes. A rather large body of literature established an association of anxiety with right-hemispheric activity (Davidson et al., 1990), and thus we hypothesized trait anxiety to be associated with weaker right-hemispheric connections. Mechanisms of reappraisal are less investigated, but there is some evidence for left-hemispheric lateralization of reappraisal (Ochsner et al., 2002) as well as higher metabolic activity in left frontal regions in reappraisal users (Kim et al., 2012). Consequently, reappraisal was expected to be associated with stronger left-hemispheric connections brought forth by intensive use.
Materials and Methods
Subjects
Three hundred ten nonclinical volunteers completed an on-line version of the Spielberger Trait Anxiety Inventory (Spielberger et al., 1983). On the basis of individual trait scores, right-handed (according to the Edinburgh Handedness Inventory; Oldfield, 1971) female participants were selected if they scored ≤30 or ≥50. In a next step, they were matched for age. This established two groups of participants (n = 24 each), one with low anxiety [LA; mean trait score, 27.08 (SD, 2.43); mean age, 25.38 (SD, 3.679)] and one with high anxiety [HA; mean trait score, 27.08 (SD, 2.43); mean age, 25.38 (SD, 3.67)], that did not differ for age (df = 46, T = 1.414, p = 0.166) nor years of schooling. All group members were medically healthy and had no history of psychiatric medication or mental disorders, as verified by the Mini International Neuropsychiatric Interview (version 5.0.0) of the Diagnostic Statistical Manual–IV (Ackenheil et al., 1999). The participants that were excluded from the two groups did not fulfill one or more of the required inclusion criteria. All procedures were cleared by the ethical review board of the Ärztekammer Westfalen-Lippe, and subjects gave informed consent for their participation.
Procedure
To control for intelligence differences between groups, the Wechsler Adult Intelligence Scale (German version of the WAIS-III; Von Aster et al., 2006) was administered individually to every subject 2 d before image acquisition. No significant differences were found between the HA and LA groups (HA: mean, 107.00; SD, 25.11; LA: mean, 115.17; SD, 13.06; T = 1.414, p = 0.164). Participants completed the German version of the Emotion Regulation Questionnaire (Gross and John, 2003), which measures reappraisal use. The two groups displayed significant differences in reappraisal use (HA: mean, 23.04; SD, 6.52; LA: mean, 27.75; SD, 6.03; T = 2.598, p = 0.013; see Table 1 for means separated by group).
Table 1.
Means and SDs of demographic, behavioral, and fractional anisotropy (in target regions) data, separately for both anxiety groups
| Trait anxiety group | Trait anxiety score | Reappraisal score | Age | Years of schooling | IQ | FA |
|||
|---|---|---|---|---|---|---|---|---|---|
| OFC | vmPFC | dmPFC | dlPFC | ||||||
| Low | 27.08 ± 2.43 | 27.75 ± 6.03 | 25.38 ± 3.67 | 13 ± 0 | 115.17 ± 13.06 | L: 0.533 ± 0.017 | L: 0.544 ± 0.015 | L: 0.553 ± 0.015 | L: 0.545 ± 0.019 |
| R: 0.541 ± 0.017 | R: 0.541 ± 0.014 | R: 0.554 ± 0.012 | R: 0.541 ± 0.012 | ||||||
| High | 57.58 ± 4.65 | 23.04 ± 6.52 | 26.92 ± 5.99 | 13 ± 0 | 107.00 ± 25.11 | L: 0.522 ± 0.030 | L: 0.488 ± 0.152 | L: 0.505 ± 0.157 | L: 0.471 ± 0.183 |
| R: 0.527 ± 0.017 | R: 0.531 ± 0.013 | R: 0.519 ± 0.112 | R: 0.508 ± 0.111 | ||||||
L, Left hemisphere; R, right hemisphere.
Image acquisition
Participants were instructed to lie still and stay awake throughout the entire scanning procedure. Diffusion MRI (dMRI) and structural T1-weighted images were acquired on a 3T MR scanner (Intera 3.0T; Philips Medical Systems), with an inner bore diameter of 60 cm, equipped with Quasar-Dual Gradients with two modes, either 40 mT/m gradient strength and 200 mT/m/ms slew rate for general imaging or 80 mT/m gradient strength and 100 mT/m/ms slew rate for diffusion imaging.
Diffusion MRI.
High-angular resolution dMRI data were acquired using a six-channel head coil with a single-shot spin echo EPI sequence (TE, 55 ms; TR, 15,623 ms; image matrix, 128 × 128; FOV, 240 × 240 mm2), providing 60 diffusion-encoding gradient directions with a b value of 1000 s/mm2 and a single measurement without a diffusion-weighting gradient (b = 0 s/mm2). Seventy-eight axial slices with 1.88 mm thickness were acquired in an interleaved manner, covering the whole brain. This resulted in cubic voxels of 1.88 mm edge length. Parallel image acquisition was applied using SENSE with an acceleration factor of 2 and a scan duration of 20 min.
Anatomical MRI.
The T1-weighted images were acquired with a 3D nonequilibrium gradient echo sequence (turbo field echo) with water-selective excitation. Contrast preparation of magnetization consisted of a nonselective inversion pulse every 1020 ms. Imaging parameters were as follows: TR, 9.3 ms; final TE, 4.4 ms; pulse angle, 9°; FOV, 300 × 239 × 234 mm3 (foot-head × anterior-posterior × right-left); cubic voxels of 1.17 mm edge length; SENSE acceleration factor 2′ scan duration, 8.43 min.
dMRI preprocessing
Before data processing, dMRI volumes that were corrupted by movement of the participants were removed from the datasets. First, an automatic method was used to remove volumes of low quality. The algorithm is based on the fact that motion eliminates the signal in a slice when motion occurs during its acquisition. Usually, the average voxel intensity of two consecutive slices does not change much. Only when motion extinguishes the signal in parts of a slice does its average voxel intensity differ greatly from its neighbors' and indicate corruption of the volume. In a following control step, visual inspection of the datasets ensured the satisfactory quality of the remaining data. The cleaned dMRIs were interpolated to 1 mm isotropic resolution, aligned with the MNI template, and corrected for motion and eddy-current effects in one step with a single interpolation. The diffusion tensor and the FA maps were computed by use of the FSL software package (http://fsl.fmrib.ox.ac.uk/fsl/fsl-4.1.9; Smith et al., 2004; Woolrich et al., 2009; Jenkinson et al., 2012).
Regions for connectivity analysis
Based on the literature, four regions in the PFC were defined: the ventromedial PFC (vmPFC; Buckholtz et al., 2008), the dorsomedial PFC (dmPFC; Kim et al., 2011), the dorsolateral PFC (dlPFC; Stein et al., 2007), and the OFC (Zald and Kim, 1996a,b; Rauch et al., 1997; Sladky et al., 2012). Since the precise anatomical locations and boundaries of these areas have not yet been defined beyond controversy (Roy et al., 2012), there was no suitable ready-to-use atlas that comprised all four PFC areas for our purposes. Thus, we manually created an atlas that included the dmPFC, dlPFC, OFC, and vmPFC based on the atlas introduced by Oishi (type II WMPM; Oishi et al., 2009). The ventral and dorsal regions were separated by an axial cutting plane at z = 5 (MNI). The posterior end of the ROIs was defined at y = 0 (MNI). This atlas was morphed on the individual brains using nonlinear registration (Avants et al., 2008) obtained from a registration of the FA template (FMRIB58_FA_1 mm supplied with FSL) onto the individual FA map. Figure 1 illustrates the defined PFC areas applied in this study. The amygdala regions were obtained by registration of the combined population maps of the amygdala parcellation (Solano-Castiella et al., 2010) to each individual FA map, and they were thresholded at a value of 3. The average volumes of the left and right amygdala were 1478 and 1586 mm3, respectively.
Figure 1.

A, Illustration of the manually created atlas applied in this study. B, Axial slice of one subject with one exemplary probabilistic track that connects the amygdala with the prefrontal cortex. Voxels selected for the analysis (red) are located within the probabilistic track (green) and the individual skeleton and have FA values higher than 0.4.
Analysis of white matter microstructure
Probabilistic tractography based on the ball-and-stick model (Behrens et al., 2007) that is implemented in the FSL software package was used to create the connectivity maps between amygdala and the PFC regions. These connectivity maps indicate for every voxel by how many probabilistic tracks it has been crossed. One thousand tracks were started in every voxel of the amygdala, but only those that reached one of the prefrontal regions were considered. Starting a fixed number of tracks in every voxel of the amygdala masks leads to a different number of probabilistic tracks in every subject, because of different sizes of individual amygdalae. To compensate for this effect, all voxel values in the connectivity maps were normalized by dividing them by the volume of the individual amygdala. Tracks were only seeded in the amygdala and not in the PFC regions, as pilot testing revealed that only a very small fraction of the tracks seeded in the PFC areas reached the amygdala so that the statistical power of this testing was not sufficient.
To evaluate differences in white matter coherence along the connecting pathways, values of FA were compared between the groups. This was achieved by a region-based analysis method (Snook et al., 2007; Faria et al., 2010) that considered only voxels on the center line of the white matter within the pathways defined by the connectivity maps. The central line was defined by computing the skeleton of each individual's FA map as implemented in the tract-based spatial statistics software package (TBSS, http://fsl.fmrib.ox.ac.uk/fsl/fslwiki/TBSS; Smith et al., 2006), taking into account only voxels with an FA value higher than 0.4 (Fig. 1B, green). To define the target-specific ROI, the connectivity maps were thresholded at a specific level for every target region. These levels were computed separately by averaging the 90% quantiles of all individual normalized connectivity maps. The FA values on the skeleton within this mask were averaged.
Amygdala–prefrontal pathways
The individual connectivity maps for each prefrontal connection were normalized with the transformation obtained from the atlas registration, averaged across participants, and thresholded at the target-specific level. The anatomical locations of the fiber pathways were evaluated based on the anatomical slices and a 3D volume rendering using the LIPSIA software (Lohmann et al., 2001).
Statistical analysis
To test the influence of trait anxiety and reappraisal use on the pathway strength between amygdala (seed) and PFC regions (targets), multiple hierarchical regressions were calculated individually for both hemispheres, with the factors trait anxiety (high trait anxiety vs low trait anxiety, dummy coded), the individual reappraisal use score, and the individual IQ score. The factor IQ was added to check the specificity of the resultant pathways for emotion-related characteristics. There is evidence for a positive correlation between FA and IQ (Schmithorst et al., 2005). If the delineated microstructure is emotion specific, IQ should not explain additional variance.
The FA values on the calculated pathways between seed and targets (dmPFC, dlPFC, vmPFC, and OFC, respectively) served as dependent variables. Note that because of a priori knowledge of asymmetric hemispheric processing, we calculated hierarchical regressions and set up different hierarchies for both hemispheres. In the left hemisphere, the factor reappraisal use was expected to explain most of the variance and thus was the first variable to enter the regression, followed by the factor trait anxiety and IQ as a third factor. To underline the hypothesis-driven approach, we also tested the model where trait anxiety was the first factor. Based on the literature, we expected no effects. In the right hemisphere, we expected the factor trait anxiety to explain most of the variance. Hence, trait anxiety was the first to enter this regression, followed by reappraisal use and, finally, IQ. As above, we also tested the alternative model with reappraisal use as the first factor.
Results
After an anatomical description of the fiber pathway connections between seed and target regions, the results of the statistical analyses of the FA values of these pathways will be reported.
Figure 2 shows the calculated pathways between the amygdala and the four target regions of the prefrontal cortex: the OFC, the vmPFC, the dmPFC, and the dlPFC, (see Table 1 for FA means separated by group). The calculated pathways of both hemispheres did not show qualitative differences, so that the connections are exemplarily shown in the right hemisphere. The ventral PFC regions (Fig. 2A,B) are connected with the amygdala via a direct ventral pathway following the uncinated fascicle. Additionally, a strong indirect limbic connection was found. This pathway followed the fornix and the temporopulvinar tract to the posterior thalamic nuclei, continuing through the anterior thalamic radiation to the frontal lobe. The latter connection was also observed for the dorsal PFC regions (Fig. 2C,D). The dorsal regions and the vmPFC also showed a connection with the amygdala via the cingulum.
Figure 2.
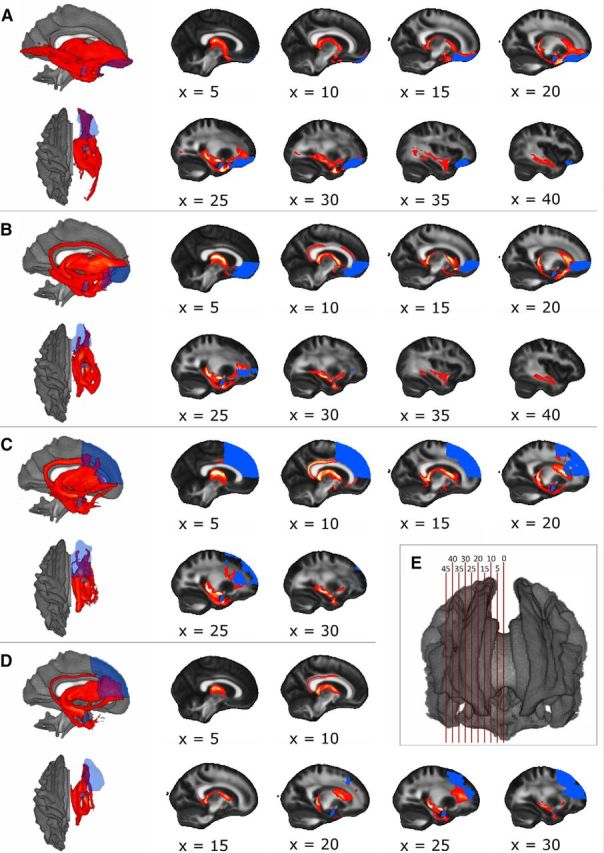
A–D, Left, Three-dimensional sagittal and superior views of tracts between amygdala and PFC regions: A, orbitofrontal cortex; B, ventromedial PFC; C, dorsomedial PFC; D, dorsolateral PFC. Renderings show the normalized number of tracts through each voxel (red). Seed and target regions are displayed in blue. For normalization, each voxel was divided by the amygdala's size. E, Slices illustrating the tracts' localization from medial to lateral. The distance between slices is 5 mm.
Multiple hierarchical regressions
There are correlations between use of reappraisal and trait anxiety (r = −0.377; p = 0.008), but both of these variables did not correlate with IQ (reappraisal: r = −0.130, p = 0.379; trait anxiety: r = −0.182, p = 0.216; all Pearson correlations). The intercorrelations between trait anxiety and “reappraisal use” stress the use of methods that take this intercorrelation into account, such as regression analysis.
The results of the multiple hierarchical regression analyses with factor trait anxiety group as the first predictor (right hemisphere) will be reported first, followed by the results of the multiple hierarchical regression analyses with the factor reappraisal use as the first predictor (left hemisphere).
The factor trait anxiety group (high trait anxiety vs low trait anxiety) significantly predicted the FA values on the white matter microstructure between the amygdala and the vmPFC (r = 0.350, df = 47, F = 6.441, T = −2.538, p = 0.015) and between the amygdala and the OFC (r = 0.395, df = 47, F = 8.520, T = −2.919, p = 0.005), both in the right hemisphere (see Table 2 for a list of all statistical parameters for all multiple hierarchical regressions). The FA values on the right-hemispheric white matter microstructure between the amygdala and the dmPFC (r = 0.215, df = 47, F = 2.240, T = −1,497, p = 0.141) or the dlPFC (r = 0.209, df = 47, F = 2.097, T = −1,448, p = 0.154) could not significantly be predicted. In line with our hypotheses, the factor reappraisal did not explain additional variance in this hemisphere (vmPFC: r = 0.377, df = 47, F = 3.731, T = 1.009, p = 0.318; OFC: r = 0.397, df = 47, F = 4.209, T = −0.266, p = 0.792; dmPFC: r = 0.242, df = 47, F = 1.405, T = 0.769, p = 0.446; dlPFC: r = 0.252, df = 47, F = 1.530, T = 0.982, p = 0.331) and IQ (vmPFC: r = 0.429, df = 47, F = 3.308, T = −1.502, p = 0.140; OFC: r = 0.408, df = 47, F = 2.923, T = 0.674, p = 0.504; dmPFC: r = 0.247, df = 47, F = 0.953, T = −0.322, p = 0.749; dlPFC: r = 0.253, df = 47, F = 1.005, T = −0.148, p = 0.883). As expected, the alternative model with reappraisal as first factor did not become significant in any of the four (right-hemispheric) analyses.
Table 2.
Significant relationships between trait anxiety, reappraisal use, IQ, and fractional anisotropy values of pathway microstructure between amygdala and prefrontal cortex regions
| ROI | Model | R2 | Cor. R2 | F | TA β | R β | IQ β |
|---|---|---|---|---|---|---|---|
| Right dmPFC | TA | 0.05 | 0.03 | 2.24 | −0.22 | ||
| TA, R | 0.06 | 0.02 | 1.41 | −0.17 | 0.12 | ||
| TA, R, IQ | 0.06 | −0.00 | 0.95 | −0.18 | 0.12 | −0.05 | |
| R | 0.03 | 0.01 | 1.56 | 0.18 | |||
| Right dlPFC | TA | 0.04 | 0.02 | 2.10 | −0.21 | ||
| TA, R | 0.06 | 0.02 | 1.53 | −0.16 | 0.15 | ||
| TA, R, IQ | 0.06 | 0.00 | 1.01 | −0.16 | 0.15 | −0.02 | |
| R | 0.04 | 0.02 | 2.06 | 0.21 | |||
| Right vmPFC | TA | 0.12 | 0.10 | 6.44* | −0.35* | ||
| TA, R | 0.14 | 0.10 | 3.73* | −0.30 | 0.15 | ||
| TA, R, IQ | 0.18 | 0.13 | 3.31* | −0.34* | 0.16 | −0.21 | |
| R | 0.07 | 0.05 | 3.21 | 0.26 | |||
| Right OFC | TA | 0.16 | 0.14 | 8.52** | −0.40** | ||
| TA, R | 0.16 | 0.12 | 4.21* | −0.41** | −0.04 | ||
| TA, R, IQ | 0.17 | 0.11 | 2.92* | −0.39* | −0.04 | 0.10 | |
| R | 0.01 | −0.01 | 0.54 | 0.11 | |||
| Left dmPFC | R | 0.09 | 0.07 | 4.74* | 0.31* | ||
| R, TA | 0.11 | 0.07 | 2.69 | −0.12 | 0.26 | ||
| R, TA, IQ | 0.11 | 0.05 | 1.87 | −0.14 | 0.27 | −0.08 | |
| TA | 0.05 | 0.03 | 2.27 | −0.22 | |||
| Left dlPFC | R | 0.11 | 0.09 | 5.85* | 0.34* | ||
| R, TA | 0.14 | 0.10 | 3.73* | −0.18 | 0.27 | ||
| R, TA, IQ | 0.15 | 0.09 | 2.52 | −0.20 | 0.28 | −0.07 | |
| TA | 0.08 | 0.06 | 3.91 | −0.28 | |||
| Left vmPFC | R | 0.11 | 0.09 | 5.65* | 0.33* | ||
| R, TA | 0.13 | 0.09 | 3.36* | −0.15 | 0.28 | ||
| R, TA, IQ | 0.14 | 0.08 | 2.29 | −0.17 | 0.28 | −0.07 | |
| TA | 0.06 | 0.04 | 3.13 | −0.25 | |||
| Left OFC | R | 0.09 | 0.07 | 4.59* | 0.30* | ||
| R, TA | 0.11 | 0.07 | 2.68 | −0.13 | 0.25 | ||
| R, TA, IQ | 0.15 | 0.09 | 2.51 | −0.17 | 0.27 | −0.20 | |
| TA | 0.05 | 0.03 | 2.44 | −0.22 |
Model parameters for each predictor variable for hierarchical regression analyses are shown. Dependent variables are fractional anisotropy values of pathway microstructure between amygdala and prefrontal cortex regions. ROI, Region of interest; TA, trait anxiety; R, reappraisal use.
*p < 0.05;
**p < 0.01.
The factor reappraisal significantly predicted the FA values on the calculated white matter microstructure between the amygdala and all four predefined PFC regions in the left hemisphere (dmPFC: r = 0.306, df = 47, F = 4.741, T = 2.177, p = 0.035; dlPFC: r = 0.336, df = 47, F = 5.854, T = 2.419, p = 0.020; vmPFC: r = 0.331, df = 47, F = 5.652, T = 2.377, p = 0.022; OFC: r = 0.301, df = 47, F = 4.591, T = 2.143, p = 0.037). The addition of the factor anxiety group did not significantly increase the explanation of variance in any of the regions (dmPFC: r = 0.327, df = 47, F = 2.686, T = −0.816, p = 0.419; dlPFC: r = 0.377, df = 47, F = 3.727, T = −1.238, p = 0.222; vmPFC: r = 0.361, df = 47, F = 3.364, T = −1.033 p = 0.307; OFC: r = 0.326, df = 47, F = 2.678, T = −0.887, p = 0.380) or IQ (dmPFC: r = 0.336, df = 47, F = 1.870, T = −0.564, p = 0.576; dlPFC: r = 0.383, df = 47, F = 2.521, T = −0.485, p = 0.630; vmPFC: r = 0.367, df = 47, F = 2.285, T = −0.491, p = 0.626; OFC: r = 0.382, df = 47, F = 2.512, T = −1.433, p = 0.159). As hypothesized, the alternative model with trait anxiety entering as first factor did not reveal any effects.
Discussion
We investigated the microstructural properties of pathway connections between the amygdala and PFC regions deemed relevant for anxiety and emotion regulation. The results provide direct evidence for stronger connectivity between amygdala and vmPFC and OFC of the right hemisphere in persons with low trait anxiety. Emotion regulation was expressed as stronger connectivity between amygdala and vmPFC, OFC, dmPFC, and dlPFC of the left hemisphere in persons with high reappraisal use.
We collected diffusion-weighted images (dMRI) and applied probabilistic tractography to compute all tracks between amygdala and PFC regions individually for both hemispheres. The resulting white matter circuitry included (parts of) the uncinate fasciculus, cingulum, fornix, anterior thalamic radiation, and inferior fronto-occipital fasciculus. Strong connectivity via the uncinate fasciculus was observed for the pathways to vmPFC and OFC, which was neither seen in the pathway network to dlPFC nor to dmPFC. These connections, especially to vmPFC, fit with findings from dMRI studies on humans and animals (Croxson et al., 2005; Carlson et al., 2013; Jbabdi et al., 2013) and with anatomical studies that reported extensive anatomical connections between the amygdala and the PFC. For instance, in rats and monkeys, it was shown that the amygdala is connected to prefrontal cortex by direct amygdalo-cortical projections (Nauta, 1961; Krettek and Price, 1974, 1977a), and indirectly via the thalamus (Nauta, 1962; Krettek and Price, 1974, 1977a,b). In rhesus monkeys, the ventromedial region of PFC receives both direct and indirect tracts stemming from the amygdala, but the dorsolateral PFC does not get such input (Porrino et al., 1981). These findings suggested that the ventromedial region may be regarded as the “limbic portion of the frontal association cortex.” The longer, presumably indirect routes found in our study have not been focused on and rarely have been addressed in human dMRI studies on emotion processing or anxiety. Reviewing the role of the PFC in emotion–cognition interactions, Ray and Zald (2012) emphasized that studies on nonhuman primates reveal large variability concerning direct projections between the amygdalae and regions of the PFC and that direct projections between amygdala and dlPFC are “extremely weak”. It may thus be surprising that we find such strong connections between amygdala and prefrontal regions. However, there is ample evidence for indirect pathways, most notably through the thalamus, in both animals and humans.
Recent research using tractography in humans provided further evidence for strong connections between hippocampus/amygdala and thalamus. The amygdala connects with the anterior thalamus via the fornix and uncinate fasciculus and with the pulvinar via the temporopulvinar tract (Zarei et al., 2010). Similarly, Linke et al. (2012) reported indirect pathways from the amygdala to the OFC, namely via the anterior and posterior thalami. Note that these studies did not specifically target the connection between the amygdala and prefrontal regions.
With multiple hierarchical regressions, we analyzed the relationship of these determined fiber connections with trait anxiety and reappraisal use by means of hypothesis-driven, hemisphere-specific models. Given accumulating evidence for an asymmetric involvement of the PFC, with a right-hemispheric dominance for anxiety and anxiety-related processes (Stewart et al., 1988; Hermann et al., 1992; Hellige, 1993; O'Carroll et al., 1993; Petruzzello and Landers, 1994; Lucey et al., 1995; Stapleton et al., 1997; Bremner et al., 1999; Nitschke et al., 1999; Wiedemann et al., 1999; Davidson et al., 2000; Davidson, 2002; Pizzagalli et al., 2002; Smit et al., 2007, Harmon-Jones et al., 2010), we expected our structural trait anxiety effects to be particularly visible in the right hemisphere. Based on evidence for a left-hemispheric lateralization of reappraisal use (Ochsner et al., 2002; Jackson et al., 2003; Kim and Bell, 2006) and recently observed left-sided biases of metabolic activity in the superior frontal gyrus in frequent reappraisers (Kim et al., 2012), we expected reappraisal use effects to be most prominent in the left hemisphere. We set up the hierarchies of the multiple regression analysis accordingly, with trait anxiety as the first factor in the analyses of the right hemisphere and with reappraisal use as the first factor for the left hemisphere.
The following methodological details are important to consider. First, we chose a hypothesis-based approach, analyzing the microstructure of only those tracts to PFC regions that have consistently been associated with emotion-related processes. Different from prior studies, all tracks, including longer pathways between the two structures, were considered. We calculated the tracts for subsequent FA analysis on our sample, not relying on data from thematically different experimental contexts. This is more conservative than a whole-brain approach, where significant regions are selected, analyzed, and interpreted post hoc. Second, we also adopted the hypothesis-based approach in the statistical analysis. As mentioned above, anxiety and use of reappraisal is related to hemisphere-specific networks. Whereas anxiety is primarily (but not exclusively) related to processes of right-hemispheric amygdala and PFC (Reiman et al., 1984; Heller et al., 1995), emotion regulation is primarily associated with left-hemispheric processing in these structures (Wheeler et al., 1993; Jackson et al., 2003; Kim and Bell, 2006; Kim et al., 2012). This differential hemispheric involvement in different aspects of emotion processing and regulation supports the hypotheses by Davidson and colleagues (Davidson et al., 1987, 1990, 2000; Davidson and Tomarken, 1989; Davidson, 1992, 1995, 2002; Sutton and Davidson, 1997). In low trait-anxious persons, there was no higher FA in pathways to the dorsomedial and the dorsolateral part of the PFC. One reason might be that the amygdalar inhibition by these PFC regions operates via general mechanisms, such as changes in the neurotransmitter system. Such mechanisms might not be reflected in FA values of connecting pathways (Ray and Zald, 2012). An alternative explanation is that our atlas comprised comparably wide boundaries around the dmPFC and the dlPFC. Although this was deliberately done as not to miss potentially important fibers, it could have led to an attenuation of the expected effect.
Some caveats and open questions should be addressed in future studies. First, we probabilistically tracked fiber pathways from amygdala to PFC within each hemisphere, focusing on noncrossing fibers. However, animal studies have shown that a small percentage of connecting fibers between the amygdala and the PFC crosses the corpus callosum (Mascagni et al., 1993; McDonald and Mascagni, 1996). A second caveat concerns the origin of the calculated fibers within the amygdala. We mapped the amygdala in each participant and treated the entire amygdala as seed region. Yet, the amygdala is a heterogeneous structure, with various substructures and nuclei (Sah et al., 2003), each with different functions and connections with different areas in the brain. It is thus a challenge for future DTI studies to differentiate connections between amygdala substructures and regions of the PFC. Third, because women are especially prone to develop anxiety disorders (see Somers et al., 2006) and to avoid additional variance attributable to existing brain-activation differences between men and women (Gong et al., 2011), we included only female persons. Studies revealed the sexually dimorphic nature of the cortex, limbic structures, and connecting fibers and how such sex differences might impact the development of affective disorders (for review, see Cahill, 2006). Zuurbier et al. (2013) observed correlations between reappraisal and FA values in the left frontal part of uncinate fasciculus in women, but not in men. Thus, it is likely that at least some of the connections between amygdala and PFC reported here cannot easily be transferred to men.
Although our results have to be interpreted within the constraints of the above-mentioned limitations, we believe that our data make an important contribution to the understanding of the neuroanatomical basis of anxiety and emotion regulation. Our findings provide strong support for theories of and (fMRI) studies on top-down inhibition, by offering a structural network that might underlie the so far mostly theoretically, behaviorally, and functionally argued/established network.
Our data show that different structural networks are responsible for trait anxiety and reappraisal use. Neural models on the generation and regulation of emotions stress the importance of the interplay between automatic and voluntary processes (e.g., use of reappraisal; Ochsner and Gross, 2007; Phillips et al., 2008) and emphasize the role of the amygdala and PFC regions (particularly OFC) for this interplay. The attempt to study voluntary and automatic processes in separation may seem futile (Phillips et al., 2008), especially in therapeutic settings. Nevertheless, we identified a hemispherically specialized functional architecture involved in the mediation of anxiety and reappraisal use, with stronger connectivity between amygdala, OFC, and vmPFC in each hemisphere. Given the correlational nature of these data, we cannot make claims about the development of the relationship. It is a challenge for future research to investigate how manipulating one of these processes [e.g., using the anxiolytic effects of noninvasive brain stimulation (Zwanzger et al., 2009)] impacts on the other, especially on the microstructure involved. Such investigations might help to develop new strategies for the treatment of anxiety disorders and to identify persons at risk.
Footnotes
This work was supported by the Interdisciplinary Center for Clinical Research (Grant Do3/021/10).
The authors declare no competing financial interests.
References
- Ackenheil M, Stotz G, Dietz-Bauer R, Vossen A. Deutsche Fassung des Mini-International Neuropsychiatric Interview. München: Psychiatrische Universitätsklinik München; 1999. [Google Scholar]
- Avants BB, Epstein CL, Grossman M, Gee JC. Symmetric diffeomorphic image registration with cross-correlation: evaluating automated labeling of elderly and neurodegenerative brain. Med Image Anal. 2008;12:26–41. doi: 10.1016/j.media.2007.06.004. [DOI] [PMC free article] [PubMed] [Google Scholar]
- Barbas H, Zikopoulos B. Sequential and parallel circuits for emotional processing in primate orbitofrontal cortex. In: Zald DH, Rauch SL, editors. The orbitofrontal cortex. Oxford: Oxford UP; 2006. pp. 57–91. [Google Scholar]
- Basser PJ, Pierpaoli C. Microstructural and physiological features of tissues elucidated by quantitative-diffusion-tensor MRI. J Magn Reson. 1996;111:209–219. doi: 10.1006/jmrb.1996.0086. [DOI] [PubMed] [Google Scholar]
- Baur V, Hänggi J, Langer N, Jäncke L. Resting-state functional and structural connectivity within an insula–amygdala route specifically index state and trait anxiety. Biol Psychiatry. 2013a;73:85–92. doi: 10.1016/j.biopsych.2012.06.003. [DOI] [PubMed] [Google Scholar]
- Baur V, Brühl AB, Herwig U, Eberle T, Rufer M, Delsignore A, Jäncke L, Hänggi J. Evidence of frontotemporal structural hypoconnectivity in social anxiety disorder: a quantitative fiber tractography study. Hum Brain Mapp. 2013b;34:437–446. doi: 10.1002/hbm.21447. [DOI] [PMC free article] [PubMed] [Google Scholar]
- Behrens TE, Berg HJ, Jbabdi S, Rushworth MF, Woolrich MW. Probabilistic diffusion tractography with multiple fibre orientations: what can we gain? Neuroimage. 2007;34:144–155. doi: 10.1016/j.neuroimage.2006.09.018. [DOI] [PMC free article] [PubMed] [Google Scholar]
- Bishop SJ. Neurocognitive mechanisms of anxiety: an integrative account. Trends Cogn Sci. 2007;11:307–316. doi: 10.1016/j.tics.2007.05.008. [DOI] [PubMed] [Google Scholar]
- Bremner JD, Staib LH, Kaloupek D, Southwick SM, Soufer R, Charney DS. Neural correlates of exposure to traumatic pictures and sound in combat veterans with and without posttraumatic stress disorder: a positron emission tomography study. Biol Psychiatry. 1999;45:806–816. doi: 10.1016/S0006-3223(98)00297-2. [DOI] [PMC free article] [PubMed] [Google Scholar]
- Buckholtz JW, Callicott JH, Kolachana B, Hariri AR, Goldberg TE, Genderson M, Egan MF, Mattay VS, Weinberger DR, Meyer-Lindenberg A. Genetic variation in MAOA modulates ventromedial prefrontal circuitry mediating individual differences in human personality. Mol Psychiatry. 2008;13:313–324. doi: 10.1038/sj.mp.4002020. [DOI] [PubMed] [Google Scholar]
- Cahill L. Why sex matters for neuroscience. Nat Rev Neurosci. 2006;7:477–484. doi: 10.1038/nrn1909. [DOI] [PubMed] [Google Scholar]
- Carlson JM, Cha J, Harmon-Jones E, Mujica-Parodi LR, Hajcak G. Influence of the BDNF genotype on amygdalo-prefrontal white matter microstructure is linked to nonconscious attention bias to threat. Cereb Cortex. 2013;24:2249–2257. doi: 10.1093/cercor/bht089. [DOI] [PubMed] [Google Scholar]
- Croxson PL, Johansen-Berg H, Behrens TE, Robson MD, Pinsk MA, Gross CG, Richter W, Richter MC, Kastner S, Rushworth MF. Quantitative investigation of connections of the prefrontal cortex in the human and macaque using probabilistic diffusion tractography. J Neurosci. 2005;25:8854–8866. doi: 10.1523/JNEUROSCI.1311-05.2005. [DOI] [PMC free article] [PubMed] [Google Scholar]
- Davidson RJ. Anterior cerebral asymmetry and the nature of emotion. Brain Cogn. 1992;20:125–151. doi: 10.1016/0278-2626(92)90065-T. [DOI] [PubMed] [Google Scholar]
- Davidson RJ. Cerebral asymmetry, emotion and affective style. In: Davidson RJ, Hugdahl K, editors. Brain asymmetry. Cambridge, MA: MIT; 1995. pp. 361–387. [Google Scholar]
- Davidson RJ. Anxiety and affective style: role of prefrontal cortex and amygdala. Biol Psychiatry. 2002;51:68–80. doi: 10.1016/S0006-3223(01)01328-2. [DOI] [PubMed] [Google Scholar]
- Davidson RJ, Tomarken AJ. Laterality and emotion: an electrophysiological approach. Handb Neuropsychol. 1989;3:419–441. [Google Scholar]
- Davidson RJ, Mednick D, Moss E, Saron C, Schaffer CE. Ratings of emotion in faces are influenced by the visual field to which stimuli are presented. Brain Cogn. 1987;6:403–411. doi: 10.1016/0278-2626(87)90136-9. [DOI] [PubMed] [Google Scholar]
- Davidson RJ, Ekman P, Saron CD, Senulis JA, Friesen WV. Approach-withdrawal and cerebral asymmetry: emotional expression and brain physiology: I. J Pers Soc Psychol. 1990;58:330–341. doi: 10.1037/0022-3514.58.2.330. [DOI] [PubMed] [Google Scholar]
- Davidson RJ, Jackson DC, Kalin NH. Emotion, plasticity, context, and regulation: perspectives from affective neuroscience. Psychol Bull. 2000;126:890–909. doi: 10.1037/0033-2909.126.6.890. [DOI] [PubMed] [Google Scholar]
- Faria AV, Zhang J, Oishi K, Li X, Jiang H, Akhter K, Hermoye L, Lee SK, Hoon A, Stashinko E, Miller MI, van Zijl PC, Mori S. Atlas-based analysis of neurodevelopment from infancy to adulthood using diffusion tensor imaging and applications for automated abnormality detection. Neuroimage. 2010;52:415–428. doi: 10.1016/j.neuroimage.2010.04.238. [DOI] [PMC free article] [PubMed] [Google Scholar]
- Gong G, He Y, Evans AC. Brain connectivity gender makes a difference. Neuroscientist. 2011;17:575–591. doi: 10.1177/1073858410386492. [DOI] [PubMed] [Google Scholar]
- Gross JJ, John OP. Individual differences in two emotion regulation processes: implications for affect, relationships, and well-being. J Pers Soc Psychol. 2003;85:348–362. doi: 10.1037/0022-3514.85.2.348. [DOI] [PubMed] [Google Scholar]
- Harmon-Jones E, Gable PA, Peterson CK. The role of asymmetric frontal cortical activity in emotion-related phenomena: a review and update. Biol Psychol. 2010;84:451–462. doi: 10.1016/j.biopsycho.2009.08.010. [DOI] [PubMed] [Google Scholar]
- Heller W, Etienne MA, Miller GA. Patterns of perceptual asymmetry in depression and anxiety: implications for neuropsychological models of emotion and psychopathology. J Abnorm Psychol. 1995;104:327–333. doi: 10.1037/0021-843X.104.2.327. [DOI] [PubMed] [Google Scholar]
- Hellige JB. Hemispheric asymmetry: what's right and what's left. Cambridge, MA: Harvard UP; 1993. [Google Scholar]
- Hermann BP, Wyler AR, Blumer D, Richey ET. Ictal fear: lateralizing significance and implications for understanding the neurobiology of pathological fear states. Neuropsychiatry Neuropsychol Behav Neurol. 1992;5:205–210. [Google Scholar]
- Jackson DC, Mueller CJ, Dolski I, Dalton KM, Nitschke JB, Urry HL, Rosenkranz MA, Ryff CD, Singer BH, Davidson RJ. Now you feel it, now you don't: frontal brain electrical asymmetry and individual differences in emotion regulation. Psychol Sci. 2003;14:612–617. doi: 10.1046/j.0956-7976.2003.psci_1473.x. [DOI] [PubMed] [Google Scholar]
- Jbabdi S, Lehman JF, Haber SN, Behrens TE. Human and monkey ventral prefrontal fibers use the same organizational principles to reach their targets: tracing versus tractography. J Neurosci. 2013;33:3190–3201. doi: 10.1523/JNEUROSCI.2457-12.2013. [DOI] [PMC free article] [PubMed] [Google Scholar]
- Jenkinson M, Beckmann CF, Behrens TE, Woolrich MW, Smith SM. FSL. Neuroimage. 2012;62:782–790. doi: 10.1016/j.neuroimage.2011.09.015. [DOI] [PubMed] [Google Scholar]
- Kim KJ, Bell MA. Frontal EEG asymmetry and regulation during childhood. Ann N Y Acad Sci. 2006;1094:308–312. doi: 10.1196/annals.1376.040. [DOI] [PubMed] [Google Scholar]
- Kim MJ, Whalen PJ. The structural integrity of an amygdala–prefrontal pathway predicts trait anxiety. J Neurosci. 2009;29:11614–11618. doi: 10.1523/JNEUROSCI.2335-09.2009. [DOI] [PMC free article] [PubMed] [Google Scholar]
- Kim MJ, Gee DG, Loucks RA, Davis FC, Whalen PJ. Anxiety dissociates dorsal and ventral medial prefrontal cortex functional connectivity with the amygdala at rest. Cereb Cortex. 2010;21:1667–1673. doi: 10.1093/cercor/bhq237. [DOI] [PMC free article] [PubMed] [Google Scholar]
- Kim SH, Hamann S. Neural correlates of positive and negative emotion regulation. J Cogn Neurosci. 2007;19:776–798. doi: 10.1162/jocn.2007.19.5.776. [DOI] [PubMed] [Google Scholar]
- Kim SH, Cornwell B, Kim SE. Individual differences in emotion regulation and hemispheric metabolic asymmetry. Biol Psychol. 2012;89:382–386. doi: 10.1016/j.biopsycho.2011.11.013. [DOI] [PubMed] [Google Scholar]
- Krettek JE, Price JL. A direct input from the amygdala to the thalamus and the cerebral cortex. Brain Res. 1974;67:169–174. doi: 10.1016/0006-8993(74)90309-6. [DOI] [PubMed] [Google Scholar]
- Krettek JE, Price JL. The cortical projections of the mediodorsal nucleus and adjacent thalamic nuclei in the rat. J Comp Neurol: 1977a;171:157–191. doi: 10.1002/cne.901710204. [DOI] [PubMed] [Google Scholar]
- Krettek JE, Price JL. Projections from the amygdaloid complex to the cerebral cortex and thalamus in the rat and cat. J Comp Neurol. 1977b;172:687–722. doi: 10.1002/cne.901720408. [DOI] [PubMed] [Google Scholar]
- Linke J, Witt SH, King AV, Nieratschker V, Poupon C, Gass A, Hennerici MG, Rietschel M, Wessa M. Genome-wide supported risk variant for bipolar disorder alters anatomical connectivity in the human brain. Neuroimage, 2012;59:3288–3296. doi: 10.1016/j.neuroimage.2011.10.083. [DOI] [PubMed] [Google Scholar]
- Lohmann G, Mueller K, Bosch V, Mentzel H, Hessler S, Chen L, Zysset S, von Cramon DY. Lipsia–a new software system for the evaluation of functional magnetic resonance images of the human brain. Comput Med Imaging Graph. 2001;25:449–457. doi: 10.1016/S0895-6111(01)00008-8. [DOI] [PubMed] [Google Scholar]
- Lucey JV, Costa DC, Blanes T, Busatto GF, Pilowsky LS, Takei N, Marks IM, Ell PJ, Kerwin RW. Regional cerebral blood flow in obsessive-compulsive disordered patients at rest. Differential correlates with obsessive-compulsive and anxious-avoidant dimensions. Br J Psychiatry. 1995;167:629–634. doi: 10.1192/bjp.167.5.629. [DOI] [PubMed] [Google Scholar]
- Mascagni F, McDonald AJ, Coleman JR. Corticoamygdaloid and corticocortical projections of the rat temporal cortex: a Phaseolus vulgaris leucoagglutinin study. Neuroscience. 1993;57:697–715. doi: 10.1016/0306-4522(93)90016-9. [DOI] [PubMed] [Google Scholar]
- McDonald AJ, Mascagni F. Cortico-cortical and cortico-amygdaloid projections of the rat occipital cortex: a Phaseolus vulgaris leucoagglutinin study. Neuroscience. 1996;71:37–54. doi: 10.1016/0306-4522(95)00416-5. [DOI] [PubMed] [Google Scholar]
- Modi S, Trivedi R, Singh K, Kumar P, Rathore RK, Tripathi RP, Khushu S. Individual differences in trait anxiety are associated with white matter tract integrity in fornix and uncinate fasciculus: preliminary evidence from a DTI based tractography study. Behav Brain Res. 2013;238:188–192. doi: 10.1016/j.bbr.2012.10.007. [DOI] [PubMed] [Google Scholar]
- Nauta WJ. Fibre degeneration following lesions of the amygdaloid complex in the monkey. J Anat. 1961;95:515–531. [PMC free article] [PubMed] [Google Scholar]
- Nauta WJ. Neural associations of the amygdaloid complex in the monkey. Brain. 1962;85:505–520. doi: 10.1093/brain/85.3.505. [DOI] [PubMed] [Google Scholar]
- Nitschke JB, Heller W, Palmieri PA, Miller GA. Contrasting patterns of brain activity in anxious apprehension and anxious arousal. Psychophysiology. 1999;36:628–637. doi: 10.1111/1469-8986.3650628. [DOI] [PubMed] [Google Scholar]
- O'Carroll RE, Moffoot AP, Van Beck M, Dougall N, Murray C, Ebmeier KP, Goodwin GM. The effect of anxiety induction on the regional uptake of 99mTc-Exametazime in simple phobia as shown by single photon emission tomography (SPET) J Affect Disord. 1993;28:203–210. doi: 10.1016/0165-0327(93)90106-T. [DOI] [PubMed] [Google Scholar]
- Ochsner KN, Gross JJ. The neural architecture of emotion regulation. Handbook Emot Regul. 2007;1:87–109. [Google Scholar]
- Ochsner KN, Bunge SA, Gross JJ, Gabrieli JDE. Rethinking feelings: an FMRI study of the cognitive regulation of emotion. J Neurosci. 2002;14:1215–1229. doi: 10.1162/089892902760807212. [DOI] [PubMed] [Google Scholar]
- Ochsner KN, Ray RD, Cooper JC, Robertson ER, Chopra S, Gabrieli JD, Gross JJ. For better or for worse: neural systems supporting the cognitive down- and up-regulation of negative emotion. Neuroimage. 2004;23:483–499. doi: 10.1016/j.neuroimage.2004.06.030. [DOI] [PubMed] [Google Scholar]
- Oishi K, Faria A, Jiang H, Li X, Akhter K, Zhang J, Hsu JT, Miller MI, van Zijl PC, Albert M, Lyketsos CG, Woods R, Toga AW, Pike GB, Rosa-Neto P, Evans A, Mazziotta J, Mori S. Atlas-based whole brain white matter analysis using large deformation diffeomorphic metric mapping: application to normal elderly and Alzheimer's disease participants. Neuroimage. 2009;46:486–499. doi: 10.1016/j.neuroimage.2009.01.002. [DOI] [PMC free article] [PubMed] [Google Scholar]
- Oldfield RC. The assessment and analysis of handedness: The Edinburgh inventory. Neuropsychologia. 1971;9:97–113. doi: 10.1016/0028-3932(71)90067-4. [DOI] [PubMed] [Google Scholar]
- Petrides M, Mackey S. The orbitofrontal cortex: sulcal and gyral morphology and architecture. In: Zald DH, Rauch SL, editors. The orbitofrontal cortex. Oxford: Oxford UP; 2006. pp. 19–37. [Google Scholar]
- Petruzzello SJ, Landers DM. State anxiety reduction and exercise: does hemispheric activation reflect such changes? Med Sci Sports Exer. 1994;26:1028–1035. [PubMed] [Google Scholar]
- Pezawas L, Meyer-Lindenberg A, Drabant EM, Verchinski BA, Munoz KE, Kolachana BS, Egan MF, Mattay VS, Hariri AR, Weinberger DR. 5-HTTLPR polymorphism impacts human cingulate-amygdala interactions: a genetic susceptibility mechanism for depression. Nat Neurosci. 2005;8:828–834. doi: 10.1038/nn1463. [DOI] [PubMed] [Google Scholar]
- Phillips ML, Ladouceur CD, Drevets WC. A neural model of voluntary and automatic emotion regulation: implications for understanding the pathophysiology and neurodevelopment of bipolar disorder. Mol Psychiatry. 2008;13:833–857. doi: 10.1038/mp.2008.65. [DOI] [PMC free article] [PubMed] [Google Scholar]
- Pizzagalli DA, Nitschke JB, Oakes TR, Hendrick AM, Horras KA, Larson CL, Abercrombie HC, Schaefer SM, Koger JV, Benca RM, Pascual-Marqui RD, Davidson RJ. Brain electrical tomography in depression: the importance of symptom severity, anxiety and melancholic features. Biol Psychiatry. 2002;52:73–85. doi: 10.1016/S0006-3223(02)01313-6. [DOI] [PubMed] [Google Scholar]
- Porrino LJ, Crane AM, Goldman-Rakic PS. Direct and indirect pathways from the amygdala to the frontal lobe in rhesus monkeys. J Comp Neurol. 1981;198:121–136. doi: 10.1002/cne.901980111. [DOI] [PubMed] [Google Scholar]
- Rauch SL, Savage CR, Alpert NM, Fischman AJ, Jenike MA. The functional neuroanatomy of anxiety: a study of three disorders using positron emission tomography and symptom provocation. Biol Psychiatry. 1997;42:446–452. doi: 10.1016/S0006-3223(97)00145-5. [DOI] [PubMed] [Google Scholar]
- Ray RD, Zald DH. Anatomical insights into the interaction of emotion and cognition in the prefrontal cortex. Neurosci Biobehav Rev. 2012;36:479–501. doi: 10.1016/j.neubiorev.2011.08.005. [DOI] [PMC free article] [PubMed] [Google Scholar]
- Reiman EM, Raichle ME, Butler FK, Herscovitch P, Robins E. A focal brain abnormality in panic disorder, a severe form of anxiety. Nature. 1984;310:683–685. doi: 10.1038/310683a0. [DOI] [PubMed] [Google Scholar]
- Roy M, Shohamy D, Wager TD. Ventromedial prefrontal-subcortical systems and the generation of affective meaning. Trends Cogn Sci. 2012;16:147–156. doi: 10.1016/j.tics.2012.01.005. [DOI] [PMC free article] [PubMed] [Google Scholar]
- Sah P, Faber ES, Lopez De Armentia M, Power J. The amygdaloid complex: anatomy and physiology. Physiol Rev. 2003;83:803–834. doi: 10.1152/physrev.00002.2003. [DOI] [PubMed] [Google Scholar]
- Schmithorst VJ, Wilke M, Dardzinski BJ, Holland SK. Cognitive functions correlate with white matter architecture in a normal pediatric population: a diffusion tensor MRI study. Hum Brain Mapp. 2005;26:139–147. doi: 10.1002/hbm.20149. [DOI] [PMC free article] [PubMed] [Google Scholar]
- Sladky R, Höflich A, Atanelov J, Kraus C, Baldinger P, Moser E, Lanzenberger R, Windischberger C. Increased neural habituation in the amygdala and orbitofrontal cortex in social anxiety disorder revealed by fMRI. PLoS One. 2012;7:e50050. doi: 10.1371/journal.pone.0050050. [DOI] [PMC free article] [PubMed] [Google Scholar]
- Smit DJ, Posthuma D, Boomsma DI, De Geus EJ. The relation between frontal EEG asymmetry and the risk for anxiety and depression. Biol Psychol. 2007;74:26–33. doi: 10.1016/j.biopsycho.2006.06.002. [DOI] [PubMed] [Google Scholar]
- Smith SM, Jenkinson M, Woolrich MW, Beckmann CF, Behrens TE, Johansen-Berg H, Bannister PR, Luca M de, Drobnjak I, Flitney DE, Niazy RK, Saunders J, Vickers J, Zhang Y, Stefano N de, Brady JM, Matthews PM. Advances in functional and structural MR image analysis and implementation as FSL. Neuroimage. 2004;23(Suppl 1):S208–S219. doi: 10.1016/j.neuroimage.2004.07.051. [DOI] [PubMed] [Google Scholar]
- Smith SM, Jenkinson M, Johansen-Berg H, Rueckert D, Nichols TE, Mackay CE, Watkins KE, Ciccarelli O, Cader MZ, Matthews PM, Behrens TE. Tract-based spatial statistics: voxelwise analysis of multi-subject diffusion data. Neuroimage. 2006;31:1487–1505. doi: 10.1016/j.neuroimage.2006.02.024. [DOI] [PubMed] [Google Scholar]
- Snook L, Plewes C, Beaulieu C. Voxel based versus region of interest analysis in diffusion tensor imaging of neurodevelopment. Neuroimage. 2007;34:243–252. doi: 10.1016/j.neuroimage.2006.07.021. [DOI] [PubMed] [Google Scholar]
- Solano-Castiella E, Anwander A, Lohmann G, Weiss M, Docherty C, Geyer S, Reimer E, Friederici AD, Turner R. Diffusion tensor imaging segments the human amygdala in vivo. Neuroimage, 2010;49:2958–2965. doi: 10.1016/j.neuroimage.2009.11.027. [DOI] [PubMed] [Google Scholar]
- Somers JM, Goldner EM, Waraich P, Hsu L. Prevalence and incidence studies of anxiety disorders: a systematic review of the literature. Can J Psychiatry. 2006;51:100–113. doi: 10.1177/070674370605100206. [DOI] [PubMed] [Google Scholar]
- Spielberger CD, Jacobs G, Russell S, Crane RS. Assessment of anger: the State-Trait Anger Scale. In: Butcher JN, Spielberger CD, editors. Advances in personality assessment. Vol 2. Mahwah, NJ: Lawrence Erlbaum Associates; 1983. pp. 161–185. [Google Scholar]
- Stapleton JM, Morgan MJ, Liu X, Yung BC, Phillips RL, Wong DF, Shaya EK, Dannals RF, London ED. Cerebral glucose utilization is reduced in second test session. J Cereb Blood Flow Metab. 1997;17:704–712. doi: 10.1097/00004647-199706000-00012. [DOI] [PubMed] [Google Scholar]
- Stein MB, Simmons AN, Feinstein JS, Paulus MP. Increased amygdala and insula activation during emotion processing in anxiety-prone subjects. Am J Psychiatry. 2007;164:318–327. doi: 10.1176/appi.ajp.164.2.318. [DOI] [PubMed] [Google Scholar]
- Stewart RS, Devous MD, Sr, Rush AJ, Lane L, Bonte FJ. Cerebral blood flow changes during sodium-lactate-induced panic attacks. Am J Psychiatry. 1988;145:442–449. doi: 10.1176/ajp.145.4.442. [DOI] [PubMed] [Google Scholar]
- Sutton SK, Davidson RJ. Prefrontal brain asymmetry: a biological substrate of the behavioral approach and inhibition systems. Psychol Sci. 1997;8:204–210. doi: 10.1111/j.1467-9280.1997.tb00413.x. [DOI] [Google Scholar]
- Von Aster M, Neubauer A, Horn R. Deutschsprachige Bearbeitung und Adaptation des WAIS-III von David Wechsler. Frankfurt/Main, Germany: Harcourt Test Services; 2006. Wechsler Intelligenztest für Erwachsene (WIE) [Google Scholar]
- Wheeler RE, Davidson RJ, Tomarken AJ. Frontal brain asymmetry and emotional reactivity: a biological substrate of affective style. Psychophysiology. 1993;30:82–89. doi: 10.1111/j.1469-8986.1993.tb03207.x. [DOI] [PubMed] [Google Scholar]
- Wiedemann G, Pauli P, Dengler W, Lutzenberger W, Birbaumer N, Buchkremer G. Frontal brain asymmetry as a biological substrate of emotions in patients with panic disorders. Arch Gen Psychiatry. 1999;56:78–84. doi: 10.1001/archpsyc.56.1.78. [DOI] [PubMed] [Google Scholar]
- Woolrich MW, Jbabdi S, Patenaude B, Chappell M, Makni S, Behrens T, Beckmann C, Jenkinson M, Smith SM. Bayesian analysis of neuroimaging data in FSL. Neuroimage. 2009;45:S173–S186. doi: 10.1016/j.neuroimage.2008.10.055. [DOI] [PubMed] [Google Scholar]
- Zald DH, Kim SW. Anatomy and function of the orbital frontal cortex: I. Anatomy, neurocircuitry, and obsessive-compulsive disorder. J Neuropsychiatry Clin Neurosci. 1996a;8:125–138. doi: 10.1176/jnp.8.2.125. [DOI] [PubMed] [Google Scholar]
- Zald DH, Kim SW. Anatomy and function of the orbital frontal cortex, II: Function and relevance to obsessive-compulsive disorder. J Neuropsychiatry Clin Neurosci. 1996b;8:249–261. doi: 10.1176/jnp.8.3.249. [DOI] [PubMed] [Google Scholar]
- Zarei M, Patenaude B, Damoiseaux J, Morgese C, Smith S, Matthews PM, Barkhof F, Rombouts SA, Sanz-Arigita E, Jenkinson M. Combining shape and connectivity analysis: an MRI study of thalamic degeneration in Alzheimer's disease. Neuroimage. 2010;49:1–8. doi: 10.1016/j.neuroimage.2009.09.001. [DOI] [PubMed] [Google Scholar]
- Zuurbier LA, Nikolova YS, Åhs F, Hariri AR. Uncinate fasciculus fractional anisotropy correlates with typical use of reappraisal in women but not men. Emotion. 2013;13:385–390. doi: 10.1037/a0031163. [DOI] [PMC free article] [PubMed] [Google Scholar]
- Zwanzger P, Fallgatter AJ, Zavorotnyy M, Padberg F. Anxiolytic effects of transcranial magnetic stimulation—an alternative treatment option in anxiety disorders? J Neural Transm. 2009;116:767–775. doi: 10.1007/s00702-008-0162-0. [DOI] [PubMed] [Google Scholar]