

Abstract
Highly active insects and crabs depend on visual motion information for detecting and tracking mates, prey, or predators, for which they require directional control systems containing internal maps of visual space. A neural map formed by large, motion-sensitive neurons implicated in processing panoramic flow is known to exist in an optic ganglion of the fly. However, an equivalent map for processing spatial positions of single objects has not been hitherto identified in any arthropod. Crabs can escape directly away from a visual threat wherever the stimulus is located in the 360° field of view. When tested in a walking simulator, the crab Neohelice granulata immediately adjusts its running direction after changes in the position of the visual danger stimulus smaller than 1°. Combining mass and single-cell staining with in vivo intracellular recording, we show that a particular class of motion-sensitive neurons of the crab's lobula that project to the midbrain, the monostratified lobula giants type 1 (MLG1), form a system of 16 retinotopically organized elements that map the 360° azimuthal space. The preference of these neurons for horizontally moving objects conforms the visual ecology of the crab's mudflat world. With a mean receptive field of 118°, MLG1s have a large superposition among neighboring elements. Our results suggest that the MLG1 system conveys information on object position as a population vector. Such computational code can enable the accurate directional control observed in the visually guided behaviors of crabs.
Keywords: cell ensemble, crab, escape direction, giant lobula neurons, insect, population coding
Introduction
Recent studies using arthropods as experimental models have provided new insights on the neural mechanisms of visual motion processing and the control of visually guided behaviors (Lindemann and Egelhaaf, 2012; Berón de Astrada et al., 2013; Rosner and Homberg, 2013; Silies et al., 2014). Investigations are performed in association with two distinctive types of visual processing. One is the processing of panoramic optic flow, the retinal motion pattern generated during self-movement (egomotion). Performed mainly in flies, these studies focus on large tangential neurons retinotopically arranged to map the visual space in a neuropil called the lobula plate (Borst, 2014; Trousdale et al., 2014). The other is the processing of a single moving element, the retinal stimulation generated by an external moving object. These studies, performed in different insect and crustacean species, focus on giant projecting neurons of a neuropil called the lobula (Nordström et al., 2006; Dewell and Gabbiani, 2012; Oliva and Tomsic, 2014). However, a neural map capable of conveying the information regarding object spatial positions necessary to control directional behaviors has not been hitherto identified in any arthropod.
In semiterrestrial crabs, the escape response to visual danger stimuli is far from a simple reflex, but a finely tuned, complex behavioral sequence (Hemmi and Tomsic, 2012). For example, in response to an approaching object, the speed of run is continuously adjusted based on incoming information provided by the stimulus motion image (Oliva and Tomsic, 2012). Similarly, the escape direction is modified according to the stimulus position, indicating that there must be a functional map of position in the arthropod brain (Land and Layne, 1995).
Each eye of the crab Neohelice granulata subtends the entire panorama surrounding the animal, with regional specializations consisting of a horizontal band of high vertical acuity in the eye equator and a vertical band of high horizontal acuity in the lateral pole (Berón de Astrada et al., 2012). Beneath the retina lie the lamina, medulla, lobula, and lobula plate, which conform to homologous retinotopic neuropils in insects (Sztarker et al., 2005; Strausfeld, 2009). Visual information is conveyed from one optic neuropil to the next through columnar elements intersected by wide-field tangential neurons. The lobula contains different classes of wide-field tangential neurons highly sensitive to object motion but not to optic flow. Two of these classes, the monostratified lobula giant types 1 and 2 (MLG1 and MLG2; Medan et al., 2007), are thought to play a central role in the visuomotor transformation involved in responses to approaching objects (Oliva et al., 2007; Oliva and Tomsic, 2012, 2014). Although there seems to be only one MLG2 unit per lobula, the MLG1s form an ensemble of multiple units distributed across the lobula retinotopic mosaic (Sztarker et al., 2005). Therefore, the MLG1 ensemble emerges as a suitable candidate to encode and convey information regarding the spatial position of a moving object. Here, we show how the 360° space is mapped by the MLG1 ensemble and discuss how this system may enable crabs to detect and track relevant moving objects.
Materials and Methods
Animals
Animals were adult male N. granulata crabs 2.7–3.0 cm across the carapace, weighing ∼17 g, collected in the rías (narrow coastal inlets) of San Clemente del Tuyú, Argentina. The crabs were maintained in plastic tanks filled to 2 cm depth with artificial seawater prepared using hw-Marinex (Winex), salinity 10–14%, pH 7.4–7.6, and maintained within a range of 22–24°C. The holding and experimental rooms were kept on a 12 h light/dark cycle (lights on 7:00 A.M. to 7:00 P.M.) and the experiments were run between 8:00 A.M. and 7:00 P.M.
Visual stimuli
Computer-generated visual stimuli were projected on four flat screens (17 inches; Philips 107T, refreshing rate 60 Hz) located 20 cm in front of and on either side of or 15.6 cm above the animal. The screen arrangement was housed inside a Faraday cage with opaque covers to prevent outside visual stimuli from reaching the animal. Anti-glare sheets prevented reflections among the screens. All visual stimuli were generated with a single PC using commercial software (Presentation 5.3; Neurobehavioral Systems). To evoke behavioral escape responses, we stimulated the crab with a large black square (12 × 12 cm; retinal subtended angle 34°, radiance 4 mW/m2) moving over a white background (radiance 240 mW/m2) in the right or left screens. The size was chosen based on previous studies showing that smaller sizes of otherwise identical moving squares are less effective at evoking the escape (Scarano and Tomsic, 2014). The stimulus moved horizontally, spanning an arc of 80°. Each stimulus presentation comprised a front to back and back to front translating motion at a speed of 18 cm/s (see Fig. 1A). We used a translating instead of a tangentially moving stimulus because it represents a more natural situation for an external moving object (i.e., tangentially moving objects evoke weak escape responses, likely because single objects are rarely seen moving at the same distance around the observer). The apparent size of a translating object as the one we used is not constant because it first increases until reaching the middle of the screen and then decreases. These stimulus changes modulate the velocity of escape (Scarano and Tomsic, 2014) and possibly the directional sensitivity. However, within the arc of 80° spanned by the stimulus in our experiments, the animal keeps running and therefore changes of the escape direction can be assessed.
Figure 1.

Directionality of the behavioral visual escape response. A, Locomotor activity was studied in a walking simulator that recorded the trajectory of the crab. Activity in the x and y-axis was convolved to obtain the directional vector of the crab's trajectory (αcrab, solid red) in response to back and forth motion of a black square (12 × 12 cm). The computer-generated visual stimulus moved along an horizontal trajectory (between point P1 and P2) covering an arc of 80° in the lateral visual field of the animal (from 50° to 130°, αstim, dashed black) at 18 cm/s (details in Materials and Methods). B, Individual relationship between stimulus direction and crab's escape direction (trajectories back and forth averaged). Example of an individual crab escape direction versus stimulus angle (solid red) and linear fit (dashed black) considering a stimulus-response latency of 323 ms. The individual latency was calculated, finding the highest correlation coefficient between crab's and stimulus direction for delays between 0 and 700 ms (inset, see Materials and Methods). C, Crabs keep their escape direction directly away from the visual stimulus. Mean crab response ± SD (αcrab, solid red and shaded red area, n = 15 crabs) to movement of a visual stimulus between P1 and P2 (αstim, dashed black,). The sum of αcrab and αstim absolute values (mean ± SD, solid blue and shaded area) shows that crabs keep their escape direction 180° away from the stimulus.
Previous experiments have shown that individual MLG1 neurons are capable of responding to smaller stimuli than those used for behavioral experiments. Therefore, to determine the neuronal receptive field, we used a small black square (5 × 5 cm; retinal subtended angle 14°, speed 18 cm/s), which reduces chances of MLG1 response saturation and allows a broader range of stimulus positions to be sampled. Conversely, to avoid the effect of appearing and disappearing from behind the borders of the screen, the stimulus started and ended its trajectory from positions 11° away from the screen borders. This precaution resulted in a reduction of the distance traveled by the stimulus, which encompassed 48° when presented in the left, right, or front screens and 60° in the dorsal screen (because of the shorter distance of the crab to the upper screen). The stimulus design and screen arrangement introduced two space gaps in the azimuthal visual field spanning 32° each, where images could not be projected, and a single gap of 36° in the vertical field. The rear visual field was not stimulated because a fifth screen would have impeded access to recording. To test for MLG1 physiological receptive field (PRF) and for directional sensitivity, the stimulus was presented separately on the four screens, moving rightward, leftward, downward, or upward along the vertical and horizontal midlines of each screen with an intertrial interval of 1 min to curtail habituation. The order of stimulation (screen and movement direction) was randomized. In all cases, stationary stimulus images were present for 30 s before movement onset. Responses to at least two complete series of stimuli were recorded from each neuron.
Behavior
From behavioral experiments in the field, Land and Layne (1995) deduced that, during predator evasion, crabs use two directional systems simultaneously. An open loop mechanism directs the crab's translatory movements directly away from the stimulus and a rotational mechanism using continuous feedback turns the crab so that the stimulus is kept at near 90° to the body axis. Although both systems require motion stimulation, they are sensitive to the angular position of the stimulus, not to its velocity. These investigators also concluded that, because there are no significant tracking eye movements in crabs (Barnes and Nalbach, 1993), the input can be regarded as positions on the crab's retina.
To begin exploring the directional sensitivity of N. granulata to a visual stimulus in the laboratory, we used a walking simulator device described in detail previously (Oliva et al., 2007). Briefly, the crab is held facing the front screen by a weightless rod of square section attached to its dorsal carapace while it stands on a floating Styrofoam ball that rotates freely (see Fig. 1A and Fig. 1 in Oliva and Tomsic, 2012). The rod could slide up and down with little friction, but its square section prevented rotational movement of the animal. In such conditions, the body axis of the crab maintains a constant direction while the direction of locomotion varies relative to this axis (Land and Layne, 1995). Two optical mice placed on the surface of the Styrofoam ball recorded the x and y components of ball movements at an acquisition rate of 60 Hz. Combining the synchronized data of the two mice, we obtained the resulting directional vectors and reconstructed the crab's trajectory as described previously (Oliva et al., 2007; Oliva and Tomsic, 2012). To ensure accurate correspondence between behavioral measurement and stimulus position, mice acquisition rate was synchronized with visual stimulus frame projection; that is, x and y movements of the ball were recorded for each frame projected by the screen during stimulus presentation. The crab's behavior was also monitored online through a video camera.
Electrophysiology
Intracellular recordings were performed in the optic lobes of intact living animals according to methods described previously (Berón de Astrada and Tomsic, 2002). Briefly, the crab was firmly held in an adjustable clamp and the eyestalks were cemented to the carapace in its normal seeing position. To access the optic ganglia, we removed a small section of cuticle (∼500 μm in diameter) from the tip of the eyestalk without causing damage to the ommatidia area and advanced a glass microelectrode through the opening in the cuticle. Microelectrodes (borosilicate glass; 1.2 mm outer diameter, 0.68 mm inner diameter), were pulled on a Brown-Flaming micropipette puller (P-97; Sutter Instruments), yielding tip resistances of 40–60 MΩ when filled with 3 m KCl. A bridge balance amplifier was used for intracellular recordings (Axoclamp 2B; Molecular Devices). Signals were digitized at 10 kHz (Digidata 1320; Molecular Devices) and recorded with Clampex (Molecular Devices) for offline analysis using pClamp 9 and MATLAB (The MathWorks).
Wide-field tangential neurons of the lobula can be identified based on their stronger response to motion stimuli compared with stationary changes of illumination. In addition, the MLG1s can be distinguished from the other identified wide-field tangential types because of their lack of spontaneous firing and absence of mechanosensory response (Medan et al., 2007). Once the identity of a MLG1 neuron was established, a black curtain was lowered to prevent uncontrolled visual stimulation and the animal was left undisturbed for 10 min before the experiment began. All intracellular recordings were performed at membrane resting potential. If resting potential changed >10%, then the experiment was ended. Because recordings done in the right and left neuropils showed no differences, the data from cells impaled in the left lobula were flipped along the midsagital plane so that all responses and neuronal staining are shown for the MLG1s in the right lobula.
Neuroanatomy
Individual MLG1 staining.
Electrode tips were backfilled with neurobiotin (5%, 50 mm Tris buffer, 500 mm KCl), backed up with 3 m KCl. After characterization of their response to visual stimuli, cells were filled iontophoretically for 15–60 min using 1–4 nA positive current. Only one neuron per animal was recorded and injected. After iontophoresis, animal remained at room temperature for ∼2–4 h to allow dye diffusion, followed by anesthesia in ice-cold water for 20 min. Optic lobes were dissected and immersed in 4% paraformaldehyde in phosphate buffer (PBS 0.1 m, pH 7.2) to be fixed overnight. After 5 20 min washes with PTA (PBS 0.1 m, Triton X-100 2% v/v; pH 7.4), ganglia were incubated overnight with avidin-rodamin (1/3000 v/v in PTA) at 4°C with constant shaking, followed by 5 20 min washes with PTA, dehydration in ethanol series, and clearing in methyl salicylate. Cleared ganglia were imaged as whole mounts and scanned at 2–5 μm intervals with a confocal microscope equipped with a helium/neon laser (Fluoview 1000, Olympus). Images, saved as 3D stacks, were adjusted for brightness and contrast and illustrations were obtained by merging the individual serial sections with ImageJ version 1.48d software.
Mass staining of the MLG1 ensemble.
MLG1 neurons project their axons to the midbrain, exiting the eyestalks through the protocerebral tract. In an effort to stain the whole ensemble, we performed local applications of fluorescent dextran crystals in the protocerebral tract (dextran–Alexa Fluor 488 3000 MW; Invitrogen). To this aim, we held the crab in an adjustable clamp, cemented the eyestalk to the carapace, and drilled a small hole in the eyestalk cuticle. We next applied dextrans with a fine glass probe inserted in the cuticle hole, which was gently rotated and removed after 5–10 s, leaving a spot of dye. Crystals were let to diffuse for 3–4 h and then the crab was anesthetized on ice and the optic lobe was dissected and fixed overnight, washed with PBS, dehydrated in ethanol series, and cleared in methyl salicylate (Berón de Astrada et al., 2013). Images were obtained and processed as described above.
Data analysis and statistics
To analyze the relation between stimulus position and escape direction, we took into account the delay between the stimulus presentation and the measurement of the behavioral response. Such delay is due to the sensory–motor transformation process plus the inertia of the walking simulator, which, according to the position adopted by the crab on the ball, could slightly vary from animal to animal. Therefore, the correspondence between stimulus position and escape direction required a determination of the individual latency. To this aim, instead of just measuring the transient disparity between the beginning of the stimulus and the beginning of response, we used a standard method that minimizes error measures by computing the ongoing stimulus–response disparities across the entire trial (Fotowat and Gabbiani, 2007; Oliva and Tomsic, 2012). We first smoothed individual responses (n = 15) with a sliding window of 80 ms. Next, we computed the Pearson correlation coefficient between the crab's escape directions (αcrab) and the stimulus directions (αstim) for latencies varying between 0 and 700 ms to obtain the latency that yielded the highest correlation coefficient (R) (see Fig. 1B, inset). Because directional response vectors to backward and forward movements of the stimulus were similar, Figure 1 shows averaged data from the two motion directions. PRF and directional preferences were investigated using stimuli that moved with a constant speed (18 cm/s) for a fixed duration (1 s). For description of the neuron PRF, we computed the input signals by integrating the depolarizations evoked by stimulus presentations (hyperpolarization was never observed in the MLG1s). To determine the information conveyed by a neuron about stimulus motion direction, we considered the neuronal output and therefore counted the number of stimulus-elicited spikes. Responses to the same stimulus obtained in two stimulation series were averaged and the values were normalized to the maximum response elicited in that neuron, which allowed comparisons among neurons with different excitability.
To evaluate preference for horizontal or vertical motion, we compared the responses obtained along the horizontal and the vertical axes in the screen that elicited the strongest responses. The preference of each cell was evaluated using an axis preference index (API), which compared the number of action potentials (APs) elicited by horizontally versus vertically moving stimuli as follows: API = (number of AP horizontal − number of AP vertical)/total number of AP. The API varies from 1 to −1, corresponding to exclusive horizontal or vertical preference, respectively. Neurons that doubled the number of elicited spikes to motion in one axis with respect to the other (and thus had API absolute values of 0.33 or greater) were considered to have an axis motion preference. For quantitative assessment of preferred motion direction each cell was assigned a directionality index (DI), which compared responses in opposite directions as follows: DI = (number of AP clockwise − number of AP counterclockwise)/total number of AP. Neurons with DI absolute value of 0.33 or greater were considered directional. Only neurons that responded with at least 20 spikes in the preferred axis and direction were included for the API and DI analyses.
The azimuthal reference axis was set to zero at the center of the front screen (corresponding to the rostral midline of the crab), defining negative values to the left and positive values to the right (see Figs. 1A, 3A). The vertical axis origin was set at the equator of the eye, with negative and positive values below and above this line, respectively (see Fig. 4A, inset). Azimuthal PRFs were obtained by fitting a Gaussian distribution to the responses that resulted from combining the recordings of the three screens (Kuffler, 1953; Lennie, 1998). The Gaussian fit gave estimates for the parameters μ and σ: the mean represented the center of the azimuthal PRF of the cell and the SD was used as an estimate of the PRF width. Here, we report PRF width as the arc that encompasses 95% of the neuron activity (mean ± 2 SDs). A similar analysis was performed on responses to a vertically moving object, for which we combined results from the upper screen and the lower screen with the strongest response (left, right, or front).
Figure 3.
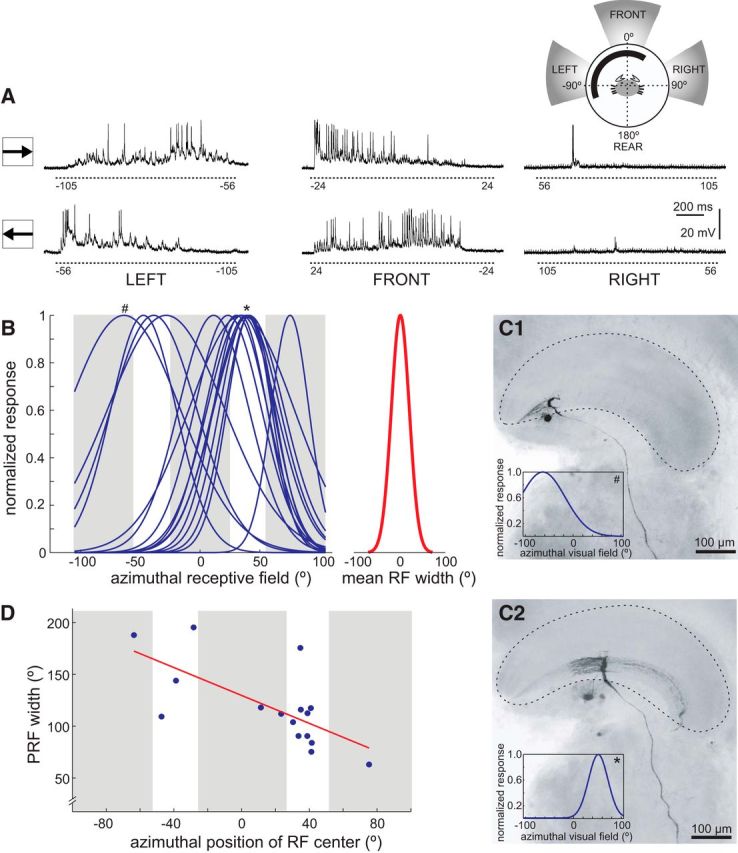
Azimuthal receptive field of the MLG1s. A, Representative responses of an MLG1 to a black square stimulus (5 × 5 cm) moved clockwise (top traces) and counterclockwise (bottom traces) across left, front, and right screens (inset in the upper right shows the stimulated area in gray). Numbers below dashed lines indicate the stimulus angular position at the beginning and end of motion. Note that initial angular positions of clockwise motion correspond to final positions of counterclockwise motion. B, Azimuthal PRF width of 16 recorded units. To estimate the width of each MLG1, clockwise and counterclockwise activity were aligned, normalized, and fitted to a Gaussian distribution. The peak ± 2 SDs indicates the center and width of the PRF. Left, PRF distribution of 16 MLG1s (blue lines). Right (red trace), Mean fit width (mean ± SD: 118.44° ± 38.9°). Fits indicated by # and * correspond to neurons shown in C1 and C2. C, Intracellularly stained neurons and their PRF fit (inset). Both images correspond to frontal views of right lobula neuropils. The neuron in C1 is located toward the lateral pole of the lobula and its PRF center (−64°, #) is oriented toward the left (i.e., to the contralateral visual field for the right eye, see inset of A). The neuron in C2 is located near the middle of the lobula and its PRF center (41°, *) is oriented to the front-right visual field. D, Relationship between PRF width and position of PRF center. Within the azimuthal region evaluated, there is a negative linear relationship between PRF width and position of the PRF center; that is, neurons mapping the lateral visual field (PRF >0°) have narrower PRFs than those mapping the frontal and left visual fields (PRF <0°; data corresponding to right eyes). Abbreviations are as in Figure 2.
Figure 4.
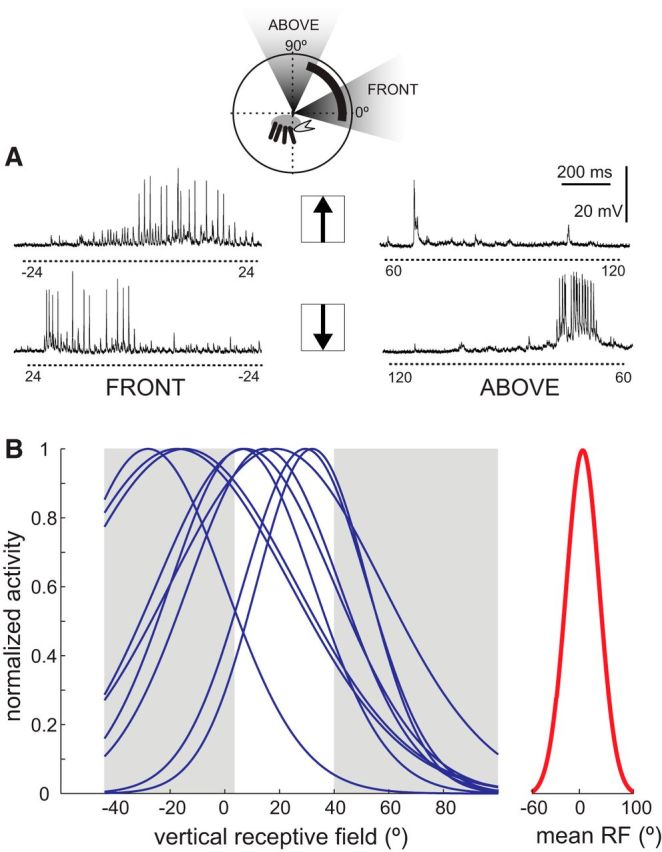
Vertical receptive field of the MLG1s. A, Individual vertical PRF characterization. Example of responses to upward (top traces) and downward (lower traces) movement of the visual stimulus in the front and upper screens (inset shows the stimulated area). Numbers below dashed lines indicate the stimulus angular position at the beginning and end of motion (other considerations are as in Fig. 3). B, Vertical PRF was analyzed following the procedures described in Figure 3. Left, Receptive field fits of 9 MLG1s. Right, Average of these fits (solid red trace, mean ± SD elevation: 5.37° ± 21.21°; mean ± SD width: 124.12° ± 31.49°).
Data are presented as mean ± SD or SEM. All experimental protocols were performed in accordance with relevant guidelines and regulations of School of Science, Universidad de Buenos Aires.
Results
Escape response directionality
Computer-generated stimuli and a walking simulator device have been used to investigate the control of the running speed of N. granulata (Oliva et al., 2007; Oliva and Tomsic, 2012). We used the same device to assess the directional control of the escape response. Animals standing on the walking stimulator were challenged with a large square stimulus, which moved back and forth on a horizontal trajectory that spanned an arc of 80° (from 50° to 130°) in the lateral visual field (Fig. 1A). Figure 1B shows the directional changes performed by a crab while attempting to escape from the moving stimulus (stimulus angular position αstim and crab direction αcrab are both referred to 0° at the front of the animal, Fig. 1A). When the stimulus was at 50°, the crab escape direction was near −130° (red line, Fig. 1B), and, when the stimulus was at 130°, the escape direction was ∼−50°. The black dashed line represents a linear fit of the data considering a response delay of 323 ms (r = 0.90, inset in Fig. 1B; see Materials and Methods). A similar procedure followed, with all tested crabs yielding optimal delays between 221 and 663 ms (mean ± SD: 389 ± 120 ms, n = 15). Next, trajectories of 15 animals were time aligned considering the individual delays to obtain a mean (±SD) trajectory direction for each stimulus position (red trace, Fig. 1C). As the stimulus moved from P1 (50°) to P2 (130°, dashed line, Fig. 1C), the escape direction gradually changed from nearly −130° to −50°. The sum of the absolute values of αcrab and αstim (blue solid trace, Fig. 1C) shows that animals continuously attempted to escape in the direction opposite to the stimulus image. In fact, the mean escape angle (± SD) calculated throughout the stimulus translational movement is 177 ± 6°, very close to the theoretical 180°. We calculated the minimum displacement of the stimulus from a 90° position (red trace center, Fig. 1C) that generated a statistically significant difference in the escape direction. The results showed a significant difference in the angular escape direction for stimulus positions separated by only 0.9° (paired Student's t test, p = 0.013, n = 15). In fact, 0.9° represents the minimum angular change that our 60 Hz screen refresh can generate for the stimulus speed that we used. The remarkable directional accuracy shown by N. granulata in such unnatural experimental conditions proves that this animal has a finely tuned directional control system and prompted us to search for its neural basis.
Morphological characteristics of the MLG1 ensemble
Figure 2A shows the nested organization of the three main optic neuropils of the crab, which, from the periphery to the center, are the lamina, medulla, and lobula. As in insects, the lobula of the crab contains different classes of large tangential neurons that collect information from the retinotopic columnar mosaic and project their axons to the midbrain. These wide-field neurons are poorly sensitive to stationary changes of illumination but highly sensitive to motion (Berón de Astrada and Tomsic, 2002; Medan et al., 2007). Although, in the crab, the postsynaptic target of the lobula giant neurons is still unknown, in insects, lobula giant neurons are known to be presynaptic to descending premotor elements (Simmons, 1980; Gronenberg and Strausfeld, 1991). The fact that insect and crustacean optic neuropils are homologous (Sztarker et al., 2005; Strausfeld, 2009), together with the fact that the motion-sensitive lobula giant neurons described in the two groups share many morphological (at the lobula level) and physiological characteristics (Oliva et al., 2007; Medan et al., 2007; Oliva and Tomsic, 2014), make tenable the assumption that they also share similar postsynaptic targets; that is, premotor nuclei. In addition, the activity of the lobula giant neurons has been shown to correlate closely with the locomotor behavior of the crab in a number of different circumstances, such as response changes induced by learning (Tomsic et al., 2003; Sztarker and Tomsic, 2011), seasonal variations of response (Sztarker and Tomsic, 2008), and velocity of escape run (Oliva et al., 2007; Oliva and Tomsic, 2014). On this basis, the lobula giant neurons are thought to be involved in the visually guided behaviors of crabs, with the MLG1 neurons in particular playing a role in the directional control.
Figure 2.

Anatomical properties of the MLG1 ensemble. A, Confocal stack of optic neuropils from N. granulata as seen by autofluorescence. Below the retina (data not shown), three retinotopic neuropiles, the lamina (La), medulla (Me), and lobula (Lo) map the entire crab's visual field. B, Mass staining with dextran–Alexa Fluor 488 reveals the main neurites of MLG1s, as well as their somata (empty arrowhead) and the axonal tract leaving the lobula toward midbrain centers (solid arrowhead). C, Intracellular staining of MLG1s. C1, Tangential view of the lobula revealing fine details of MLG1 secondary dendrites (projecting long lateral and shorter medial neurites), soma, and axon, which thins as it exits the lobula. The inset shows an enlarged image were dorsally projecting tertiary dendrites are apparent. C2, Transversal section of another MLG1 showing that MLG1 dendrites cover the whole anteroposterior extent of the lobula. Note that the cluster of MLG1 somata is located between the lobula and the lateral protocerebrum (LPc). Inset, Dorsal projection of the same neuron where the fork-like secondary neurites are clearly seen. D, Dorsal; V, ventral; L, lateral; M, medial; A, anterior; P, posterior.
Previous anatomical studies described the existence of ∼14 MLG1 elements distributed evenly across the lateromedial axis of the lobula, which are recognizable because of their distinctively thick (8–10 μm diameter) primary neurite (Sztarker et al., 2005). By mass staining of the protocerebral tract with fluorescent dextrans, we obtained three preparations in which the MLG1 ensemble was selectively stained. These revealed profiles of 16 MLG1s per lobula and the somata cluster (Fig. 2B). In addition, careful examination of four unstained but autofluorescent preparations showed that the cluster of MLG1 somata, easily identified because of their large size (Sztarker et al., 2005), contains 16 similar cell bodies (data not shown).
We next performed in vivo intracellular recordings from 40 MLG1 neurons, distinguished from other types of lobula giant cells by the electrophysiological criteria described by Medan et al. (2007). Briefly, in the absence of visual motion, MLG1 cells are completely silent. The cells respond to a moving object with a train of spikes riding on top of large and sustained EPSPs. Their response to a pulse of light consists of a discrete IPSP or EPSP (occasionally a single spike) that is always associated with the onset and the termination of the light. The latency of these light responses is significantly shorter than those observed in other lobula giant cells. In addition, unlike other lobula giant cells, MLG1 neurons do not respond to mechanical stimulation. Eighteen of these neurons were successfully stained intracellularly with neurobiotin. Figure 2, C1 and C2, show a frontal and a lateral view of two MLG1 neurons respectively; the inset in Figure 2C2 shows a dorsally rotated view of the same neuron. The single main branch of each cell runs anteroposteriorly along the whole width of the lobula (Fig. 2C2), giving rise to secondary neurites arising perpendicularly at 12–20 μm intervals (n = 3, Fig. 2C1,C2, insets). These secondary neurites lie close to processes of other types of lobula giant neurons such as MLG2, BLG1, and BLG2 (Medan et al., 2007) for 90 μm, tapering while progressing toward the lateral side of the lobula (n = 5 neurons). We also found secondary neurites projecting from the main branch toward the medial side, but these are fewer and shorter (∼30 μm; Fig. 2C1). The secondary processes give rise to short (∼15–20 μm), thin tertiary processes projecting dorsally. The somata of MLG1s are large (mean ± SD: 24.43 ± 3.38 μm, n = 10) and clustered posterior and beneath the lobula (Fig. 2B, empty arrow, C). A thin process connects the soma with the main neurite in its posterior third (Fig. 2C). The dendritic arbor connects to the axon, which descends through the lateral protocerebrum and the protocerebral tract toward the midbrain. Descending axons of the 16 MLG1s form a discrete bundle that can be readily observed with mass staining techniques (Fig. 2B, white arrowhead; see also Sztarker et al., 2005).
Physiological characteristics of the MLG1 ensemble
Horizontal receptive fields
The receptive field of MLG1 neurons can be independently estimated from anatomical receptive field (ARF; see below) and physiological (PRF) measurements. The latter was calculated from responses to a small square moving back and forth along azimuthal and vertical axes in each one of four screens surrounding the animal (see Materials and Methods). We recorded intracellularly from 40 MLG1 cells in 40 crabs. In 20 of these neurons, we evaluated the complete series of 16 stimuli twice. MLG1 responses to these stimuli are exemplified in Figures 3A, 4A, and 5. The traces in Figure 3A illustrate the responses of a neuron to azimuthal translation across the three lower screens (upper right schema in Fig. 3A). Initial and final angular coordinates of the stimulus are indicated below the neuronal traces. In the absence of a moving object, the basal activity of MLG1s is zero. As the stimulus started to move clockwise from the rear left, the neuron exhibited a gradual depolarization and an increased AP firing (upper left trace in Fig. 3A). Motion resumed in the frontal visual field, evoking a high spike rate, but, as the stimulus progressed to the right, the firing rate decreased (upper middle trace in Fig. 3A). Motion in the right visual field evoked almost no response (upper right trace in Fig. 3A). When the stimulus moved in the opposite direction (counterclockwise) across the three screens, a similar relation between stimulus spatial position and neuronal activity could be observed (lower traces in Fig. 3A). Because traces reflect the recording temporal course, the initial part of the lower recordings corresponds to the spatial position occupied by the stimulus at the last part of the upper recordings. Counterclockwise motion of the stimulus evoked no response in the right visual field (lower right trace in Fig. 3A). In the front screen, it began eliciting subthreshold EPSPs, followed by APs that increased in frequency as the stimulus moved toward the left (lower middle trace in Fig. 3A). Finally, counterclockwise stimulus motion in the left screen started eliciting a large depolarization with a burst of APs, which declined as the stimulus moved across the screen toward the rear left. Note that, if lower traces were swapped to align their spatial coordinates (i.e., inverting the time scale), then the distribution of neuronal activity elicited by clockwise and counterclockwise motion would look similar.
Figure 5.
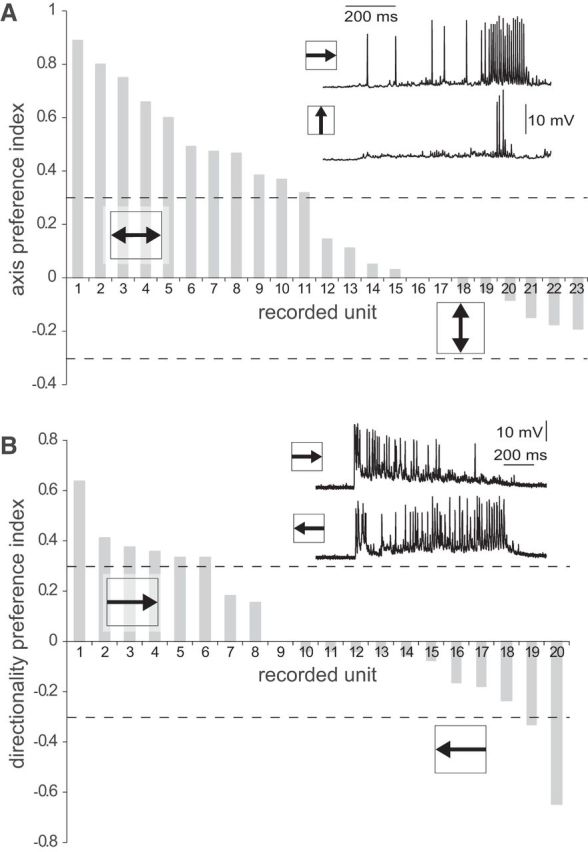
Axis and direction preference. A, Distribution of the API (see Materials and Methods) of 23 MLG1 neurons. The majority of these units showed stronger responses to motion along the horizontal than the vertical axis (exemplified in the inset). Neurons with absolute API values >0.33 (dashed lines) are considered to have axis motion preference. Although 11 of 23 showed a preference for horizontal motion, none reached the criteria for vertical preference. B, Distribution of the DI (see Materials and Methods) of 20 MLG1 neurons. Neurons are considered to have directional preference when their DI absolute value is >0.33 (dashed lines). From 20 MLG1s evaluated, 12 showed no directional preference (exemplified in the inset), six showed a weak preference (DI just above criteria), and only two exhibited a clear preference (one for each direction).
To determine the azimuthal extension of the PRF of each neuron, we integrated responses obtained across the azimuthal axis. Responses to counterclockwise trajectories were swapped to space align the activity corresponding to equivalent stimulus positions, and then averaged with clockwise responses, normalized, and fitted a Gaussian distribution taking into account the gaps between screens (Fig. 3B). Neurons responding to motion only in the left or right screen likely extended their PRF into the rear part, which was beyond our stimulation area and thus were excluded from the analysis (4 of 20 units). The analysis performed in the remaining 16 neurons (Fig. 3B, left) yielded a mean (±SD) PRF width of 118.44° ± 38.9° (Fig. 3B, right). Gaussian PRF fits of single neurons show their maxima (center of PRF) distributed along ∼132° of the azimuthal space, with most elements centered around 40°-50° (Fig. 3B, left). This, however, does not reflect an anatomical overrepresentation of this particular visual field area, but a bias in our neuronal sampling. This is because units with their PRF center beyond ± 75° could not be analyzed because their receptive field extended well toward the back (angles higher than ± 100°), outside of our stimulation area. In addition, the location of the stained MLG1 cells within the lobula suggests that there are greater chances of impaling neurons located in the center (where the lateral visual field is mapped) than in the edges of the lobula (where the rear and medial visual fields are mapped) (see below).
Figure 3, C1 and C2, show two intracellularly stained MLG1s, one located in the lateral edge and the other in the middle of the lobula, respectively. The neuron at the lateral edge has its PRF centered at −64° (# in Fig. 3B, inset, C1); that is, on the left (contralateral) visual field, and a PRF width of 188°, which is clearly wider that the mean value of 118° reported above. The neuron located in the middle of the lobula, however, with its PRF centered at 41° (* in Fig. 3B, inset, C2); that is, at the frontal-right visual field, has a narrower PRF of 117°. These two examples suggest that MLG1 neurons looking toward the lateral part of the ipsilateral visual field have narrower RFs. In fact, a plot of the PRF width as a function of the azimuthal location of the PRF center for 16 MLG1 neurons reveals a statistically significant reduction of the PRF width toward the ipsilateral visual region (Fig. 3D, linear regression, R2 = 0.46, p = 0.004).
Vertical receptive fields
We performed a similar analysis to determine the properties of MLG1 PRF along the vertical axis, for which we combined the activity elicited by stimulus movements in the upper and lower screen closest to the azimuthal PRF center of each neuron (left, right, or front). Figure 4A shows the responses of an MLG1 unit to vertical motion. When the stimulus moved upward in the front screen (from −24° to 24°, upper left trace in Fig. 4A), the neuron increased its response level when the stimulus was moving near the eye equator and fired a single AP when the stimulus began its front to back motion in the dorsal screen (from 60° to 120°, upper right trace in Fig. 4A). When the trajectory reversed, starting from the rearmost part of the dorsal screen (lower right trace in Fig. 4A), the neuron reached threshold as the stimulus approximated the forefront of the screen (∼80°), kept firing while it moved downward in the front screen (lower left trace in Fig. 4A), and stop responding below the equator of the eye. MLG1s are weakly responsive to stimuli passing overhead. Indeed, from 9 of 20 neurons that showed some response in the dorsal field, none of them have their PRF center at elevations >35° (Fig. 4B, left). The mean (±SD) PRF centers was slightly above the horizon, at 5.37° ± 21.21° (Fig. 4B, right), which coincides well with the band of higher vertical resolution described in the eye of this crab (Astrada et al., 2012). The mean PRF vertical width was 124.12° ± 31.49°, thus almost entirely covering the ∼150° vertical visual field of the crab eye (Berón de Astrada et al., 2012). This result is consistent with the observation that the MLG1 dendritic tree extends throughout the anteroposterior axis of the lobula (Fig. 2C2), where information on elevation is retinotopically mapped (Berón de Astrada et al., 2011). Contrasting with the variation in the width of PRF observed along the azimuthal positions (Fig. 3D), the vertical width remains the same along azimuthal positions (linear regression, R2 = 0.32, p = 0.11, n = 9).
Therefore, combined results from the azimuthal and vertical PRF of MLG1s indicate that these elements collect information from different azimuthal positions, but all of them cover a similar vertical width centered at the eye equator.
Movement direction preferences
Crabs living in flat environments, such as N. granulata, keep their eyestalks vertically aligned in such a way that the equatorial band of highest resolution coincides with the line of the horizon (Zeil et al., 1989; Zeil and Al-Mutairi, 1996; Berón de Astrada et al., 2012). This is because prevailing visual motion information occurs just above and below the level of the horizon, where objects (most usually conspecifics) move predominantly along the azimuthal plane (Land and Layne, 1995). Therefore, we investigated whether this combination of ecological, behavioral, and morphological characteristics have a correspondence with a preference for horizontal motion in MLG1 neurons. To this aim, we analyzed the responses to the stimulus moving along the horizontal and vertical axes for each neuron and normalized the data to compare among neurons with different response levels. Most MLG1s fire more APs to stimulus motion along the horizontal than the vertical axis (mean ± SEM) percentage of horizontal and vertical response: 63 ± 3 and 37 ± 3, respectively, Student paired t test, p = 0.001, n = 23). The distribution of individual API values shows that 11 of 23 neurons displayed a clear preference for horizontal motion (API >0.33; see Materials and Methods), but none had a preference for vertical motion (API <−0.33; Fig. 5A).
We also evaluated whether the MLG1 ensemble was composed of directional elements (Fig. 5B). Units were considered directional if their response in one direction doubled that in the other, which would results in DI absolute values >0.33. According to this criterion, only six of 20 elements had preference for objects moving clockwise and two preferred the opposite direction, but only two showed a strong directional preference (Fig. 5B, units 1 and 20). The other 12 neurons had DI absolute values <0.33 and therefore were considered nondirectional. In addition, the DI distribution fits to a normal distribution centered on zero, indicating a lack of significant direction preference for the whole MLG1 ensemble (Lilliefors test, p = 0.36, n = 20).
Together, the results indicate that MLG1s preferentially process information of objects moving along the azimuthal axis regardless of their direction.
Correspondence between ARFs and PRFs
The physiological analyses performed in previous sections showed that individual MLG1 elements receive information from retinal areas covering different spatial regions of the azimuth (Fig. 3). We next examined the anatomical distribution of these elements in the lobula and the way in which they map the field of view.
Mass staining revealed the distribution of the main neurite of the MLG1s across the lateromedial axis of the lobula (Fig. 2B). The large diameter of this neurite allows identification of the profile of its cross-section in confocal images, even in the unstained lobula (Fig. 6A). We numbered the observed profiles from 1 to 16, beginning with that at the lateral end of the lobula (Fig. 6A), and calculated the relative position of these profiles along the lobula span in two preparations in which the tissue was well aligned with the lateromedial axis (Fig. 6B). This analysis revealed that the positions of the main neurites along the lobula fit a line, indicating that MLG1s are evenly distributed within the neuropil. This does not mean, however, that the azimuthal visual space is mapped uniformly because an additional factor has to be considered. Previous work by our group determined that the distribution of ommatidia across the visual space is not constant and that, in fact, more units are dedicated to cover the lateral visual field (Berón de Astrada et al., 2012). Because the number of columns that carry information from the retina to the lobula is preserved (Sztarker et al., 2005), the larger number of ommatidia collecting information from the lateral visual field is represented by an equally larger number of input columns to the lobula. Therefore, even when MLG1s are evenly distributed across the lobula (Fig. 6B), they do not map the visual space uniformly because the lobula itself has a nonlinear representation of the azimuthal space (Fig. 6C). When the relative position of the MLG1s' main neurite (square and diamond symbols in Fig. 6C) are laid over the curve representing de distribution of ommatidia (or lobula input columns), their nonlinear mapping of the azimuth becomes apparent. Most elements (10 of 16), have their main neurite within the lobula region that maps the lateral visual hemisphere (from 0° to 180°, gray box in Fig. 6C). In other words, there are more MLG1 units dedicated to process information from the lateral than from the medial visual field of each eye.
Figure 6.
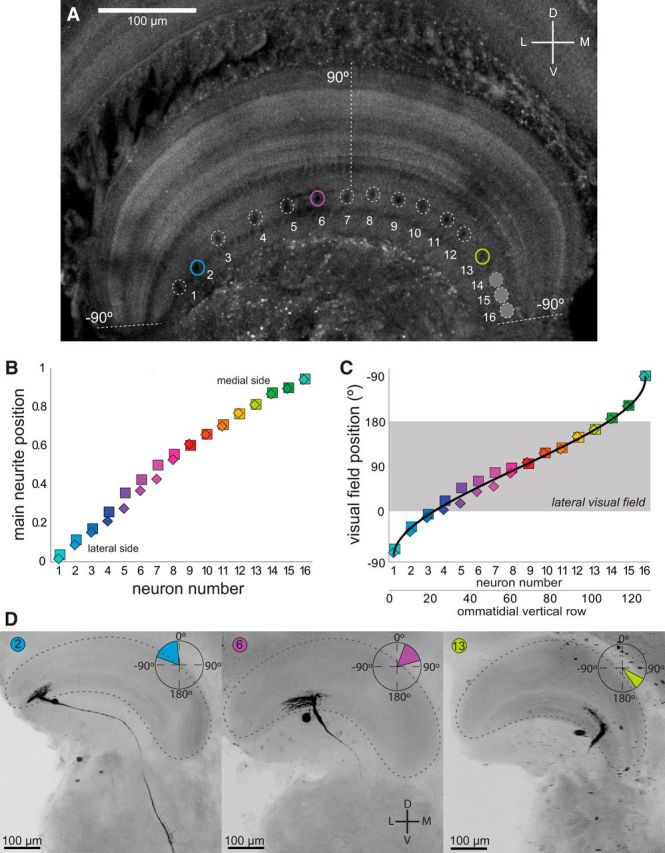
ARFs of the MLG1s. A, Transversal confocal section of an unstained lobula in which the profiles of the main neurite (surrounded by dashed circles) of 13 MLG1 neurons can be observed (three additional profiles at the medial side of the lobula faint in this focal plane are also indicated). The lateromedial lobula axis contains a representation of the 360° azimuthal space (Berón de Astrada et al., 2011). Dashed lines indicate region of the lobula where the lateral visual pole of the eye (90°) and the medial visual pole (−90°, the side looking toward the other eye) are represented. B, Distribution of MLG1 primary neurites along the normalized lateromedial length of the lobula. The relative distance of each profile to the lateral end of the lobula was calculated. Squares and diamonds correspond to data from two animals. C, Replot of the relative position of each neuron within the lobula (y-axis in Fig. 6B) as the visual field position represented across the lobula. The data were adjusted taking into account the nonlinear representation of the azimuthal space across the lobula (see Results). Most MLG1s (10 of 16) reside within the lobula region that maps the lateral visual hemisphere (0° to 180°, gray box). D, Representative examples of intracellular stained neurons located (from left to right) in the lateral, central, and medial regions of the lobula. Following the ordering shown in A–C, these neurons would correspond to element numbers 2, 6, and 13, respectively (identified by a single color code throughout the figure panels). Insets show the ARF of each neuron. Abbreviations are as in Figure 2.
Figure 6D portrays three intracellular stained MLG1s that, according to the position of their main neurite, correspond to elements number 2, 6, and 13 (left, center, and right, respectively of Fig. 6A–C). Insets in Figure 6, A–C, show the ARF of each neuron, which was estimated as follows. We measured the lateromedial span of the dendrites (which collect information from columns along the azimuthal axis) and considered the arc of the lobula occupied by the dendritic tree as the ARF azimuthal width. We assumed the ARF center to be at the midpoint of this arc. The ARF center is slightly lateral to the position occupied by the primary neurite because the dendritic tree arising from this trunk is asymmetric, projecting longer branches toward the lateral lobula side (Fig. 2C1,C2). We next projected the relative position and span of the arc (length of the dendritic tree) onto the curve of Figure 6C and obtained the numerical value used to plot insets of Figure 6D. For example, the neuron in the middle panel of Figure 6D (neuron 6) extends its dendrites from ∼0.23 to 0.45 of the normalized lobula length (cf. y-axis of Fig. 6B), which, when translated into the y-axis of Figure 6C, results in an ARF spanning from 20° to 75° in the azimuthal space (inset in Fig. 6D). The same procedure was applied to 10 well stained MLG1 cells to get an anatomical estimate of their receptive fields (ARF center and width, red circles and solid lines, respectively, Fig. 7A). This is compared with physiological measurements obtained by intracellular recording (Fig. 3) of 16 cells (PRF center and width, blue squares and solid lines, respectively, Fig. 7A). In seven cases, ARF and PRF data could be estimated for the same neuron, allowing a direct comparison of the two methods of analysis. A cursory inspection of the data reveals a good agreement between the two independent measurements. However, two consistent differences can be observed in the seven cells. First, physiological measures rendered much wider RFs than anatomical calculations (Fig. 7A, blue vs red lines). A comparison reveals that physiological RF widths double those estimated anatomically (Fig. 7B, mean ± SEM, ARF: 57.4 ± 9.9° vs PRF: 130.1 ± 14.1°; Kruskal–Wallis test, p = 0.004). Second, PRFs are slightly shifted medially with respect to the ARFs (mean shift 28.9°, range: 4.7°–45°; data always shown for the right lobula). These two differences may be accounted for by two nonexclusive explanations. First, in arthropod optic lobes, there are numerous elements with tangentially oriented processes that could be part of the motion-detection pathway and lead to an asymmetrical broadening of the MLG1 PRF. Second, each MLG1 appears to be electrically connected with one or a few of its nearer neighbors positioned toward the lateral side of the lobula. Indeed, dye coupling between MLG1 and its closest neighbor were occasionally observed as faint staining of soma and neurites (Fig. 7C, arrowhead). In addition, previous studies have shown that, for each particular MLG1, the long dendrites extending from the main neurite toward the lateral lobula side overlap with the dendrites of the two to three MLG1s located laterally (see Figs. 8 and 9 in Sztarker et al., 2005). Therefore, the PRF of each MLG1 may be widened and shifted with respect to its ARF estimate by contributions from presynaptic tangential elements, as well as from neighbor electrically coupled MLG1s located toward the lateral lobula side.
Figure 7.

Anatomical and physiological estimates of the MLG1s receptive field. A, Anatomical (red) and physiological (blue) receptive field center and width (symbols and lines, respectively) of recorded and stained units are represented along the azimuthal visual axis. In seven of these neurons, both the ARFs and PRFs could be positively determined (shaded data pairs). PRFs are consistently wider and left shifted compared with their corresponding ARFs. B, PRF width exceeds the width predicted by the anatomical calculations by ∼70° (**p < 0.001, n = 7). C, Example of dye coupling between neighbor MLG1s. Shown is the detail of the same neuron of Figure 3C1 showing a second soma faintly stained (arrowhead).
Figure 8.
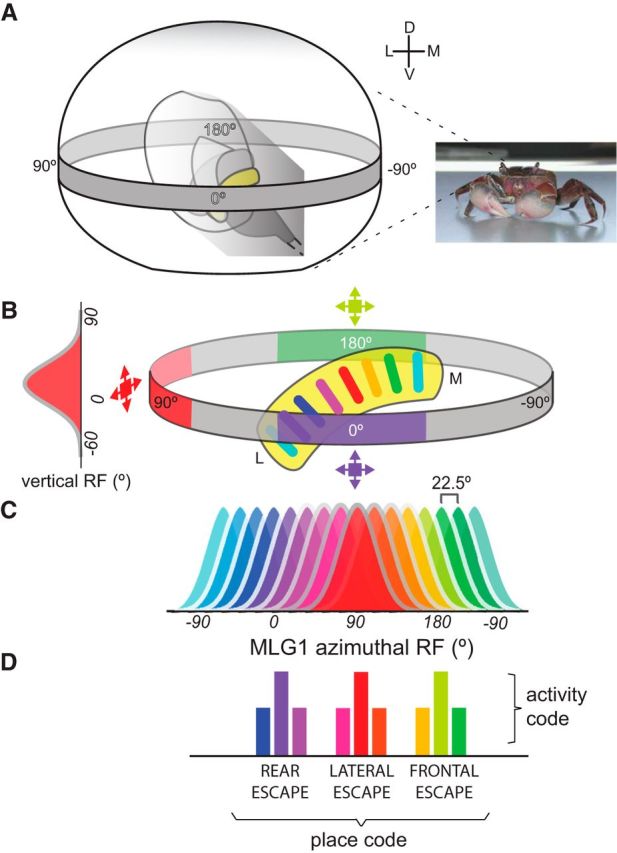
The MLG1 system for computing azimuthal positions of moving objects. A, Diagram showing a frontal view of the right eye of the crab containing the optic neuropils (the lobula is in yellow) within a representation of the visual space where the azimuthal coordinates are indicated at level of the horizontal gray band. The omatidial array collects visual information from 360° in the azimuthal plane. Information about object motion is conveyed through the retinotopic neuropils to MLG1 neurons in the lobula, which send it to the midbrain. B, Color-coded diagram showing the correspondence between the position occupied by different MLG1 neurons within the lobula and the sectors of visual space to which they are sensitive. The activation of a particular MLG1 provides information on a specific stimulus location, which would be used for organizing the directional control of escaping from visual stimuli, as shown in Figure 1. Therefore, an object approaching the crab from its frontal, lateral, or rear side (blue, red, or green expanding squares, respectively) will correspondingly activate the bluish, reddish, or greenish units represented in C, which would determine the rear, lateral, or frontal escape direction of the crab (D). The vertical PRF represented in the left side of B shows that the peak of MLG1 vertical sensitivity is near the equator of the eye. C, Color bells representing the receptive field distribution of the 16 MLG1 units across the 360° azimuthal space (for simplicity, the nonlinear representation of the azimuthal space across the lobula was omitted). The scheme highlights the large degree of superposition among the MLG1 units. D, Bluish, reddish, and greenish bars represent the response level of three different sets of neurons to a stimulus approaching the animal from different sites (the representation of three neurons per set is arbitrary and is for illustration purposes only). The activity of MLG1 neurons are known to finely encode the dynamic of stimulus expansion (Oliva and Tomsic, 2014), but for each particular dynamic, the three sets of neurons would show the same activity profile (represented by similar bar heights). Therefore, the MLG1 system may operate with a double code: an activity code to convey information on stimulus dynamic and a place code to convey information on stimulus position.
Discussion
Our behavioral results with N. granulata show that, considering the oddness of the crab's sensory and mechanical environment in our experiment, these animals perceive the position of a threatening moving object with high accuracy. Upon changes in the position of the object, they adjust the escape direction to keep running directly away from the threat (Fig. 1). Previous experiments with different species of crabs have shown that the ability to escape directly away occurs wherever the moving stimulus is located in the 360° field of view (Land and Layne, 1995) and that the directional implementation can be attained in monocular animals (Nalbach, 1990). This implies that a system of projecting neurons from a single eye provides sufficient information to the motor system to guide the directional response in 360°. Our results show that the ensemble of MLG1 neurons is suitable to accomplish that task.
MLG1 visual space map
The MLG1 ensemble consists of 16 tangential neurons distributed evenly across the lateromedial axis of the lobula (Figs. 2, 6). Each unit collects information from a particular sector of the azimuthal plane (Figs. 3, 6) and the assembly contains a representation of the entire visual field (Fig. 8A–C). Intracellular recording and staining allowed us to establish the correspondence between the PRF and the anatomical location of the MLG1 elements in the lobula. Results show that the map of azimuthal positions is inverted along the lobula lateromedial axis (Fig. 6), which implies that the frontal, lateral, and rear sectors of the visual field are correspondingly mapped in the lateral, central, and medial parts of the lobula. The medial visual field sector, that looking toward the midsagittal plane of the animal, is captured by the anteromedial and posteromedial retinal areas, which are mapped at the lateral and medial ends of the lobula, respectively (Fig. 8B,C).
Ecological and behavioral determinants of some features of the MLG1 ensemble
There are two ways that a crab might direct its course away from a potential predator. It can maintain a constant direction of its body axis in space but vary the direction of locomotion (as in our behavioral experiment, Fig. 1). Alternatively, it can turn and fixate the sight of the predator with the lateral pole of one of the eyes so that its preferred sideways running direction is directed away from the target (Land and Layne, 1995). The behavioral ability for fixating moving objects with the lateral visual pole, along with the morphological specialization found in this retinal area (Berón de Astrada et al., 2012), are in agreement with our current finding that the majority of MLG1 elements (10/16) are dedicated to process information from the lateral visual field hemisphere (Fig. 6C). Moreover, the most laterally looking elements have smaller receptive fields (Fig. 3D), implying that the MLG1 ensemble samples this area with higher resolution.
The vertical visual field of N. granulata extends from ∼−50° to 90° below and above the horizon, respectively, with a band of much higher resolution at the level of the eye equator (Berón de Astrada et al., 2012). This is because, for crabs that inhabit flat environments, most movements occur in an area encompassing few degrees above and below the horizon (Land and Layne, 1995; Zeil and Zanker, 1997). Such ecological vertical compression determines that motion vectors are predominantly parallel to the horizon. Therefore, our finding that MLG1 vertical tuning curves peak near 0° (Fig. 4B) and that these neurons are more sensitive to horizontal than to vertical motion (Fig. 5A) obeys the visual ecology of the animal (Fig. 8B).
PRF broadening of MLG1s
The larger receptive fields obtained from the physiological compared with the anatomical method may be accounted for by the existence of electrical coupling between neighboring units (Fig. 7C), as has been shown to happen between VS lobula plate tangential neurons in the fly (Borst and Weber, 2011; Trousdale et al., 2014). In addition, the broadening of the MLG1 PRF could also be produced by inputs from tangential elements in the presynaptic pathway, which may convey information from columns outside of the ARF of the neuron.
Stimulus position must be conveyed by a population vector code
Our anatomical analyses show that the 16 MLG1s are distributed to sample the 360° azimuthal space represented in the lateromedial lobula axis, which means that, on average, there is 22.5° separation between each unit (Fig. 8C). If the stimulus location were extracted from the MLG1 neuron that is most activated using a “winner-take-all” strategy (Salzman and Newsome, 1994; Levi and Camhi, 2000), then the precision could not be better than 22.5°. However, our behavioral results show that on the lateral pole (where binocular vision is almost negligible), the animal adjusts its escape direction upon changes of the stimulus position smaller than 1°. This suggests that a continuous, rather than a discrete, neural coding is used to convert stimulus position into the appropriate crab's escape direction. In both vertebrates and invertebrates, such sensory–motor transformations were found to be often encoded in the activity of many neurons across a population, that is, a population vector code is used (Georgopoulos et al., 1986; Lewis and Kristan, 1998; Karmeier et al., 2005; Gonzalez-Bellido et al., 2013). The largely overlapping PRFs of the 16 MLG1 projecting neurons make this assembly ideal to convey information regarding object positions in the form of population vectors. Moreover, MLG1s are highly sensitive to approaching objects and their firing frequency strongly correlates with the dynamic of stimulus expansion (sensory input), as well as with the speed of the escape run (motor output) (Oliva et al., 2007; Oliva and Tomsic, 2012, 2014). Therefore, the MLG1 system is likely involved with both the speed and the trajectory of escape from looming stimuli. This is illustrated in Figure 8, B–D. When a looming stimulus is presented in the frontal, right, or rear side of the animal (Fig. 8B), it activates the bluish, reddish, or greenish elements, respectively, eliciting the corresponding rear, left, or frontal direction of escape (Fig. 8C,D). The response profile of the MLG1s (i.e., the temporal pattern of its electrophysiological activity) reflects the precise dynamic of the looming stimulus (Oliva and Tomsic, 2014), but, for every particular stimulus dynamic, the three sets of neurons (each set arbitrarily represented here by three neurons) will exhibit the same response profile (indicated by the equal heights of color bars in Fig. 8D). Therefore, an activity code (representing stimulus dynamics) and a place code (representing stimulus positions) appear to be embedded in the MLG1 system. These two codes would contribute to the visuomotor transformations implicated in controlling the crab speed and direction when escaping from visual stimuli.
MLG1s can participate in different behaviors
A growing number of studies support the notion that the group of lobula giant neurons play a central role in the organization of visually guided behaviors (Tomsic et al., 2003; Oliva et al., 2007; Sztarker and Tomsic, 2008, 2011). All lobula giant neurons respond to visual motion, but they vary in morphology, number of elements within each class, capacity to integrate visual and propioceptive information from the legs, and other functional properties (Berón de Astrada and Tomsic, 2002; Sztarker and Tomsic, 2004; Medan et al., 2007). The combined activity of these wide-field elements is thought to operate as a decision making node for visually guided behaviors. Particularly, the system of the MLG1s may be involved in the directional control of different behaviors. For example, while running away from a translationally moving object, N. granulata can rise and point its claws directly against the stimulus. The defensive motor pattern is recruited more frequently when the translating stimulus moves at low elevation (Scarano and Tomsic, 2014). The decision of only running away from the stimulus or running plus pointing the claws toward it might be based on combined activation of MLG1 neurons with other motion-sensitive elements such as the BLG1, which respond differentially to objects moving at different elevations (Medan et al., 2007). To further understand the relationship between the activity of the lobula giant neurons and visually elicited behaviors, an identification of the specific postsynaptic targets of these neurons is warranted.
Comparative studies in arthropods
In insects, anatomically organized representations of visual space have been previously described for large tangential neurons involved in processing panoramic optic flow (Borst, 2014; Trousdale et al., 2014) and for neurons involved in coding the sky polarization compass (Heinze and Homberg, 2007). As for object motion, different cell classes known as male lobula giants have been described in male flies, but these are all sensitive to a restricted visual field area (Strausfeld, 1991; Trischler et al., 2007). To our knowledge, a representation of the whole visual field by neurons sensitive to object motion has not been hitherto described in any arthropod. Our combination of anatomical and physiological data shows that the azimuthal visual coordinates are mapped by the system of motion-sensitive MLG1 neurons of the lobula. These projecting elements convey information on object positions, likely in the form of population vectors, from the lobula to the midbrain, where it must be used in combination with information provided by the MLG1s from the other lobula to allow the accurate directional responses of which the animal is capable.
Footnotes
The work was supported by the Ministry of Science of Argentina (Grant PICT 2010-1016), The National Research Council of Argentina (Grant PIP GI11220120100170), and the University of Buenos Aires (Grant 2002 0130100583BA). We thank Lidia Szczupak for fruitful discussions and comments on previous versions of this manuscript and two anonymous reviewers for helpful input.
The authors declare no competing financial interests.
References
- Barnes WJP, Nalbach H-O. Eye movements in freely moving crabs: their sensory basis and possible role in flow-field analysis. Comparative Biochemistry and Physiology Part A: Physiology. 1993;104:675–693. [Google Scholar]
- Berón de Astrada M, Tomsic D. Physiology and morphology of visual movement detector neurons in a crab (Decapoda: Brachyura) J Comp Physiol A Neuroethol Sens Neural Behav Physiol. 2002;188:539–551. doi: 10.1007/s00359-002-0328-4. [DOI] [PubMed] [Google Scholar]
- Berón de Astrada M, Medan V, Tomsic D. How visual space maps in the optic neuropils of a crab. J Comp Neurol. 2011;519:1631–1639. doi: 10.1002/cne.22612. [DOI] [PubMed] [Google Scholar]
- Berón de Astrada M, Bengochea M, Medan V, Tomsic D. Regionalization in the eye of the grapsid crab Neohelice granulata (Chasmagnathus granulatus): variation of resolution and facet diameters. J Comp Physiol A Neuroethol Sens Neural Behav Physiol. 2012;198:173–180. doi: 10.1007/s00359-011-0697-7. [DOI] [PubMed] [Google Scholar]
- Berón de Astrada M, Bengochea M, Sztarker J, Delorenzi A, Tomsic D. Behaviorally related neural plasticity in the arthropod optic lobes. Curr Biol. 2013;23:1389–1398. doi: 10.1016/j.cub.2013.05.061. [DOI] [PubMed] [Google Scholar]
- Borst A. Fly visual course control: behaviour, algorithms and circuits. Nat Rev Neurosci. 2014;15:590–599. doi: 10.1038/nrn3799. [DOI] [PubMed] [Google Scholar]
- Borst A, Weber F. Neural action fields for optic flow based navigation: a simulation study of the fly lobula plate network. PLoS One. 2011;6:e16303. doi: 10.1371/journal.pone.0016303. [DOI] [PMC free article] [PubMed] [Google Scholar]
- Dewell RB, Gabbiani F. Escape behavior: linking neural computation to action. Curr Biol. 2012;22:R152–R153. doi: 10.1016/j.cub.2012.01.034. [DOI] [PubMed] [Google Scholar]
- Fotowat H, Gabbiani F. Relationship between the phases of sensory and motor activity during a looming-evoked multistage escape behavior. J Neurosci. 2007;27:10047–10059. doi: 10.1523/JNEUROSCI.1515-07.2007. [DOI] [PMC free article] [PubMed] [Google Scholar]
- Georgopoulos AP, Schwartz AB, Kettner RE. Neuronal population coding of movement direction. Science. 1986;233:1416–1419. doi: 10.1126/science.3749885. [DOI] [PubMed] [Google Scholar]
- Gonzalez-Bellido PT, Peng H, Yang J, Georgopoulos AP, Olberg RM. Eight pairs of descending visual neurons in the dragonfly give wing motor centers accurate population vector of prey direction. Proc Natl Acad Sci U S A. 2013;110:696–701. doi: 10.1073/pnas.1210489109. [DOI] [PMC free article] [PubMed] [Google Scholar]
- Gronenberg W, Strausfeld NJ. Descending pathways connecting the male-specific visual system of flies to the neck and flight motor. J Comp Physiol A. 1991;169:413–426. doi: 10.1007/BF00197654. [DOI] [PubMed] [Google Scholar]
- Heinze S, Homberg U. Maplike representation of celestial E-vector orientations in the brain of an insect. Science. 2007;315:995–997. doi: 10.1126/science.1135531. [DOI] [PubMed] [Google Scholar]
- Hemmi JM, Tomsic D. The neuroethology of escape in crabs: from sensory ecology to neurons and back. Curr Opin Neurobiol. 2012;22:194–200. doi: 10.1016/j.conb.2011.11.012. [DOI] [PubMed] [Google Scholar]
- Karmeier K, Krapp HG, Egelhaaf M. Population coding of self-motion: applying bayesian analysis to a population of visual interneurons in the fly. J Neurophysiol. 2005;94:2182–2194. doi: 10.1152/jn.00278.2005. [DOI] [PubMed] [Google Scholar]
- Kuffler SW. Discharge patterns and functional organization of mammalian retina. J Neurophysiol. 1953;16:37–68. doi: 10.1152/jn.1953.16.1.37. [DOI] [PubMed] [Google Scholar]
- Land M, Layne J. The visual control of behaviour in fiddler crabs. J Comp Physiol A Neuroethol Sens Neural Behav Physiol. 1995;177:91–103. doi: 10.1007/BF00243401. [DOI] [Google Scholar]
- Lennie P. Single units and visual cortical organization. Perception. 1998;27:889–935. doi: 10.1068/p270889. [DOI] [PubMed] [Google Scholar]
- Levi R, Camhi JM. Population vector coding by the giant interneurons of the cockroach. J Neurosci. 2000;20:3822–3829. doi: 10.1523/JNEUROSCI.20-10-03822.2000. [DOI] [PMC free article] [PubMed] [Google Scholar]
- Lewis JE, Kristan WB., Jr A neuronal network for computing population vectors in the leech. Nature. 1998;391:76–79. doi: 10.1038/34172. [DOI] [PubMed] [Google Scholar]
- Lindemann JP, Egelhaaf M. Texture dependence of motion sensing and free flight behavior in blowflies. Front Behav Neurosci. 2012;6:92. doi: 10.3389/fnbeh.2012.00092. [DOI] [PMC free article] [PubMed] [Google Scholar]
- Medan V, Oliva D, Tomsic D. Characterization of lobula giant neurons responsive to visual stimuli that elicit escape behaviors in the crab Chasmagnathus. J Neurophysiol. 2007;98:2414–2428. doi: 10.1152/jn.00803.2007. [DOI] [PubMed] [Google Scholar]
- Nalbach H-O. Visually elicited escape in crabs. In: Wiese K, Krent WD, Tautz J, Reichert H, Mulloney B, editors. Frontiers in crustacean neurobiology. Basel: Birkhauser Verlag; 1990. pp. 165–172. [Google Scholar]
- Nordström K, Barnett PD, O'Carroll DC. Insect detection of small targets moving in visual clutter. PLoS Biol. 2006;4:e54. doi: 10.1371/journal.pbio.0040054. [DOI] [PMC free article] [PubMed] [Google Scholar]
- Oliva D, Tomsic D. Visuo-motor transformations involved in the escape response to looming stimuli in the crab Neohelice (Chasmagnathus) granulata. J Exp Biol. 2012;215:3488–3500. doi: 10.1242/jeb.070755. [DOI] [PubMed] [Google Scholar]
- Oliva D, Tomsic D. Computation of object approach by a system of visual motion-sensitive neurons in the crab Neohelice. J Neurophysiol. 2014;112:1477–1490. doi: 10.1152/jn.00921.2013. [DOI] [PubMed] [Google Scholar]
- Oliva D, Medan V, Tomsic D. Escape behavior and neuronal responses to looming stimuli in the crab Chasmagnathus granulatus (Decapoda: Grapsidae) J Exp Biol. 2007;210:865–880. doi: 10.1242/jeb.02707. [DOI] [PubMed] [Google Scholar]
- Rosner R, Homberg U. Widespread sensitivity to looming stimuli and small moving objects in the central complex of an insect brain. J Neurosci. 2013;33:8122–8133. doi: 10.1523/JNEUROSCI.5390-12.2013. [DOI] [PMC free article] [PubMed] [Google Scholar]
- Salzman CD, Newsome WT. Neural mechanisms for forming a perceptual decision. Science. 1994;264:231–237. doi: 10.1126/science.8146653. [DOI] [PubMed] [Google Scholar]
- Scarano F, Tomsic D. Escape response of the crab Neohelice to computer generated looming and translational visual danger stimuli. J Physiol Paris. 2014;108:141–147. doi: 10.1016/j.jphysparis.2014.08.002. [DOI] [PubMed] [Google Scholar]
- Silies M, Gohl DM, Clandinin TR. Motion-detecting circuits in flies: coming into view. Annu Rev Neurosci. 2014;37:307–327. doi: 10.1146/annurev-neuro-071013-013931. [DOI] [PubMed] [Google Scholar]
- Simmons PJ. Connexions between a movement-detecting visual interneurone and flight motoneurones of a locust. J Exp Biol. 1980;86:87–97. [Google Scholar]
- Strausfeld NJ. Structural organization of male-specific visual neurons in calliphorid optic lobes. J Comp Physiol A. 1991;169:379–393. doi: 10.1007/BF00197652. [DOI] [PubMed] [Google Scholar]
- Strausfeld NJ. Brain organization and the origin of insects: an assessment. Proc Biol Sci. 2009;276:1929–1937. doi: 10.1098/rspb.2008.1471. [DOI] [PMC free article] [PubMed] [Google Scholar]
- Sztarker J, Tomsic D. Binocular visual integration in the crustacean nervous system. J Comp Physiol A Neuroethol Sens Neural Behav Physiol. 2004;190:951–962. doi: 10.1007/s00359-004-0551-2. [DOI] [PubMed] [Google Scholar]
- Sztarker J, Tomsic D. Neuronal correlates of the visually elicited escape response of the crab Chasmagnathus upon seasonal variations, stimuli changes and perceptual alterations. J Comp Physiol A Neuroethol Sens Neural Behav Physiol. 2008;194:587–596. doi: 10.1007/s00359-008-0333-3. [DOI] [PubMed] [Google Scholar]
- Sztarker J, Tomsic D. Brain modularity in arthropods: individual neurons that support “what” but not “where” memories. J Neurosci. 2011;31:8175–8180. doi: 10.1523/JNEUROSCI.6029-10.2011. [DOI] [PMC free article] [PubMed] [Google Scholar]
- Sztarker J, Strausfeld NJ, Tomsic D. Organization of optic lobes that support motion detection in a semiterrestrial crab. J Comp Neurol. 2005;493:396–411. doi: 10.1002/cne.20755. [DOI] [PMC free article] [PubMed] [Google Scholar]
- Tomsic D, Berón de Astrada M, Sztarker J. Identification of individual neurons reflecting short- and long-term visual memory in an arthropodo. J Neurosci. 2003;23:8539–8546. doi: 10.1523/JNEUROSCI.23-24-08539.2003. [DOI] [PMC free article] [PubMed] [Google Scholar]
- Trischler C, Boeddeker N, Egelhaaf M. Characterisation of a blowfly male-specific neuron using behaviourally generated visual stimuli. J Comp Physiol A Neuroethol Sens Neural Behav Physiol. 2007;193:559–572. doi: 10.1007/s00359-007-0212-3. [DOI] [PubMed] [Google Scholar]
- Trousdale J, Carroll SR, Gabbiani F, Josić K. Near-optimal decoding of transient stimuli from coupled neuronal subpopulations. J Neurosci. 2014;34:12206–12222. doi: 10.1523/JNEUROSCI.2671-13.2014. [DOI] [PMC free article] [PubMed] [Google Scholar]
- Zeil J, Al-Mutairi M. The variation of resolution and of ommatidial dimensions in the compound eyes of the fiddler crab Uca lactea annulipes (Ocypodidae, Brachyura, Decapoda) J Exp Biol. 1996;199:1569–1577. doi: 10.1242/jeb.199.7.1569. [DOI] [PubMed] [Google Scholar]
- Zeil J, Zanker JM. A glimpse into crabworld. Vision Res. 1997;37:3417–3426. doi: 10.1016/S0042-6989(97)00106-5. [DOI] [PubMed] [Google Scholar]
- Zeil J, Nalbach G, Nalbach H-O. Spatial vision in a flat world: optical and neural adaptations in arthropods. In: Singh RN, Strausfeld NJ, editors. Neurobiology of sensory systems. New York: Springer; 1989. pp. 123–137. [Google Scholar]