

Abstract
The human temporoparietal junction (TPJ) is a topic of intense research. Imaging studies have identified TPJ activation in association with many higher-order functions such as theory-of-mind, episodic memory, and attention, causing debate about the distribution of different processes. One major challenge is the lack of consensus about the anatomical location and extent of the TPJ. Here, we address this problem using data-driven analysis to test the hypothesis that the bilateral TPJ can be parcellated into subregions. We applied independent component analysis (ICA) to task-free fMRI data within a local region around the bilateral TPJ, iterating the ICA at multiple model orders and in several datasets. The localized analysis allowed finer separation of processes and the use of multiple dimensionalities provided qualitative information about lateralization. We identified four subdivisions that were bilaterally symmetrical and one that was right biased. To test whether the independent components (ICs) reflected true subdivisions, we performed functional connectivity analysis using the IC coordinates as seeds. This confirmed that the subdivisions belonged to distinct networks. The right-biased IC was connected with a network often associated with attentional processing. One bilateral subdivision was connected to sensorimotor regions and another was connected to auditory regions. One subdivision that presented as distinct left- and right-biased ICs was connected to frontoparietal regions. Another subdivision that also had left- and right-biased ICs was connected to social or default mode networks. Our results show that the TPJ in both hemispheres hosts multiple neural processes with connectivity patterns consistent with well developed specialization and lateralization.
Keywords: cortical parcellation, inferior parietal lobule, probabilistic independent component analysis, resting-state functional connectivity, supramarginal and angular gyrus, temporoparietal junction cortex
Introduction
The role of the human temporoparietal junction (TPJ) is under debate (Carter and Huettel, 2013; Geng and Vossel, 2013; Kubit and Jack, 2013). It is activated by diverse processes such as theory-of-mind, empathy, attention, and episodic memory (Decety and Lamm, 2007; Cabeza et al., 2012), but how the different functions are distributed within the temporoparietal cortex is not known. In addition, there is little consensus on the anatomical location and extent of the TPJ. The label has been assigned to multiple loci in the inferior parietal lobule and superior and middle temporal cortex (for review, see Kubit and Jack, 2013), covering a large, heterogeneous portion of cortex. Better knowledge of temporoparietal functional anatomy would therefore significantly enhance our ability to study its functions. Resting-state studies have indicated the presence of three broad subdivisions of the right TPJ (Mars et al., 2012) and hemispheric differences in connectivity (Kucyi et al., 2012), but detailed information about TPJ organization is lacking, especially in the left hemisphere. The right TPJ has been given a prominent role in the literature because it is thought to play a larger role in a subset of known TPJ functions (Decety and Lamm, 2007; Geng and Vossel, 2013). Therefore, previous parcellation studies have excluded the left hemisphere and focused on regions around the right TPJ (Mars et al., 2012; Bzdok et al., 2013). In this study, we aimed to parcellate both the left and right TPJ based on local intrinsic neural activity, taking into account the connectivity between the two hemispheres. We used a systematic, data-driven approach to identify the spatial location of neural processes that were consistent across several study cohorts and scanner sites. We also expanded the studied region of cortex around the TPJ, compared with previous studies, to determine whether more subdivisions overlapping the TPJ could be resolved.
The TPJ has generally been studied using task-based fMRI paradigms, which depend on a priori assumptions about the time course of the studied process. One complementary approach is to use data-driven algorithms that separate the fMRI signal into distinct processes based on spatial and temporal properties of the data. One such method is independent component analysis (ICA), a blind source separation method that has been used widely to isolate intrinsic functional networks. ICA has also been used recently to parcellate the cortex into functional subunits in the task-free state (Kiviniemi et al., 2009; Allen et al., 2014). The sources extracted from fMRI data by ICA are thought to reflect intrinsic properties of the brain that are also relevant to task-related functions (Damoiseaux et al., 2006; Calhoun et al., 2008; Smith et al., 2009). A major advantage of ICA is that it separates BOLD time courses from nonneural signal sources, making it possible to study processes of interest in isolation from neighboring processes and noise signals.
We used a novel approach to ICA: an analysis focused locally on the region around the TPJ rather than a brain-wide analysis. ICA applied to the whole brain can suffer from the problem of the overcomplete case, which happens when the number of observations is smaller than the number of sources (Keck et al., 2006). This causes the ICA to bundle separate sources into single components (Keck et al., 2006), which can become an issue when ICA is used for cortical parcellation. We hypothesized that a more detailed decomposition of the TPJ can be achieved by applying ICA locally, within the bilateral temporoparietal cortex. Using such localized ICA, we mapped the different neural processes in the left and right TPJ spatially. Then, to determine whether independent components (ICs) reflected true functional subdivisions, we performed seed-based functional connectivity to map the brain-wide network involvement of the ICs. This approach provides new insights into the functional topography of the region and allows that topography to be further studied with behavioral tasks.
Materials and Methods
Subjects.
We used three independent datasets acquired at different sites by different researchers (Datasets A–C). Dataset A was acquired onsite and included 19 healthy subjects of both sexes (9 females, 10 males; age range 18–51 years, median 24). The study was approved by the Institutional Review Board of Princeton University and the subjects provided written consent. Datasets B and C were two independent publicly available datasets acquired at different sites and downloaded from the 1000 Functional Connectomes Project website (www.nitrc.org/ir; release names “Baltimore” and “SaintLouis” from investigators James J. Pekar/Stewart H. Mostofsky and Bradley L. Schlaggar/Steven E. Petersen, respectively). We labeled the dataset acquired at Baltimore Dataset B and dataset acquired at Saint Louis Dataset C. Both datasets were acquired at 3 tesla with the subject fixating on a central cross. See Table 1 for further details on data acquisition parameters.
Table 1.
Information about the datasets
| Label | n | Sex | Age | Field (T) | TR | No. of time points | Voxel size (mm) | No. of slices |
|---|---|---|---|---|---|---|---|---|
| Dataset A | 19 | 10M/9F | 18–51 | 3 | 2 | 156 | 3.00 × 3.00 × 3.00 | 35 |
| Dataset A2 | 19 | 10M/9F | 18–51 | 3 | 2 | 150 | 3.00 × 3.00 × 3.00 | 35 |
| Dataset B | 23 | 8M/15F | 20–40 | 3 | 2.5 | 123 | 2.67 × 2.67 × 3.00 | 47 |
| Dataset C | 31 | 14M/17F | 21–29 | 3 | 2.5 | 127 | 4.00 × 4.00 × 4.00 | 32 |
Shown are fMRI data acquisition parameters for all datasets used in the study. Datasets A and A2 were acquired on site from the same group of subjects. Datasets B and C were downloaded from the 1000 Functional Connectomes Project (see Materials and Methods).
MRI.
MRI images covering the whole cortex were acquired with a 20-channel receiver head coil on a Siemens Skyra scanner. Functional imaging used a gradient echo, echoplanar pulse sequence with a 64 × 64 matrix (35 axial slices, FOV 192 × 192 mm, TR 2 s, TE 30 ms, FA 77°; in-plane resolution 3 × 3 mm). Functional images were aligned with a high-resolution anatomical scan (MP-RAGE) taken at the end of the session (FOV 256 × 224 mm, TR 2.3 s, TE 2.98 ms, FA 9°, 256 × 224 matrix; 1 mm3 resolution). The fixation cross (central black cross on a light gray background) was created using the Psychophysics Toolbox version 3 for MATLAB (Brainard, 1997) and projected onto a translucent screen at the back of the scanner bore. The subjects viewed the cross through a mirror mounted on the head coil. Each subject underwent a 20 min resting-state scan, and the first 10 min of this scan was split into 2 5 min datasets that were labeled Datasets A and A2. The last 10 min of the scan were used for other studies.
Data preprocessing.
Preprocessing was done with AFNI (Cox, 1996) and FSL (Jenkinson et al., 2012). The functional data were slice time corrected and motion corrected with FSL (Jenkinson et al., 2002), detrended (linear and quadratic) with AFNI, and spatially normalized to FSL's MNI-152 template with AFNI. Single-session ICA was applied to each subject's unsmoothed functional data, and components that represented noise were regressed out using the FSL tool fsl_regfilt (Beckmann and Smith, 2004; Kelly et al., 2010). The following spatial or temporal features were considered to represent noise: (1) spatial association with white matter, ventricles, or background voxels; (2) a lack of cluster formation; (3) large spikes in the time course; (4) high-frequency noise; or (5) temporal saw-tooth patterns likely to reflect aliasing of cardiac or respiratory signals exceeding the Nyquist frequency. To ensure that all neural activity would remain untouched for local ICA on the group level, ICs that appeared to contain a mixture of noise and signal were not filtered out in the denoising step. The denoised data were finally spatially smoothed with a Gaussian kernel (FWHM 5 mm) and used for group analysis.
ICA.
On the group level, probabilistic ICA (temporal concatenation) was applied locally within the temporoparietal region of interest (see Fig. 1) using a region-of-interest mask defined at the group level in the space of the standard MNI-152 brain. ICA was applied using the MELODIC toolbox in FSL (Beckmann and Smith, 2004). This toolbox employs a probabilistic ICA model designed to prevent overfitting and allow for statistical significance testing by including a model of the Gaussian background noise (Beckmann and Smith, 2004). The temporoparietal mask (see Fig. 1) was constructed using the Harvard–Oxford probabilistic brain atlas and comprised the supramarginal gyrus, posterior superior temporal gyrus, posterior superior temporal sulcus, and angular gyrus. Voxels outside an anterior border at y = 16 mm and a ventral border at z = 0 mm were excluded. The mask was more extensive spatially than the TPJ to ensure inclusion of all relevant ICs.
Figure 1.

Temporoparietal region of interest. Shown is the bilateral region of interest used for local ICA. The mask was constructed using the Harvard–Oxford probabilistic brain atlas and comprised the supramarginal gyrus, posterior superior temporal gyrus, posterior superior temporal sulcus, and angular gyrus. The anterior border was at y = 16 mm and the ventral border was at z = 0 mm.
ICA is an increasingly popular technique for multivariate linear decomposition of fMRI signals into spatiotemporal processes reflecting neural signals and noise. Spatial ICA algorithms decompose the signal into a set of maximally independent spatial maps with associated time courses. On the whole-brain level, these ICs correspond to functional brain networks. In this study, the use of a localized mask allowed us to identify source processes within the TPJ in isolation from remote brain regions with which they may interact. This is an advantage because it removes the influence of dominant signals from regions such as the primary sensory cortices and allows for reproducible parcellation of the higher-order temporoparietal cortex.
The output of an ICA is determined by the a priori choice of the number of dimensions into which the data should be decomposed (also known as “model order”). For whole-brain ICA, the effect of this choice has been investigated in several studies (Abou-Elseoud et al., 2010; Allen et al., 2011; Ray et al., 2013). At low model orders (<20), most main resting-state networks can be resolved, but as the dimensionality increases, the networks break up in logical subparts and new relevant ICs can appear (Abou-Elseoud et al., 2010; Allen et al., 2011; Ray et al., 2013). For example, the default mode network presented as one IC at d = 10 and split into anterior and posterior ICs at high model orders and the striatum was only detected above model orders of 40 (Abou-Elseoud et al., 2010). Most studies examining resting-state networks in whole-brain data perform the analysis at one or two model orders. Although this is a valid approach for the most common applications, it has been argued that ICA should be iterated at multiple model orders when the underlying functional topography is unknown (Abou-Elseoud et al., 2010; Ray et al., 2013). In this study, we had no assumptions about the intrinsic dimensionality of the TPJ. Therefore, to reach a fuller understanding of the organization of the region, we performed an extensive iterative analysis at 49 different model orders (see below).
Functional data were subjected to voxelwise removal of the mean and normalization of the voxelwise variance. Whitening was applied to remove autocorrelations from the fMRI time series. Principal component analysis was used for dimensionality reduction and ICA was applied on temporally concatenated data (Beckmann and Smith, 2004). The IC maps were divided by the SD of the residual noise and thresholded using a Gaussian/gamma mixture model approach (alternative hypothesis test at p > 0.5; Beckmann and Smith, 2004). The IC maps are presented as thresholded z-scores. Spatial correlation analyses were performed on unthresholded probability maps derived from the mixture model.
For each dataset, the ICA was iteratively applied at dimensionalities (d) ranging from 2 to 50 in increments of 1, yielding 1274 unranked ICs per dataset (3822 ICs in total). Due to the complexity of the data, we first identified ICs of interest by comparing the output at d = 20 in the three datasets. ICs were excluded at this step if 1) they were not present in all three datasets, 2) their z-score peak was located outside or at the edge of the mask (giving it the appearance of being cutoff by the mask border), or 3) their z-score peak was inside the mask but in cortical areas that have never been labeled “TPJ” (intraparietal sulcus, postcentral sulcus, dorsoanterior supramarginal gyrus). This conservative approach might preclude discovery of some processes of interest or finer subdivisions at higher model orders, but it avoids false positives that may result from the inherent variability of the ICA method.
The reproducibility of the resulting set of ICs across the 49 model orders was tracked using spatial cross-correlation coefficients of the unthresholded probability maps, combined with visual inspection. Thresholded z-score maps (z > 2.3) were projected onto the N27 MNI standard brain using AFNI and SUMA (http://afni.nimh.nih.gov/afni/suma) for illustration. Previous studies have shown that, as the model order increases, ICs show a gradual increase in statistical z-scores and a decrease in volume, plausibly reflecting increasing spatial specificity of the ICA output at higher dimensionalities (Abou-Elseoud et al., 2010). These trends remained up to dimensionalities of >100, above which the ICA became less reproducible (Abou-Elseoud et al., 2010). We used these metrics (maximum z-score and volume of thresholded ICs) to provide an indication of cluster stability across model orders.
We used the IC branching point (the model order at which a bilateral IC splits into two symmetrical unilateral ICs; see Results) as a qualitative indication of how strong the interhemispheric connectivity may be between contralateral TPJ subdivisions. Different clusters of voxels within an IC are said to be connected functionally and are regarded as different components of one functional network. This also applies for ICA within a local region such as the temporoparietal cortex, where functionally connected areas may appear as one IC. As the dimensionality is raised, the likelihood of separation into disparate ICs increases. If two cortical regions remain within the same IC even at high dimensionalities, then that could be tentatively interpreted as a more robust connectivity.
Functional connectivity.
Seed-to-voxel connectivity (Biswal et al., 1995) was analyzed using bivariate correlation as implemented in the CONN toolbox 14.0 for SPM (http://www.nitrc.org/projects/conn; Whitfield-Gabrieli and Nieto-Castanon, 2012). For each IC [right anterior TPJ (TPJa-R), left TPJa (TPJa-L), right posterior TPJ (TPJp-R), left TPJp (TPJp-L), right dorsal TPJ (TPJd-R), left TPJd (TPJd-L), right ventral TPJ (TPJv-R), left TPJv (TPJv-L), and central TPJ, (TPJc)], the appropriate seed coordinates were determined by calculating the center-of-mass of the regions shown in Figure 2D (d = 20). To avoid applying this analysis to voxels that had already been analyzed with ICA, an independent dataset (Dataset A2) was used. BOLD time courses were extracted from a spherical seed (5 mm radius) centered on the IC coordinates. For ICs that were bilateral at d = 20 but split into unilateral ICs at higher model orders, one seed per hemisphere was used. In second-level analysis, each seed was analyzed separately. A voxelwise threshold of p < 0.001 uncorrected and a cluster extent threshold of p < 0.05 FDR corrected were used. Data were smoothed with an 8 mm FWHM Gaussian kernel.
Figure 2.
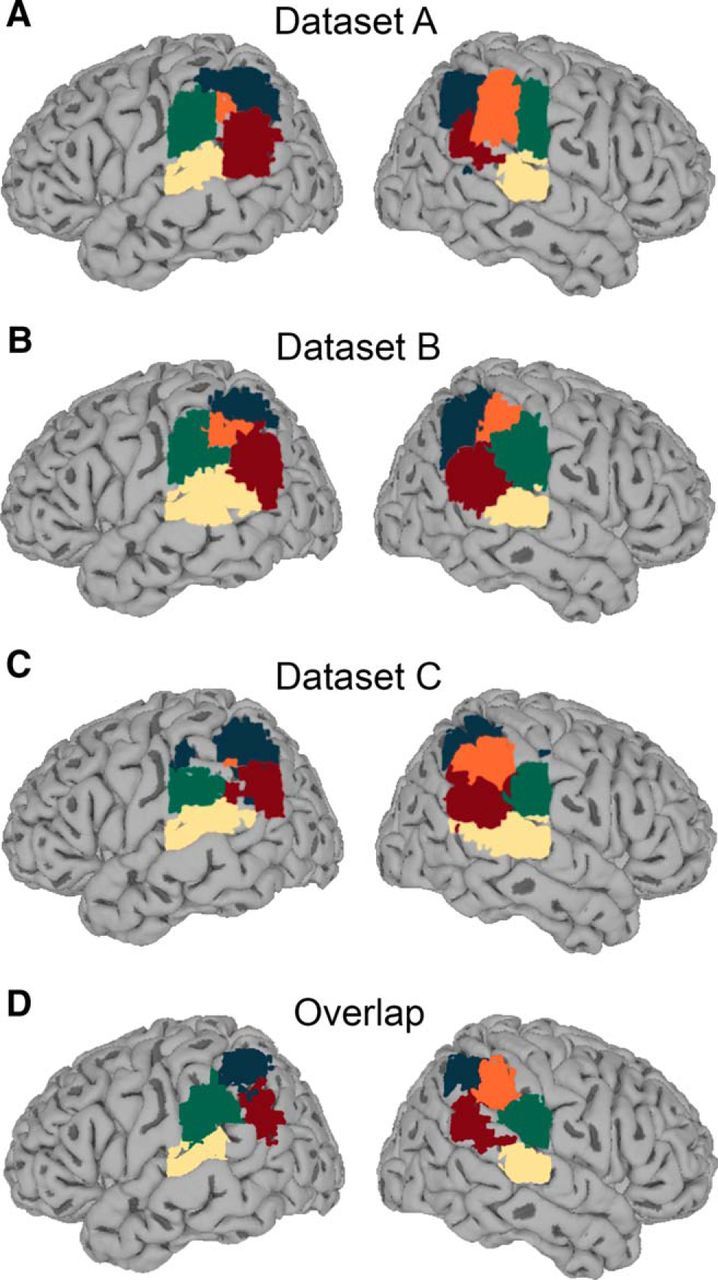
Summary maps of temporoparietal functional organization. A–C, Winner-take-all maps of the TPJ components found at a model order of 20. Maps were computed separately for the three independent datasets (Datasets A–C) by assigning each voxel to the IC with the highest z-score in that voxel (“winner-take-all maps”; Meier et al., 2008). D, Overlap of IC location across datasets. For each of the five ICs, the area of overlap between Datasets A–C was calculated and plotted on the brain surface. Dark blue, TPJd; light yellow, TPJv; green, TPJa; red, TPJp; orange, TPJc. Color coding is based on symmetry, bilaterality at low model orders in the same dataset, or bilaterality of equivalent ICs in other datasets (see Results).
Results
The goal of an ICA algorithm is to separate the fMRI signal into a number of maximally independent sources, each with a unique time course and spatial distribution. The method assumes that the fMRI signal is a linear mixture of unknown biological and noise source processes, and these processes are extracted to provide information on the functional topography of the brain or to study their time courses in relation to tasks (Bartels and Zeki, 2004; Kiviniemi et al., 2009). Group probabilistic ICA was applied within a bilateral masked region around the TPJ (Fig. 1; see Materials and Methods for details). We applied the analysis separately to three independent resting-state fMRI datasets (Dataset A, n = 19; Dataset B, n = 23; and Dataset C, n = 31; see Table 1 and Materials and Methods for details) using the MELODIC software implemented in FSL (Beckmann and Smith, 2004).
The output of ICA is influenced by the choice of how many components the data will be decomposed into (dimensionality or model order, d). Although useful methods for estimating intrinsic dimensionality in fMRI data have been developed (Beckmann and Smith, 2004), they do not provide exact answers and can cause oversplitting, especially when the data are smoothed (Li et al., 2007; Majeed and Avison, 2014). Networks that are resolved by low-dimensionality ICA tend to fractionate into plausible subparts when the dimensionality is increased (Abou-Elseoud et al., 2010; Allen et al., 2011; Ray et al., 2013), indicating that the changes observed across model orders reflect brain physiology rather than methodological artifacts. It has been argued that, in order to fully understand intrinsic connectivity and topographic organization, ICA should be iterated at multiple model orders (Ray et al., 2013). In whole-brain fMRI data, ICs have been reported to have a detection point (the dimensionality at which the IC first appears) as well as a branching point (the point at which it “splits” into two or more subdivisions) (Abou-Elseoud et al., 2010). We therefore expected that bilaterally symmetrical clusters with related functions might show up as one bilateral IC at low model orders and branch into separate lateralized ICs at higher model orders. In this way, the branching point may carry qualitative information about the degree of independence of processes in the left versus right hemispheres (see Materials and Methods). Because we had no prior knowledge of data dimensionality, we performed the local ICA over a large range of model orders (from d = 2 to d = 50, in increments of 1), with the aim of covering all possibly relevant model orders (Abou-Elseoud et al., 2010; Ray et al., 2013).
Our central assumption was that, if an IC appears with great spatial similarity over several model orders and in several independent datasets, it is highly likely to reflect a biologically significant source process. ICA is sometimes criticized for its sensitivity to small variations in the data, which can cause spurious components to be isolated. Its reliance on a more or less subjective choice of model order renders it vulnerable to effects of dimensionality reduction. The use of temporal concatenation of data from multiple subjects can potentially bias the results toward signals that only exist in one or few of the subjects. Last, the use of random seeds in the algorithm causes otherwise identical ICAs to return slightly different results. By using multiple model orders, we minimized the influence of the choice of model order on the final conclusions. By using three independent datasets, we avoided the issues associated with temporal concatenation. By iterating the ICA across many dimensionalities, we also removed the risk that an outlier in the random seed generation affects the overall results. These choices greatly limited the risk of obtaining false positives, but also somewhat decreased our ability to resolve smaller or more variable subdivisions of the TPJ. We therefore do not aim to make strong inferences about the exact number of subdivisions of the temporoparietal cortex. However, this exploratory approach identifies the location of the most robust functional components present in the human TPJ region at rest.
Subdivisions of the bilateral temporoparietal cortex
There are currently no established methodological approaches for interpretation of the large number of unranked IC maps (3822 maps in this study) resulting from iterating ICA at multiple model orders (Abou-Elseoud et al., 2010; Ray et al., 2013). We therefore first constrained the analysis by identifying ICs present in all three datasets at d = 20 using spatial cross-correlation analysis of probability maps combined with visual inspection (Materials and Methods). Eleven to 13 ICs per dataset were located around the edges of the masked region and were excluded (e.g., intraparietal sulcus, postcentral sulcus, dorsoanterior supramarginal gyrus, and superior temporal sulcus at the ventral border of the mask; see Materials and Methods). Most of the remaining ICs could be matched across the three datasets. The three datasets showed some differences in the degree of lateralization of ICs at d = 20; some components that were present as two lateralized sources in one dataset could be present as one bilateral IC in another. As described below, this observation reflected small differences in branching points of the ICs.
Taking together the findings common to all three datasets, the TPJ showed four symmetrical pairs of signal sources and one that was right biased. The coordinates of the z-score peaks of the IC maps are shown in Table 2. To illustrate the general topography of the region in each of the three datasets, we constructed winner-take-all maps by assigning each voxel in the field of view to the IC with the highest z-score at that voxel (Meier et al., 2008; Fig. 2A–C). In Figure 2D, we show the regions of overlap across the three datasets for each of the components. Both approaches illustrate the similarity of the topographic maps across the three datasets. The anatomical locations of the five signal sources were as follows: (1) angular gyrus (TPJd; dark blue in Fig. 2), (2) posterior superior temporal gyrus (TPJv; light yellow in Fig. 2), (3) anterior supramarginal gyrus (TPJa; green in Fig. 2), (4) right central supramarginal gyrus (TPJc; orange in Fig. 2), and (5) intersection between the posterior superior temporal and ventral parietal lobes (TPJp; red in Fig. 2). These ICs will be described under separate subheadings below.
Table 2.
Coordinates of z-score peak of independent components
| Dataset A |
Dataset B |
Dataset C |
||||||||||
|---|---|---|---|---|---|---|---|---|---|---|---|---|
| d | x | y | z | d | x | y | z | d | x | y | z | |
| TPJd-R | 20 | +48 | −57 | +45 | 20 | +45 | −60 | +51 | 20 | +45 | −54 | +54 |
| TPJd-L | 20 | −54 | −54 | +48 | 20 | −45 | −51 | +54 | 20 | −42 | −57 | +48 |
| TPJv-R | 20 | +66 | −24 | +9 | 20 | +66 | −21 | +6 | 20 | +63 | −39 | +6 |
| TPJv-L | 20 | −60 | −33 | +15 | 20 | −63 | −36 | +15 | 20 | −60 | −30 | +12 |
| TPJa-R | 20 | +60 | −30 | +18 | 20 | +60 | −30 | +27 | 20 | +60 | −24 | +27 |
| TPJa-L | 20 | −63 | −36 | +21 | 20 | −63 | −24 | +30 | 20 | −63 | −27 | +24 |
| TPJc | 20 | +60 | −36 | +39 | 20 | +51 | −42 | +39 | 20 | +57 | −45 | +36 |
| TPJp-R | 30 | +60 | −51 | +15 | 20 | +63 | −51 | +15 | 20 | +63 | −48 | +24 |
| TPJp-L | 30 | −60 | −54 | +24 | 20 | −60 | −57 | +21 | 20 | −54 | −60 | +24 |
TPJd-L and TPJd-R: lateralized signal sources with frontoparietal connections
TPJd was located in the dorsal angular gyrus (Fig. 3). It appeared as a bilateral IC at a very low model order of d = 2 in all three datasets and branched into right and left lateralized ICs at d = 5–6 (TPJd-R and TPJd-L, respectively; Fig. 3A–C). The IC volume decreased and the mean z-score increased up to a model order of about 25, above which these properties stabilized (Fig. 3D, Dataset A). The spatial cross-correlation coefficient between each pair of ICs over consecutive model orders (d = 2 vs 3, 3 vs 4, etc., up to d = 49 vs 50) is plotted as a function of dimensionality in Figure 3D, bottom. The majority of correlation coefficients were between r = 0.8 and 1.0 and mainly dropped around the branching point, demonstrating the spatial stability of TPJd across ICA decompositions. At a few model orders, correlation coefficients were lower (r = 0.35–0.8), but these values still reflect a significant correlation and the ICs were similar on visual inspection. There is an inherent instability in the ICA method caused by the random nature of ICA starting parameters, causing the output to vary slightly between different iterations of the same analysis even at the same model order. Therefore, the occasional variation in correlation is expected.
Figure 3.

TPJd component. A, Location of TPJd in the angular gyrus in Dataset A. Significant voxels at model orders of 5, 10, 20, and 30 are shown in dark blue on a standard surface. TPJd branched into two lateralized components, TPJd-L and TPJd-R, at d = 6. B, Example of TPJd-R and TPJd-L in Dataset B at d = 20. C, Example of TPJd-R and TPJd-L in Dataset C at d = 20. D, Top and middle, Cluster volume and max z-score, respectively, as a function of model order in Dataset A. Bottom, Spatial correlation of TPJd across consecutive model orders. The spatial correlation coefficient was calculated between pairs of IC probability maps (model order x vs x+ 1 for x = 2–49). The dashed line shows the branching point.
The existence of TPJd in three independent datasets and its bilaterality at low model orders unequivocally shows that this IC is of neural origin rather than representing structured noise in the fMRI signal. To further investigate the TPJd, we studied the brain-wide connectivity of TPJd-R and TPJd-L using a second dataset acquired from the subjects used for Dataset A (Dataset A2). We performed seed-based functional connectivity analysis (“seed-based FC”; CONN toolbox for SPM; Materials and Methods) using a spherical seed (5 mm radius) centered on the coordinates of the center of mass of the cluster corresponding to the region of overlap between the three datasets (Fig. 2D; Whitfield-Gabrieli and Nieto-Castanon, 2012). Seed-based FC calculates the temporal correlation between the BOLD signal within a seed region and all other voxels in the brain, identifying remote regions that participate in the same functional network. TPJd-R and TPJd-L were found to be part of separate lateralized frontoparietal networks that were mirror images of each other (Fig. 4, left vs right). The networks included the ipsilateral inferior parietal lobule, ipsilateral middle and inferior frontal gyri, ipsilateral inferior temporal gyrus, and ipsilateral middle cingulate cortex/precuneus (Table 3). Contralaterally, smaller clusters were seen in a similar set of areas and TPJd-L was functionally connected to small clusters in the left insula and thalamus (Fig. 4, Table 3). These findings strongly suggest that this dorsal TPJ subdivision exists in both hemispheres and participates in homologous lateralized networks.
Figure 4.

Functional connectivity of TPJd-L and TPJd-R. Functional connectivity maps (thresholded β values) of TPJd-L (left) and TPJd-R (right) in Dataset A2. Color scale ranges from zero to the maximum β value.
Table 3.
Coordinates of clusters in seed-based connectivity analysis of TPJd-R and TPJd-L
| TPJ subregion | Anatomical location of cluster peaks | MNI coordinates of peak beta value (mm) | Cluster size (voxels) |
|---|---|---|---|
| TPJd-R | Right middle frontal gyrus | +46 +24 +48 | 10183 |
| Right inferior parietal lobule | +48 −52 +44 | 4146 | |
| Left angular gyrus | −42 −58 +38 | 2481 | |
| Left middle frontal gyrus | −36 +56 +8 | 2006 | |
| Right inferior temporal gyrus | +62 −24 −18 | 1709 | |
| Right precuneus | +6 −42 +36 | 1054 | |
| Right inferior frontal gyrus (p. Triangularis) | +54 +18 +8 | 783 | |
| Left inferior temporal gyrus | −58 −28 −20 | 255 | |
| Right precuneus | +6 −76 +38 | 219 | |
| TPJd-L | Left middle frontal gyrus | −38 +56 +8 | 9079 |
| Left inferior parietal lobule | −48 −52 +44 | 4645 | |
| Right middle frontal gyrus | +38 +30 +44 | 3156 | |
| Right inferior parietal lobule | +54 −46 +50 | 2974 | |
| Left inferior temporal gyrus | −56 −54 −18 | 1049 | |
| Left middle cingulate cortex | −2 −34 +44 | 410 | |
| Left thalamus | −4 −18 +14 | 158 | |
| Left insula lobe | −30 +20 +2 | 95 | |
| Right inferior temporal gyrus | +54 −48 −22 | 92 | |
| Left middle cingulate cortex | −2 −6 +32 | 74 | |
| Left precuneus | −2 −72 +42 | 69 |
Shown are the anatomical label (CA_N27_MA atlas) and MNI coordinates at the peak beta value of each statistically significant cluster.
TPJv: a bilateral signal source near auditory areas
TPJv was detected at low model orders in Datasets A–C (detection points of 4, 5, and 5, respectively), but its branching point was much higher than that of TPJd (d = 23, 19, and 26, respectively), indicating that there is strong connectivity between the two hemispheres (see Materials and Methods). Its z-score peak was located in the posterior superior temporal gyrus around the primary auditory cortex and Wernicke's area (Fig. 5A–C). TPJv was stably present up until the highest model order tested (d = 50; Fig. 5D). Seed-based FC analysis on Dataset A2 showed strong connectivity with superior temporal gyrus and insula, the precentral and postcentral gyri, and middle cingulate cortex (Fig. 6, Table 4). The connectivity networks resulting from seeds in left and right TPJv were very similar and were not clearly separated into the left and right connectivity networks (Fig. 6), indicating that TPJv is not very lateralized.
Figure 5.

TPJv component. A, Location of TPJv in the posterior superior temporal gyrus in Dataset A. Significant voxels at model orders of 5, 10, 20, and 30 are shown in light yellow on a standard surface. TPJv branched into two lateralized components, TPJv-L and TPJv-R, at d = 23. B, C, Examples of TPJv in Dataset B (B) and Dataset C (C) at d = 20. D, Top and middle, Cluster volume and max z-score, respectively, as a function of model order in Dataset A. Bottom, Spatial correlation of TPJv across consecutive model orders. The spatial correlation coefficient was calculated between pairs of IC probability maps (model order x vs x + 1 for x = 4–49). The dashed line shows the branching point.
Figure 6.

Functional connectivity of TPJv-L and TPJv-R Functional connectivity maps (thresholded β values) of TPJv-L (left) and TPJv-R (right) in Dataset A2. Color scale ranges from zero to the maximum β value.
Table 4.
Coordinates of clusters in seed-based connectivity analysis of TPJv-R and TPJv-L
| TPJ subregion | Anatomical location of cluster peaks | MNI coordinates of peak beta value (mm) | Cluster size (voxels) |
|---|---|---|---|
| TPJv-R | Right superior temporal gyrus | +60 −30 +6 | 10677 |
| Left superior temporal gyrus | −56 −26 +12 | 8681 | |
| Left postcentral gyrus | −26 −38 +78 | 731 | |
| Right middle cingulate cortex | +6 −16 +48 | 534 | |
| Right paracentral lobule | +8 −30 +80 | 111 | |
| TPJv-L | Right superior temporal gyrus | +62 −32 +12 | 10829 |
| Left superior temporal gyrus | −60 −36 +12 | 9928 | |
| Right precentral gyrus | +18 −32 +62 | 4146 | |
| Left middle occipital gyrus | −46 −80 +2 | 267 | |
| Right middle temporal gyrus | +42 −66 +2 | 222 | |
| Right parahippocampal gyrus | +28 0 −22 | 93 |
Shown are the anatomical label (CA_N27_MA atlas) and MNI coordinates at the peak beta value of each statistically significant cluster.
TPJa: a bilateral signal source connected to sensorimotor areas and insula
TPJa, located in the anterior ventral supramarginal gyrus (Fig. 7A–C), was detected at model orders of 8, 9, and 9 in Datasets A, B, and C, respectively, and branched at d = 19 in Dataset A, at d = 18 in Dataset B, and at d = 22 in Dataset C. Above the branching point, TPJa-R and TPJa-L were consistently present up to d = 50 (Fig. 7D). Seed-based FC of TPJa-R and TPJa-L in Dataset A2 revealed connections with each other, bilateral insula, and midline structures including parts of paracentral lobule, middle cingulate cortex, and precuneus (Fig. 8, Table 5). There were also clusters within superior parietal cortex, occipitotemporal junction, middle frontal gyrus and right thalamus (Fig. 8, Table 5). The connectivity of the left and right TPJa appeared very similar to each other (Fig. 8, left vs right), suggesting that they are not very lateralized.
Figure 7.

TPJa component. A, Location of TPJa in the anterior supramarginal gyrus in Dataset A. Significant voxels at model orders of 10, 20, and 30 are shown in green on a standard surface. TPJa branched into two lateralized components, TPJa-L and TPJa-R, at d = 19. B, Example of TPJa in Dataset B at d = 20. C, Example of TPJa in Dataset C at d = 20 and 30 (branching point was d = 22). D, Top and middle, Cluster volume and max z-score, respectively, as a function of model order in Dataset A. Bottom, Spatial correlation of TPJa across consecutive model orders. The spatial correlation coefficient was calculated between pairs of IC probability maps (model order x vs x + 1 for x = 8–49). The dashed line shows the branching point.
Figure 8.

Functional connectivity of TPJa-L and TPJa. Functional connectivity maps (thresholded β values) of TPJa-L (top) and TPJa-R (bottom) in Dataset A2. Color scale ranges from zero to the maximum β value.
Table 5.
Coordinates of clusters in seed-based connectivity analysis of TPJa-R and TPJa-L
| TPJ subregion | Anatomical location of cluster peaks | MNI coordinates of peak beta value (mm) | Cluster size (voxels) |
|---|---|---|---|
| TPJa-R | Right supramarginal gyrus | +60–30 +24 | 8519 |
| Left superior temporal gyrus | −50 −4 +2 | 7116 | |
| Left middle cingulate cortex | −6 −2 +42 | 5748 | |
| Left superior parietal lobule | −18 −50 +62 | 1912 | |
| Right inferior temporal gyrus | +48 −60 −4 | 238 | |
| Right cuneus | +16 −72 +32 | 187 | |
| Left middle temporal gyrus | −56 −68 +2 | 181 | |
| Right middle frontal gyrus | +48 −4 +56 | 161 | |
| Right thalamus | +10 −18 +6 | 157 | |
| TPJa-L | Left supramarginal gyrus | −60 −36 +30 | 7639 |
| Right superior parietal lobule | +18 −50 +66 | 6911 | |
| Right supramarginal gyrus | +56 −32 +30 | 5703 | |
| Left middle occipital gyrus | −54 −74 +12 | 360 | |
| Left inferior frontal gyrus (p. Orbitalis) | −26 +38 −12 | 221 | |
| Right thalamus | +6 −16 +2 | 221 | |
| Right middle orbital gyrus | +24 +36 −12 | 105 | |
| Right middle frontal gyrus | +42 +42 +18 | 100 |
Shown are the anatomical label (CA_N27_MA atlas) and MNI coordinates at the peak beta value of each statistically significant cluster.
TPJc: a right-biased signal source with connections to anterior insula and frontal cortex
TPJc, located in the central TPJ (posterior supramarginal gyrus), was detected at d = 3 in all datasets and was strongly right lateralized (Fig. 9A–C). In Datasets A and C, there was a dominant cluster in the right hemisphere and a smaller cluster in the left hemisphere (Figs. 2A,C, 9A,C). In Dataset B, TPJc was bilateral at d = 20 (Figs. 2B, 9B), but as the model order of the ICA increased, it became increasingly right dominant. At d = 10–14 in Dataset A, TPJc temporarily presented together with a large asymmetrically located cluster in the left hemisphere; cluster statistics were therefore not calculated for those dimensionalities (Fig. 9). The main TPJc cluster (right hemisphere) was functionally connected with the left supramarginal gyrus and a right-biased network including the anterior insula, middle and inferior frontal gyrus, precuneus, and others (Fig. 10, Table 6). A similar but left-biased IC was seen at some dimensionalities, but was not present in all datasets at d = 20 and was not fully reproducible across model orders; therefore, it was not considered as a stable source in this study.
Figure 9.

TPJc component. A, Location of TPJc in the posterior supramarginal gyrus in Dataset A. Significant voxels at model orders of 20 and 30 are shown in orange on a standard surface. B, C, Example of TPJc in Dataset B (B) and Dataset C (C) at d = 20. D, Top and middle, Cluster volume and max z-score, respectively, as a function of model order in Dataset A. Bottom, Spatial correlation of TPJc across consecutive model orders. The spatial correlation coefficient was calculated between pairs of IC probability maps (model order x vs x + 1 for x = 3–49). The dashed line shows the branching point.
Figure 10.

Functional connectivity of TPJc. Functional connectivity maps (thresholded β values) of TPJc in Dataset A2. Color scale ranges from zero to the maximum β value.
Table 6.
Coordinates of clusters in seed-based connectivity analysis of TPJc
| TPJ subregion | Anatomical location of cluster peaks | MNI coordinates of peak beta value (mm) | Cluster size (voxels) |
|---|---|---|---|
| TPJc | Right middle frontal gyrus | +40 +42 +32 | 6506 |
| Right supramarginal gyrus | +54 −42 +36 | 3523 | |
| Right precuneus | +10 −42 +48 | 1754 | |
| Left inferior parietal lobule | −60 −42 +38 | 1658 | |
| Right superior medial gyrus | +4 +34 +48 | 1265 | |
| Left middle frontal gyrus | −38 +42 +30 | 748 | |
| Left insula lobe | −38 +14 −4 | 339 | |
| Right inferior temporal gyrus | +60 −56 −10 | 251 | |
| Right insula lobe | +40 −12 −10 | 189 | |
| Right middle temporal gyrus | +64 −26 −6 | 138 | |
| Left middle orbital gyrus | −28 +42 −6 | 136 | |
| Left superior temporal gyrus | −38 −8 −12 | 108 |
Shown are the anatomical label (CA_N27_MA atlas) and MNI coordinates at the peak beta value of each statistically significant cluster.
TPJp: a lateralized signal source connected with superior temporal sulcus and precuneus
TPJp was located at the junction between the superior temporal and inferior parietal lobes, around the posterior superior temporal sulcus (STS; Fig. 11A–C). Compared with the TPJ subdivisions described above, which showed a high degree of consistency over a large number of decompositions, TPJp was more variable across model orders. It was, however, present in the majority of the model orders tested (Fig. 11D), strongly suggesting that it does represent a relevant neural signal. Bilaterality at low model orders was much less pronounced than for any of the other ICs, indicating a high degree of lateralization. In Dataset A, TPJp-R was detected at d = 13 and TPJp-L was detected at d = 14, but at d = 19–23, TPJp presented as a single bilateral IC (TPJp-R and TPJp-L are therefore shown at d = 30 in Fig. 11A). Similarly, in Dataset B, TPJp was detected at d = 14 as two lateralized ICs, but was bilateral at a range of model orders (d = 16–18) before branching into two lateralized ICs again. In Dataset C, TPJp-R appeared at d = 16 and TPJp-L at d = 15 and stayed lateralized at higher model orders. When TPJp appeared to be bilateral in Datasets A and B, it was left biased and highly spatially correlated with TPJp-L (r = 0.99 between TPJp-L at d = 18 and left-biased TPJp at d = 19 in Dataset A). This may suggest that TPJp-R was not resolved by the ICA in these decompositions and that the right-sided cluster in the bilateral IC was a smaller region functionally connected to TPJp-L. Test-retest variability is a known feature of ICA and can be addressed with repeatability measures such as ICASSO (Himberg et al., 2004), which may be useful in further studies. However, the presence of TPJp-R and TPJp-L in three datasets at most of the dimensionalities tested strongly argues for functional relevance of this signal source.
Figure 11.

TPJp components TPJp-R and TPJp-L. A, Location of TPJp-L and TPJp-R at the posterior superior temporal gyrus and ventral inferior parietal lobule in Dataset A. Significant voxels at a model order of 30 are shown in red on a standard surface. B, C, Example of TPJp in Dataset B (B) and Dataset C (C) at d = 20. D, Top and middle, Cluster volume and max z-score, respectively, as a function of model order in Dataset A. Bottom, Spatial correlation of TPJp across consecutive model orders. The spatial correlation coefficient was calculated between pairs of IC probability maps (model order x vs x + 1 for x = 13–49). The dashed line shows the branching point.
Seeds placed at the center of TPJp-R or TPJp-L showed correlations mainly with the ipsilateral STS, contralateral TPJp/STS, precuneus, middle/inferior temporal gyrus, and several frontal regions (Fig. 12, Table 7). The connectivity maps of left and right TPJp were almost mirror images of each other (Fig. 12, left vs right).
Figure 12.

Functional connectivity of TPJp-L and TPJp-R. Functional connectivity maps (thresholded β values) of TPJp-L (left) and TPJp-R (right) in Dataset A2. Color scale ranges from zero to the maximum β value.
Table 7.
Coordinates of clusters in seed-based connectivity analysis of TPJp-R and TPJp-L
| TPJ subregion | Anatomical location of cluster peaks | MNI coordinates of peak beta value (mm) | Cluster size (voxels) |
|---|---|---|---|
| TPJp-R | Right supramarginal gyrus | +60 −44 +24 | 5027 |
| Right inferior frontal gyrus (p. Orbitalis) | +48 +30 +2 | 2873 | |
| Right precuneus | +10 −52 +50 | 1657 | |
| Left supramarginal gyrus | −54 −42 +26 | 1587 | |
| Right middle frontal gyrus | +30 +42 +38 | 1078 | |
| Left temporal pole | −48 +14 −4 | 842 | |
| Right precentral gyrus | +40 0 +48 | 524 | |
| Right SMA | +12 +14 +62 | 511 | |
| Left middle frontal gyrus | −30 +38 +30 | 323 | |
| Right middle cingulate cortex | +6 −18 +42 | 227 | |
| Right middle cingulate cortex | +8 +18 +32 | 87 | |
| Right inferior temporal gyrus | +46 0 −40 | 78 | |
| TPJp-L | Left superior medial gyrus | −4 +34 +54 | 5809 |
| Left supramarginal gyrus | −54 −54 +26 | 5487 | |
| Left precuneus | −12 −54 +30 | 1185 | |
| Right angular gyrus | +56 −60 +30 | 1138 | |
| Left middle frontal gyrus | −42 +8 +56 | 1055 | |
| Right middle temporal gyrus | +62 −32 0 | 691 | |
| Right inferior temporal gyrus | +46 0 −34 | 514 |
Shown are the anatomical label (CA_N27_MA atlas) and MNI coordinates at the peak beta value of each statistically significant cluster.
Discussion
We have shown that the temporoparietal cortex under task-free conditions contains several functional subdivisions with connections to distinct networks. We compared this parcellation in the left and right hemispheres. In some ways, the left and right TPJ were symmetric, but some lateralization was also found. Two of the subdivisions were connected to auditory and sensorimotor areas, and showed considerable bilaterality (TPJv and TPJa; Figs. 6, 8). Subdivisions that were part of frontoparietal and STS/precuneus networks could be further subdivided into lateralized left and right components (TPJd and TPJp; Figs. 4, 12). A subdivision connected to inferior frontal and insular regions was right biased (Fig. 10).
Network involvement of temporoparietal subdivisions
The seed-based FC analysis showed that TPJ subdivisions found by local ICA were functionally connected to distinct brain-wide networks, strongly supporting the validity of our parcellation approach. The frontoparietal networks involving TPJd (Fig. 4) are similar to a highly lateralized network reported in previous ICA-based resting-state studies, and present as two mirror-symmetrical networks (Damoiseaux et al., 2006; Allen et al., 2011). Although it is sometimes labeled as an attention network (Allen et al., 2011), it is distinct from the dorsal and ventral attention systems and has been suggested to be involved in executive control (Vincent et al., 2008). A study looking at the structural connectivity of the right TPJ found a dorsal cluster with connections to a similar set of frontoparietal regions (Mars et al., 2012). Our results suggest that an equivalent subdivision exists in the left hemisphere (TPJd-L). The lateralization at low model orders in local ICA and the relatively separate, bilaterally symmetric connectivity patterns of TPJd-R and TPJd-L supports this division into left and right subregions.
TPJv was part of a network containing bilaterally symmetrical regions around the auditory cortex, insula, middle cingulate cortex, and precentral and postcentral cortex (Fig. 6). A similar network consisting of bilateral superior temporal cortex together with one or more of the insula, middle cingulate, and sensorimotor cortex, is commonly reported in resting-state studies as an “auditory network” (Damoiseaux et al., 2006; Allen et al., 2011).
TPJc, the one component that was right biased, had a pattern of functional connectivity that included some cortical midline structure, frontal cortex, and the most anterior parts of the insula (Fig. 9). The network involving TPJc was similar to the ventral attention network described previously (Corbetta et al., 2008; Kucyi et al., 2012). The ventral attention network is considered to include the right TPJ, together with ventral frontal regions such as the middle and inferior frontal cortex and the anterior insula (Corbetta et al., 2008). This network is activated during reorienting to unattended targets and by changes in the quality of sensory stimuli of several modalities (Corbetta et al., 2000; Downar et al., 2000). The location and connectivity of TPJc further resembles a cluster in the anterior right TPJ found to be structurally connected to attention networks (Mars et al., 2012). The properties of TPJc may thus be consistent with a role in attentional systems.
As described in the Results section, we sometimes observed a left-sided TPJc-like component that did not fulfill our strict inclusion criteria. The existence of a left-lateralized attention network involving inferior frontal lobe and left TPJ was suggested recently and was proposed to process contextual knowledge about a target to control attentional processing (DiQuattro and Geng, 2011). Regardless of the exact roles of the left and right TPJ, our results support a lateralization of function and connectivity patterns in the central TPJ.
TPJa showed some similarities in its connectivity to TPJc, with clusters in the insula and cortical midline structures (Figs. 8, 9). However, TPJa was more strongly connected with the posterior insula and midline motor areas such as the paracentral lobule, whereas TPJc was uniquely connected to the frontal cortex and the most anterior parts of the insula.
The pattern of connectivity of TPJp resembles a set of areas activated in theory-of-mind tasks (Gallagher et al., 2000; Saxe and Wexler, 2005) and is similar to the default mode network, which is most active during introspective tasks or at rest (Buckner et al., 2008). Mars et al. (2012) reported a posterior TPJ cluster in the right hemisphere with a set of connections similar to those reported here. Both the left and the right TPJ have been found to activate during different types of social tasks, but it has been suggested that the right TPJ is involved specifically in the processing of other people's minds, whereas the left TPJ may be involved more broadly in processing social information (Saxe and Wexler, 2005). Our results showing two mirrored networks with reciprocal connections are consistent with related but distinct functions of the TPJp-L and TPJp-R.
Localization of functions in the TPJ
Some studies have suggested a more posterior location of social processes in the right TPJ compared with attentional functions (Carter and Huettel, 2013; Geng and Vossel, 2013; Kubit and Jack, 2013). The posterior location of TPJp compared with TPJc and the connectivity patterns resembling social versus attentional networks may suggest that local ICA might be able to separate these two often-studied processes within the TPJ. ICA is increasingly used for task-based studies and has been found to be more sensitive than traditional general linear model (GLM) analysis in detecting functional activations (Tie et al., 2008). By extracting statistically independent and sometimes spatially overlapping signal sources, ICA can in part overcome the noisy nature of fMRI data and separate the different temporal processes that may occur simultaneously within each voxel. The IC time courses have a high signal-to-noise ratio because they are largely separated from the background noise. It is theoretically possible that previous discrepancies in the literature (Decety and Lamm, 2007; Mitchell, 2008; Scholz et al., 2009; Kubit and Jack, 2013) are related to an inability of the GLM to detect overlapping or weak signals. It is possible that ICA may be able to help address these issues in future experiments.
TPJ activity has been reported in many other domains involving diverse processes such as language and number processing, episodic memory retrieval, and even simple vestibular stimulation (Fasold et al., 2002; Cabeza et al., 2012). Ideally, future studies will compare the TPJ subdivisions reported here with activation patterns observed in a range of task-based studies.
Methodological considerations
This study established that local ICA applied to the cortex around the TPJ was able to identify several neural processes with distinct network participation. By repeating the analysis on several independent datasets and over a range of ICA dimensionalities, we ensured that the reported source processes were reproducible despite the inherent variability of ICA. This minimized the risk of including irrelevant nonneural signal sources, but also imposed the limitation that finer subdivisions may be missed. Some ICs did appear to branch further at higher dimensionalities, but as the model order increased, the variability between the three datasets also increased, making it too difficult to match ICs without introducing subjective bias. The subdivisions found in this study are relatively large, given that much smaller functional regions exist in the human cerebral cortex (e.g., visual area MT). In part, this could be caused by a relatively generous statistical threshold of the IC maps, the spatial smoothing procedure applied during data preprocessing, or smearing of ICs due to spatial variability between subjects. It is likely that these ICs themselves comprise functional subregions. Therefore, one caveat of the connectivity results is that each IC might blur the connection patterns of several differing subregions. Only future studies that look in greater spatial specificity will be able to resolve this issue. Before exploring the possibility of a more detailed parcellation of the TPJ region, it will be helpful to characterize the broad functional roles of the neural source processes described here using task-based studies.
Another important consideration is that the cortical region around the TPJ shows very high intersubject variability both functionally and structurally (Frederikse et al., 1999; Hasson et al., 2004; Van Essen, 2005). It is therefore possible that individual subject analysis would reveal more robust functional parcellation in the region. For example, the use of single-subject analysis has been instrumental in mapping the intraparietal sulcus, where several subdivisions disappear if spatial intersubject alignment is used (Konen and Kastner, 2008).
Summary
We have shown here that the temporoparietal cortex in both hemispheres contains several spatially separated signal sources at rest and that these participate in distinct functional networks. These findings refine our knowledge of the organization of the TPJ, which is difficult to study due to its structural and functional variability and participation in higher-order functions. Our results also suggest that spatially restricted ICA can be used to localize neural source processes for functional studies.
Footnotes
This work was supported by the Princeton Neuroscience Institute Innovation Fund. We thank Dr Joost Wiskerke for helpful comments on the manuscript.
The authors declare no competing financial interests.
References
- Abou-Elseoud A, Starck T, Remes J, Nikkinen J, Tervonen O, Kiviniemi V. The effect of model order selection in group PICA. Hum Brain Mapp. 2010;31:1207–1216. doi: 10.1002/hbm.20929. [DOI] [PMC free article] [PubMed] [Google Scholar]
- Allen EA, Erhardt EB, Damaraju E, Gruner W, Segall JM, Silva RF, Havlicek M, Rachakonda S, Fries J, Kalyanam R, Michael AM, Caprihan A, Turner JA, Eichele T, Adelsheim S, Bryan AD, Bustillo J, Clark VP, Feldstein Ewing SW, Filbey F, et al. A baseline for the multivariate comparison of resting state networks. Front Syst Neurosci. 2011;5:2. doi: 10.3389/fnsys.2011.00002. [DOI] [PMC free article] [PubMed] [Google Scholar]
- Allen EA, Damaraju E, Plis SM, Erhardt EB, Eichele T, Calhoun VD. Tracking whole-brain connectivity dynamics in the resting state. Cereb Cortex. 2014;24:663–676. doi: 10.1093/cercor/bhs352. [DOI] [PMC free article] [PubMed] [Google Scholar]
- Bartels A, Zeki S. The chronoarchitecture of the human brain—natural viewing conditions reveal a time-based anatomy of the brain. Neuroimage. 2004;22:419–433. doi: 10.1016/j.neuroimage.2004.01.007. [DOI] [PubMed] [Google Scholar]
- Beckmann CF, Smith SM. Probabilistic independent component analysis for functional magnetic resonance imaging. IEEE Trans Med Imaging. 2004;23:137–152. doi: 10.1109/TMI.2003.822821. [DOI] [PubMed] [Google Scholar]
- Biswal B, Yetkin FZ, Haughton VM, Hyde JS. Functional connectivity in the motor cortex of resting human brain using echo-planar MRI. Magn Reson Med. 1995;34:537–541. doi: 10.1002/mrm.1910340409. [DOI] [PubMed] [Google Scholar]
- Brainard DH. The psychophysics toolbox. Spat Vis. 1997;10:433–436. doi: 10.1163/156856897X00357. [DOI] [PubMed] [Google Scholar]
- Buckner RL, Andrews-Hanna JR, Schacter DL. The brain's default network. Ann N Y Acad Sci. 2008;1124:1–38. doi: 10.1196/annals.1440.011. [DOI] [PubMed] [Google Scholar]
- Bzdok D, Langner R, Schilbach L, Jakobs O, Roski C, Caspers S, Laird AR, Fox PT, Zilles K, Eickhoff SB. Characterization of the temporo-parietal junction by combining data-driven parcellation, complementary connectivity analyses, and functional decoding. Neuroimage. 2013;81:381–392. doi: 10.1016/j.neuroimage.2013.05.046. [DOI] [PMC free article] [PubMed] [Google Scholar]
- Cabeza R, Ciaramelli E, Moscovitch M. Cognitive contributions of the ventral parietal cortex: an integrative theoretical account. Trends Cogn Sci. 2012;16:338–352. doi: 10.1016/j.tics.2012.04.008. [DOI] [PMC free article] [PubMed] [Google Scholar]
- Calhoun VD, Kiehl KA, Pearlson GD. Modulation of temporally coherent brain networks estimated using ICA at rest and during cognitive tasks. Hum Brain Mapp. 2008;29:828–838. doi: 10.1002/hbm.20581. [DOI] [PMC free article] [PubMed] [Google Scholar]
- Carter RM, Huettel SA. A nexus model of the temporal–parietal junction. Trends Cogn Sci. 2013;17:328–336. doi: 10.1016/j.tics.2013.05.007. [DOI] [PMC free article] [PubMed] [Google Scholar]
- Corbetta M, Kincade JM, Ollinger JM, McAvoy MP, Shulman GL. Voluntary orienting is dissociated from target detection in human posterior parietal cortex. Nat Neurosci. 2000;3:292–297. doi: 10.1038/73009. [DOI] [PubMed] [Google Scholar]
- Corbetta M, Patel G, Shulman GL. The reorienting system of the human brain: from environment to theory of mind. Neuron. 2008;58:306–324. doi: 10.1016/j.neuron.2008.04.017. [DOI] [PMC free article] [PubMed] [Google Scholar]
- Cox RW. AFNI: Software for analysis and visualization of functional magnetic resonance neuroimages. Comput Biomed Res. 1996;29:162–173. doi: 10.1006/cbmr.1996.0014. [DOI] [PubMed] [Google Scholar]
- Damoiseaux JS, Rombouts SA, Barkhof F, Scheltens P, Stam CJ, Smith SM, Beckmann CF. Consistent resting-state networks across healthy subjects. Proc Natl Acad Sci U S A. 2006;103:13848–13853. doi: 10.1073/pnas.0601417103. [DOI] [PMC free article] [PubMed] [Google Scholar]
- Decety J, Lamm C. The role of the right temporoparietal junction in social interaction: how low-level computational processes contribute to meta-cognition. Neuroscientist. 2007;13:580–593. doi: 10.1177/1073858407304654. [DOI] [PubMed] [Google Scholar]
- DiQuattro NE, Geng JJ. Contextual knowledge configures attentional control networks. J Neurosci. 2011;31:18026–18035. doi: 10.1523/JNEUROSCI.4040-11.2011. [DOI] [PMC free article] [PubMed] [Google Scholar]
- Downar J, Crawley AP, Mikulis DJ, Davis KD. A multimodal cortical network for the detection of changes in the sensory environment. Nat Neurosci. 2000;3:277–283. doi: 10.1038/72991. [DOI] [PubMed] [Google Scholar]
- Fasold O, von Brevern M, Kuhberg M, Ploner CJ, Villringer A, Lempert T, Wenzel R. Human vestibular cortex as identified with caloric stimulation in functional magnetic resonance imaging. Neuroimage. 2002;17:1384–1393. doi: 10.1006/nimg.2002.1241. [DOI] [PubMed] [Google Scholar]
- Frederikse ME, Lu A, Aylward E, Barta P, Pearlson G. Sex differences in the inferior parietal lobule. Cereb Cortex. 1999;9:896–901. doi: 10.1093/cercor/9.8.896. [DOI] [PubMed] [Google Scholar]
- Gallagher HL, Happé F, Brunswick N, Fletcher PC, Frith U, Frith CD. Reading the mind in cartoons and stories: an fMRI study of ‘theory of mind’ in verbal and nonverbal tasks. Neuropsychologia. 2000;38:11–21. doi: 10.1016/S0028-3932(99)00053-6. [DOI] [PubMed] [Google Scholar]
- Geng JJ, Vossel S. Re-evaluating the role of TPJ in attentional control: contextual updating? Neurosci Biobehav Rev. 2013;37:2608–2620. doi: 10.1016/j.neubiorev.2013.08.010. [DOI] [PMC free article] [PubMed] [Google Scholar]
- Hasson U, Nir Y, Levy I, Fuhrmann G, Malach R. Intersubject synchronization of cortical activity during natural vision. Science. 2004;303:1634–1640. doi: 10.1126/science.1089506. [DOI] [PubMed] [Google Scholar]
- Himberg J, Hyvärinen A, Esposito F. Validating the independent components of neuroimaging time series via clustering and visualization. Neuroimage. 2004;22:1214–1222. doi: 10.1016/j.neuroimage.2004.03.027. [DOI] [PubMed] [Google Scholar]
- Jenkinson M, Bannister P, Brady M, Smith S. Improved optimization for the robust and accurate linear registration and motion correction of brain images. Neuroimage. 2002;17:825–841. doi: 10.1006/nimg.2002.1132. [DOI] [PubMed] [Google Scholar]
- Jenkinson M, Beckmann CF, Behrens TE, Woolrich MW, Smith SM. FSL. Neuroimage. 2012;62:782–790. doi: 10.1016/j.neuroimage.2011.09.015. [DOI] [PubMed] [Google Scholar]
- Keck IR, Churan J, Theis FJ, Gruber P, Lang EW, Puntonet CG. Neural information processing. Berlin, Heidelberg: Springer; 2006. Region of interest based independent component analysis; pp. 1048–1057. [Google Scholar]
- Kelly RE, Jr, Alexopoulos GS, Wang Z, Gunning FM, Murphy CF, Morimoto SS, Kanellopoulos D, Jia Z, Lim KO, Hoptman MJ. Visual inspection of independent components: defining a procedure for artifact removal from fMRI data. J Neurosci Methods. 2010;189:233–245. doi: 10.1016/j.jneumeth.2010.03.028. [DOI] [PMC free article] [PubMed] [Google Scholar]
- Kiviniemi V, Starck T, Remes J, Long X, Nikkinen J, Haapea M, Veijola J, Moilanen I, Isohanni M, Zang YF, Tervonen O. Functional segmentation of the brain cortex using high model order group PICA. Hum Brain Mapp. 2009;30:3865–3886. doi: 10.1002/hbm.20813. [DOI] [PMC free article] [PubMed] [Google Scholar]
- Konen CS, Kastner S. Representation of eye movements and stimulus motion in topographically organized areas of human posterior parietal cortex. J Neurosci. 2008;28:8361–8375. doi: 10.1523/JNEUROSCI.1930-08.2008. [DOI] [PMC free article] [PubMed] [Google Scholar]
- Kubit B, Jack AI. Rethinking the role of the rTPJ in attention and social cognition in light of the opposing domains hypothesis: findings from an ALE-based meta-analysis and resting-state functional connectivity. Front Hum Neurosci. 2013;7:323. doi: 10.3389/fnhum.2013.00323. [DOI] [PMC free article] [PubMed] [Google Scholar]
- Kucyi A, Hodaie M, Davis KD. Lateralization in intrinsic functional connectivity of the temporoparietal junction with salience- and attention-related brain networks. J Neurophysiol. 2012;108:3382–3392. doi: 10.1152/jn.00674.2012. [DOI] [PubMed] [Google Scholar]
- Li YO, Adali T, Calhoun VD. Estimating the number of independent components for functional magnetic resonance imaging data. Hum Brain Mapp. 2007;28:1251–1266. doi: 10.1002/hbm.20359. [DOI] [PMC free article] [PubMed] [Google Scholar]
- Majeed W, Avison MJ. Robust data driven model order estimation for independent component analysis of fMRI data with low contrast to noise. PLoS One. 2014;9:e94943. doi: 10.1371/journal.pone.0094943. [DOI] [PMC free article] [PubMed] [Google Scholar]
- Mars RB, Sallet J, Schüffelgen U, Jbabdi S, Toni I, Rushworth MF. Connectivity-based subdivisions of the human right “temporoparietal junction area”: evidence for different areas participating in different cortical networks. Cereb Cortex. 2012;22:1894–1903. doi: 10.1093/cercor/bhr268. [DOI] [PubMed] [Google Scholar]
- Meier JD, Aflalo TN, Kastner S, Graziano MS. Complex organization of human primary motor cortex: a high-resolution fMRI study. J Neurophysiol. 2008;100:1800–1812. doi: 10.1152/jn.90531.2008. [DOI] [PMC free article] [PubMed] [Google Scholar]
- Mitchell JP. Activity in right temporo-parietal junction is not selective for theory-of-mind. Cereb Cortex. 2008;18:262–271. doi: 10.1093/cercor/bhm051. [DOI] [PubMed] [Google Scholar]
- Ray KL, McKay DR, Fox PM, Riedel MC, Uecker AM, Beckmann CF, Smith SM, Fox PT, Laird AR. ICA model order selection of task co-activation networks. Front Neurosci. 2013;7:237. doi: 10.3389/fnins.2013.00237. [DOI] [PMC free article] [PubMed] [Google Scholar]
- Saxe R, Wexler A. Making sense of another mind: The role of the right temporo-parietal junction. Neuropsychologia. 2005;43:1391–1399. doi: 10.1016/j.neuropsychologia.2005.02.013. [DOI] [PubMed] [Google Scholar]
- Scholz J, Triantafyllou C, Whitfield-Gabrieli S, Brown EN, Saxe R. Distinct regions of right temporo-parietal junction are selective for theory of mind and exogenous attention. PLoS One. 2009;4:e4869. doi: 10.1371/journal.pone.0004869. [DOI] [PMC free article] [PubMed] [Google Scholar]
- Smith SM, Fox PT, Miller KL, Glahn DC, Fox PM, Mackay CE, Filippini N, Watkins KE, Toro R, Laird AR, Beckmann CF. Correspondence of the brain's functional architecture during activation and rest. Proc Natl Acad Sci U S A. 2009;106:13040–13045. doi: 10.1073/pnas.0905267106. [DOI] [PMC free article] [PubMed] [Google Scholar]
- Tie Y, Whalen S, Suarez RO, Golby AJ. Group independent component analysis of language fMRI from word generation tasks. Neuroimage. 2008;42:1214–1225. doi: 10.1016/j.neuroimage.2008.05.028. [DOI] [PMC free article] [PubMed] [Google Scholar]
- Van Essen DC. A population-average, landmark- and surface-based (PALS) atlas of human cerebral cortex. Neuroimage. 2005;28:635–662. doi: 10.1016/j.neuroimage.2005.06.058. [DOI] [PubMed] [Google Scholar]
- Vincent JL, Kahn I, Snyder AZ, Raichle ME, Buckner RL. Evidence for a frontoparietal control system revealed by intrinsic functional connectivity. J Neurophysiol. 2008;100:3328–3342. doi: 10.1152/jn.90355.2008. [DOI] [PMC free article] [PubMed] [Google Scholar]
- Whitfield-Gabrieli S, Nieto-Castanon A. Conn: A functional connectivity toolbox for correlated and anticorrelated brain networks. Brain Connect. 2012;2:125–141. doi: 10.1089/brain.2012.0073. [DOI] [PubMed] [Google Scholar]