

Abstract
The perception of physical effort is relatively unaffected by the suppression of sensory afferences, indicating that this function relies mostly on the processing of the central motor command. Neural signals in the supplementary motor area (SMA) correlate with the intensity of effort, suggesting that the motor signal involved in effort perception could originate from this area, but experimental evidence supporting this view is still lacking. Here, we tested this hypothesis by disrupting neural activity in SMA, in primary motor cortex (M1), or in a control site by means of continuous theta-burst transcranial magnetic stimulation, while measuring effort perception during grip forces of different intensities. After each grip force exertion, participants had the opportunity to either accept or refuse to replicate the same effort for varying amounts of reward. In addition to the subjective rating of perceived exertion, effort perception was estimated on the basis of the acceptance rate, the effort replication accuracy, the influence of the effort exerted in trial t on trial t+1, and pupil dilation. We found that disruption of SMA activity, but not of M1, led to a consistent decrease in effort perception, whatever the measure used to assess it. Accordingly, we modeled effort perception in a structural equation model and found that only SMA disruption led to a significant alteration of effort perception. These findings indicate that effort perception relies on the processing of a signal originating from motor-related neural circuits upstream of M1 and that SMA is a key node of this network.
Keywords: cTBS, effort perception, primary motor cortex, supplementary motor area, TMS
Introduction
Intense physical activity leads to the perception of exertion (Borg, 1982; Liu et al., 2002; van Duinen et al., 2007). For a long time, effort perception was conceptualized according to the “afferent feedback model,” which posits that effort perception relies on the sensory information originating from the organs involved in effort. However, this view has been challenged by a series of findings, summarized by Marcora (2009). Indeed, the suppression of the sensory afferences after heart or lung transplant, or epidural anesthesia, does not impact on the sensation of effort (Braith et al., 1992; Smith et al., 2003; Zhao et al., 2003; Marcora, 2009). Additionally, when inducing muscular weakness by curare injection while maintaining the muscular contraction constant, effort perception is increased (Gallagher et al., 2001), suggesting that it originates from the central motor command, which has to increase to compensate for the neuromuscular junction blockade.
These findings advocate that the perception of effort depends on a copy of the motor command sent directly to the somatosensory cortex (McCloskey, 1981; Proske, 2005; Marcora, 2009; de Morree et al., 2012). However, evidence for this transfer of information remains indirect, and its origin remains unknown, even though some authors have suggested it could emerge from structures located upstream to primary motor cortex (M1; Ellaway et al., 2004; Proske, 2005). The motor signal involved in effort perception should carry information about the intensity of muscle contraction, and supplementary motor area (SMA) fulfills these conditions. Indeed, functional neuroimaging studies (Dettmers et al., 1995; Dai et al., 2001; Cramer et al., 2002; Pessiglione et al., 2007; Spraker et al., 2007; Ward et al., 2007) have consistently found a relationship between grip force intensity and SMA activation, albeit this relationship is weaker at the single-cell level (Cadoret and Smith, 1997). In addition, SMA has direct projections to the somatosensory cortex (Jürgens, 1984), its online disruption with transcranial magnetic stimulation (TMS) led to increased grip force during a precision grip task (White et al., 2013), and it is involved in predicting the sensory consequences of voluntary actions (Haggard and Whitford, 2004).
To investigate the role of SMA in effort perception, we assessed the consequences of a perturbation of M1, SMA, or a control site (CTR) by means of continuous theta burst stimulation (cTBS; Huang et al., 2005), on the perception of effort during power grips of different intensities. We gathered five different measures of effort perception. (1) The rate of perceived exertion (RPE) is considered a standard measure of subjective physical effort perception (Borg, 1982). (2) The rate of replication, representing how often the participants were willing to replicate a given effort (Körding et al., 2004) for varying amounts of reward, is thought to also reflect the subjective cost of effort (Prévost et al., 2010; Wardle et al., 2011). (3) The pupil size has been shown to be a valid psychophysiological marker of effort perception (Zénon et al., 2014). (4) We used the effort replication intensity in the absence of visual feedback as an indirect measure of effort perception (Flanagan et al., 2003). (5) Finally, we used the force prediction in trial t+1, indicating how the perception of effort in trial t affected the effort in trial t+1, as another variable to estimate force perception (Westling and Johansson, 1984).
Materials and Methods
Subjects.
A total of 12 healthy volunteers (five women; age range, 22–31 years) were recruited for this study. All participants were right-handed and had normal or corrected-to-normal vision. Before testing, all subjects provided us with written informed consent. Each participant also completed a standard medical questionnaire to identify possible contraindications to TMS (Keel et al., 2001; Davare et al., 2012). All experimental procedures were approved by the local ethics committees and in full accordance with the guidelines in the Declaration of Helsinki.
Task and procedure.
Each subject was tested during three sessions, separated by at least 2 d, during which a different cTBS site was targeted: M1, SMA, and a CTR located symmetrically to SMA with respect to the vertex and corresponding to the precuneus (see below). The order of the stimulation sites was counterbalanced between subjects. Each session consisted first in four blocks, followed by cTBS application, and then followed by four additional blocks. Each block consisted of 28 trials and lasted ∼4 min. In addition, to acquaint the subjects with the setup and task, the first experimental session started with a familiarization block.
Participants were comfortably seated in front of a 19 inch CRT screen at a 52 cm distance and held a custom-made hand dynamometer in their right hand. The display and control of the task and data acquisition were both performed on the same PC running Matlab (Mathworks) and the Psychophysics Toolbox (Brainard, 1997). The participants had their head resting on a chinrest to restrict head movements and to allow pupil size measurement, performed by means of an Eyelink 1000+ eye tracker. To take account of the muscular fatigue, and to adjust the difficulty of the task to the ability of each participant, all the power grip force intensities were defined in proportion to the maximal voluntary contraction (MVC) measured at the beginning of each block; to do so, the subjects were asked to squeeze the dynamometer as hard as possible before each new block. During this assessment, the contraction lasted for 3 s, a sound signal marking the beginning and the end of each contraction. No visual feedback was provided during the contraction. There were two attempts, each followed by the display of a score on the screen, indicating the maximal force exerted by the subject. The best of both MVC values was used to adjust the grip force intensities that the participant had to perform in the subsequent block.
Each trial was composed of two separate steps (Fig. 1). The subjects had to squeeze the dynamometer with one of the following force levels: 10, 23, 37, or 50% of the MVC, randomized across trials. Trial onset was indicated by a beep, and participants had to squeeze the dynamometer to reach the target force level, which had to be maintained for 3 s. The time spent exerting a force below the imposed level was not accounted for. Participants were provided with an on-line visual feedback (Fig. 1A) informing them about the force they were producing and about how long they had maintained, and still had to maintain, the appropriate force. The on-line visual feedback of the force produced was relative to the force required, such that the force threshold to be reached for that particular trial corresponded to the midlevel of the gauge shown on the screen. Consequently, the absolute level of force to be produced was never directly indicated to the participants. After having successfully achieved the first step, participants were informed about the reward gained for this first effort (Fig. 1A); the reward varied randomly between 0 and 32 cents.
Figure 1.

Schematic depiction of the task. A, The force level to be reached was indicated by the top bar of the red rectangle shown on the right of the computer screen. When the contraction was initiated, the participants were provided with a feedback about the force being applied in the form of a light blue rectangle shown on the left of the screen, whose height was proportional to the grip force. The feedback was relative to the required grip force, not to its absolute value, such that the top bar of the red rectangle was always at the same level (see Materials and Methods). As soon as the required force was reached, i.e., when the blue rectangle exceeded the top bar of the red rectangle, the red rectangle was progressively filled with green color, at a constant speed. The contraction was completed when the red rectangle was completely filled with green color, which occurred after a total contraction duration of 3 s. In 24 of 28 trials per block, after the first contraction, participants were asked whether they wanted to replicate their effort to double the amount of monetary reward received for the first contraction, which varied pseudo-randomly between trials. The second contraction was performed in the absence of visual feedback. The final reward received depended on the accuracy of the force replication (see Materials and Methods). B, In the remaining four trials of the block (one per effort intensity condition), the participants were asked to rate their subjective perception of the effort exerted during the first contraction on the Rate of Perceived Exertion Scale, which ranges from 6 to 20 (Borg, 1982).
Participants were then asked whether they wanted to replicate the same effort to double their reward. The subjects responded with the left hand by pressing the “Q” key on a computer keyboard for refusal or the “S” key for approval. Upon acceptance, they were asked to replicate the same effort, but without any visual feedback. During effort replication, only the auditory feedback about effort initiation and completion was provided. The final reward depended on the accuracy of the effort replication during the second contraction, measured by comparing the integrals of the force applied during the two contractions. An index of force replication accuracy was computed as 1 − |(force integral 1 − force integral 2)/(force integral 1 + force integral 2)| and used as a multiplicative factor to determine the final reward. When the participants rejected the effort replication, they moved directly to the next trial. Finally, in four randomly picked trials in each block, subjects were asked to rate the perception of the effort just performed by means of the RPE scale (Borg, 1982) shown on the screen (Fig. 1B).
cTBS application and site localization.
We assessed the motor threshold before each session. We used single-pulse TMS (Magstim stimulator) applied over left M1 to elicit motor-evoked potentials (MEPs) in the right hand. The coil was placed tangentially on the scalp backward and laterally at a 45° angle away from the midline. EMG response of the right flexor digitorum superficialis muscle was recorded. The site that caused the MEPs was identified as the motor hot spot. Afterward, we determined the minimum output intensity leading to five MEPs higher than 50 μV in 10 consecutive stimulations.
The location of the motor hot spot was then used as the M1 stimulation site. The exact coordinates of this site were determined by means of a coregistration procedure (Noirhomme et al., 2002). For the other stimulation sites, we used anatomical landmarks on the 3D brain reconstruction to localize the targeted areas. The left SMA stimulation site was localized at the level of the first sulcus anterior to M1 (Picard and Strick, 1996). For this stimulation site, the coil was maintained horizontal and pointed leftward. The CTR corresponded to the precuneus and was determined as the point symmetrical to SMA, along the rostrocaudal axis, with a line of symmetry passing through the most medial part of M1. For CTR stimulation, the coil was also held horizontal and pointing leftward. For each participant, the coordinates of each cTBS site were projected onto an individual brain MRI, which was then normalized onto the Talairach space. The mean cTBS location coordinates were −5.5 ± 2.9, −51.7 ± 5.8, and 61.3 ± 4.6 (x, y, and z ± SD) for the control site; −23.8 ± 5, −25.2 ± 3.9, and 67.3 ± 1.5 for M1; and −5 ± 2, −10.1 ± 4.3, and 67.2 ± 2.4 for SMA (Fig. 2). The coordinates for SMA and M1 are consistent with those of activation sites reported in the functional neuroimaging literature (Picard and Strick, 1996; Indovina and Sanes, 2001). In particular, all the SMA sites were posterior to the vertical anterior commissure (VAC) line, which defines the limit between SMA-proper and pre-SMA (Picard and Strick, 1996). The CTR site is commonly used in experiments targeting SMA or pre-SMA (Koch et al., 2005; Kwan et al., 2007; Duque et al., 2013; Soutschek et al., 2013). The cTBS protocol (Huang et al., 2005) consisted of bursts of three pulses at 50 Hz (i.e., 20 ms between each stimulus) repeated with intervals of 200 ms (i.e., 5 Hz). A total of 600 pulses were applied during 40 s of uninterrupted trains at an intensity of 80% of the motor threshold.
Figure 2.
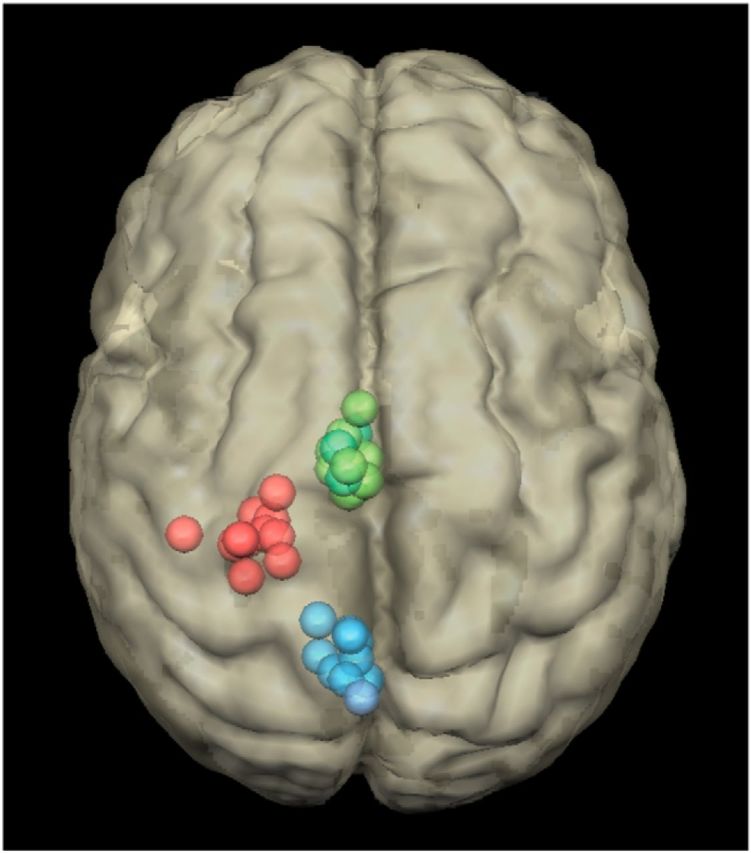
Localization of the cTBS sites in the 12 participants for the SMA (green), M1 (red), and control (blue) conditions. These coordinates were obtained by projecting the stimulation sites onto the individual brain MRI of each participant, which was then normalized into the Talairach space.
Statistical analyses.
We considered five different estimators of effort perception. RPE corresponded to the standard RPE scale used to estimate subjective effort perception (Borg, 1982). RATE OF REPLICATION indicated the probability of accepting to replicate the first contraction given the effort required and the reward proposed. For a given reward level, a high rate of replication indicated a contraction perceived as requiring low effort. A similar approach, in which participants had to choose between efforts with different combinations of intensity and duration, has been validated as a means to evaluate the utility function of motor actions, i.e., the subjective cost of effort (Körding et al., 2004). The use of monetary reward as a common value system with which effort costs have to be balanced has also been used repeatedly in previous studies (Prévost et al., 2010; Wardle et al., 2011). PUPIL SIZE, a measure of arousal and autonomic activation (Szabadi, 2013), corresponded to the peak-to-peak difference in pupil size during the first contraction, which is indicative of the perception of physical effort (Zénon et al., 2014). The pupil response was first normalized by subtracting, from each trial signal, the average of the pupil size from a baseline time window, computed over 1 s before the first contraction, and by dividing it by the SD of this baseline pupil size. Then the minimum of this pupil response reached between the onset and the end of the first contraction was gathered and subtracted from its maximum, leading to the peak-to-peak value.
In addition to the three abovementioned variables, which are well established correlates of effort perception, we also included two new variables whose relationship to effort perception has not been directly demonstrated so far. First, EFFORT REPLICATION INTENSITY (ERI) corresponded to the average force applied during the second contraction. Since the second contraction was performed in the absence of visual feedback, it depended exclusively on how the effort was perceived during the first contraction (Flanagan et al., 2003): a large ERI implied that the first contraction had been perceived as requiring a large level of effort. Second, force prediction in trial t+1 represented how the force exerted in trial t influenced the early phase of the first contraction performed in trial t+1. The rationale of this measure was that the force exerted in a given trial should lead to the expectation of the next effort being similar (Westling and Johansson, 1984; Pashler and Baylis, 1991; Witney et al., 2000). Thus, if a contraction was perceived as effortful, it should have affected the initiation of the next contraction, before any visual feedback could correct the grip force intensity, leading to larger peaks of the grip force and of its derivatives. To account for this effect, we first regressed the t+1 peak of grip force (gft+1) and its first (gf′t+1) and second (gf″t+1) derivatives on the grip force exerted in trial t. This regression was performed separately for each subject. From the three regression coefficients obtained, we inferred the value of the grip force in trial t from the actual values of the gf, gf′, and gf″ in trial t+1. Therefore, the value obtained by applying the regression coefficients to the observed grip force in t+1 provided an estimate of the grip force in trial t, according to the average intertrial effect. The larger the force prediction in trial t+1, the more effortful the contraction in trial t was inferred to be perceived. Since we found that the decision of the participant to reproduce trial t did not impact on the value of the force prediction in trial t+1 (general linear model with first contraction intensity and acceptance as predictors: acceptance: F(1,11) < 0.01, p = 0.97; interaction: F(3,33) = 0.17, p = 0.92), we included both accepted and rejected trials in the estimate of the force prediction in trial t+1.
Finally, to validate the use of ERI and force prediction in trial t+1 as measures of effort perception, we ran general linear models with contraction intensity as the categorical predictor and RPE as the continuous predictor. We found that variables increased significantly with contraction intensity (force prediction in trial t+1: F(3,33) = 2.94, p = 0.032; ERI: F(3,33) = 14.25, p < 0.0001) and, importantly, varied in proportion to the RPE (force prediction in trial t+1: F(1,11) = 4.45, p = 0.048; ERI: F(1,11) = 4.39, p = 0.043), indicating that these two new variables were indeed valid estimators of effort perception.
For all variables except the rate of replication, we performed repeated-measures ANOVAs (RM-ANOVAs) with the Statistica software (version 7.1, 2005; StatSoft). These analyses were performed on the difference between the values of the effort perception variables obtained before and after cTBS application. All analyses included the factor cTBS site (CTR, SMA, and M1) and the effort intensity condition (10, 23, 37, or 50% of MVC). For the rate of replication, which is a binomial variable, we conducted a logistic linear mixed model with the R software (R Development Core Team, n.d.) in which subjects were included as random factors. In addition to the factors mentioned above for the RM-ANOVAs, we also included the pre–post factor (differentiating the blocks performed before or after cTBS application) and the reward parameter (from 0 to 32 cents). We started systematically with full models, including all the fixed-effect variables that were potentially relevant in the analysis. The structure of the random effect (intercepts and slopes of the fixed effects) was then compared in increasing order of complexity by means of an analysis of deviance. More complex models that did not differ significantly from simpler ones on the basis of a χ2 test on deviance were discarded, and the simpler model was then kept for further processing.
Finally, we built a structural equation model, a multivariate analysis technique that allows us to model latent variables, which are not observed directly, from a series of measured variables. In addition, it allows us to test how different variables affect each other, according to a path diagram that represents a plausible relationship between these variables. In the present case, effort perception was modeled as a latent variable, which depended on our five observed variables (effort replication intensity, force prediction in trial t+1, pupil size, RPE, rate of replication) and which was regressed on the power grip force applied during the first effort and the PRE–POST condition (see Fig. 5). The effect of cTBS was included as two variables whose value was 1 after cTBS application on SMA (variable SMApost) or on M1 (variable M1post), and zero otherwise. The control cTBS condition was indicated by a value of zero in both the SMApost and M1post variables. These analyses were performed with the R Toolbox Lavaan (Rosseel, 2012). We standardized each observed variable session-wise and averaged the values within each block. To take account of the non-normality of our data, we applied the same transformation to our variables as described above for the RM-ANOVAs, we arcsine-root transformed (Ahrens et al., 1990) the rate of replication, and we used a robust maximum likelihood estimator (White, 1982) for the structural equation model.
Figure 5.

Schema of the structural equation model. Top variables correspond to the exogenous, or independent, variables (prp differentiates between the data collected before and after cTBS, M1 indicates data collected after M1 cTBS, SMA indicates data collected after SMA cTBS, and gf1 is the average force exerted during the first contraction). The middle ellipse corresponds to the latent effort perception variable, which is not directly observed but constructed on the basis of the covariance between the five observed variables represented on the bottom of the figure (RoR, rate of replication; pupil, pupil size; t+1, force prediction at trial t+1). The numbers indicated next to the arrows represent standardized path coefficients, and their level of significance is indicated by the thickness of the corresponding arrow and by the number of asterisks (*p ≤ 0.05; **p ≤ 0.01; ***p ≤ 0.001). Loop arrows represent variance parameters, and dashed lines illustrate fixed variances/covariances. The direction of the arrows follows the standard convention for the graphical representation of structural equation models and indicates the assumed direction of causation.
Results
We first verified whether cTBS affected the MVC, which was used, before each block, to determine the intensity of all subsequent contractions (see Materials and Methods). We ran an RM-ANOVA with BLOCK (1–4), PRE- versus POST-cTBS condition, and cTBS SITE as predictor variables and grip force as a dependent variable (Table 1). We found a significant effect of BLOCK and of the PRE- and POST-cTBS factors, uncovering the buildup of fatigue during the task (BLOCK: F(9,99) = 9.47, p = 0.0001; PRE- and POST-cTBS: F(1,11) = 8.13, p = 0.016). However, there was no cTBS SITE main effect (F(2,22) = 0.33, p = 0.72), and the interaction between the cTBS SITE and the PRE- and POST-cTBS factors was not significant (F(2,22) = 0.67, p = 0.52), indicating that the MVC was not significantly affected by cTBS application.
Table 1.
Maximal voluntary contraction values (PSI, mean ± SE)
| Control | SMA | M1 | |
|---|---|---|---|
| Pre-TMS | |||
| Block 1 | 4.27 ± 0.57 | 4.05 ± 0.70 | 4.67 ± 0.55 |
| Block 2 | 3.81 ± 0.54 | 3.73 ± 0.63 | 3.92 ± 0.40 |
| Block 3 | 3.89 ± 0.54 | 3.63 ± 0.66 | 3.56 ± 0.42 |
| Block 4 | 3.82 ± 0.46 | 3.64 ± 0.61 | 3.43 ± 0.34 |
| Post-TMS | |||
| Block 5 | 3.98 ± 0.59 | 3.54 ± 0.56 | 3.84 ± 0.55 |
| Block 6 | 3.44 ± 0.55 | 3.36 ± 0.51 | 3.20 ± 0.40 |
| Block 7 | 3.73 ± 0.56 | 3.40 ± 0.49 | 3.23 ± 0.40 |
| Block 8 | 3.61 ± 0.54 | 3.67 ± 0.58 | 3.17 ± 0.33 |
We then looked at the effect of cTBS on the five different measurements of effort perception collected during this experiment. For the four continuous variables (i.e., excluding the rate of replication), we performed an RM-ANOVA on the difference between the values gathered in the PRE-cTBS and POST-cTBS blocks with the cTBS SITE and EFFORT INTENSITY (10, 23, 37, or 50% of the MVC) as independent variables (Fig. 3). All variables were first z-scored subject-wise to correct for differences in mean and variance between subjects. They were then averaged per subject, EFFORT INTENSITY, and cTBS SITE conditions, except for variables that differed too much from normality, as assessed through examination of the histogram and Q-Q plot of the residuals (effort replication intensity, force prediction in trial t+1), for which the median was used instead of the mean. The RM-ANOVA showed a significant main effect of cTBS SITE on effort replication intensity (F(2,22) = 3.712, p = 0.040), pupil size (F(2,22) = 6.16, p = 0.008), and RPE (F(2,22) = 6.08, p = 0.008). Tukey's-corrected post hoc comparisons showed a significant decrease in RPE (p = 0.014), pupil size (p = 0.006), and effort replication intensity (p = 0.032) after SMA cTBS compared with the control site. In addition, the RPE also decreased with respect to the control site condition after M1 cTBS application (p = 0.019). The analysis performed on force prediction in trial t+1 uncovered a significant EFFORT INTENSITY × cTBS SITE interaction (F(6,66) = 2.51, p = 0.03) in which a significant difference was found between the SMA and control condition for the two lower-effort conditions (Tukey's post hoc tests: all p values <0.015). All the Mauchly's tests performed to check for the violation of the sphericity assumption were negative (all p values >0.15).
Figure 3.

Continuous measurements of effort perception. Each column corresponds to a different effort perception variable. Error bars indicate the SEM. Top row, Relationship between each variable and the effort intensity condition. Bottom row, Changes observed in the four continuous variables after cTBS application to each of the three cTBS sites. Main effects of cTBS sites are illustrated for all variables except the force prediction in trial t+1, in which the EFFORT INTENSITY × cTBS SITE interaction is shown instead, because this was the only significant result obtained from the statistical analysis.
Because of its binomial distribution, the analysis of the rate of replication was performed in a different way, namely by using generalized linear mixed models (see Materials and Methods). In the full model, we included the REWARD (from 0 to 32 cents) and EFFORT (10, 23, 37, or 50% of the MVC) conditions as continuous variables, the cTBS SITE (control, SMA, M1) and PRE–POST (before or after cTBS) as categorical variables, and subject indices as random variables. We found that removing the cTBS variable from this model resulted in a significant increase in deviance (χ2 test: χ2 = 558.89, p < 0.0001), indicating that the cTBS condition impacted the rate of replication significantly. When looking at individual fixed effects, we found a significant effect of EFFORT INTENSITY (z = −4.251, p < 0.0001; Fig. 4A) and REWARD (z = 5.976, p < 0.0001; Fig. 4A) and a significant change in these effects after cTBS, regardless of the site of stimulation (PRE–POST × effort: z = 2.422, p = 0.0154; PRE–POST × reward: z = −2.02, p = 0.0434; Fig. 4B). Most importantly, we found a PRE–POST × REWARD × SITE interaction showing that the SMA cTBS condition resulted in a significant increase in the effect of REWARD on acceptance rate (z = 2.166, p = 0.03). In particular, the acceptance rate increased more with reward after SMA cTBS than in all other conditions (Fig. 4B).
Figure 4.

Acceptance rate. A, Color plot of the acceptance rate as a function of the REWARD and EFFORT INTENSITY conditions. Color values indicate the acceptance rate, as indicated by the color bar. It can be seen from this plot that the reward condition influenced the acceptance rate more than the effort intensity condition. B, Color plots of the change in acceptance rate after cTBS application in each of the cTBS SITE conditions.
To gain a more comprehensive view of the effect of cTBS on effort perception, we used structural equation modeling (see Materials and Methods and Fig. 5) to model effort perception as a latent variable, which depended on the five measurements described above (effort replication intensity, force prediction in trial t+1, pupil size, RPE, and rate of replication). This latent effort perception variable was regressed on the exogenous variables PRE–POST (before vs after cTBS application), SMApost (after SMA cTBS application), M1post (after M1 cTBS application), and gf1 (effort actually exerted during the first contraction). We found that this model provided a good fit to the data [standardized root mean square residual, 0.031 (should be <0.05); root mean square error of approximation, 0.071 (should be <0.08); comparative fit index, 0.968 (should be >0.9)], that each of the five variables contributed significantly to the effort perception variable (all p values <0.0001), and that SMA cTBS (z = −2.174, p = 0.03) but not M1 cTBS (z = 0.382, p = 0.702) significantly decreased effort perception (Fig. 5).
Discussion
In the present experiment, we found that disrupting SMA activity, but not that of M1, led to alterations in the perception of a physical effort. Because effort perception cannot be directly measured, its assessment has to rely on subjective reports or indirect evaluations, which may be affected by confounding factors such as motivation, autonomic tone, the pain caused by the effort, etc. Therefore, we decided to combine multiple measurements, assuming their potential flaws should cancel each other out. These effort perception measurements were either explicit, consisting of asking the participants to rate their perceived level of exertion, or implicit, in which we looked at the accuracy of effort replication, the probability of accepting to replicate the prior effort, the increase in pupil size, and the characteristics of the power grip force exerted in the next trial. Remarkably, we found a consistent alteration of all these different effort perception measurements after SMA cTBS. Finally, we performed a structural equation modeling analysis in which a latent effort perception variable was created, representing the variations that were common to the five variables intended to measure the effort perception. This latent variable was then regressed on the initial grip force and TMS conditions. We found that only SMA disruption led to a significant decrease in the latent effort perception variable.
cTBS is thought to induce a prolonged but reversible decrease in neural excitability in the targeted area (Di Lazzaro et al., 2005; Huang et al., 2005), probably through a combination of long-term depression and long-term potentiation mechanisms (Huang et al., 2005; Stagg et al., 2009), even though a significant between-subject variability in its effects has been reported (Hamada et al., 2013). In the present experiment, the application of cTBS over the SMA resulted presumably in a reduction of its output signal. Whereas the effect of this decreased output signal on RPE, pupil size, and acceptance rate can be interpreted straightforwardly in terms of decreased effort perception, the interpretation of the effect we found on the remaining two effort perception variables, namely effort replication intensity and force prediction in trial t+1, requires more caution. Regarding effort replication intensity, if the cTBS manipulation had affected effort perception in the same way during the first and second contractions, we would have expected no effect of cTBS on effort replication intensity since both contractions would have been performed under the same force-effort relationship. The fact that we actually found an effect of cTBS on the effort replication intensity can only be understood if we consider that, because the first contraction was performed under visual feedback, any decrease in SMA output was probably compensated by other motor-related areas, possibly the premotor cortex. During replication, since such feedback-dependent compensation was impossible, it led to a decrease in the grip force intensity. The same reasoning applies to the case of force prediction in trial t+1, which is based on the properties of the grip force onset, before any visual feedback could be taken into account.
The notion that a copy of the motor command is sent to sensory cortex is akin to the concept of the efference copy, proposed in forward models of motor control (Wolpert and Miall, 1996). Efference copies are duplicates of the motor command thought to be used to generate a prediction of the consequences of the action, which can then be compared with reafferent information (Wolpert and Miall, 1996). Efference copies should permit, among other things, the allocation of attention to stimuli that are not anticipated by our own actions (Blakemore et al., 2000; Pynn and DeSouza, 2013), the attribution of agency to self-generated movements (David et al., 2008), and motor learning (Wolpert and Miall, 1996). The finding that electrical stimulation of SMA leads to the perception of the urge to move (Fried et al., 1991) and that SMA disruption interferes with the sensory suppression of self-generated actions (Haggard and Whitford, 2004) have been viewed as evidence for the existence of an efference copy originating from SMA, thereby going along the same line as our present findings. Besides, indirect evidence for efference copies have been reported in other brain structures such as ventral premotor cortex (Christensen et al., 2007) and posterior parietal cortex, more specifically the angular gyrus (Farrer et al., 2008; Desmurget et al., 2009; Chambon et al., 2013, 2014). In contrast, and also in agreement with our findings, the output from M1 might not be available to sensory areas (Chronicle and Glover, 2003; Ellaway et al., 2004). It is noteworthy that the idea of a transmission of information from SMA to somatosensory cortex, which we propose in the present study, is more general than the concept of efference copy in the sense that it does not imply specifically the existence of a forward model of motor control, which remains controversial (Friston, 2011). However, it cannot be excluded that, in addition to the SMA, premotor and posterior parietal cortex could also contribute to effort perception. But because of the lack of evidence in the literature for a correlation between effort intensity and activity in these regions, we chose not to target other brain areas in the present study, and thus we cannot conclude on their potential role in effort perception.
After M1 cTBS, the force applied during the first contraction, under visual control, was successfully maintained above the threshold despite the decrease in excitability, presumably thanks to an increase in the input to M1. If this compensatory increase in M1 input were relayed to the brain areas involved in effort perception, we would have expected an increase in the perception of effort, since for a given grip force level, the magnitude of the effort signal would have to be larger after M1 cTBS. Our finding that the perception of effort did not change after M1 disruption, or even more surprisingly decreased when assessed by using RPE, argues against this hypothesis and suggests instead that the compensatory increase must come from a neural circuit that does not take part in the generation of the signal involved in effort perception. Given the visual dependency of this compensatory signal, it could arise from the posterior parietal cortex (Buneo and Andersen, 2006).
Finally, our failure to observe an effect of SMA disruption on the intensity of the MVC suggests that the MVC does not rely on effort perception. Indeed, the exact process that controls how the MVC is reached remains unclear. In particular, the MVC could be either performed in open loop, by simply maximizing the output of the motor system, or in closed loop, in which case the motor output would be adjusted so as to maximize the percept of effort. Previous studies have suggested that peripheral afferences might intervene in such a closed-loop mechanism during MVC (Kouzaki et al., 2000). However, the present findings, showing a dissociation between effort perception and MVC intensity, argue instead in favor of an open-loop process.
Numerous functional neuroimaging studies have found positive correlations between the intensity of muscular contractions and SMA activation, a finding in agreement with the view that the adjustment of effort intensity is under the control of SMA (Dettmers et al., 1995; Dai et al., 2001; Cramer et al., 2002; Pessiglione et al., 2007; Spraker et al., 2007; Ward et al., 2007). More specifically, effort-related changes in activation were reported in SMA-proper while pre-SMA remained unaffected by the effort condition (Cramer et al., 2002; Spraker et al., 2007). This is why, in the present study, we chose to target SMA-proper by ensuring that the cTBS target sites remained posterior to the VAC line (Picard and Strick, 1996). Such a proportional relationship with effort intensity was also found at the subcortical level in the subthalamic nucleus, globus pallidus internus, and ventral thalamus (Spraker et al., 2007), with which SMA is heavily interconnected (Jürgens, 1984; Alexander and Crutcher, 1990). Moreover, lesions of the basal ganglia lead to decreases in grip forces when executed in absence of visual feedback (Schmidt et al., 2008). These observations, in addition to other behavioral and electrophysiological results, has led some authors to propose that one of the central functions of this cortical–basal ganglia–thalamus circuit is to control the gain of the motor response, i.e., the response vigor (Turner and Desmurget, 2010). This circuit is altered in Parkinson's disease (PD), a disorder in which movement vigor is dramatically decreased (Turner and Desmurget, 2010). In accordance with this view, the symptoms of PD patients can be improved by interfering with SMA either through direct cTBS application (Shirota et al., 2013) or indirectly through M1 neurodisruption (González-García et al., 2011). The present findings allow us to refine this hypothesis by showing that a copy of the gain signal produced by this circuit is used to build the percept of effort.
Many disorders, such as chronic fatigue syndrome, traumatic brain injury, multiple sclerosis, and others, are accompanied by an increased sensation of fatigue, in which movements are subjectively perceived as more effortful (DeLuca, 2005). In healthy subjects, the activity of the SMA initially increases (Liu et al., 2002; van Duinen et al., 2007) during the buildup of motor fatigue, possibly reflecting the increase in the cost of motor effort over time, but eventually decreases when fatigue becomes more severe and the motor output starts to drop (Liu et al., 2002). In addition, functional alterations of the SMA have been reported in patients complaining of fatigue (Roelcke et al., 1997; Filippi et al., 2002; Puri et al., 2010). Noninvasive neurodisruption of the SMA could thus be considered as a potential therapeutic solution for treating the pathological fatigue associated with these diverse disorders.
Footnotes
This work was supported by grants from Innoviris (Région Bruxelles-Capitale), the Actions de Recherche Concertées (Communauté Française de Belgique), the Fondation Médicale Reine Elisabeth, and the Fonds de la Recherche Scientifique. We thank Arnaud Pollaris and Céline Bugli (Support en Mêthodologie et Calcul Statistique, Université Catholique de Louvain) for valuable help in the structural equation modeling part of the analyses.
The authors declare no competing financial interests.
References
- Ahrens WH, Cox DJ, Budhwar G. Use of the arcsine and square root transformations for subjectively determined percentage data. Weed Sci. 1990;XX:452–458. [Google Scholar]
- Alexander GE, Crutcher MD. Functional architecture of basal ganglia circuits: neural substrates of parallel processing. Trends Neurosci. 1990;13:266–271. doi: 10.1016/0166-2236(90)90107-L. [DOI] [PubMed] [Google Scholar]
- Blakemore SJ, Wolpert D, Frith C. Why can't you tickle yourself? Neuroreport. 2000;11:R11–R16. doi: 10.1097/00001756-200008030-00002. [DOI] [PubMed] [Google Scholar]
- Borg GA. Psychophysical bases of perceived exertion. Med Sci Sports Exerc. 1982;14:377–381. [PubMed] [Google Scholar]
- Brainard DH. The Psychophysics Toolbox. Spat Vis. 1997;10:433–436. doi: 10.1163/156856897X00357. [DOI] [PubMed] [Google Scholar]
- Braith RW, Wood CE, Limacher MC, Pollock ML, Lowenthal DT, Phillips MI, Staples ED. Abnormal neuroendocrine responses during exercise in heart transplant recipients. Circulation. 1992;86:1453–1463. doi: 10.1161/01.CIR.86.5.1453. [DOI] [PubMed] [Google Scholar]
- Buneo CA, Andersen RA. The posterior parietal cortex: sensorimotor interface for the planning and online control of visually guided movements. Neuropsychologia. 2006;44:2594–2606. doi: 10.1016/j.neuropsychologia.2005.10.011. [DOI] [PubMed] [Google Scholar]
- Cadoret G, Smith AM. Comparison of the neuronal activity in the SMA and the ventral cingulate cortex during prehension in the monkey. J Neurophysiol. 1997;77:153–166. doi: 10.1152/jn.1997.77.1.153. [DOI] [PubMed] [Google Scholar]
- Chambon V, Wenke D, Fleming SM, Prinz W, Haggard P. An online neural substrate for sense of agency. Cereb Cortex. 2013;23:1031–1037. doi: 10.1093/cercor/bhs059. [DOI] [PubMed] [Google Scholar]
- Chambon V, Moore JW, Haggard P. TMS stimulation over the inferior parietal cortex disrupts prospective sense of agency. Brain Struct Funct. 2014 doi: 10.1007/s00429-014-0878-6. Advance online publication. Retrieved Aug. 19, 2014. [DOI] [PubMed] [Google Scholar]
- Christensen MS, Lundbye-Jensen J, Geertsen SS, Petersen TH, Paulson OB, Nielsen JB. Premotor cortex modulates somatosensory cortex during voluntary movements without proprioceptive feedback. Nat Neurosci. 2007;10:417–419. doi: 10.1038/nn1873. [DOI] [PubMed] [Google Scholar]
- Chronicle EP, Glover J. A ticklish question: does magnetic stimulation of the primary motor cortex give rise to an “efference copy”? Cortex. 2003;39:105–110. doi: 10.1016/S0010-9452(08)70078-9. [DOI] [PubMed] [Google Scholar]
- Cramer SC, Weisskoff RM, Schaechter JD, Nelles G, Foley M, Finklestein SP, Rosen BR. Motor cortex activation is related to force of squeezing. Hum Brain Mapp. 2002;16:197–205. doi: 10.1002/hbm.10040. [DOI] [PMC free article] [PubMed] [Google Scholar]
- Dai TH, Liu JZ, Sahgal V, Brown RW, Yue GH. Relationship between muscle output and functional MRI-measured brain activation. Exp Brain Res. 2001;140:290–300. doi: 10.1007/s002210100815. [DOI] [PubMed] [Google Scholar]
- Davare M, Zénon A, Pourtois G, Desmurget M, Olivier E. Role of the medial part of the intraparietal sulcus in implementing movement direction. Cereb Cortex. 2012;22:1382–1394. doi: 10.1093/cercor/bhr210. [DOI] [PubMed] [Google Scholar]
- David N, Newen A, Vogeley K. The “sense of agency” and its underlying cognitive and neural mechanisms. Conscious Cogn. 2008;17:523–534. doi: 10.1016/j.concog.2008.03.004. [DOI] [PubMed] [Google Scholar]
- DeLuca J, editor. Fatigue as a window to the brain. Cambridge, MA: MIT; 2005. [Google Scholar]
- de Morree HM, Klein C, Marcora SM. Perception of effort reflects central motor command during movement execution. Psychophysiology. 2012;49:1242–1253. doi: 10.1111/j.1469-8986.2012.01399.x. [DOI] [PubMed] [Google Scholar]
- Desmurget M, Reilly KT, Richard N, Szathmari A, Mottolese C, Sirigu A. Movement intention after parietal cortex stimulation in humans. Science. 2009;324:811–813. doi: 10.1126/science.1169896. [DOI] [PubMed] [Google Scholar]
- Dettmers C, Fink GR, Lemon RN, Stephan KM, Passingham RE, Silbersweig D, Holmes A, Ridding MC, Brooks DJ, Frackowiak RS. Relation between cerebral activity and force in the motor areas of the human brain. J Neurophysiol. 1995;74:802–815. doi: 10.1152/jn.1995.74.2.802. [DOI] [PubMed] [Google Scholar]
- Di Lazzaro V, Pilato F, Saturno E, Oliviero A, Dileone M, Mazzone P, Insola A, Tonali PA, Ranieri F, Huang YZ, Rothwell JC. Theta-burst repetitive transcranial magnetic stimulation suppresses specific excitatory circuits in the human motor cortex. J Physiol. 2005;565:945–950. doi: 10.1113/jphysiol.2005.087288. [DOI] [PMC free article] [PubMed] [Google Scholar]
- Duque J, Olivier E, Rushworth M. Top-down inhibitory control exerted by the medial frontal cortex during action selection under conflict. J Cogn Neurosci. 2013;25:1634–1648. doi: 10.1162/jocn_a_00421. [DOI] [PubMed] [Google Scholar]
- Ellaway PH, Prochazka A, Chan M, Gauthier MJ. The sense of movement elicited by transcranial magnetic stimulation in humans is due to sensory feedback. J Physiol. 2004;556:651–660. doi: 10.1113/jphysiol.2003.060483. [DOI] [PMC free article] [PubMed] [Google Scholar]
- Farrer C, Frey SH, Van Horn JD, Tunik E, Turk D, Inati S, Grafton ST. The angular gyrus computes action awareness representations. Cereb Cortex. 2008;18:254–261. doi: 10.1093/cercor/bhm050. [DOI] [PubMed] [Google Scholar]
- Filippi M, Rocca MA, Colombo B, Falini A, Codella M, Scotti G, Comi G. Functional magnetic resonance imaging correlates of fatigue in multiple sclerosis. Neuroimage. 2002;15:559–567. doi: 10.1006/nimg.2001.1011. [DOI] [PubMed] [Google Scholar]
- Flanagan JR, Vetter P, Johansson RS, Wolpert DM. Prediction precedes control in motor learning. Curr Biol. 2003;13:146–150. doi: 10.1016/S0960-9822(03)00007-1. [DOI] [PubMed] [Google Scholar]
- Fried I, Katz A, McCarthy G, Sass KJ, Williamson P, Spencer SS, Spencer DD. Functional organization of human supplementary motor cortex studied by electrical stimulation. J Neurosci. 1991;11:3656–3666. doi: 10.1523/JNEUROSCI.11-11-03656.1991. [DOI] [PMC free article] [PubMed] [Google Scholar]
- Friston K. What is optimal about motor control? Neuron. 2011;72:488–498. doi: 10.1016/j.neuron.2011.10.018. [DOI] [PubMed] [Google Scholar]
- Gallagher KM, Fadel PJ, Strømstad M, Ide K, Smith SA, Querry RG, Raven PB, Secher NH. Effects of partial neuromuscular blockade on carotid baroreflex function during exercise in humans. J Physiol. 2001;533:861–870. doi: 10.1111/j.1469-7793.2001.t01-1-00861.x. [DOI] [PMC free article] [PubMed] [Google Scholar]
- González-García N, Armony JL, Soto J, Trejo D, Alegría MA, Drucker-Colín R. Effects of rTMS on Parkinson's disease: a longitudinal fMRI study. J Neurol. 2011;258:1268–1280. doi: 10.1007/s00415-011-5923-2. [DOI] [PubMed] [Google Scholar]
- Haggard P, Whitford B. Supplementary motor area provides an efferent signal for sensory suppression. Brain Res Cogn Brain Res. 2004;19:52–58. doi: 10.1016/j.cogbrainres.2003.10.018. [DOI] [PubMed] [Google Scholar]
- Hamada M, Murase N, Hasan A, Balaratnam M, Rothwell JC. The role of interneuron networks in driving human motor cortical plasticity. Cereb Cortex. 2013;23:1593–1605. doi: 10.1093/cercor/bhs147. [DOI] [PubMed] [Google Scholar]
- Huang YZ, Edwards MJ, Rounis E, Bhatia KP, Rothwell JC. Theta burst stimulation of the human motor cortex. Neuron. 2005;45:201–206. doi: 10.1016/j.neuron.2004.12.033. [DOI] [PubMed] [Google Scholar]
- Indovina I, Sanes JN. On somatotopic representation centers for finger movements in human primary motor cortex and supplementary motor area. Neuroimage. 2001;13:1027–1034. doi: 10.1006/nimg.2001.0776. [DOI] [PubMed] [Google Scholar]
- Jürgens U. The efferent and afferent connections of the supplementary motor area. Brain Res. 1984;300:63–81. doi: 10.1016/0006-8993(84)91341-6. [DOI] [PubMed] [Google Scholar]
- Keel JC, Smith MJ, Wassermann EM. A safety screening questionnaire for transcranial magnetic stimulation. Clin Neurophysiol. 2001;112:720. doi: 10.1016/S1388-2457(00)00518-6. [DOI] [PubMed] [Google Scholar]
- Koch G, Brusa L, Caltagirone C, Peppe A, Oliveri M, Stanzione P, Centonze D. rTMS of supplementary motor area modulates therapy-induced dyskinesias in Parkinson disease. Neurology. 2005;65:623–625. doi: 10.1212/01.wnl.0000172861.36430.95. [DOI] [PubMed] [Google Scholar]
- Körding KP, Fukunaga I, Howard IS, Ingram JN, Wolpert DM. A neuroeconomics approach to inferring utility functions in sensorimotor control. PLoS Biol. 2004;2:e330. doi: 10.1371/journal.pbio.0020330. [DOI] [PMC free article] [PubMed] [Google Scholar]
- Kouzaki M, Shinohara M, Fukunaga T. Decrease in maximal voluntary contraction by tonic vibration applied to a single synergist muscle in humans. J Appl Physiol. 2000;89:1420–1424. doi: 10.1152/jappl.2000.89.4.1420. [DOI] [PubMed] [Google Scholar]
- Kwan VS, Barrios V, Ganis G, Gorman J, Lange C, Kumar M, Shepard A, Keenan JP. Assessing the neural correlates of self-enhancement bias: a transcranial magnetic stimulation study. Exp Brain Res. 2007;182:379–385. doi: 10.1007/s00221-007-0992-2. [DOI] [PubMed] [Google Scholar]
- Liu JZ, Dai TH, Sahgal V, Brown RW, Yue GH. Nonlinear cortical modulation of muscle fatigue: a functional MRI study. Brain Res. 2002;957:320–329. doi: 10.1016/S0006-8993(02)03665-X. [DOI] [PubMed] [Google Scholar]
- Marcora S. Perception of effort during exercise is independent of afferent feedback from skeletal muscles, heart, and lungs. J Appl Physiol. 2009;106:2060–2062. doi: 10.1152/japplphysiol.90378.2008. [DOI] [PubMed] [Google Scholar]
- McCloskey DI. Centrally-generated commands and cardiovascular control in man. Clin Exp Hypertens. 1981;3:369–378. doi: 10.3109/10641968109033671. [DOI] [PubMed] [Google Scholar]
- Noirhomme Q, Romero E, Cuisenaire O, Ferrant M, Vandermeeren Y, Olivier E, Macq B. Registration of transcranial magnetic stimulation, a visualization tool for brain functions. IEEE. 2002;1:311–314. [Google Scholar]
- Pashler H, Baylis GC. Procedural learning: II. Intertrial repetition effects in speeded-choice tasks. J Exp Psychol Learn Mem Cogn. 1991;17:33–48. doi: 10.1037/0278-7393.17.1.33. [DOI] [Google Scholar]
- Pessiglione M, Schmidt L, Draganski B, Kalisch R, Lau H, Dolan RJ, Frith CD. How the brain translates money into force: a neuroimaging study of subliminal motivation. Science. 2007;316:904–906. doi: 10.1126/science.1140459. [DOI] [PMC free article] [PubMed] [Google Scholar]
- Picard N, Strick PL. Motor areas of the medial wall: a review of their location and functional activation. Cereb Cortex. 1996;6:342–353. doi: 10.1093/cercor/6.3.342. [DOI] [PubMed] [Google Scholar]
- Prévost C, Pessiglione M, Météreau E, Cléry-Melin ML, Dreher JC. Separate valuation subsystems for delay and effort decision costs. J Neurosci. 2010;30:14080–14090. doi: 10.1523/JNEUROSCI.2752-10.2010. [DOI] [PMC free article] [PubMed] [Google Scholar]
- Proske U. What is the role of muscle receptors in proprioception? Muscle Nerve. 2005;31:780–787. doi: 10.1002/mus.20330. [DOI] [PubMed] [Google Scholar]
- Puri BK, Agour M, Gunatilake KD, Fernando KA, Gurusinghe AI, Treasaden IH. Reduction in left supplementary motor area grey matter in adult female fibromyalgia sufferers with marked fatigue and without affective disorder: a pilot controlled 3-T magnetic resonance imaging voxel-based morphometry study. J Int Med Res. 2010;38:1468–1472. doi: 10.1177/147323001003800429. [DOI] [PubMed] [Google Scholar]
- Pynn LK, DeSouza JF. The function of efference copy signals: implications for symptoms of schizophrenia. Vision Res. 2013;76:124–133. doi: 10.1016/j.visres.2012.10.019. [DOI] [PubMed] [Google Scholar]
- R Development Core Team. R: a language and environment for statistical computing (R Foundation for Statistical Computing, ed) Vienna. (n.d.) Available at http://www.R-project.org.
- Roelcke U, Kappos L, Lechner-Scott J, Brunnschweiler H, Huber S, Ammann W, Plohmann A, Dellas S, Maguire RP, Missimer J, Radü EW, Steck A, Leenders KL. Reduced glucose metabolism in the frontal cortex and basal ganglia of multiple sclerosis patients with fatigue: a 18F-fluorodeoxyglucose positron emission tomography study. Neurology. 1997;48:1566–1571. doi: 10.1212/WNL.48.6.1566. [DOI] [PubMed] [Google Scholar]
- Rosseel Y. lavaan: an R package for structural equation modeling. J Stat Software. 2012;48:1–36. [Google Scholar]
- Schmidt L, d'Arc BF, Lafargue G, Galanaud D, Czernecki V, Grabli D, Schüpbach M, Hartmann A, Lévy R, Dubois B, Pessiglione M. Disconnecting force from money: effects of basal ganglia damage on incentive motivation. Brain. 2008;131:1303–1310. doi: 10.1093/brain/awn045. [DOI] [PubMed] [Google Scholar]
- Shirota Y, Ohtsu H, Hamada M, Enomoto H, Ugawa Y, Research Committee on rTMS Treatment of Parkinson's Disease Supplementary motor area stimulation for Parkinson disease: a randomized controlled study. Neurology. 2013;80:1400–1405. doi: 10.1212/WNL.0b013e31828c2f66. [DOI] [PubMed] [Google Scholar]
- Smith SA, Querry RG, Fadel PJ, Gallagher KM, Strømstad M, Ide K, Raven PB, Secher NH. Partial blockade of skeletal muscle somatosensory afferents attenuates baroreflex resetting during exercise in humans. J Physiol. 2003;551:1013–1021. doi: 10.1113/jphysiol.2003.044925. [DOI] [PMC free article] [PubMed] [Google Scholar]
- Soutschek A, Taylor PC, Müller HJ, Schubert T. Dissociable networks control conflict during perception and response selection: a transcranial magnetic stimulation Study. J Neurosci. 2013;33:5647–5654. doi: 10.1523/JNEUROSCI.4768-12.2013. [DOI] [PMC free article] [PubMed] [Google Scholar]
- Spraker MB, Yu H, Corcos DM, Vaillancourt DE. Role of individual basal ganglia nuclei in force amplitude generation. J Neurophysiol. 2007;98:821–834. doi: 10.1152/jn.00239.2007. [DOI] [PMC free article] [PubMed] [Google Scholar]
- Stagg CJ, Wylezinska M, Matthews PM, Johansen-Berg H, Jezzard P, Rothwell JC, Bestmann S. Neurochemical effects of theta burst stimulation as assessed by magnetic resonance spectroscopy. J Neurophysiol. 2009;101:2872–2877. doi: 10.1152/jn.91060.2008. [DOI] [PMC free article] [PubMed] [Google Scholar]
- Szabadi E. Functional neuroanatomy of the central noradrenergic system. J Psychopharmacol (Oxford) 2013;27:659–693. doi: 10.1177/0269881113490326. [DOI] [PubMed] [Google Scholar]
- Turner RS, Desmurget M. Basal ganglia contributions to motor control: a vigorous tutor. Curr Opin Neurobiol. 2010;20:704–716. doi: 10.1016/j.conb.2010.08.022. [DOI] [PMC free article] [PubMed] [Google Scholar]
- van Duinen H, Renken R, Maurits N, Zijdewind I. Effects of motor fatigue on human brain activity, an fMRI study. Neuroimage. 2007;35:1438–1449. doi: 10.1016/j.neuroimage.2007.02.008. [DOI] [PubMed] [Google Scholar]
- Ward NS, Newton JM, Swayne OB, Lee L, Frackowiak RS, Thompson AJ, Greenwood RJ, Rothwell JC. The relationship between brain activity and peak grip force is modulated by corticospinal system integrity after subcortical stroke. Eur J Neurosci. 2007;25:1865–1873. doi: 10.1111/j.1460-9568.2007.05434.x. [DOI] [PMC free article] [PubMed] [Google Scholar]
- Wardle MC, Treadway MT, Mayo LM, Zald DH, de Wit H. Amping up effort: effects of d-amphetamine on human effort-based decision-making. J Neurosci. 2011;31:16597–16602. doi: 10.1523/JNEUROSCI.4387-11.2011. [DOI] [PMC free article] [PubMed] [Google Scholar]
- Westling G, Johansson RS. Factors influencing the force control during precision grip. Exp Brain Res. 1984;53:277–284. doi: 10.1007/BF00238156. [DOI] [PubMed] [Google Scholar]
- White H. Maximum likelihood estimation of misspecified models. Econometrica. 1982;50:1–26. doi: 10.2307/1912526. [DOI] [Google Scholar]
- White O, Davare M, Andres M, Olivier E. The role of left supplementary motor area in grip force scaling. PLoS One. 2013;8:e83812. doi: 10.1371/journal.pone.0083812. [DOI] [PMC free article] [PubMed] [Google Scholar]
- Witney AG, Goodbody SJ, Wolpert DM. Learning and decay of prediction in object manipulation. J Neurophysiol. 2000;84:334–343. doi: 10.1152/jn.2000.84.1.334. [DOI] [PubMed] [Google Scholar]
- Wolpert DM, Miall RC. Forward models for physiological motor control. Neural Netw. 1996;9:1265–1279. doi: 10.1016/S0893-6080(96)00035-4. [DOI] [PubMed] [Google Scholar]
- Zénon A, Sidibé M, Olivier E. Pupil size variations correlate with physical effort perception. Front Behav Neurosci. 2014;8:286. doi: 10.3389/fnbeh.2014.00286. [DOI] [PMC free article] [PubMed] [Google Scholar]
- Zhao W, Martin AD, Davenport PW. Magnitude estimation of inspiratory resistive loads by double-lung transplant recipients. J Appl Physiol. 2003;94:576–582. doi: 10.1152/japplphysiol.00564.2002. [DOI] [PubMed] [Google Scholar]