

Abstract
Amyotrophic lateral sclerosis (ALS) is a devastating fatal motor neuron disease, for which there is currently no cure or effective treatment. In this disease, local neuroinflammation develops along the disease course and contributes to its rapid progression. In several models of CNS pathologies, circulating immune cells were shown to display an indispensable role in the resolution of the neuroinflammatory response. The recruitment of such cells to the CNS involves activation of the choroid plexus (CP) of the brain for leukocyte trafficking, through a mechanism that requires IFN-γ signaling. Here, we found that in the mutant SOD1G93A (mSOD1) mouse model of ALS, the CP does not support leukocyte trafficking during disease progression, due to a local reduction in IFN-γ levels. Therapeutic immunization of mSOD1 mice with a myelin-derived peptide led to CP activation, and was followed by the accumulation of immunoregulatory cells, including IL-10-producing monocyte-derived macrophages and Foxp3+ regulatory T cells, and elevation of the neurotrophic factors IGF-1 and GDNF in the diseased spinal cord parenchyma. The immunization resulted in the attenuation of disease progression and an increased life expectancy of the mSOD1 mice. Collectively, our results demonstrate that recruitment of immunoregulatory cells to the diseased spinal cord in ALS, needed for fighting off the pathology, can be enhanced by transiently boosting peripheral immunity to myelin antigens.
Keywords: amyotrophic lateral sclerosis, autoimmunity, choroid plexus, neurodegeneration, T cells
Introduction
Amyotrophic lateral sclerosis (ALS) is a devastating motor neuron disease, which is characterized by the selective death of motor neurons in the spinal cord. Similar to other neurodegenerative diseases and acute CNS insults, ALS pathology is associated with a local innate inflammatory response, in which the resident microglia become chronically activated and contribute to disease progression, rather than to its resolution (Nguyen et al., 2002; Beers et al., 2006; Hanisch and Kettenmann, 2007; Frank-Cannon et al., 2009; Appel et al., 2010).
Accumulated data have shown that circulating immune cells, including monocyte-derived macrophages (mo-MΦs) and autoimmune CD4+ T cells, are active players in recovery from acute CNS injuries (Rapalino et al., 1998; Moalem et al., 1999; Hauben et al., 2000; Hofstetter et al., 2003; Olsson et al., 2003; Hendrix and Nitsch, 2007; Shechter et al., 2009). Specifically, the beneficial autoimmune response that supports CNS repair involves both CD4+ effector and regulatory T cell (Treg) populations (Kipnis et al., 2002; Raposo et al., 2014; Walsh et al., 2014), and is amenable to boosting by passive or active immunization with a myelin-derived peptide (Moalem et al., 1999; Hauben et al., 2000; Shechter et al., 2009).
In mutant SOD1G93A (mSOD1) mice, an animal model of ALS, circulating immune cells were shown to play a role in fighting chronic neuroinflammation; life expectancy is shorter and disease emerges earlier in mSOD1 mice lacking T cells (Beers et al., 2008; Chiu et al., 2008). Likewise, the increased survival of these mice is associated with the enhanced infiltration of CD4+ T cells to the spinal cord (Beers et al., 2008; Finkelstein et al., 2011). Boosting CD4+ T-cell levels, including those of effector T cells and Tregs, was shown to delay disease progression (Banerjee et al., 2008; Beers et al., 2011; Zhao et al., 2012).
Our group recently showed that the recruitment of inflammation-resolving mo-MΦs and T cells to the CNS following spinal cord injury involves selective leukocyte entry through the choroid plexus (CP) of the brain to the CNS (Kunis et al., 2013; Shechter et al., 2013; Raposo et al., 2014). The activation of the CP for such leukocyte entry was shown to be IFN-γ dependent (Kunis et al., 2013) and was suggested to involve CNS-specific T cells, the levels of which are elevated at the CP following immunization with CNS-related antigens (Baruch et al., 2013); such activation can augment the recruitment of inflammation-resolving mo-MΦs to the CNS parenchyma following acute spinal cord injury (Shechter et al., 2009).
Here, we found that in mSOD1 mice the CP is not spontaneously activated along with disease progression to enable leukocyte trafficking. We demonstrated that this limitation is associated with reduced levels of IFN-γ in this compartment, and functionally linked it to reduced leukocyte numbers in the CSF and limited recruitment of immunoregulatory cells to the spinal cord parenchyma. Evoking a transient immune response to a myelin-derived peptide activated the CP to support leukocyte recruitment to the CNS, and led to the accumulation of IL-10-producing mo-MΦs and Tregs in the spinal cord ventral horn, and to a significant increase in life expectancy of the mSOD1 mice.
Materials and Methods
Animals.
Adult male and female wild-type (WT), mSOD1, CX3CR1GFP/+ (Jung et al., 2000), and EGFP transgenic mice (Okabe et al., 1997) on a C57BL/6J background were supplied by The Jackson Laboratory, Harlan Biotech, and the Animal Breeding Center of the Weizmann Institute of Science. All experiments conformed to the regulations formulated by the Institutional Animal Care and Use Committee of the Weizmann Institute of Science.
Preparation of bone marrow chimeras.
Bone marrow (BM) chimeras were prepared by subjecting recipient WT or mSOD1 mice to lethal whole-body γ-irradiation (950 rad) while shielding the head. The mice were then reconstituted with 5 × 10⁶ BM cells of CX3CR1GFP/+ donor mice. Using this method, 70% chimerism is achieved. To attain full chimerism (∼99%), mice were subjected to a split-dose irradiation, with sublethal whole-body γ-irradiation (300 rad) without head shielding, 3 d before the lethal (950 rad) irradiation. Chimeric mice were used 6–10 weeks after BM transplantation.
Grip strength test.
Forelimb grip strength was measured using a grip strength meter (TSE Systems). The mice were allowed to hold a bar with their forelimbs and then gently pulled backward, and the maximum strength of the grip before release was recorded. For each mouse, the maximal grip strength result of three trials was used for analysis.
Active immunizations and evaluation of clinical signs of experimental autoimmune encephalomyelitis.
For immunizations, 200 μg of either MOG35-55 or OVA323–339 peptide (GL Biochem Ltd.) was emulsified in incomplete Freund's adjuvant containing 0.5 mg/ml Mycobacterium tuberculosis (strain H37Ra; Difco), and 200 μl was injected subcutaneously into the mice. Clinical signs were evaluated in a blinded fashion by at least two investigators and recorded daily (0, healthy; 1, tail paralysis; 2, ataxia and/or paresis of hind limbs; 3, paralysis of hind limbs and/or paresis of forelimbs; 4, tetraparalysis; 5, moribund state or death).
CSF collection.
CSF was collected by the cisterna magna puncture technique. In brief, mice were anesthetized and placed in a stereotactic instrument so that the head formed a 135° angle with the body. A sagittal incision of the skin was made inferior to the occiput, the subcutaneous tissue and muscle were separated, and a capillary was inserted into the cisterna magna through the dura mater lateral to the arteria dorsalis spinalis. Approximately 15 μl of CSF could be aspirated from an individual mouse. The collected CSF was taken for analysis by flow cytometry.
Adoptive transfer of isolated monocytes.
CD115+ monocytes were isolated as previously reported (Shechter et al., 2009). Briefly, BM cells were harvested from the femur and tibia of naive GFP+ mice, and enriched for mononuclear cells on a Ficoll density gradient. The CD115+ BM monocyte population was magnetically separated using biotinylated anti-CD115 antibodies (eBioscience) and streptavidin-conjugated MACS beads (Miltenyi Biotec) according to the protocols of the manufacturer. Monocyte purity was routinely checked by flow cytometry based on CD115 reactivity (purity of 85–90% was routinely observed). For injection, mice were anesthetized and placed in a stereotactic instrument so that the head formed a 135° angle with the body. A sagittal incision of the skin was made inferior to the occiput, the subcutaneous tissue and muscle were separated, and 1 × 10⁶ cells in 10 μl of growth factor reduced Matrigel (BD Bioscience) were injected into the fourth ventricle through the dura mater of the cisterna magna.
Primary culture of choroid plexus cells.
After intracardial perfusion with PBS, the CPs of either WT or mSOD1 mice were removed under a dissecting microscope (Stemi DV4; Zeiss) in PBS into tubes containing 0.25% trypsin, and kept on ice. After all the CPs were collected, the tubes were shaken for 20 min at 37°C, and the tissue was dissociated by pipetting. The cell suspension was washed in culture medium for epithelial cells (DMEM/Ham's F12 mixture; Invitrogen) supplemented with 10% FCS (Sigma-Aldrich), 1 mm l-glutamine, 1 mm sodium pyruvate, 100 U/ml penicillin, 100 mg/ml streptomycin, 5 μg/ml insulin, 20 μm Ara-C, 5 ng/ml sodium selenite, and 10 ng/ml EGF; and cultured (2.5 × 10⁵ cells/well) at 37°C, with 5% CO2 in 24-well plates (Corning) coated with poly-l-lysine (Sigma-Aldrich). After 24 h, the medium was changed, and the cells were either left untreated or were treated with the cytokines IFN-γ (100 ng/ml) or IL-4 (10 ng/ml) (Peprotech). RNA was isolated using the ZR RNA MicroPrep Kit (Zymo Research) according to the protocol of the manufacturer.
RNA purification, cDNA synthesis, and real-time quantitative PCR.
Total RNA from the choroid plexus was extracted using the ZR RNA MicroPrep kit (Zymo Research), and from the spinal cord using the RNeasy Mini Kit (Qiagen). mRNA (1 μg) was converted to cDNA using the High Capacity cDNA Reverse Transcription Kit (Applied Biosystems). The expression of specific mRNAs was assayed using fluorescence-based real-time quantitative PCR (qPCR). qPCR reactions were performed using the Power SYBR Green PCR Master Mix (Applied Biosystems). Quantification reactions were performed in triplicate for each sample using the standard curve method. Peptidylprolyl isomerase A (PPIA) was chosen as a reference gene based on its stability in the target tissue. The amplification cycles were 95°C for 5 s, 60°C for 20 s, and 72°C for 15 s. At the end of the assay, a melting curve was constructed to evaluate the specificity of the reaction. For some genes, the cDNA was preamplified for 14 PCR cycles with nonrandom PCR primers, thus increasing the sensitivity of the subsequent real-time PCR analysis (PreAmp Master Mix Kit; Applied Biosystems). For these genes, expression was determined using TaqMan Real-Time PCR, according to the instructions of the manufacturer (Applied Biosystems). All quantitative real-time PCR reactions were performed and analyzed using a 7500 Real-Time PCR System (Applied Biosystems). The following TaqMan probes were used: Mm02342430_g1 (ppia); Mm00446968_m1 (hprt); Mm00445260_m1 (il-4); Mm01168134_m1 (ifn-γ); and Mm00439614_m1 (il-10). In addition, the following primers were used: PPIA, forward, 5′-AGCATACAGGTCCTGGCATCTTGT-3′ and reverse 5′-CAAAGACCACATGCTTGCCATCCA-3′; intercellular adhesion molecule 1 (ICAM-1), forward 5′-AGATCACATTCACGGTGCTGGCTA-3′ and reverse 5′-AGCTTTGGGATGGTAGCTGGAAGA-3′; vascular cell adhesion molecule 1 (VCAM-1), forward 5′-TGTGAAGGGATTAACGAGGCTGGA-3′ and reverse 5′-CCATGTTTCGGGCACATTTCCACA-3′; chemokine ligand 2 (CCL2), forward 5′-CATCCACGTGTTGGCTCA-3′ and reverse 5′-GATCATCTTGCTGGTGAATGAGT-3′; macrophage colony-stimulating factor (M-CSF), forward 5′-CCACATGATTGGGAATGGAC-3′ and reverse 5′-GTAGCAAACAGGATCATCCA-3′; fractalkine, forward 5′-ATGTGCGACAAGATGACCTCACGA-3′ and reverse 5′-TTTCTCCTTCGGGTCAGCACAGAA-3′; CCL5, forward 5′-GTGCTCCAATCTTGCAGTCGTGTT-3′ and reverse 5′-ACTTCTTCTCTGGGTTGGCACACA-3′; C-X-C ligand 9 (CXCL9), forward 5′-GAGTTCGAGGAACCCTAGTG-3′ and reverse 5′-AACTGTTTGAGGTCTTTGAGG-3′; CXCL10, forward 5′-AACTGCATCCATATCGATGAC-3′ and reverse 5′-GTGGCAATGATCTCAACAC-3′; CXCL12, forward 5′-CATCAGTGACGGTAAACCAG-3′ and reverse 5′- TTTCAGATGCTTGACGTTGG-3′; TGF-β1, forward 5′-TACCATGCCAACTTCTGTCTGGG-3′ and reverse 5′-TGTGTTGGTTGTAGAGGGCAAGG-3′; IGF-1, forward 5′-CCGGACCAGAGACCCTTTG-3′ and reverse 5′-CCTGTGGGCTTGTTGAAGTAAAA-3′; GDNF, forward 5′-AGATGAAGTTATGGGATGTCGT-3′ and reverse 5′-AGGCATATTGGAGTCACTGG-3; TNF-α, forward 5′-ACAAGGCTGCCCCGACTAT-3′ and reverse 5′- CTCCTGGTATGAAGTGGCAAATC-3′; and IL-1β, forward 5′-CCAAAAGATGAAGGGCTGCTT-3′ and reverse 5′- TGCTGCTGCGAGATTTGAAG-3′.
Multiplex cytokine analysis system.
CPs were isolated from the lateral, third, and fourth ventricles of each mouse, and pooled in groups of three, due to the limited amount of protein extracted from a single CP. Spinal cord samples were used from individual mice. The excised tissues were homogenized in PBS containing protease inhibitors (1:100; P8340; Sigma-Aldrich). Four freeze–thaw cycles (3 min each) were performed to break the cell membranes. Homogenates were then centrifuged for 10 min at 500 × g, and the total protein amount in each supernatant was determined by Bradford reagent. Frozen supernatants were assayed in duplicate using a Multiplex bead-based Luminex assay (MILLIPLEX Mouse Cytokine/Chemokine Panel; Millipore), performed by outsourcing (American Medical Laboratories) according to the instructions of the manufacturer. The results are expressed as picograms of protein per milligram of total tissue protein.
Histology.
After perfusion of the mice with PBS, the spinal cords were excised and fixed in 2.5% paraformaldehyde (PFA) for 48 h, and then placed in 70% EtOH. The tissue was dehydrated sequentially in EtOH:xylene:paraffin over a gradient of 70–95-100% and then embedded in paraffin. Sections (6 μm thick) were cut and stained with Nissl reagent. For motor neuron size evaluation, 10 cross sections of the lumbar segment of the spinal cord were collected from predetermined depths along the segment and were analyzed for each tested animal. The sizes were determined automatically with Image-Pro Plus version 4.5 software (Media Cybernetics) by an operator who was blinded to the identity (treatment group) of the sections; data are represented in square micrometers.
Immunohistochemistry.
After intracardial perfusion with PBS, brain or spinal cord tissues were fixed with 2.5% PFA for 24 h and subsequently transferred to 30% sucrose in PBS solution. Coronal sections (30 μm) were blocked with an M.O.M. Immunodetection Kit reagent (Vector Laboratories) containing 0.1% Triton X-100 (Sigma-Aldrich) and stained with the following primary antibodies: mouse anti-cytokeratin (1:100; Covance); rat anti-ICAM-1 (1:100; Abcam); rat anti-CD11b (1:50; BD PharMingen; BD Biosciences); rat anti-Foxp3 (1:20; eBioscience); rabbit anti-CD3 (1:500; Dako); chicken anti-vimentin (1:500; Millipore); rabbit anti-GFP (1:100; Invitrogen); rabbit anti-laminin (1:100; Abcam); rabbit anti-Iba1 (1:200; Wako); mouse anti-E-cadherin (1:100; Invitrogen); biotin-conjugated goat anti-GFP (1:100; Abcam); and goat anti-IL-10 (1:20; R&D Systems). Secondary antibodies were Cy2-conjugated donkey anti-mouse, Cy2-conjugated donkey anti-rabbit, Cy2-conjugated streptavidin, Cy3-conjugated donkey anti-rat, Cy3-conjugated donkey anti-rabbit, Cy3-conjugated donkey anti-chicken, and Cy3-conjugated donkey anti-goat (1:200; Jackson ImmunoResearch). Each step was followed by three washes in PBS. The tissue samples were mounted onto slides using Immu-mount (Fisher Scientific) and sealed with coverslips. For nuclear staining, Hoechst 33342 fluorochrome was used (Invitrogen). The following two negative controls were routinely used in immunostaining procedures: staining with isotype control antibody followed by secondary antibody; and staining with secondary antibody alone. For microscopic analysis, a fluorescence microscope (Eclipse 80i; Nikon) or a laser-scanning confocal microscope (Carl Zeiss) was used. The fluorescence microscope was equipped with a digital camera (DXM 1200F; Nikon) and with either a 20× numerical aperture (NA) 0.50 or a 40× NA 0.75 objective lens (Plan Fluor; Nikon). The confocal microscope was equipped with LSM 510 laser scanning (three lasers: Ar 488, HeNe 543, and HeNe 633) and with a 20× NA 0.5 Plan-Neofluar objective lens and a 40× water-immersion, NA 1.2, C-Apochromat objective lens. Recordings were made on postfixed tissues at 24°C using acquisition software (NIS-Elements, F3; [Nikon) or LSM (Carl Zeiss). Images were cropped, merged, and optimized using Photoshop version 9.0 (Adobe Systems) to make minor adjustments to contrast; and were arranged using Canvas X (ACD Systems of America).
Flow cytometry, sample preparation, and analysis.
Before tissue collection, mice were intracardially perfused with PBS. CP tissues were isolated from the lateral, third, and fourth ventricles of the brain, incubated at 37°C for 45 min in PBS (with Ca2+/Mg2+) containing 400u/ml collagenase type IV (Worthington Biochemical Corporation), and then manually homogenized using a pipette. Spinal cords were homogenized using a software-controlled, sealed homogenization system (Dispomix; http://www.biocellisolation.com) followed by separation on a 40% Percoll (GE Healthcare) gradient to eliminate residual fat tissue. For intracellular staining of IFN-γ, the cells were incubated with PMA (10 ng/ml; Sigma-Aldrich) and ionomycin (250 ng/ml; Sigma-Aldrich) for 6 h, and Brefeldin-A (10 μg/ml; Sigma-Aldrich) was added for the last 4 h. For intracellular staining of IL-10, the cells were incubated with protein transport inhibitor, containing monensin (BD Biosciences) for 3 h. Intracellular labeling of cytokines was performed with the Cytofix/Cytoperm Plus Fixation/Permeabilization Kit (BD Biosciences) according to the protocol of the manufacturer. Intracellular staining of Foxp3 was performed using the Foxp3 staining kit (eBioscience) according to the protocol of the manufacturer. The following fluorochrome-labeled mAbs were used according to the protocols of the manufacturers: FITC-conjugated anti-CD45.2, phycoerythrin (PE)-conjugated anti-CD4, allophycocyanin (APC)-conjugated anti-IFN-γ, Percp-Cy5.5-conjugated anti-T-cell antigen receptor β, and Pacific Blue-conjugated anti-CD45.2 (all from BioLegend); PE-conjugated anti-IL-10 (BD Biosciences); and APC-conjugated anti-CD11b and APC-conjugated anti-Foxp3 (eBioscience). Cells were analyzed on an LSRII Cytometer (BD Biosciences) using FACSDiva (BD Biosciences) and FlowJo software (Tree Star). In each experiment, relevant negative-control groups and single-stained samples for each tissue were used to identify the populations of interest and to exclude others.
Statistical analysis.
Data were analyzed using the Student's t test to make comparisons between two groups. One-way ANOVA was used to compare several groups. Fisher's LSD or Tukey–Kramer procedure was used for follow-up pairwise comparison of groups after the null hypothesis had been rejected (p < 0.05). Kaplan–Meier survival curves were analyzed by log rank test to generate a χ2 value for significance. A repeated-measures ANOVA was used for the grip strength test and experimental autoimmune encephalomyelitis (EAE) scoring, with follow-up using the Student's t test. Results are presented as the mean ± SEM. In the graphs, y-axis error bars represent the SEM. Statistical calculations were performed using standard functions of Microsoft Excel, JMP software, and Prism version 5.0 software (GraphPad Software).
Results
The choroid plexus of mSOD1 mice is not spontaneously activated to enable leukocyte trafficking to the CNS
We first examined whether mo-MΦs are spontaneously recruited to the spinal cord of mSOD1 mice over the course of disease progression. To allow the detection of infiltrating mo-MΦs, we created BM-chimeric mice using BM cells from CX3CR1GFP/+ mSOD1 donor mice. We found that despite the massive microglial activation, starting from age 100 d (Fig. 1A), mo-MΦs were barely detected in the lumbar segment of the spinal cord in the CX3CR1GFP/+ chimeric mSOD1 mice, up until late progressive stages of the disease (Fig. 1A,B).
Figure 1.
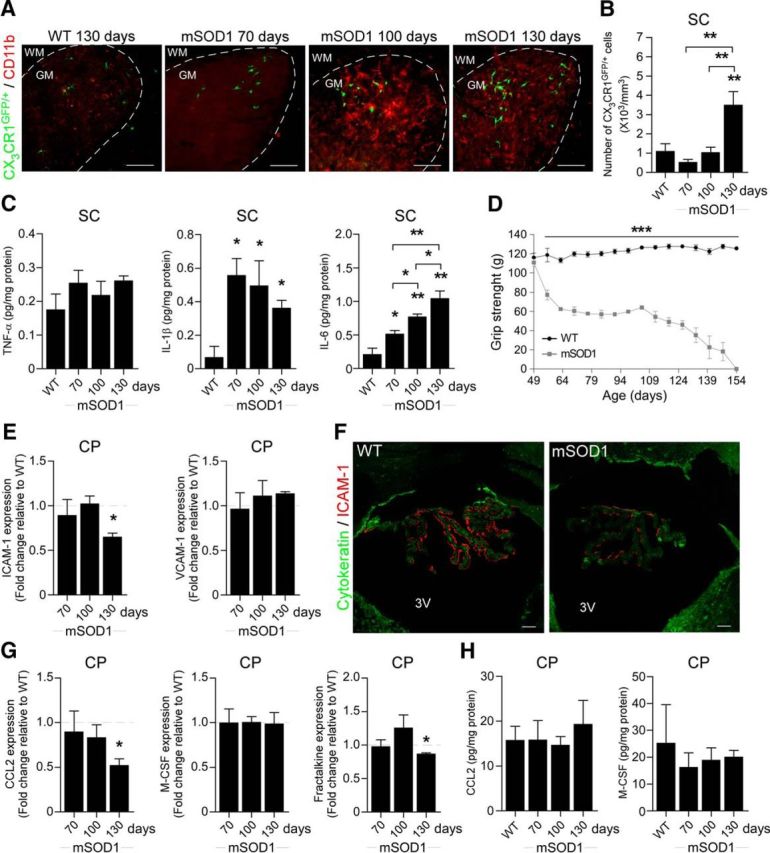
The choroid plexus of mSOD1 mice is not spontaneously activated to enable leukocyte trafficking to the CNS. A, Representative microscopic images of the spinal cord (SC) of CX3CR1GFP/+ BM-chimeric WT and mSOD1 mice at different time points immunostained for CD11b [scale bar, 100 μm; dashed line demarcates the white matter (WM) and gray matter (GM)]. B, Quantitative analysis of the CX3CR1GFP/+ mo-MΦs in the ventral horn of the spinal cord of the chimeric mice (n = 3–4 per group; bars represent the mean ± SEM; **p < 0.01, vs WT by ANOVA, followed by Student's t test post hoc analysis). C, Protein levels of the inflammatory cytokines TNF-α, IL-1β, and IL-6 in the spinal cord of WT and mSOD1 mice, were measured by Multiplex ELISA at different stages of the disease (n = 2 per group; bars represent the mean ± SD; *p < 0.05, **p < 0.01, vs WT by ANOVA, followed by Student's t test post hoc analysis). D, The forelimb grip strength of mSOD1 mice was measured weekly and compared with the grip strength of WT mice (n = 3–9 per group; mean ± SEM; ***p < 0.001; F = 226.45, p < 0.0001, by repeated-measures ANOVA, followed by Bonferroni post hoc analysis). E, mRNA levels of ICAM-1 and VCAM-1 in the CP of mSOD1 mice were measured by qPCR at different stages of the disease (n = 6–7 per group; bars represent the mean ± SEM; *p < 0.05, vs WT littermates by Student's t test). F, Representative confocal images of the CP of 130-d-old WT and mSOD1 mice stained for the epithelial marker cytokeratin and for ICAM-1 (scale bar, 50 μm). 3V, Third ventricle. G, mRNA levels of the chemokines CCL2, M-CSF, and fractalkine in the CPs of mSOD1 mice, measured by qPCR at different stages of the disease (n = 5–7 per group; bars represent the mean ± SEM; *p < 0.05, vs WT littermates by Student's t test). H, Protein levels of the chemokines CCL2 and M-CSF in the CPs of WT and mSOD1 mice, measured by Multiplex ELISA at different stages of the disease (n = 2–4 per group; bars represent the mean ± SD).
Upregulation of leukocyte-trafficking molecules by the CP epithelium is triggered by proinflammatory cytokines, which are elevated following acute spinal cord injury (Kunis et al., 2013; Shechter et al., 2013). We therefore examined the levels of proinflammatory cytokines in the spinal cord of mSOD1 mice during the course of disease progression, and found that the proinflammatory cytokines IL-1β and IL-6 were significantly elevated, relative to WT mice, as early as age 70 d, the first time point tested (Fig. 1C). Notably, muscle weakness, as measured by the forelimb grip strength test, was already observed at the age of 56 d in mSOD1 mice (Fig. 1D). The early elevation of the local inflammatory response within the spinal cord parenchyma, together with the delayed appearance of mo-MΦs, led us to consider that the CPs of mSOD1 mice might not be activated to facilitate trafficking of leukocytes to the CNS. We therefore tested, by real-time qPCR, the expression levels of leukocyte-trafficking molecules at the CPs of mSOD1 mice. The mRNA levels of ICAM-1 and VCAM-1, which are elevated in the CP following acute spinal cord injury (Kunis et al., 2013; Shechter et al., 2013), were not elevated in the CPs of mSOD1 mice relative to age-matched WT mice (Fig. 1E). Notably, the expression of ICAM-1 was even downregulated over the disease course (Fig. 1E). Immunohistochemical staining of the CPs showed that ICAM-1 was colocalized with the apical surface of the CP epithelium, as previously reported (Steffen et al., 1996; Kunis et al., 2013), and confirmed its reduction at the CP during the progressive stage of the disease (day 130) in mSOD1 mice (Fig. 1F). In addition, the levels of chemokines that are involved in leukocyte recruitment to the CNS following injury (Szmydynger-Chodobska et al., 2009, 2012; Kunis et al., 2013; Shechter et al., 2013), such as CCL2, M-CSF, and fractalkine (CX3CL1), were not elevated, as determined by either their mRNA (Fig. 1G) or protein (Fig. 1H) levels, in the CPs of mSOD1 mice. Thus, although the spinal cord parenchyma of mSOD1 mice shared similar proinflammatory signals with those elevated following acute spinal cord injury, their CP was not activated to enable leukocyte trafficking.
IFN-γ-dependent activation of the choroid plexus is impaired in mSOD1 mice
The CP of WT mice is populated by effector memory CD4+ T cells (Baruch et al., 2013; Kunis et al., 2013). Of the cytokines produced by these T cells, IFN-γ was found to be essential for inducing the expression of immune cell-trafficking molecules by the CP epithelium (Kunis et al., 2013). We therefore measured the expression levels of T-cell-derived cytokines at the CPs of mSOD1 mice. We found a general decrease, relative to WT mice, in the expression levels of both IL-4 and IFN-γ; specifically, IFN-γ expression levels showed a decline from 70 d of age onward (Fig. 2A). The examination of the CPs of mSOD1 mice at different stages of disease progression by flow cytometry confirmed a reduction in T-cell numbers, including CD4+ T cells, and, specifically, of IFN-γ-producing CD4+ T cells, as early as 70 d of age (Fig. 2B,C). Moreover, the numbers of both total T cells and of CD4+ T cells were lower in the CSF of 70-d-old mSOD1 mice (Fig. 2D) relative to WT mice, indicating a general reduction in CNS immune surveillance.
Figure 2.

IFN-γ-dependent activation of the choroid plexus is impaired in mSOD1 mice. A, mRNA levels of IFN-γ and IL-4 in the CPs of mSOD1 mice were measured by qPCR at different stages of the disease (n = 6–7 per group; bars represent the mean ± SEM; *p < 0.05, vs WT littermates by Student's t test). B, Representative flow cytometry dot plots showing the reduction in IFN-γ-producing CD4+ T cells at the CPs of 70-d-old mSOD1 mice relative to WT mice (n = 6–7 per group; the percentage ± SEM of IFN-γ+ cells is indicated above the gate; p = 0.008 by Student's t test). C, Quantitative analysis by flow cytometry of the numbers of total T cells and CD4+ T cells (presented as the fold change relative to WT littermates) in the CPs of mSOD1 mice at different stages of the disease (n = 4–6 per group; bars represent the mean ± SEM; *p < 0.05, vs WT littermates by Student's t test). D, Quantitative analysis by flow cytometry of the number of total T cells and CD4+ T cells in the CSF of 70-d-old WT and mSOD1 mice (n = 10 per group; graphs show the number of cells in individual mice and the mean ± SEM; **p < 0.01, ***p < 0.001, by Student's t test). E, CP epithelial cells from 70-d-old WT and mSOD1 mice were cultured in vitro and were treated with IFN-γ (100 ng/ml) or IL-4 (10 ng/ml), or were left untreated (UT). After 24 h in culture, mRNA levels of ICAM-1 and VCAM-1, and the chemokines CCL5 and CXCL10 in the cultured cells were measured by qPCR (n = 3 per group; bars represent mean ± SEM; **p < 0.01, ***p < 0.001, vs untreated cells by one-way ANOVA followed by Tukey's HSD post hoc analysis).
To test whether the CP of mSOD1 mice have an inherent inability to respond to effector T-cell cytokines, we cultured CP epithelial cells from WT and mSOD1 mice, and treated them with either IFN-γ or IL-4. mRNA levels of various trafficking molecules were measured 24 h following the addition of the tested cytokines. IFN-γ treatment significantly elevated the expression of trafficking molecules in CP cultures of both WT and mSOD1 mice (Fig. 2E), demonstrating that the CPs of mSOD1 mice could respond to effector T-cell-derived cytokines. These results further supported our contention that the lack of activation of the CP in mSOD1 mice could be an outcome of the observed IFN-γ insufficiency.
Immunization with a myelin-derived peptide activates the choroid plexus to support recruitment of leukocytes to the spinal cord
The above observations in mSOD1 mice that the CP was suppressed with respect to its ability to support leukocyte trafficking, coupled with the findings that the activation of the CP for immune cell trafficking requires IFN-γ signaling (Kunis et al., 2013), and that the healthy CP is enriched with CNS-specific T cells (Baruch et al., 2013), prompted us to test whether augmenting the levels of IFN-γ-producing autoimmune T cells in the periphery would be sufficient for activation of the CP to enable leukocyte trafficking in mSOD1 mice. To this end, we used an immunization approach that was previously found to evoke an immune response in rats that benefits recovery following spinal cord injury (Hauben et al., 2001). Thus, we immunized mSOD1 mice with a peptide derived from myelin oligodendrocyte glycoprotein (MOG), emulsified in incomplete Freund's adjuvant containing 0.5 mg/ml M. tuberculosis, without injections of pertussis toxin, which is routinely used to induce EAE. The immunization of mSOD1 mice resulted in a significant increase in the expression of adhesion molecules (Fig. 3A) and chemokines (Fig. 3B) by the CP, compared with PBS-injected mice, 14 d postimmunization; the increase was similar to that observed in WT mice following MOG immunization and was verified by immunohistochemical analysis, which showed an elevated expression of ICAM-1 by the CP epithelium (Fig. 3C). An elevation in the major histocompatibility complex II (MHC-II) molecule H2-Aα was also observed in the CP of the immunized mice (Fig. 3D), suggesting that antigen presentation in the CP could have a role in mediating leukocyte trafficking. The activation of the CP following MOG immunization was accompanied by a marked increase in total leukocyte numbers in the CSF, including T cells, which were composed mostly of CD4+ T cells (Fig. 3E,F). Notably, under the same experimental conditions, immunization of WT mice with ovalbumin (OVA), failed to induce T-cell recruitment to the CSF (Fig. 3F), thereby demonstrating that a CNS-specific antigen response is required to induce leukocyte trafficking through the CP.
Figure 3.

Immunization with a myelin-derived peptide activates the choroid plexus to support the recruitment of leukocytes to the spinal cord. A, B, mRNA levels of ICAM-1 and VCAM-1 (A); and the chemokines CCL2, M-CSF, CCL5, CXCL9, and CXCL10 (B) in the CPs of MOG-immunized WT and mSOD1 mice, 14 d postimmunization, were measured by qPCR, and were compared with levels in PBS-injected WT and mSOD1 mice (n = 6–13 per group; bars represent the mean ± SEM; *p < 0.05, **p < 0.01, ***p < 0.001, vs WT mice by one-way ANOVA followed by Student's t test post hoc analysis). C, Representative confocal images of CPs from MOG-immunized or PBS-injected WT mice, stained for the epithelial marker cytokeratin and for ICAM-1 (scale bar, 20 μm). 3V, Third ventricle. D, mRNA levels of MHC-II were measured by qPCR in the samples from A and B. E, Representative flow cytometry dot plots showing elevation of leukocyte populations in the CSF of MOG-immunized WT mice. F, Numbers of total T cells (black bars) and CD4+ T cells (gray bars) in the CSF of MOG-immunized WT and mSOD1 mice were quantified by flow cytometry, 14 d postimmunization, and were compared with the numbers in PBS-injected WT and mSOD1 mice and to the levels in OVA-immunized WT mice (bars represent the mean ± SEM; **p < 0.01, ***p < 0.001, vs PBS-injected WT mice by one-way ANOVA followed by Student's t test post hoc analysis). G, Representative microscopic images of the spinal cord central canal of MOG-immunized mSOD1 mice, 14 d postimmunization, stained for CD3 and vimentin (scale bar, 100 μm). H, Number of CD4+ T cells was quantified by flow cytometry in the spinal cords of MOG-immunized mSOD1 mice, 28 d postimmunization (n = 6 per group; bars represent the mean ± SEM; **p < 0.01, vs PBS-injected mSOD1 mice, Student's t test). I, Representative microscopic images of the spinal cord ventral horn of PBS-injected and MOG-immunized mSOD1 mice, 28 d postimmunization, stained for CD3 (scale bar, 100 μm). Dashed line demarcates the regions of gray matter (GM) vs white matter (WM). A higher-magnification image of the boxed area is shown (scale bar, 50 μm). J, mSOD1 mice were immunized with MOG, and their EAE scores were compared with those of MOG-immunized WT mice (n = 6 per group; mean ± SEM; F = 0.41, p = 0.535, by repeated-measures ANOVA).
Examination of the spatial distribution of the infiltrating cells in the CNS revealed the presence of T cells along the CP–CSF migratory pathway, including the spinal cord central canal, and along the central canal ependymal layer (Fig. 3G). Within the spinal cord parenchyma, MOG immunization resulted in a general increase in CD4+ T-cell levels (Fig. 3H); these cells homed to the spinal cord ventral horn, the area at which motor neurons reside (Fig. 3I). Notably, although we adopted a protocol that is not used to induce EAE, mild and transient symptoms of encephalomyelitis were observed in both WT and mSOD1 mice; these symptoms were spontaneously resolved by 28 d after the immunization (Fig. 3J).
Boosting an immune response to a myelin-derived peptide leads to accumulation of inflammation-resolving cells in the spinal cord parenchyma of mSOD1 mice
Resolution of an autoimmune response evoked against myelin antigens is associated with the accumulation of immunoregulatory Foxp3+ Treg cells in the CNS parenchyma (O'Connor et al., 2007). Therefore, we tested Treg levels in the spinal cord parenchyma of the mSOD1 mice following MOG immunization. At 28 d after the immunization, we found a significant elevation of Foxp3+ Tregs in both the spinal cord (Fig. 4A) and the CSF (Fig. 4B), but not in the blood (Fig. 4C). Notably, in the absence of immunization, Tregs were hardly detectable in the spinal cord of the mSOD1 mice (Fig. 4D). Analysis of the lumbar section of the spinal cord of the MOG-immunized mSOD1 mice by immunohistochemistry showed that Foxp3+ Tregs were localized in the ventral horn gray matter in close proximity to the motor neurons (Fig. 4E). In accordance with the increased levels of Tregs, qPCR analysis revealed a >10-fold increase in the expression of IL-10, and an increase in TGF-β1 expression, in the spinal cord of the MOG-immunized mSOD1 mice, relative to PBS-injected WT or mSOD1 mice (Fig. 4F); the proinflammatory cytokines TNF-α and IL-1β were elevated to a lesser extent (Fig. 4G). Overall, a shift in favor of an anti-inflammatory milieu was observed as a result of the immunization (Fig. 4H). Analysis by immunohistochemistry further revealed that IL-10 immunoreactivity was not solely restricted to T cells (Fig. 4I), a finding that led us to consider that other inflammation-resolving cells, such as mo-MΦs, might be involved. qPCR analysis of the lumbar spinal cord of the immunized mice further supported this notion by showing elevation in the expression levels of chemokines that are involved in the recruitment of mo-MΦs (Fig. 4J).
Figure 4.

Boosting an immune response to a myelin-derived peptide leads to the accumulation of inflammation-resolving cells in the spinal cord parenchyma of mSOD1 mice. A–D, Quantitative flow cytometry analyses of Foxp3+ Tregs in different tissues isolated from either MOG-immunized mSOD1 mice or PBS-injected WT and mSOD1 mice. A, Percentage of Foxp3+ Tregs in the spinal cord at 14 and 28 d postimmunization. B, C, Percentage of Foxp3+ Tregs in the CSF (B) and blood (C), 28 d postimmunization. D, Number of Foxp3+ Tregs in the spinal cord, 28 d postimmunization (n = 5–7 per group; bars represent the mean ± SEM; *p < 0.05, **p < 0.01, ***p < 0.001, by one-way ANOVA followed by Student's t test post hoc analysis). E, Representative microscopic images of the gray matter of the spinal cord ventral horn of MOG-immunized mSOD1 mice, 28 d postimmunization, stained for CD3+ T cells and Foxp3 (scale bar, 50 μm). Separate channels are presented. White arrowheads indicate the location of Foxp3+ T cells, and gray arrowheads indicate the location of Foxp3− T cells. F, G, mRNA levels of IL-10 and TGF-β1 (F), and of TNF-α and IL-1β (G) in the spinal cords of MOG-immunized mSOD1 mice, 28 d postimmunization, were measured by qPCR and compared with the levels in PBS-injected WT and mSOD1 mice. H, The ratio between expression levels of the different genes (n = 4–9 per group; bars represent the mean ± SEM; *p < 0.05, **p < 0.01, ***p < 0.001, vs WT mice by one-way ANOVA followed by Student's t test post hoc analysis). I, Representative microscopic images of the spinal cord ventral horn of MOG-immunized mSOD1 mice, 28 d postimmunization, stained for CD3+ T cells and for IL-10 (scale bar, 100 μm). Dashed line demarcates the regions of gray matter (GM) vs white matter (WM). Higher-magnification images of the boxed area and separate channels are presented (scale bar, 25 μm). White arrowheads indicate the location of IL-10+ T cells, and gray arrowheads indicate the location of CD3− IL-10+ cells. J, mRNA levels of the chemokines CCL5, CXCL9, CXCL10, CCL2, M-CSF, and CXCL12 in the spinal cords of MOG-immunized mSOD1 mice, 28 d postimmunization, were measured by qPCR and compared with levels in PBS-injected WT and mSOD1 mice (n = 4–6 per group; bars represent the mean ± SEM; *p < 0.05, **p < 0.01, ***p < 0.001, vs WT mice by one-way ANOVA followed by Student's t test post hoc analysis).
Immunization with a myelin-derived peptide recruits inflammation-resolving mo-MΦs to the spinal cord of mSOD1 mice
The above results prompted us to examine whether IL-10-expressing mo-MΦs are also recruited to the spinal cord parenchyma of MOG-immunized mSOD1 mice. To address this question, we first used WT BM-chimeric mice, in which head-protected irradiated recipients were reconstituted with CX3CR1GFP/+ BM cells and were subsequently immunized with MOG. As a result of the immunization, increased numbers of CX3CR1GFP/+ monocytes were found along the CP–CSF migratory pathway (Shechter et al., 2013), including the CP (Fig. 5A,B), CSF (Fig. 5C), central canal (Fig. 5D), and spinal cord parenchyma (Fig. 5E). Moreover, analysis by intracellular staining for IL-10-producing mo-MΦs by flow cytometry (Fig. 5F) revealed a significantly higher frequency of IL-10-producing cells among the CD11b+GFP+ infiltrating mo-MΦs, relative to their frequency among the CD11b+GFP− cells in the spinal cord (Fig. 5G). A similar effect on the recruitment of GFP+ monocytes to the CSF was observed in CX3CR1GFP/+ BM-chimeric mSOD1 mice (Fig. 5H). Immunohistochemical examination of the lumbar section of the spinal cord, 28 d following immunization, revealed the preferential accumulation of mo-MΦs in the gray matter of mSOD1 mice, relative to WT mice (Fig. 5I,J); IL-10-producing cells were found among these GFP+ cells (Fig. 5K). To rule out the possibility that monocyte infiltration to the spinal cord of the MOG-immunized mSOD1 mice reflected an outcome of the irradiation used to prepare the chimeric mice (Mildner et al., 2007), we also immunized nonchimeric mSOD1 mice with MOG and examined their spinal cords after 28 d by flow cytometry for CD11bHighCD45.2High infiltrating mo-MΦs (Fig. 5L). We found a significant elevation in these cells in the immunized mice, relative to PBS-injected mSOD1 mice (Fig. 5M). A higher percentage of IL-10-producing cells was found among the infiltrating CD11bHighCD45.2High mo-MΦ population, compared with the CD11bLowCD45.2Low microglia (Fig. 5N). To substantiate the relevance of the CP–CSF as a migratory route for the recruitment of mo-MΦs to the spinal cord, we injected GFP-expressing BM-derived monocytes through the cisterna magna directly into the CSF of MOG-immunized mSOD1 mice (Fig. 5O) 14 d following the immunization. Immunohistochemical analysis of the lumbar spinal cord 7 d later showed that the injected GFP+ cells homed to both the white matter and gray matter of the ventral horn and expressed the myeloid marker Iba1 (Fig. 5P). Notably, the cells were not seen in association with parenchymal blood vessels (Fig. 5Q). Together, these results showed that, as a result of the immunization, inflammation-resolving mo-MΦs homed to the CNS in mSOD1 mice, at least in part via the CP–CSF entry route.
Figure 5.

Immunization with a myelin-derived peptide recruits inflammation-resolving mo-MΦs to the spinal cords of mSOD1 mice. A–G, BM-chimeric WT mice were reconstituted with CX3CR1GFP/+ donor BM and were immunized with MOG. A, The percentages of mo-MΦs at the CPs of the mice were analyzed by flow cytometry at 28 d postimmunization (n = 4–5 per group; bars represent the mean ± SEM; **p < 0.01, Student's t test). B, Representative microscopic images of the CPs of MOG-immunized CX3CR1GFP/+ BM-chimeric mice, immunostained for the epithelial tight-junction molecule E-cadherin and for GFP (scale bar, 100 μm). 3V, Third ventricle. Higher-magnification image of the boxed area is shown (scale bar, 50 μm). C, Numbers of total monocytes in the CSF of MOG-immunized CX3CR1GFP/+ BM-chimeric mice were quantified by flow cytometry, 28 d postimmunization (n = 4–5 per group; bars represent the mean ± SEM; *p < 0.05, Student's t test). D, Representative microscopic images of the spinal cord central canal of MOG-immunized CX3CR1GFP/+ BM-chimeric WT mice, 28 d postimmunization, stained for GFP and vimentin (scale bar, 25 μm). E, Quantitative analysis by flow cytometry of CX3CR1GFP/+ mo-MΦs in the spinal cords of the chimeric mice at 28 d postimmunization (n = 4–5 per group; bars represent the mean ± SEM; *p < 0.05, vs PBS, Student's t test). F, Representative flow cytometry dot plots showing IL-10 expression in the CD11b+GFP+ mo-MΦ and CD11b+GFP− populations in the spinal cord of MOG-immunized chimeric mice, 28 d postimmunization. G, Quantitative analysis of the percentages of IL-10+ cells of the CD11b+GFP+ mo-MΦ and CD11b+GFP− populations (n = 5 per group; bars represent the mean ± SEM; **p < 0.01, Student's t test). H, Numbers of total monocytes in the CSF of MOG-immunized CX3CR1GFP/+ BM-chimeric mSOD1 mice were quantified by flow cytometry, 28 d postimmunization (n = 4–5 per group; bars represent the mean ± SEM). I, Representative microscopic images of the spinal cord ventral horn of PBS-injected and MOG-immunized CX3CR1GFP/+ BM-chimeric WT and mSOD1 mice, 28 d postimmunization, stained for GFP to label the CX3CR1GFP/+-infiltrating mo-MΦs (scale bar, 100 μm). Dashed line demarcates the regions of gray matter (GM) vs white matter (WM). J, Quantitative analysis of the CX3CR1GFP/+ mo-MΦs in the ventral horn gray matter of the chimeric mice (n = 2–5 per group; bars represent the mean ± SD; ***p < 0.001, vs PBS-injected WT mice by ANOVA, followed by Student's t test post hoc analysis). K, Representative microscopic images of the spinal cord ventral horn gray matter of MOG-immunized mSOD1 mice, 28 d postimmunization, stained for GFP+ mo-MΦs and for IL-10 (scale bar, 25 μm). Separate channels are presented. Arrowheads indicate the location of IL-10+ mo-MΦs. L, Representative flow cytometry dot plots showing the CD11blowCD45.2low microglia and CD11bHighCD45.2High mo-MΦ populations in the spinal cord of PBS-injected and MOG-immunized mSOD1 mice, 28 d postimmunization. M, Quantitative analysis of the number of mo-MΦ (n = 4–5 per group; bars represent mean ± SEM; **p < 0.01, Student's t test). N, Representative flow cytometry dot plots and quantitative analysis of the percentage of IL-10-producing microglia or mo-MΦs in the spinal cord of MOG-immunized mSOD1 mice, 28 d postimmunization (n = 5 per group; bars represent the mean ± SEM; *p < 0.05, Student's t test). O–Q, GFP+ monocytes were injected into the fourth ventricle of MOG-immunized mSOD1 mice via the cisterna magna, 14 d postimmunization. O, Photograph of a posterior view of a mouse brain following the injection of Matrigel mixed with ink. 4V, Fourth ventricle. P, Q, Representative microscopic images of the spinal cord ventral horn of the monocyte-injected mice, 7 d following the injection, stained for GFP to label the injected cells and for Iba1 (P), and for GFP and laminin (Q; scale bars, 100 μm). Dashed line demarcates the regions of gray matter (GM) vs white matter (WM). Higher magnification images of the boxed area in separate channels are presented.
Boosting an immune response to a myelin-derived peptide slows down disease progression and results in increased survival of mSOD1 mice
We next examined the effect of MOG immunization on disease pathology in mSOD1 mice. We immunized the mice at 70 d of age, shortly following the appearance of clinical signs of ALS (Fig. 1D). We found an elevation in the expression levels of the growth factors IGF-1 and GDNF in the spinal cords of the immunized mice 28 d postimmunization (Fig. 6A), the time point at which immunoregulatory cells are found adjacent to the motor neurons. These growth factors were previously identified as neuroprotective in mSOD1 mice and were reported to have a beneficial effect on motor neuron soma size (Klein et al., 2005) and survival (Kaspar et al., 2003; Henriques et al., 2010). We therefore examined whether, at this time point, motor neuron fate was affected by the MOG immunization. Since Nissl staining was performed soon after the time that inflammation-resolving cells were seen in the spinal cord (day 100), motor neuron numbers were not altered (Fig. 6B,C); however, the surviving motor neurons in MOG-immunized mSOD1 mice maintained significantly larger soma size, compared with the PBS-injected group, which showed disease-associated reduction in cell size (Fig. 6D).
Figure 6.

Boosting an immune response to a myelin-derived peptide slows down disease progression and results in increased survival of mSOD1 mice. A, mRNA levels of IGF-1 and GDNF in the spinal cords of MOG-immunized mSOD1 mice, 28 d postimmunization, were measured by qPCR and compared with their levels in PBS-injected WT and mSOD1 mice (n = 4–6 per group; bars represent the mean ± SEM; *p < 0.05, ***p < 0.001, vs WT mice by one-way ANOVA followed by Student's t test post hoc analysis). B, Representative microscopic images of motor neurons (MN) in the spinal cord ventral horn of MOG-immunized mSOD1 mice, 28 d postimmunization, and PBS-injected WT and mSOD1 mice, stained by Nissl (scale bar, 25 μm). C, Quantitative analysis of the MN in the spinal cords of 100-d-old PBS-injected and MOG-immunized mSOD1 mice, 28 d postimmunization, as measured by the Nissl staining, compared with the numbers in PBS-injected WT mice (n = 3–6 per group; bars represent the mean ± SEM; *p < 0.05, **p < 0.01, vs WT by ANOVA, followed by Student's t test post hoc analysis). D, Measurements of MN soma size in Nissl-stained spinal cord sections (n = 3–6 per group; graphs show the area of individual cells in each group, and the mean ± SEM; *p < 0.05, vs WT mice by one-way ANOVA followed by Student's t test post hoc analysis). E, Forelimb grip strength of MOG-immunized mSOD1 mice was measured weekly and was compared with the grip strength of PBS-injected mSOD1 mice (n = 7 per group; mean ± SEM; **p < 0.01, ***p < 0.001; F = 4.05, p < 0.05, by repeated-measures ANOVA, followed by Bonferroni post hoc analysis). F, G, MOG-immunized mSOD1 mice (n = 19) had significantly longer life span, compared with PBS-injected mSOD1 mice (n = 23) as assessed by average survival age (F; bars represent the mean ± SEM; ***p < 0.001, Student's t test), and by Kaplan–Meier survival curves (G; log rank test, χ2 = 10.25, p = 0.0014).
To determine the effect of MOG immunization on motor function, we immunized a new cohort of mSOD1 mice, and followed their forelimb grip strength over the course of disease progression. MOG-immunized mice showed a slower decline in grip strength during the progressive stage of disease, relative to their PBS-injected littermates (Fig. 6E). Notably, although the immunized mice displayed a transient phase of muscle weakness, which was correlated with the mild EAE symptoms, it did not mask the overall beneficial effect on motor neuron disease attenuation (Fig. 6E).
Finally, we determined whether MOG immunization affected the life span of the mSOD1 mice. We found a significant increase in life span as a result of the immunization, from 146.5 ± 2.3 to 160 ± 2.3 d, an average increase of ∼14 d (Fig. 6F). The effect was most strongly apparent at 155 d of age, when 78.9% of the immunized mice were still alive, compared with only 17.4% of the PBS-injected animals (Fig. 6G).
Discussion
In the present study, we found that in the mSOD1 mouse model of ALS, recruitment of immunoregulatory cells to the diseased spinal cord parenchyma is limited due to the suppression of leukocyte trafficking through the CP. Activation of the CP to enable leukocyte trafficking, by active immunization with a myelin-derived peptide, resulted in the recruitment of IL-10-producing mo-MΦs and Tregs to the spinal cord gray matter, slower disease progression, and increased life expectancy of the mSOD1 mice.
Local inflammation within the CNS parenchyma is one of the hallmarks of neurodegenerative diseases and contributes to disease progression (Sargsyan et al., 2005; Beers et al., 2006). In both acute and chronic CNS pathologies, infiltration of T cells and monocytes is essential for controlling the resident microglia (Butovsky et al., 2006, 2007; Simard et al., 2006; Trivedi et al., 2006; Shechter et al., 2009; Shechter and Schwartz, 2013), which in neurodegenerative diseases become chronically activated and cytotoxic, and thereby actively reinforce the chronic nature of the inflammatory process (Liu et al., 2002).
A recent report (Butovsky et al., 2012) suggested that inflammatory monocytes are recruited to the spinal cord in mSOD1 mice and contribute to disease progression; those findings are in apparent disagreement with our results and those of other studies. Here, we found that in mSOD1 mice, mo-MΦs barely accumulate in the spinal cord parenchyma up to progressive stages of the disease, before the end stage. These results are in line with those of other reported studies, which examined mo-MΦ recruitment to the spinal cord of mSOD1 mice and reported either undetectable levels of mo-MΦs in the spinal cord (Ajami et al., 2007) or found them confined to the perivascular spaces of the blood–brain barrier (Lewis et al., 2009). In addition, a recent systematic deep RNA sequencing analysis of myeloid cell populations isolated from the spinal cord of mSOD1 mice revealed that only a negligible population of infiltrating myeloid cells is recruited during disease progression (Chiu et al., 2013).
The observed limited and delayed recruitment of immunoregulatory cells to the spinal cord of mSOD1 mice was attributed here, at least in part, to the immunological suppression of the CP, as a result of a reduction in the numbers of IFN-γ-producing cells in this compartment that occurred in parallel with disease progression. IFN-γ signaling at the CP epithelium is needed for physiological CNS immune surveillance (Kunis et al., 2013), and a decrease in this signaling pathway was found at the CP during aging, affecting brain function (Baruch et al., 2013; Baruch et al., 2014). As such, a reduction in IFN-γ production by peripheral blood mononuclear cells, and a general immune deficiency was previously reported in ALS patients (Banerjee et al., 2008; Seksenyan et al., 2010; Vaknin et al., 2011). Consistent with our present results is the reported observation that the CP epithelium of patients experiencing sporadic ALS does not express the MHC-II antigen human leukocyte antigen-DR (Vercellino et al., 2008). The expression of MHC-II in the mouse CP is IFN-γ dependent (Steffen et al., 1996; Kunis et al., 2013) and was found here to be elevated following MOG immunization. Notably, we did not find any inherent defect in the ability of mSOD1 CP epithelial cells to respond to IFN-γ in vitro.
Autoimmunity to CNS antigens, and specifically to myelin-derived peptides, has been suggested by our group to be part of the physiological response in CNS repair following damage (Moalem et al., 1999; Yoles et al., 2001). This benign autoimmune response (“protective autoimmunity”; Moalem et al., 1999) can contribute to the maintenance and protection of neurons (Ziv et al., 2006) and the promotion of recovery after traumatic injury to the CNS (Hauben et al., 2001; Schwartz and Baruch, 2014a). The ability to mount such a response is amenable to boosting by passive or active immunization (Moalem et al., 1999; Hauben et al., 2001; Shechter et al., 2009; Raposo et al., 2014).
In the present study, we adopted an approach that was shown to induce beneficial autoimmunity (Hauben et al., 2001). Such an approach might lead to mild and transient symptoms of encephalomyelitis, which do not mask the overall potential benefit of the evoked protective autoimmune response (Moalem et al., 1999; Hauben et al., 2001). In the present study, MOG immunization was found to activate the CP for immune cell trafficking. Specifically, levels of ICAM-1, which was previously shown to be essential for leukocyte epithelial transmigration (Porter and Hall, 2009), were found here to be reduced in the CP epithelium of mSOD1 mice and were elevated following MOG immunization. Moreover, CP expression of the chemokines CCL5, CXCL9, and CXCL10 was induced; these trafficking determinants were previously shown by us to be upregulated at the CP by IFN-γ, but not by encephalitogenic cytokines, such as GM-CSF and IL-17 (Kunis et al., 2013). In addition, the immunization elevated the expression levels of chemokines in the spinal cord, including CXCL12 (stromal cell-derived factor-1), which were found to be elevated in the CP–CSF migratory pathway following spinal cord injury (Shechter et al., 2013). Thereby, the allostatic immunological niche within the CNS parenchyma of the immunized mice could attract inflammation-resolving cells. In line with these results, it was previously shown that IFN-γ signaling is needed for leukocyte recruitment to the spinal cord and for induction of classic EAE following passive transfer of MOG-specific T-helper type 1 cells (Lees et al., 2008). The activation of the CP by MOG immunization was accompanied by the homing of CD4+ T cells and mo-MΦs to the CNS of mSOD1 mice. These cells were found within the CP–CSF migratory pathway, which includes the CSF and spinal cord central canal, which were previously characterized as the path for leukocyte homing to the injured spinal cord (Kunis et al., 2013; Shechter et al., 2013). Within the spinal cord parenchyma of the immunized mSOD1 mice, recruited cells were found in the gray matter of the ventral horn, where motor neurons reside, possibly due to the chemotactic signals expressed in these parenchymal regions in mSOD1 mice (Henkel et al., 2006).
In ALS murine models, Tregs were shown to attenuate the cytotoxic activity of microglia (Beers et al., 2006; Zhao et al., 2012). Our immunization approach resulted in a marked elevation in inflammation-resolving cells, including IL-10-producing Foxp3+ Tregs and mo-MΦs, in the spinal cords of the immunized mice. IL-10-expressing mo-MΦs were previously shown to locally contribute to the repair process within the spinal cord parenchyma following injury (Shechter et al., 2009). In addition to IL-10, we found a local elevation of TGF-β1, IGF-1, and GDNF expression. TGF-β1 is known to be involved in the conversion of encephalitogenic CD4+ T cells to Tregs (Liu et al., 2006) and in the induction of IL-10 production by monocytes (Maeda et al., 1995); and IGF-1 and GDNF are neurotrophic factors that were shown to support motor neuron survival and to be beneficial in ALS (Kaspar et al., 2003; Henriques et al., 2010). Specifically, GDNF levels were shown to correlate with the preservation of motor neuron soma size in a rat model of ALS (Klein et al., 2005). The increased expression of neurotrophic factors, found here in the spinal cord of the immunized mSOD1 mice, together with the greater increase in IL-10 than in TNF-α and IL-1β, was part of an overall shift toward an anti-inflammatory milieu. Importantly, the overall neuroprotective effect of MOG immunization was manifested in slower motor function decline at the progressive stage of disease pathology and prolonged survival of the immunized mSOD1 mice. Our current experiments were performed using mSOD1 mice that express a high copy number of the mutant SOD1 protein, and thus exhibit a rapid decline in motor function accompanied by a short life expectancy. Therefore, the increased survival time of 14 d that was observed here is of strong biological significance. This effect may be more robust in disease models in which a slower rate of disease progression may allow the infiltrating immunoregulatory cells to counteract microglial toxicity and maintain homeostasis for a longer period.
Our findings, which demonstrate that an autoimmune response facilitates a neuroprotective effect in the CNS under chronic neurodegenerative conditions, suggest that this response is either suppressed or is not spontaneously evoked in mSOD1 mice, or is not activated in a timely manner to counteract the microglial toxicity associated with motor neuron death (Appel et al., 2010; Schwartz and Baruch, 2014a). These findings also emphasize that although ALS and the autoimmune disease remitting-relapsing multiple sclerosis (RRMS) share a chronic local neuroinflammatory component, they differ with respect to the adaptive immune response that is involved in these two diseases, reflecting a common outcome of two opposite types of peripheral immune imbalance (Schwartz and Baruch, 2014b). Accordingly, while RRMS, and its murine model EAE, are characterized in patients by an increased effector response in the periphery and massive infiltration of T cells to the CNS, mSOD1 mice exhibit a reduced adaptive immune response in the periphery, and negligible T-cell and monocyte infiltration into the CNS (Ajami et al., 2007; Banerjee et al., 2008; Lewis et al., 2009; Finkelstein et al., 2011; Kawamura et al., 2012; Chiu et al., 2013). These results might also explain why treatments aimed at suppressing systemic immunity, such as those used to treat RRMS, were not effective in ALS patients. Thus, for example, treatment of RRMS by the daily administration of glatiramer acetate, which results in Treg elevation in the periphery (Haas et al., 2009), can lead to an adverse outcome in mSOD1 mice (Schwartz et al., 2008); similarly, the systemic injection of suppressive M2 macrophages, which is beneficial in EAE, is harmful in mSOD1 mice (Vaknin et al., 2011). The clinical failure of the immunosuppressive drug minocycline in ALS patients, which showed either no beneficial effect or even disease exacerbation in some cases (Gordon et al., 2007), is in line with our findings that boosting a reparative peripheral immune response is required to mitigate the pathological process in ALS.
Our present approach does not directly target the mutant SOD1 protein or any other disease-specific factor, but rather introduces a more general concept regarding the need to facilitate the recruitment of immunoregulatory cells to the diseased CNS to mitigate the chronic neuroinflammation associated with neurodegenerative diseases. Importantly, however, while the identity of endogenous proteins that evoke a physiological neuroprotective immune response is not known, searching for the appropriate therapeutic antigen should be focused on identifying an antigen and immunization protocol that will boost the beneficial arm of the autoimmune response without evoking symptoms of autoimmune disease. Nonencephalitogenic peptides, such as altered peptide ligands (Conlon and Steinman, 2002), derived from CNS proteins seem to be promising candidates (Hauben et al., 2001; Shechter et al., 2009; Raposo et al., 2014).
Footnotes
This research was supported by European Research Council Grant 232835, given to M.S., and European Union Seventh Framework Programme Grant 279017, which was given to M.S. through the TargetBrain Consortium. M.S. holds The Maurice and Ilse Katz Professorial Chair in Neuroimmunology. We thank Dr. Shelley Schwarzbaum and Inbal Benhar for proofreading the manuscript, Dr. Tamara Berkutzki for histological processing, and Margalit Azoulay for animal handling.
The authors declare no competing financial interests.
References
- Ajami B, Bennett JL, Krieger C, Tetzlaff W, Rossi FM. Local self-renewal can sustain CNS microglia maintenance and function throughout adult life. Nat Neurosci. 2007;10:1538–1543. doi: 10.1038/nn2014. [DOI] [PubMed] [Google Scholar]
- Appel SH, Beers DR, Henkel JS. T cell-microglial dialogue in Parkinson's disease and amyotrophic lateral sclerosis: are we listening? Trends Immunol. 2010;31:7–17. doi: 10.1016/j.it.2009.09.003. [DOI] [PMC free article] [PubMed] [Google Scholar]
- Banerjee R, Mosley RL, Reynolds AD, Dhar A, Jackson-Lewis V, Gordon PH, Przedborski S, Gendelman HE. Adaptive immune neuroprotection in G93A-SOD1 amyotrophic lateral sclerosis mice. PLoS One. 2008;3:e2740. doi: 10.1371/journal.pone.0002740. [DOI] [PMC free article] [PubMed] [Google Scholar]
- Baruch K, Ron-Harel N, Gal H, Deczkowska A, Shifrut E, Ndifon W, Mirlas-Neisberg N, Cardon M, Vaknin I, Cahalon L, Berkutzki T, Mattson MP, Gomez-Pinilla F, Friedman N, Schwartz M. CNS-specific immunity at the choroid plexus shifts toward destructive Th2 inflammation in brain aging. Proc Natl Acad Sci U S A. 2013;110:2264–2269. doi: 10.1073/pnas.1211270110. [DOI] [PMC free article] [PubMed] [Google Scholar]
- Baruch K, Deczkowska A, David E, Castellano JM, Miller O, Kertser A, Berkutzki T, Barnett-Itzhaki Z, Bezalel D, Wyss-Coray T, Amit I, Schwartz M. Aging. Aging-induced type I interferon response at the choroid plexus negatively affects brain function. Science. 2014;346:89–93. doi: 10.1126/science.1252945. [DOI] [PMC free article] [PubMed] [Google Scholar]
- Beers DR, Henkel JS, Xiao Q, Zhao W, Wang J, Yen AA, Siklos L, McKercher SR, Appel SH. Wild-type microglia extend survival in PU.1 knockout mice with familial amyotrophic lateral sclerosis. Proc Natl Acad Sci U S A. 2006;103:16021–16026. doi: 10.1073/pnas.0607423103. [DOI] [PMC free article] [PubMed] [Google Scholar]
- Beers DR, Henkel JS, Zhao W, Wang J, Appel SH. CD4+ T cells support glial neuroprotection, slow disease progression, and modify glial morphology in an animal model of inherited ALS. Proc Natl Acad Sci U S A. 2008;105:15558–15563. doi: 10.1073/pnas.0807419105. [DOI] [PMC free article] [PubMed] [Google Scholar]
- Beers DR, Henkel JS, Zhao W, Wang J, Huang A, Wen S, Liao B, Appel SH. Endogenous regulatory T lymphocytes ameliorate amyotrophic lateral sclerosis in mice and correlate with disease progression in patients with amyotrophic lateral sclerosis. Brain. 2011;134:1293–1314. doi: 10.1093/brain/awr074. [DOI] [PMC free article] [PubMed] [Google Scholar]
- Butovsky O, Koronyo-Hamaoui M, Kunis G, Ophir E, Landa G, Cohen H, Schwartz M. Glatiramer acetate fights against Alzheimer's disease by inducing dendritic-like microglia expressing insulin-like growth factor 1. Proc Natl Acad Sci U S A. 2006;103:11784–11789. doi: 10.1073/pnas.0604681103. [DOI] [PMC free article] [PubMed] [Google Scholar]
- Butovsky O, Kunis G, Koronyo-Hamaoui M, Schwartz M. Selective ablation of bone marrow-derived dendritic cells increases amyloid plaques in a mouse Alzheimer's disease model. Eur J Neurosci. 2007;26:413–416. doi: 10.1111/j.1460-9568.2007.05652.x. [DOI] [PubMed] [Google Scholar]
- Butovsky O, Siddiqui S, Gabriely G, Lanser AJ, Dake B, Murugaiyan G, Doykan CE, Wu PM, Gali RR, Iyer LK, Lawson R, Berry J, Krichevsky AM, Cudkowicz ME, Weiner HL. Modulating inflammatory monocytes with a unique microRNA gene signature ameliorates murine ALS. J Clin Invest. 2012;122:3063–3087. doi: 10.1172/JCI62636. [DOI] [PMC free article] [PubMed] [Google Scholar]
- Chiu IM, Chen A, Zheng Y, Kosaras B, Tsiftsoglou SA, Vartanian TK, Brown RH, Jr, Carroll MC. T lymphocytes potentiate endogenous neuroprotective inflammation in a mouse model of ALS. Proc Natl Acad Sci U S A. 2008;105:17913–17918. doi: 10.1073/pnas.0804610105. [DOI] [PMC free article] [PubMed] [Google Scholar]
- Chiu IM, Morimoto ET, Goodarzi H, Liao JT, O'Keeffe S, Phatnani HP, Muratet M, Carroll MC, Levy S, Tavazoie S, Myers RM, Maniatis T. A neurodegeneration-specific gene-expression signature of acutely isolated microglia from an amyotrophic lateral sclerosis mouse model. Cell Rep. 2013;4:385–401. doi: 10.1016/j.celrep.2013.06.018. [DOI] [PMC free article] [PubMed] [Google Scholar]
- Conlon P, Steinman L. Altered peptide ligands and MS treatment. Science. 2002;296:1801–1802. doi: 10.1126/science.296.5574.1801c. [DOI] [PubMed] [Google Scholar]
- Finkelstein A, Kunis G, Seksenyan A, Ronen A, Berkutzki T, Azoulay D, Koronyo-Hamaoui M, Schwartz M. Abnormal changes in NKT cells, the IGF-1 axis, and liver pathology in an animal model of ALS. PLoS One. 2011;6:e22374. doi: 10.1371/journal.pone.0022374. [DOI] [PMC free article] [PubMed] [Google Scholar]
- Frank-Cannon TC, Alto LT, McAlpine FE, Tansey MG. Does neuroinflammation fan the flame in neurodegenerative diseases? Mol Neurodegener. 2009;4:47. doi: 10.1186/1750-1326-4-47. [DOI] [PMC free article] [PubMed] [Google Scholar]
- Gordon PH, Moore DH, Miller RG, Florence JM, Verheijde JL, Doorish C, Hilton JF, Spitalny GM, MacArthur RB, Mitsumoto H, Neville HE, Boylan K, Mozaffar T, Belsh JM, Ravits J, Bedlack RS, Graves MC, McCluskey LF, Barohn RJ, Tandan R, et al. Efficacy of minocycline in patients with amyotrophic lateral sclerosis: a phase III randomised trial. Lancet Neurol. 2007;6:1045–1053. doi: 10.1016/S1474-4422(07)70270-3. [DOI] [PubMed] [Google Scholar]
- Haas J, Korporal M, Balint B, Fritzsching B, Schwarz A, Wildemann B. Glatiramer acetate improves regulatory T-cell function by expansion of naive CD4(+)CD25(+)FOXP3(+)CD31(+) T-cells in patients with multiple sclerosis. J Neuroimmunol. 2009;216:113–117. doi: 10.1016/j.jneuroim.2009.06.011. [DOI] [PubMed] [Google Scholar]
- Hanisch UK, Kettenmann H. Microglia: active sensor and versatile effector cells in the normal and pathologic brain. Nat Neurosci. 2007;10:1387–1394. doi: 10.1038/nn1997. [DOI] [PubMed] [Google Scholar]
- Hauben E, Butovsky O, Nevo U, Yoles E, Moalem G, Agranov E, Mor F, Leibowitz-Amit R, Pevsner E, Akselrod S, Neeman M, Cohen IR, Schwartz M. Passive or active immunization with myelin basic protein promotes recovery from spinal cord contusion. J Neurosci. 2000;20:6421–6430. doi: 10.1523/JNEUROSCI.20-17-06421.2000. [DOI] [PMC free article] [PubMed] [Google Scholar]
- Hauben E, Agranov E, Gothilf A, Nevo U, Cohen A, Smirnov I, Steinman L, Schwartz M. Posttraumatic therapeutic vaccination with modified myelin self-antigen prevents complete paralysis while avoiding autoimmune disease. J Clin Invest. 2001;108:591–599. doi: 10.1172/JCI200112837. [DOI] [PMC free article] [PubMed] [Google Scholar]
- Hendrix S, Nitsch R. The role of T helper cells in neuroprotection and regeneration. J Neuroimmunol. 2007;184:100–112. doi: 10.1016/j.jneuroim.2006.11.019. [DOI] [PubMed] [Google Scholar]
- Henkel JS, Beers DR, Siklós L, Appel SH. The chemokine MCP-1 and the dendritic and myeloid cells it attracts are increased in the mSOD1 mouse model of ALS. Mol Cell Neurosci. 2006;31:427–437. doi: 10.1016/j.mcn.2005.10.016. [DOI] [PubMed] [Google Scholar]
- Henriques A, Pitzer C, Schneider A. Neurotrophic growth factors for the treatment of amyotrophic lateral sclerosis: where do we stand? Front Neurosci. 2010;4:32. doi: 10.3389/fnins.2010.00032. [DOI] [PMC free article] [PubMed] [Google Scholar]
- Hofstetter HH, Sewell DL, Liu F, Sandor M, Forsthuber T, Lehmann PV, Fabry Z. Autoreactive T cells promote post-traumatic healing in the central nervous system. J Neuroimmunol. 2003;134:25–34. doi: 10.1016/S0165-5728(02)00358-2. [DOI] [PubMed] [Google Scholar]
- Jung S, Aliberti J, Graemmel P, Sunshine MJ, Kreutzberg GW, Sher A, Littman DR. Analysis of fractalkine receptor CX(3)CR1 function by targeted deletion and green fluorescent protein reporter gene insertion. Mol Cell Biol. 2000;20:4106–4114. doi: 10.1128/MCB.20.11.4106-4114.2000. [DOI] [PMC free article] [PubMed] [Google Scholar]
- Kaspar BK, Lladó J, Sherkat N, Rothstein JD, Gage FH. Retrograde viral delivery of IGF-1 prolongs survival in a mouse ALS model. Science. 2003;301:839–842. doi: 10.1126/science.1086137. [DOI] [PubMed] [Google Scholar]
- Kawamura MF, Yamasaki R, Kawamura N, Tateishi T, Nagara Y, Matsushita T, Ohyagi Y, Kira J. Impaired recruitment of neuroprotective microglia and T cells during acute neuronal injury coincides with increased neuronal vulnerability in an amyotrophic lateral sclerosis model. Exp Neurol. 2012;234:437–445. doi: 10.1016/j.expneurol.2012.01.015. [DOI] [PubMed] [Google Scholar]
- Kipnis J, Mizrahi T, Yoles E, Ben-Nun A, Schwartz M, Ben-Nur A. Myelin specific Th1 cells are necessary for post-traumatic protective autoimmunity. J Neuroimmunol. 2002;130:78–85. doi: 10.1016/S0165-5728(02)00219-9. [DOI] [PubMed] [Google Scholar]
- Klein SM, Behrstock S, McHugh J, Hoffmann K, Wallace K, Suzuki M, Aebischer P, Svendsen CN. GDNF delivery using human neural progenitor cells in a rat model of ALS. Hum Gene Ther. 2005;16:509–521. doi: 10.1089/hum.2005.16.509. [DOI] [PubMed] [Google Scholar]
- Kunis G, Baruch K, Rosenzweig N, Kertser A, Miller O, Berkutzki T, Schwartz M. IFN-gamma-dependent activation of the brain's choroid plexus for CNS immune surveillance and repair. Brain. 2013;136:3427–3440. doi: 10.1093/brain/awt259. [DOI] [PubMed] [Google Scholar]
- Lees JR, Golumbek PT, Sim J, Dorsey D, Russell JH. Regional CNS responses to IFN-gamma determine lesion localization patterns during EAE pathogenesis. J Exp Med. 2008;205:2633–2642. doi: 10.1084/jem.20080155. [DOI] [PMC free article] [PubMed] [Google Scholar]
- Lewis CA, Solomon JN, Rossi FM, Krieger C. Bone marrow-derived cells in the central nervous system of a mouse model of amyotrophic lateral sclerosis are associated with blood vessels and express CX(3)CR1. Glia. 2009;57:1410–1419. doi: 10.1002/glia.20859. [DOI] [PubMed] [Google Scholar]
- Liu B, Gao HM, Wang JY, Jeohn GH, Cooper CL, Hong JS. Role of nitric oxide in inflammation-mediated neurodegeneration. Ann N Y Acad Sci. 2002;962:318–331. doi: 10.1111/j.1749-6632.2002.tb04077.x. [DOI] [PubMed] [Google Scholar]
- Liu Y, Teige I, Birnir B, Issazadeh-Navikas S. Neuron-mediated generation of regulatory T cells from encephalitogenic T cells suppresses EAE. Nat Med. 2006;12:518–525. doi: 10.1038/nm1402. [DOI] [PubMed] [Google Scholar]
- Maeda H, Kuwahara H, Ichimura Y, Ohtsuki M, Kurakata S, Shiraishi A. TGF-beta enhances macrophage ability to produce IL-10 in normal and tumor-bearing mice. J Immunol. 1995;155:4926–4932. [PubMed] [Google Scholar]
- Mildner A, Schmidt H, Nitsche M, Merkler D, Hanisch UK, Mack M, Heikenwalder M, Brück W, Priller J, Prinz M. Microglia in the adult brain arise from Ly-6ChiCCR2+ monocytes only under defined host conditions. Nat Neurosci. 2007;10:1544–1553. doi: 10.1038/nn2015. [DOI] [PubMed] [Google Scholar]
- Moalem G, Leibowitz-Amit R, Yoles E, Mor F, Cohen IR, Schwartz M. Autoimmune T cells protect neurons from secondary degeneration after central nervous system axotomy. Nat Med. 1999;5:49–55. doi: 10.1038/4734. [DOI] [PubMed] [Google Scholar]
- Nguyen MD, Julien JP, Rivest S. Innate immunity: the missing link in neuroprotection and neurodegeneration? Nat Rev Neurosci. 2002;3:216–227. doi: 10.1038/nrn752. [DOI] [PubMed] [Google Scholar]
- O'Connor RA, Malpass KH, Anderton SM. The inflamed central nervous system drives the activation and rapid proliferation of Foxp3+ regulatory T cells. J Immunol. 2007;179:958–966. doi: 10.4049/jimmunol.179.2.958. [DOI] [PubMed] [Google Scholar]
- Okabe M, Ikawa M, Kominami K, Nakanishi T, Nishimune Y. ”Green mice” as a source of ubiquitous green cells. FEBS Lett. 1997;407:313–319. doi: 10.1016/S0014-5793(97)00313-X. [DOI] [PubMed] [Google Scholar]
- Olsson T, Lidman O, Piehl F. Harm or heal—divergent effects of autoimmune neuroinflammation? Trends Immunol. 2003;24:5–6. doi: 10.1016/S1471-4906(02)00003-0. [DOI] [PubMed] [Google Scholar]
- Porter JC, Hall A. Epithelial ICAM-1 and ICAM-2 regulate the egression of human T cells across the bronchial epithelium. FASEB J. 2009;23:492–502. doi: 10.1096/fj.08-115899. [DOI] [PMC free article] [PubMed] [Google Scholar]
- Rapalino O, Lazarov-Spiegler O, Agranov E, Velan GJ, Yoles E, Fraidakis M, Solomon A, Gepstein R, Katz A, Belkin M, Hadani M, Schwartz M. Implantation of stimulated homologous macrophages results in partial recovery of paraplegic rats. Nat Med. 1998;4:814–821. doi: 10.1038/nm0798-814. [DOI] [PubMed] [Google Scholar]
- Raposo C, Graubardt N, Cohen M, Eitan C, London A, Berkutzki T, Schwartz M. CNS repair requires both effector and regulatory T cells with distinct temporal and spatial profiles. J Neurosci. 2014;34:10141–10155. doi: 10.1523/JNEUROSCI.0076-14.2014. [DOI] [PMC free article] [PubMed] [Google Scholar]
- Sargsyan SA, Monk PN, Shaw PJ. Microglia as potential contributors to motor neuron injury in amyotrophic lateral sclerosis. Glia. 2005;51:241–253. doi: 10.1002/glia.20210. [DOI] [PubMed] [Google Scholar]
- Schwartz M, Baruch K. The resolution of neuroinflammation in neurodegeneration: leukocyte recruitment via the choroid plexus. EMBO J. 2014a;33:7–22. doi: 10.1002/embj.201386609. [DOI] [PMC free article] [PubMed] [Google Scholar]
- Schwartz M, Baruch K. Breaking peripheral immune tolerance to CNS antigens in neurodegenerative diseases: boosting autoimmunity to fight-off chronic neuroinflammation. J Autoimmun. 2014b;54:8–14. doi: 10.1016/j.jaut.2014.08.002. [DOI] [PubMed] [Google Scholar]
- Schwartz M, Bukshpan S, Kunis G. Application of glatiramer acetate to neurodegenerative diseases beyond multiple sclerosis: the need for disease-specific approaches. BioDrugs. 2008;22:293–299. doi: 10.2165/00063030-200822050-00002. [DOI] [PubMed] [Google Scholar]
- Seksenyan A, Ron-Harel N, Azoulay D, Cahalon L, Cardon M, Rogeri P, Ko MK, Weil M, Bulvik S, Rechavi G, Amariglio N, Konen E, Koronyo-Hamaoui M, Somech R, Schwartz M. Thymic involution, a co-morbidity factor in amyotrophic lateral sclerosis. J Cell Mol Med. 2010;14:2470–2482. doi: 10.1111/j.1582-4934.2009.00863.x. [DOI] [PMC free article] [PubMed] [Google Scholar]
- Shechter R, Schwartz M. Harnessing monocyte-derived macrophages to control central nervous system pathologies: no longer “if” but “how.”. J Pathol. 2013;229:332–346. doi: 10.1002/path.4106. [DOI] [PubMed] [Google Scholar]
- Shechter R, London A, Varol C, Raposo C, Cusimano M, Yovel G, Rolls A, Mack M, Pluchino S, Martino G, Jung S, Schwartz M. Infiltrating blood-derived macrophages are vital cells playing an anti-inflammatory role in recovery from spinal cord injury in mice. PLoS Med. 2009;6:e1000113. doi: 10.1371/journal.pmed.1000113. [DOI] [PMC free article] [PubMed] [Google Scholar]
- Shechter R, Miller O, Yovel G, Rosenzweig N, London A, Ruckh J, Kim KW, Klein E, Kalchenko V, Bendel P, Lira SA, Jung S, Schwartz M. Recruitment of beneficial M2 macrophages to injured spinal cord is orchestrated by remote brain choroid plexus. Immunity. 2013;38:555–569. doi: 10.1016/j.immuni.2013.02.012. [DOI] [PMC free article] [PubMed] [Google Scholar]
- Simard AR, Soulet D, Gowing G, Julien JP, Rivest S. Bone marrow-derived microglia play a critical role in restricting senile plaque formation in Alzheimer's disease. Neuron. 2006;49:489–502. doi: 10.1016/j.neuron.2006.01.022. [DOI] [PubMed] [Google Scholar]
- Steffen BJ, Breier G, Butcher EC, Schulz M, Engelhardt B. ICAM-1, VCAM-1, and MAdCAM-1 are expressed on choroid plexus epithelium but not endothelium and mediate binding of lymphocytes in vitro. Am J Pathol. 1996;148:1819–1838. [PMC free article] [PubMed] [Google Scholar]
- Szmydynger-Chodobska J, Strazielle N, Zink BJ, Ghersi-Egea JF, Chodobski A. The role of the choroid plexus in neutrophil invasion after traumatic brain injury. J Cereb Blood Flow Metab. 2009;29:1503–1516. doi: 10.1038/jcbfm.2009.71. [DOI] [PMC free article] [PubMed] [Google Scholar]
- Szmydynger-Chodobska J, Strazielle N, Gandy JR, Keefe TH, Zink BJ, Ghersi-Egea JF, Chodobski A. Posttraumatic invasion of monocytes across the blood-cerebrospinal fluid barrier. J Cereb Blood Flow Metab. 2012;32:93–104. doi: 10.1038/jcbfm.2011.111. [DOI] [PMC free article] [PubMed] [Google Scholar]
- Trivedi A, Olivas AD, Noble-Haeusslein LJ. Inflammation and spinal cord injury: infiltrating leukocytes as determinants of injury and repair processes. Clin Neurosci Res. 2006;6:283–292. doi: 10.1016/j.cnr.2006.09.007. [DOI] [PMC free article] [PubMed] [Google Scholar]
- Vaknin I, Kunis G, Miller O, Butovsky O, Bukshpan S, Beers DR, Henkel JS, Yoles E, Appel SH, Schwartz M. Excess circulating alternatively activated myeloid (M2) cells accelerate ALS progression while inhibiting experimental autoimmune encephalomyelitis. PLoS One. 2011;6:e26921. doi: 10.1371/journal.pone.0026921. [DOI] [PMC free article] [PubMed] [Google Scholar]
- Vercellino M, Votta B, Condello C, Piacentino C, Romagnolo A, Merola A, Capello E, Mancardi GL, Mutani R, Giordana MT, Cavalla P. Involvement of the choroid plexus in multiple sclerosis autoimmune inflammation: a neuropathological study. J Neuroimmunol. 2008;199:133–141. doi: 10.1016/j.jneuroim.2008.04.035. [DOI] [PubMed] [Google Scholar]
- Walsh JT, Zheng J, Smirnov I, Lorenz U, Tung K, Kipnis J. Regulatory T cells in central nervous system injury: a double-edged sword. J Immunol. 2014;193:5013–5022. doi: 10.4049/jimmunol.1302401. [DOI] [PMC free article] [PubMed] [Google Scholar]
- Yoles E, Hauben E, Palgi O, Agranov E, Gothilf A, Cohen A, Kuchroo V, Cohen IR, Weiner H, Schwartz M. Protective autoimmunity is a physiological response to CNS trauma. J Neurosci. 2001;21:3740–3748. doi: 10.1523/JNEUROSCI.21-11-03740.2001. [DOI] [PMC free article] [PubMed] [Google Scholar]
- Zhao W, Beers DR, Liao B, Henkel JS, Appel SH. Regulatory T lymphocytes from ALS mice suppress microglia and effector T lymphocytes through different cytokine-mediated mechanisms. Neurobiol Dis. 2012;48:418–428. doi: 10.1016/j.nbd.2012.07.008. [DOI] [PMC free article] [PubMed] [Google Scholar]
- Ziv Y, Ron N, Butovsky O, Landa G, Sudai E, Greenberg N, Cohen H, Kipnis J, Schwartz M. Immune cells contribute to the maintenance of neurogenesis and spatial learning abilities in adulthood. Nat Neurosci. 2006;9:268–275. doi: 10.1038/nn1629. [DOI] [PubMed] [Google Scholar]