Abstract
The neural basis of amblyopia is a matter of debate. The following possibilities have been suggested: loss of foveal cells, reduced cortical magnification, loss of spatial resolution of foveal cells, and topographical disarray in the cellular map. To resolve this we undertook a population receptive field (pRF) functional magnetic resonance imaging analysis in the central field in humans with moderate-to-severe amblyopia. We measured the relationship between averaged pRF size and retinal eccentricity in retinotopic visual areas. Results showed that cortical magnification is normal in the foveal field of strabismic amblyopes. However, the pRF sizes are enlarged for the amblyopic eye. We speculate that the pRF enlargement reflects loss of cellular resolution or an increased cellular positional disarray within the representation of the amblyopic eye.
SIGNIFICANCE STATEMENT The neural basis of amblyopia, a visual deficit affecting 3% of the human population, remains a matter of debate. We undertook the first population receptive field functional magnetic resonance imaging analysis in participants with amblyopia and compared the projections from the amblyopic and fellow normal eye in the visual cortex. The projection from the amblyopic eye was found to have a normal cortical magnification factor, enlarged population receptive field sizes, and topographic disorganization in all early visual areas. This is consistent with an explanation of amblyopia as an immature system with a normal complement of cells whose spatial resolution is reduced and whose topographical map is disordered. This bears upon a number of competing theories for the psychophysical defect and affects future treatment therapies.
Keywords: amblyopia, contrast sensitivity, cortex, fMRI, pRF mapping, retinotopy
Introduction
Psychophysically, the hallmarks of amblyopia include a loss of contrast sensitivity at high spatial frequencies (Hess and Howell, 1977; Levi and Harwerth, 1977), spatial distortions (Hess et al., 1978; Lagrèze and Sireteanu, 1991), and mislocalization (Bedell and Flom, 1981; Levi et al., 1985; Hess and Holliday, 1992; Mansouri et al., 2009), as well as reduced global sensitivity for form and motion (Aaen-Stockdale et al., 2007). In strabismic amblyopia, perceptual loss is limited to the central field (Hess and Pointer, 1985). Although there may not be a single explanation for all these psychophysical deficits, a number of explanations have been advanced to explain the foveal spatial loss of contrast sensitivity and localization. These include loss of cells driven by the amblyopic eye (AME; Levi, 1991) leading to undersampling (Levi and Klein, 1983; Sharma et al., 1999), reduced cortical magnification (Hussain et al., 2015), disordered projection (Hess et al., 1978; Mansouri et al., 2009), and loss of spatial resolution of foveal neurons (Demanins et al., 1999).
Animal models of amblyopia have shown that strabismus or anisometropia produce a range of cortical deficits in V1, a loss of binocularity of cortical cells (Hubel and Wiesel, 1965), an upset in the excitatory/inhibitory balance of binocular cells (Sengpiel and Blakemore, 1996; Smith et al., 1997), reduced strength of cellular interactions (Roelfsema et al., 1994), and reduced mean sensitivity and mean spatial resolution of the foveal neurons (Kiorpes et al., 1998). It is unclear whether the number of cells driven by the AME is different from that driven by the fellow fixing eye (FFE). There is neurophysiological support for the amblyopic deficit extending well beyond V1 (Tao et al., 2014; Shooner et al., 2015).
The results of brain imaging in humans with amblyopia have been inconsistent. Some studies have argued for normal V1 function with the disturbance being exclusively restricted to the extrastriate cortex (Imamura et al., 1997; Sireteanu et al., 1998). Others have argued that V1 activation is reduced (Demer et al., 1988; Kabasakal et al., 1995; Goodyear et al., 2000; Barnes et al., 2001; Choi et al., 2001; Algaze et al., 2002; Conner and Mendola, 2005). A number of studies have shown that the extrastriate visual cortex is also affected (Barnes et al., 2001; Conner et al., 2007; Li et al., 2007b). However, to date human brain imaging has not resolved whether the cortical deficit is due to fewer cells, reduced cortical magnification for the AME's input, a disordered projection, or loss of cells' spatial resolution for the AME's input.
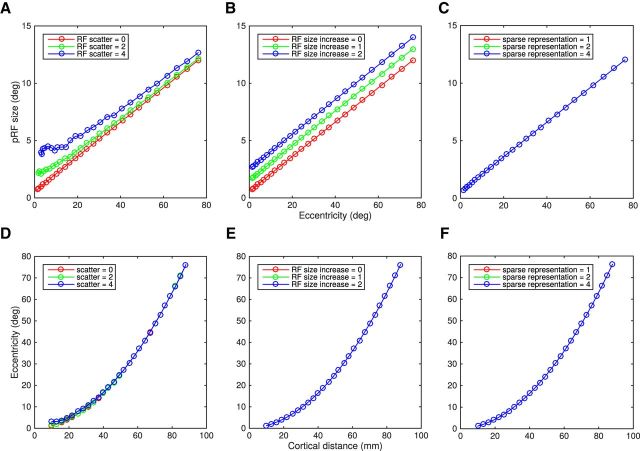
Figure 1 shows a simulation of how different types of cellular disturbances (e.g., loss of cells' spatial resolution, increased cellular disarray, and reduced cellular sampling) would affect the population receptive field (pRF) measures. The model regularly samples responses at the voxel level from a dense array of receptive fields, the parameters of which were taken from Harvey and Dumoulin (2011). The top row shows the effects of pRF size versus eccentricity. The bottom row shows the cortical magnification (eccentricity vs cortical distance). Loss of sampling within the bounds investigated here (Fig. 1, right) would affect neither pRF size nor cortical magnification. Enlargement of cellular receptive fields (Fig. 1, middle) would produce a corresponding increase to the pRF size at all eccentricities but no change in cortical magnification. An increased scatter in the position of cellular receptive fields (Fig. 1, left) will increase pRF size, particularly in the fovea as the pRF intercept follows the RF scatter closely. Cortical magnification will be unaffected.
Figure 1.
Effect of different types of neuronal disturbances in pRF and CMF estimation from simulation. pRFs were built and sampled regularly across a cortical surface. Position, shape, and size parameters of area V1 were taken from Harvey and Dumoulin (2011). The pRF is estimated from the total neuronal population within a voxel. Hence the properties of all the individual neurons influence the estimated pRF. Simulations were one-dimensional only. Each neuron was described as one point within the cortex represented by a line, the coordinates set between 0 (center of the fovea) and 100 mm. The relationship between CMF and eccentricity was calculated according to Equation 2 (Harvey and Dumoulin, 2011): CMF (mm/deg) = , with c = 0.04 mm−1 and d = 0.07°/mm based on that study. The position of the neuron's receptive field (RFmm) were computed from the integral of 1/CMF: RFmm = · mm2 + d · mm, where mm is the linear distance in millimeters from the center of the fovea. The size of the neuron's receptive field (RFsize) was calculated according to Equation 1: Rfsize(°) = a. RFmm + b, with a = 0.15°/° and b = 0.48°, based on that study (Harvey and Dumoulin, 2011). A–C, Top row shows pRF size versus eccentricity. D–F, Bottom shows the CMF, cortical distance versus eccentricity. Left column (A, D) shows the effect of different position scatters of the individual neurons (no scatter in red, 2° in green, and 4° in blue). Increasing RF scatter leads to an increase of pRF size (Zuiderbaan et al., 2012) while CMF is hardly affected. Interestingly, the pRF intercept follows the RF scatter closely. B, E, Middle column, Effect of increasing the individual RF sizes (original size in red, +2° in green, and +4° in blue). An increase of RF size provokes an increase of the pRF sizes across all eccentricities but CMF is not affected. C, F, Right column, Effect of reducing the number of neurons within a voxel by sparsely sampling the RFs (fewer RFs contributing to the signal). A sparse representation of 1 means that all RFs were sampled, a sparse representation of 2 corresponds to sample every other RFs, a sparse representation of four corresponds to sample every four RFs. Decreasing the sampling does not lead to any change either in pRF size or in CMF. In all cases, red lines show the same original scenario.
Guided by these simulations, we have set out to address three issues using a functional magnetic resonance imaging (fMRI) pRF analysis (Dumoulin and Wandell, 2008) in humans with moderate-to-severe amblyopia: (1) Is cortical magnification reduced in the AME's representation? (2) Is there a loss of spatial resolution of cells? (3) Is the topological cortical map disordered for the projection from the AME?
Materials and Methods
Subjects
Eight subjects with amblyopia (three males; mean age, 33.5 years; range, 22–60 years) and four control subjects with normal vision (four males; mean age, 27.5 years; range, 21–31 years) participated in this study. The participants with amblyopia were selected based on normal or corrected-to-normal visual acuity with their fellow eye but a severe reduction of visual acuity with their AME [≥0.5, ≤0.9 in LogMAR (logarithm of the minimum angle of resolution) units] with a history of amblyopia in childhood. We ensured that all subjects perceived the visual stimulus, the eye-tracking calibration targets, and the fixation target (Table 1).
Table 1.
Clinical details
| Subject | Gender/age | Type | Refraction |
Visual acuity (LogMAR units) |
Squint | Stereo (arcsecs) | Suppression | History | ||
|---|---|---|---|---|---|---|---|---|---|---|
| Left eye | Right eye | Left eye | Right eye | |||||||
| A1 | Female/30 years | Right eye: strabismus | −0.5 | Plano | 0.0 | 0.9 | Right eye, esotropia, 12o | None | Strong | Detected: 4 years; patched for 4 years; strabismic surgery at 7 years |
| A2 | Male/32 years | Right eye: mixed | Plano | +2.50/−0.5 × 180 | −0.1 | 0.7 | Right eye, exotropia (intermittent), 2° | <800 | Central | Detected at 5 years; patched for 6 months; no surgery |
| A3 | Male/42 years | Right eye: strabismus | −1.25/−0.25 × 103 | +0.5/−1.25 × 90 | −0.1 | 0.6 | Right eye, exotropia, 10° | None | Central | Detected at 10 years; patched for 1 year plus training; no surgery |
| A4 | Female/22 years | Left eye: strabismus | +1.50/−1.00 × 95 | +2.00/−0.55 × 75 | 0.7 | 0.0 | Left eye, esotropia, 21° | None | Central | Detected at 5 years; patched for 6 months at 6 years; no surgery |
| A5 | Female/35 years | Right eye: strabismus | Plano | −1.00 | −0.1 | 0.5 | Right eye, esotropia, 5° | None | Strong | Detected at 5 years; patched for 6 months; no surgery |
| A6 | Female/60 years | Left eye: mixed | +8.50/−0.75 × 100 | +4.25/−1.00 × 80 | 0.7 | 0.0 | Left eye, esotropia, 5° | None | Central | Detected at 12 years; patched for 6 months; no surgery |
| A7 | Male/24 years | Right eye: strabismus | +0.50/−0.25 × 90 | +1.5 | 0.0 | 0.7 | Right eye, exotropia, 1° | <800 | Strong | Detected at 20 years; no patch; no surgery |
| A8 | Female/23 years | Right eye: strabismus | −0.75/−0.50 × 60 | Plano | 0.0 | 0.5 | Right eye, exotropia, 15° | None | Strong | Detected at 2 years; patched for 5 years; 2 strabismic surgeries at 2 years |
The control subjects had normal or corrected-to-normal visual acuity and no previous history of binocular dysfunction. The experimental procedures were performed with the informed consent of the subjects and were approved by the Ethics Review Board of the Montreal Neurological Institute, consistent with the Declaration of Helsinki.
Display
Visual stimuli were generated in Matlab using the PsychToolbox (Brainard, 1997; Pelli, 1997). They were backprojected on a screen outside of the bore at a viewing distance of 140 cm. The stimulus radius was 6° of visual angle. The stimulus consisted of a drifting bar enveloped with a moving checkerboard pattern carrier (100% contrast), as previously used for pRF mapping (Dumoulin and Wandell, 2008; Zuiderbaan et al., 2012). The bar width was 1.5°, one-fourth of the stimulus radius. Alternating rows of checks moved along the main axis of the bar in opposite direction. The spatial frequency of the checks was 1.75 cycles per degree (cpd). The bar moved across the stimulus aperture in 12 evenly spaced steps (1°) every 2 s. Four bar orientations with two different motion directions were used. Four periods of mean luminance lasting 12 s were included in each scan. Eye fixation was controlled by means of a fixation task. Subjects had to report, via button press, the occurrence of a color change of the fixation target (from red to green or green to red). The stimuli were viewed monocularly, the FFE [or dominant eye (DE) for a normal subject] or the AME [or nondominant eye (nDE) for a normal subject] being covered by a black patch during the recording of a whole fMRI time series, the order alternating between time series.
Training session
The pRF method is sensitive to eye position and eye movements and amblyopic participants can have unsteady fixation with their AME under monocular conditions. To promote stable visual fixation, different types of fixation targets were tested during a training session in the laboratory where the conditions of the scanning experiment (retroprojection of the visual stimulus and viewing distance) were reproduced. The long-range eye-tracking camera used inside the scanner room was replaced by a short-range camera.
Three amblyopic volunteers (A1, A4, and A7) required a two-pixel-wide diagonal cross that spread from edge to edge of the projected image to increase their fixation stability (used for both FFE and AME). The fixation performances of the five other volunteers were not affected by any modification of the central target. Therefore a three-pixel-wide central dot was provided. In addition, due to poor visual acuity, the size of the visual targets used for eye movement calibration before eye movement recording had to be increased by a factor of two for participants A1, A4, and A7.
MRI
Data acquisition
The MRIs were acquired with a Siemens Trio 3T MRI scanner. The subjects were lying on their back with a 32-channel surface coil centered over their occipital pole. Head position was fixed using foam head rest.
Two to three three-dimensional (3D) high-resolution T1-weighted anatomical MR images covering the entire brain were acquired before the functional scans (3D-MPRAGE sequence; TR/TE = 2300/2.98 ms; TI = 900 ms; 176 sagittally oriented slices; slice thickness, 1 mm; 256 × 240 acquisition matrix). One additional anatomical scan was recorded with the posterior section of the head coil (24 channels) at the beginning of the scanning session (for coregistration within a single session). The functional images were recorded using the posterior section of the head coil only. The anterior section of the head coil had to be removed because it created shadows preventing sufficient infrared illumination of the eyes required for correct eye tracking. Multislice T2*-weighted gradient-echo echo-planar imaging functional images (TR/TE = 1940/30 ms; flip angle, 76°; slice number, 32 with no gap; slice thickness, 2 mm) were acquired with a 128 × 128 acquisition matrix, a 256 × 256 mm rectangular field of view, and generalized autocalibrating partially parallel acquisitions (acceleration factor along phase encoding direction, 3; reference lines, 33). The slices were pseudocoronally oriented to be perpendicular to the calcarine sulcus and covered the entire occipital lobe. Each fMRI time series was made of 106 measurements. Eight to sixteen fMRI scans per eye were collected with the amblyopic subjects in two 2-h-long sessions. Eight fMRI scans per eye were collected with the control subjects in a single session. The order between monocular viewing conditions (FFE and AME or DE and nDE) alternated between times series within a session.
Eye-movement recording
Monocular eye movements of the amblyopic participants were recorded during the fMRI scanning process with a EyeLink 1000 fMRI-compatible eye tracker (SR-Research) sampling at 500 Hz. The long-distance camera was placed at the bottom part of the posterior aperture of the bore in order not to occlude either the visual stimulus or the calibration target. Eye calibration was performed before each functional scan. The typical visual presentation of the calibration target used by the EyeLink system (yellow circles on a black background) was replaced by black circles on the mean luminance background. The targets were randomly presented at nine possible locations placed on a grid (a 12° wide square).
Data analysis
Processing of the anatomical images.
Volumetric segmentation was performed with the Freesurfer image analysis suite (http://surfer.nmr.mgh.harvard.edu/). This processing includes intensity normalization of the multiple whole-brain individual T1-weighted images (Sled et al., 1998), motion correction and averaging of the images (Reuter et al., 2010), and cortical segmentation (Dale et al., 1999; Fischl and Dale, 2000). The resulting T1-weighted image and its corresponding segmented image were then further processed to minimize segmentation errors using itkgray (http://www.itksnap.org/pmwiki/pmwiki.php). The left-hemisphere and right-hemisphere cortical surfaces were reconstructed at the white/gray matter border, rendered as two smooth 3D surfaces (Wandell et al., 2000), and inflated with SurfRelax (http://www.pc.rhul.ac.uk/staff/J.Larsson/software.html). The whole gray matter thickness was sampled at four equidistant layers (Layer 1 being at the gray/white matter border). fMRI data projected onto the surface (Layer 1) represented the average of the four layers.
Preprocessing of functional images.
The fMRI data were preprocessed using SPM8 (http://www.fil.ion.ucl.ac.uk/spm/software/). The first 10 fMRI measurements of each functional run were discarded to cope with the T2* contrast saturation effect. The functional data underwent a series of preprocessing steps, including slice scan time correction and 3D rigid motion correction (with realignment to the mean volume). The images were coregistered to the reference anatomy image. The time series were finally averaged for each eye condition. There was no spatial smoothing or normalization to stereotaxic space.
Statistical analysis.
The fMRI data were analyzed using mrVista (http://white.stanford.edu/newlm/index.php/Main_Page), the present methods being an application of those already described (Dumoulin and Wandell, 2008; Harvey and Dumoulin, 2011; Zuiderbaan et al., 2012). pRF sizes and positions were estimated from the fMRI data and the position of the stimulus position in the visual field (Dumoulin and Wandell, 2008). The BOLD response of each voxel was predicted using a two-dimensional (2D) Gaussian pRF model. That model described a receptive field with three parameters, the position (x0 and y0) of its center and its spread (σ). The predicted time course was calculated by convolution of the modeled pRF, the stimulus sequence, and a two-gamma canonical BOLD hemodynamic response function (HRF; Friston et al., 1998; Glover, 1999; Worsley et al., 2002). The pRF parameters for each voxel are estimated by minimizing the sum of square errors (RSS) between the predicted and observed fMRI times series.
The model was in fact estimated three times in several steps. The model of the fMRI data from the FFE was estimated in a first step using the two-gamma canonical BOLD HRF (Friston et al., 1998; Glover, 1999; Worsley et al., 2002). The pRF position parameters x0 and y0 estimated from that model were transformed into polar angles and eccentricity values, and those were mapped and projected onto the inflated surfaces. The borders of area V1 were detected and drawn to create a volumetric region of interest. To optimize the pRF parameters for each individual, the model was then re-estimated in a second step using the data from the V1 region of interest (ROI) only. The purpose was to determine the best HRF fitting function. Once done, a refined model using the optimal V1 HRF function was finally, in a third step, re-estimated on the whole volume of fMRI data for the FFE viewing condition and the AME viewing condition. Hence, fMRI data from the two eyes were compared using the same model.
The unsteady fixation with the AME under monocular conditions would affect the pRF estimates and affect comparison between FFE and AME viewing conditions. The position of visual field origin inside the model was corrected according to the median position of the eyes recorded during the functional scans (translation of coordinates). To compensate for difference in eye fixation, eye-movement instability was assessed by calculating the SD of the median AME positions at each fMRI recording time point (so every TR = 1940 ms) between the time series for each amblyopic subject. pRF estimations in FFE viewing condition were calculated after shifting the stimulus position in the model at each TR by that value.
ROI.
The pRF position parameters x0 and y0 estimated from the model of the FFE viewing condition were transformed into polar angles and eccentricity values, and those were mapped and projected onto the inflated surfaces. The borders of the cortical visual field maps (V1, V2, V3, V4, V3A, V3B, and LO-1) were identified for every subject based on the location of the visual meridians (Engel et al., 1994; Sereno et al., 1995; Wandell et al., 2007). The ROIs were computed from the conjunction of defined boundaries once the included voxels with low mean fMRI signal corresponding to pial draining veins were excluded (Winawer et al., 2010). fMRI data from the FFE viewing condition and fMRI data from the AME viewing condition were analyzed based on the same ROIs. Voxels with poor model fits (variance explained, <30%) in FFE and in AME viewing condition were excluded from the following computation. Comparisons were made between the same voxels.
The pRF size versus eccentricity was described by the following equation (Eq. 1): y = ax + b, where y is the pRF sizes, x is eccentricity, and a (in degrees/degree) and b (in degrees) are the slope and intercept respectively. The a and b terms were estimated according to Harvey and Dumoulin (2011) by minimizing the RSS to the eccentricity-binned data, with each error weighted by the inverse of the SEM in that bin. To determine cortical magnification factor (CMF), the fMRI data first had to be projected onto a 2D cortical surface (Harvey and Dumoulin, 2011). The distances between each location (mesh vertices) and their neighboring locations could then be computed in millimeters. Local CMF was calculated by dividing the mean cortical distance between the vertices and their neighboring vertices by the mean difference of their preferred pRF locations (in degree of visual angle). CMFs estimated were binned by eccentricity (every 0.25°). The population point image (pPI) was computed by multiplying the CMFs and pRF sizes estimated for each cortical location. As the relationship between eccentricity and inverse magnification could be described using linear equations (Duncan and Boynton, 2003), the CMF-versus-eccentricity function was described by the following equation (Eq. 2):
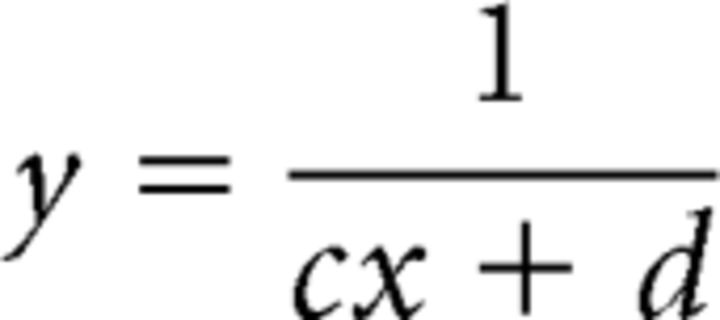 |
where y is CMF and x is eccentricity, c (in per millimeter), and d (in degrees per millimeter) are the slope and intercept respectively of the linear relationship between eccentricity and the inverse magnification. pPI was defined as the product of pRF and CMF so its equation was as follows (Eq. 3):
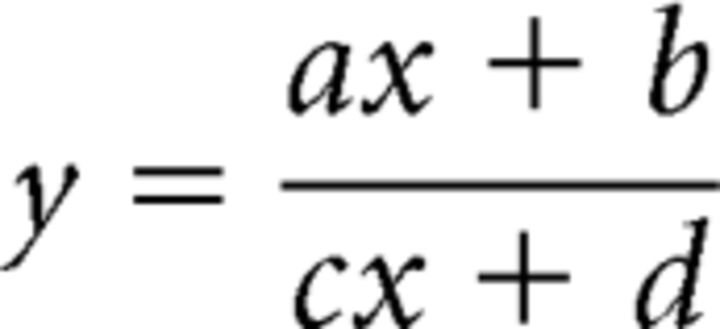 |
where y is pPI and x is eccentricity. With the same logic as that applied by Harvey and Dumoulin (2011), we used the CMF equation to describe the pPI changes across eccentricity.
The measure of pRF sizes used to assess Pearson's linear correlations between pRF sizes and clinical parameters or behavioral measurements (e.g., eye fixation quality and squint angle) was b, the estimated intercept of best fit regression lines (from Eq. 1).
The organization of the visual field maps derived from fMRI data of the AME viewing condition was directly comparable to that of the FFE viewing condition since the ROIs were similar and the models used similar parameters (such as the HRF). It was therefore possible to directly compare for every voxel the preferred pRF positions estimated from the two viewing conditions FFE and AME. We calculated the Pearson's correlation coefficients (r) for the azimuth and elevation values (in the visual field) and the correlation coefficients between the difference in eccentricity between the two models (AME − FFE) versus the eccentricity in the AME model.
Results
Global topographical representation is preserved in amblyopia
Before the questions pertaining to intra-areal properties (i.e., cortical magnification, receptive field size, and pPI) were addressed, we first assessed the quality of the global cortical representation of the information conveyed by the AME, the area boundaries, and interarea mapping correspondences across eccentricity. The mapping procedure enabled us to make an accurate polar angle and eccentricity-based estimate of not only the boundaries of visual areas driven by the AME but also to assess the quality of these topological representations as a function of visual field eccentricity. Figure 2 is an example from one control subject and one amblyope of the cortical regions for the fixing and fellow AME for eccentricity and polar-angle stimuli. The polar-angle maps show that the boundaries of the cortical areas defined by this approach appeared comparable for AME and fixing-eye input. No systematic shift in meridian positions were found once the shifts in eye-fixation position were corrected (by shifting the stimulus position; see Materials and Methods; Li et al., 2007a).
Figure 2.

Visual field maps extracted from pRF positions of a normal subject and an amblyopic participant (threshold of variance explained set at 10% for illustration purpose only). The figure shows posteroinferior views of left and right inflated surfaces. A, B, Maps for polar-angle (left) and eccentricity (right) of a normal subject. A, Maps when the stimulus was seen with the DE only. B, Maps when the stimulus was seen with the nDE only. C, D, Maps for polar angle (left) and eccentricity (right) of an amblyopic subject (subject A8). C, Maps when the stimulus was seen with the FFE only. D, Maps when the stimulus was seen with the AME only. C, D, Global organization of the visual information coming from the AME is consistent. The main difference between the two eyes is that there are fewer voxels that survived thresholding for the AME. The delimitation of the visual areas was based on the position of the upper vertical meridian (UVM; solid black line), lower vertical meridian (LVM; dotted black line), and horizontal meridian (HM, solid white line). The two insets on the top show the color overlays indicating the visual field angle (left) and the eccentricity (right). The visual areas are labeled on the polar-angle maps on A and C. For orientation clarity, the major sulci (outlined in dotted white lines) are labeled on the eccentricity maps (A, C). IPS, Intraparietal sulcus; TOS, transverse occipital sulcus; AOS, anterior occipital sulcus; LOS, lateral occipital sulcus; CaS, calcarine sulcus; OTS, occipitotemporal sulcus; COS, colateral sulcus.
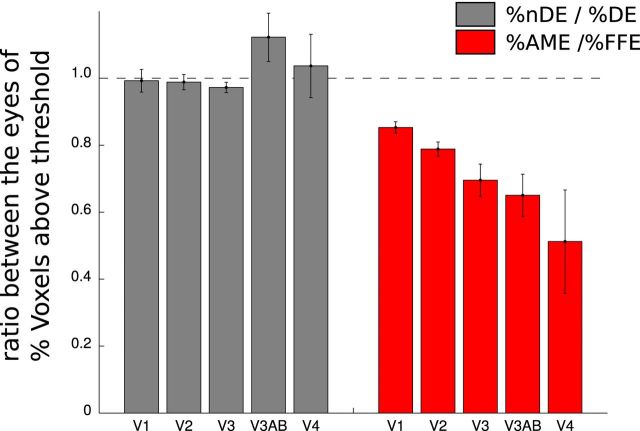
The quality of the model was determined by how much it explains the variance in the voxel response (Dumoulin and Wandell, 2008). There were, in general, fewer voxels that reached the threshold of 30% variance explained by the model in the AME compared with the FFE. We counted how many voxels had >30% of the variance explained as a percentage of the total number of voxels contained in each ROI (V1, V2, V3, V3A-B, and V4) and that for each eye (percentage DE and percentage nDE for the four normal subjects and percentage FFE and percentage AME for the eight amblyopes). We compared these quantities by calculating the ratio of the percentage of nDE to the percentage of DE for the normals and the ratio of the percentage of AME to the percentage of FFE for the amblyopes. Figure 3 shows that there were fewer voxels in the amblyopes that have >30% of the variance explained in the AME condition than in the FFE condition and that this difference increases from V1 to V4 (ratio in V1: 0.87; V2: 0.74; V3: 0.69; V3AB: 0.59; V4: 0.53). A one-way ANOVA revealed a statistically significant effect of Hierarchy (F(4,35) = 3.03, p < 0.05).
Figure 3.
Comparison of the numbers of voxels with >30% variance explained between the two eyes. For each ROI (V1, V2, V3, V3AB, and V4), we calculated, for DE and nDE in normal subjects, and for AME and FFE in amblyopes, how many voxels had more than 30% of their variance explained by the model, as a percentage of total number of voxels (%DE, %nDE, %AME, and %FFE). The mean and the SEs of the ratios between the two eyes for each ROI are reported in gray for the group of normal subjects (%nDE/%DE) and in red for the group of the amblyopes (%AME/%FFE). The DE and the nDE are very comparable in normals. In AME compared to FFE, fewer voxels have more than 30% of their variance explained. This difference increases from V1 to V4.
Increased pRF sizes in the AME
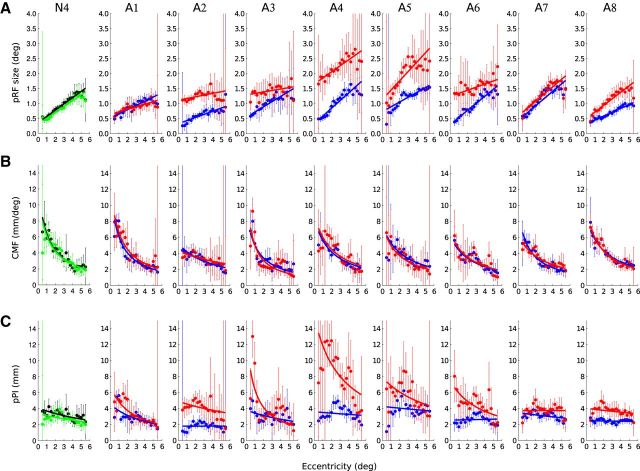
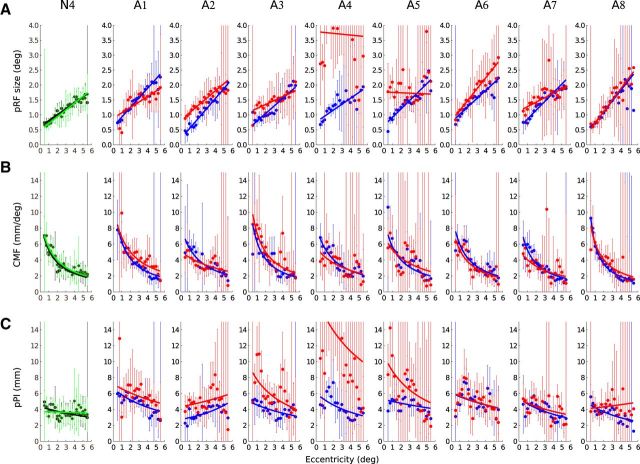
In Figures 4–6, we show how pRF sizes, CMF, and pPI change with eccentricity for the fixing eye and AME of each amblyope. Figures 4–6 respectively show the data from V1, V2, and V3. The values from the left and the right hemispheres and the upper and the lower visual fields were combined. We also show the results for the DE and nDE of one normal control. The results from the two eyes of the four normals were similar, comparable to those from previous studies with normals (Harvey and Dumoulin, 2011), and were combined in further analyses. The mean and SD of the values of slope and intercept (Eq. 1, a and b) are reported in Table 2.
Figure 4.
Change of pRF sizes, CMF, and pPI size across eccentricity in V1 voxels of a normal subject and the eight amblyopic participants. A, The pRF sizes increase with eccentricity. B, The CMF decreases with visual field eccentricity for the two eyes. C, The pPI is near constant for the DE and the nDE of normals and for the fellow eye of the amblyopes but decreases with eccentricity in the AME of the amblyopic subjects. The dots and the error bars represent the mean and SD of the binned data. The thick lines represent the best fitting regression line. Black, Data estimated from the DE of a normal. Green, Data from the nDE. Blue, Data from the fixing eye of the amblyopes. Red, Data from the AME.
Figure 5.
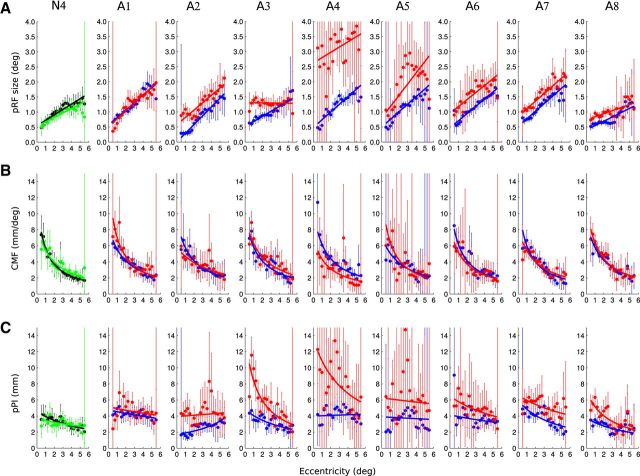
Change of pRF size (A), CMF (B), and pPI size (C) across eccentricity in V2 voxels of a normal subject and the eight amblyopic participants. Same configuration as Figure 4.
Figure 6.
Change of pRF size (A), CMF (B), and pPI size (C) across eccentricity in V3 voxels of a normal subject and the eight amblyopic participants. Same configuration as Figure 4.
Table 2.
Mean terms and SD for the best fitting function parameters from the individual data and linear measures of pRF sizes and CMF at 1° of eccentricity
| V1 |
V2 |
V3 |
||||||||||
|---|---|---|---|---|---|---|---|---|---|---|---|---|
| DE | nDE | FFE | AME | DE | nDE | FFE | AME | DE | nDE | FFE | AME | |
| pRF (Eq. 1) | ||||||||||||
| a (°/°) | 0.14 (±0.06) | 0.14 (±0.06) | 0.18 (±0.06) | 0.16 (±0.10) | 0.19 (±0.06) | 0.20 (±0.08) | 0.23 (±0.05) | 0.20 (±0.11) | 0.21 (±0.01) | 0.22 (±0.04) | 0.29 (±0.05) | 0.18 (±0.15) |
| b (°) | 0.40 (±0.03) | 0.30 (±0.12) | 0.44 (±0.15) | 1.02 (±0.41) | 0.40 (±0.15) | 0.34 (±0.15) | 0.45 (±0.14) | 1.04 (±0.68) | 0.57 (±0.05) | 0.50 (±0.15) | 0.56 (±0.19) | 1.33 (±1.07) |
| pRF size at 1° (°) | 0.48 (±0.11) | 0.62 (±0.15) | 1.18 (±0.40) | 0.56 (±0.14) | 0.68 (±0.13) | 1.25 (±0.66) | 0.75 (±0.09) | 0.84 (±0.16) | 0.84 (±0.98) | |||
| CMF (Eq. 2) | ||||||||||||
| c (mm−1) | 0.06 (±0.01) | 0.06 (±0.01) | 0.07 (±0.02) | 0.06 (±0.03) | 0.07 (±0.02) | 0.06 (±0.01) | 0.07 (±0.01) | 0.07 (±0.01) | 0.06 (±0.02) | 0.06 (±0.01) | 0.08 (±0.01) | 0.06 (±0.02) |
| d (°/mm) | 0.11 (±0.03) | 0.10 (±0.03) | 0.13 (±0.03) | 0.13 (±0.05) | 0.10 (±0.03) | 0.11 (±0.01) | 0.10 (±0.02) | 0.11 (±0.03) | 0.13 (±0.02) | 0.11 (±0.02) | 0.10 (±0.02) | 0.13 (±0.05) |
| CMF at 1° (mm/°) | 5.87 (±0.48) | 5.18 (±0.69) | 5.28 (±0.98) | 5.82 (±0.34) | 5.83 (±0.44) | 5.73 (±0.92) | 5.58 (±0.46) | 5.72 (±0.56) | 5.72 (±1.15) | |||
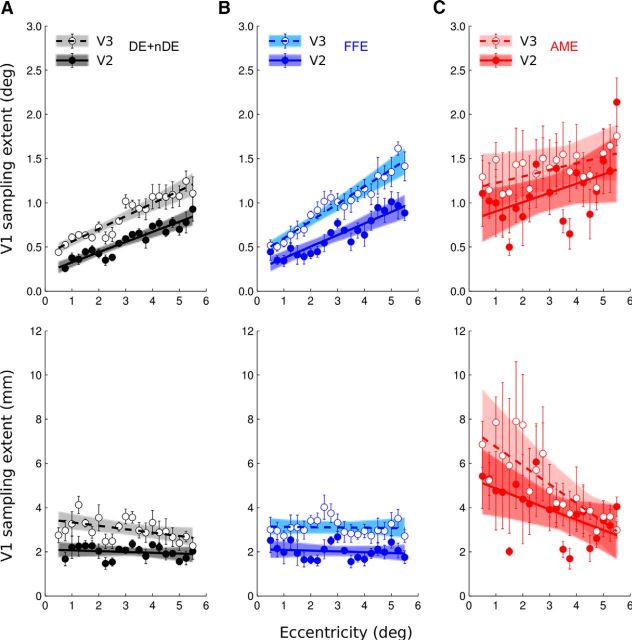
The sizes of the pRFs were comparable between the FFE and the normal eye (Table 2). There was no difference in intercept (Eq. 1, b) between FFE and the normal eye in V1 (T(14) = −1.43, p = 0.17), in V2 (T(14) = −0.96, p = 0.36), and in V3 (T(14) = −0.31, p = 0.76). However, the pRF sizes were found to be significantly larger in AME compared with FFE in V1 (comparison of the intercept: T(7) = −3.77, p < 0.01) and in V2 (T(7) = −2.54, p < 0.05). This difference was no longer significant in V3 (T(7) = −2.22, p = 0.06). At an eccentricity of 1°, the pRF sizes in V1 are estimated to be 0.48° in normal (with an SD of 0.11°) and 0.62° for the FFE (with an SD of 0.15°), whereas the pRF size in V1 was estimated to be 1.18° for AME (with an SD of 0.4°).
pRF sizes increased as a function of eccentricity. There was no difference between slope (Eq. 1, a) in FFE and in the normal eye in V1 (T(14) = −1.55, p = 0.15) and in V2 (T(14) = −1.21, p = 0.25). The slope in V3 was found to be steeper in the FFE (T(14) = −3.38, p < 0.01). For the normal eye and the FFE of the amblyopes, the slope was not different between V1 and V2 (normal: T(7) = −2.35, p = 0.06; FFE: T(7) = −2.03, p = 0.08) but steeper between V1 and V3 (normal: T(7) = −3.43, p < 0.05; FFE: T(7) = −2.97, p < 0.05).
pRF sizes of the AME also increased as a function of eccentricity in V1, V2, and V3, but the difference of pRF sizes between AME and FFE did not vary with eccentricity. Paired t test revealed no difference in the slope between FFE and AME in V1 (T(7) = 0.58, p = 0.58) and in V2 (T(7) = 0.91, p = 0.39), but a significant difference in V3 (T(7) = 2.50, p < 0.05). In contrast to the FFE, the slopes were not different, either between V1 and V2 (T(7) = −1.17, p = 0.28) or between V1 and V3 (T(7) = −0.38, p = 0.71). In V3, the slope in the AME was found to be shallower than for the FFE (T(7) = 2.50, p < 0.05).
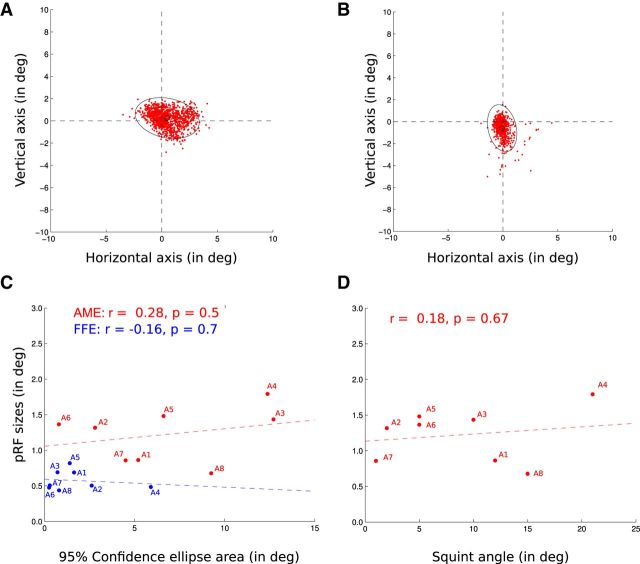
The analysis was not performed in higher visual areas. The model based on the presentation of a visual stimulus of 6° could not reliably explain the data on visual areas with receptive fields >6°. There was no significant correlation between pRF sizes in the AME-derived model and the visual deficits, as quantified by the interocular difference in LogMAR acuity (correlation coefficients: V1, r = 0.01, p = 0.99; V2, r = 0.09, p = 0.83; V3, r = 0.03, p = 0.94). Furthermore, the enlarged pRF sizes in the AME-derived model cannot be explained by the poorer fixation capacity of the participants (Fig. 7). The median position of the AME eye relative to the center of the visual stimulus display during an fMRI measurement (duration, 1940 ms) was calculated to account for saccadic eye movements as well as drifts. The variability of that median position was measured as the area of the 95% confidence ellipse. No statistically significant Pearson's correlation was found between the variability of the eye position and the size of the pRFs in V1 (AME: r = 0.28, p = 0.5; FFE: r = −0.16, p = 0.7), between the difference in variability between the two eyes (AME − FFE) and the difference in pRF sizes at the intercept in V1 (r = −0.07, p = 0.87) or between the variability of the eye position and the squint angle (r = 0.18, p = 0.67).
Figure 7.
Distribution of the AME positions during the recording session. Each red dot corresponds to the median position of the AME relative to the center of the visual stimulus display during the recording of an fMRI volume (duration of 1940 ms). This accounts for saccadic eye movements as well as drifts. The variability of the eye positions was measured as the area of the 95% confidence ellipses (black). A, B, AME positions of subject A1 (A) and A2 (B) during their two fMRI sessions. C, Lack of correlation between the 95% confidence ellipse areas (in the abscissas) and the pRF sizes (FFE, blue; AME, red). Each dot corresponds to an amblyopic participant, the colored dotted lines being the regression lines. D, Lack of correlation between the squint angles and the pRF sizes from the AME. Each dot corresponds to an amblyopic participant, the colored dotted line being the regression line.
Figure 8 illustrates the effect of first correcting for the eye movement in the AME (uncorrected, purple; corrected, red) and second applying the AME's movements to the FFE's measurements (normal fixing eye's results, black; fixing eye's results perturbed by AME's movement, blue). We show results for the amblyope with the largest eye movement deficit (A4). There are gains to be had by correcting for the larger eye movements of the AME, but the difference in response between the AME and the FFE (between the purple/black curve and between the red/blue curve) cannot be explained by the larger eye movements typical of the AME.
Figure 8.
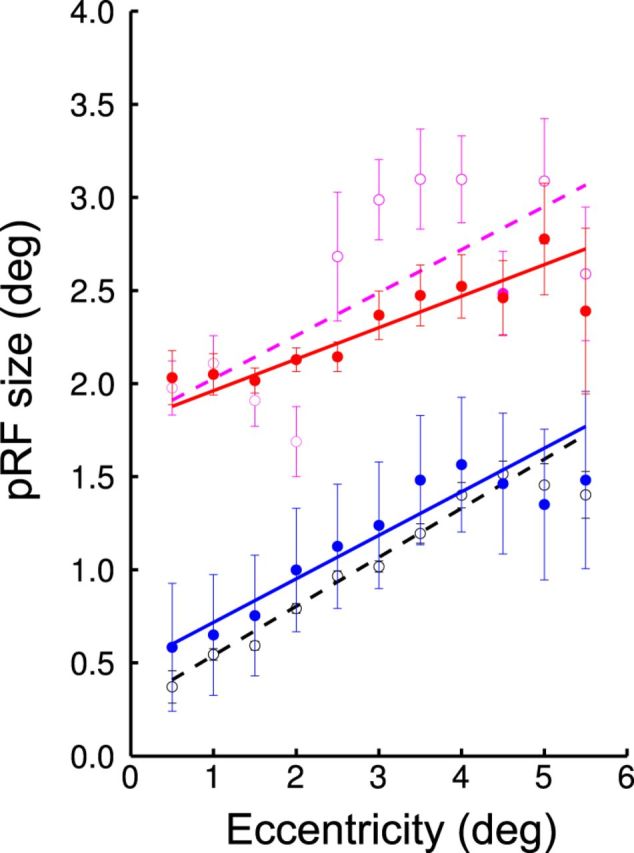
Change of pRF sizes across eccentricity in V1 voxels of the amblyopic participant A4. The figure illustrates how the unsteady fixation of the AME can affect the estimation of pRF sizes. The effect on the AME data can be seen by comparing the purple and the red lines. The configuration is very similar to that of Figure 4A, but the data were combined every 0.5° of eccentricity. The dots and error bars represent the mean and SD of the binned data. The line is the best fitting regression line. The purple open dots and dotted line represent the data from the AME without correction for eye movements. The red closed dots and thick line represent the data from the AME after correction, which mainly produced an overall reduction of the error bars. The data from the FFE are shown in black and blue. The black open dots and dotted line represent the data from the FFE without correction for eye movements. The blue closed dots and thick line represent the data from the FFE after correction using not the FFE's movements but the AME's movements instead. The eye-movement deficit produces an overall increase of variability (increase size of error bars) and also an increase of the pRF sizes close to the fovea (as predicted by the simulation; Fig. 1, left). This increase is nonetheless not large enough to explain the difference of pRF sizes between the AME and the FFE.
CMF is normal
The CMF decreases with respect to visual field eccentricity. The mean and SD of the values c and d (the parameters of Eq. 2) are reported in Table 2. The CMF at 1° of eccentricity is found to be in V1 5.87 mm/° for the normal eye, 5.18 mm/° for the FFE of the amblyopes, and 5.28 mm/° for the AME. There was no difference in the best fitting function slopes between the CMF estimated from the fellow eye and the AME in the amblyopes (paired t test based on parameter c value: in V1, T(7) = 0.50, p = 0.63; in V2, T(7) = 0.00, p = 1; in V3, T(7) = 2.18, p = 0.07; based on parameter d value: in V1, T(7) = −0.25, p = 0.81; in V2, T(7) = −0.39, p = 0.71; in V3, T(7) = −2.08, p = 0.08. The CMF of the amblyopes and the normals were comparable in V1, V2, and V3 (unpaired t test based on parameter c value between normal eye and FFE: in V1, T(14) = −0.68, p = 0.51; in V2, T(14) = 0.50, p = 0.63; in V3, T(14) = −2.06, p = 0.06; based on parameter d value: in V1, T(14) = −1.34, p = 0.20; in V2, T(14) = 0.24, p = 0.81; in V3, T(14) = 1.94, p = 0.07).
Thus, the results show a difference in pRF sizes between the models derived for the fellow eye and the AME of the amblyopic subjects but no difference in the CMF. As the pPI is directly calculated from the product of these two factors, there is a predicted difference between the pPI estimated from the fellow eye and that from the AME (Figs. 4C, 5C, 6C, 9C). The pPI was found to be near constant in V1 from the model derived from the DE and nDE of the normals (mean a/b = 0.42°−1 and c/d = 0.57°−1) as well as the fixing eye of the amblyopes (mean a/b = 0.46°−1 and c/d = 0.58°−1). The pPI decreased with eccentricity in the AME of the amblyopes (mean a/b = 0.20°−1 and c/d = 0.61°−1).
Figure 9.
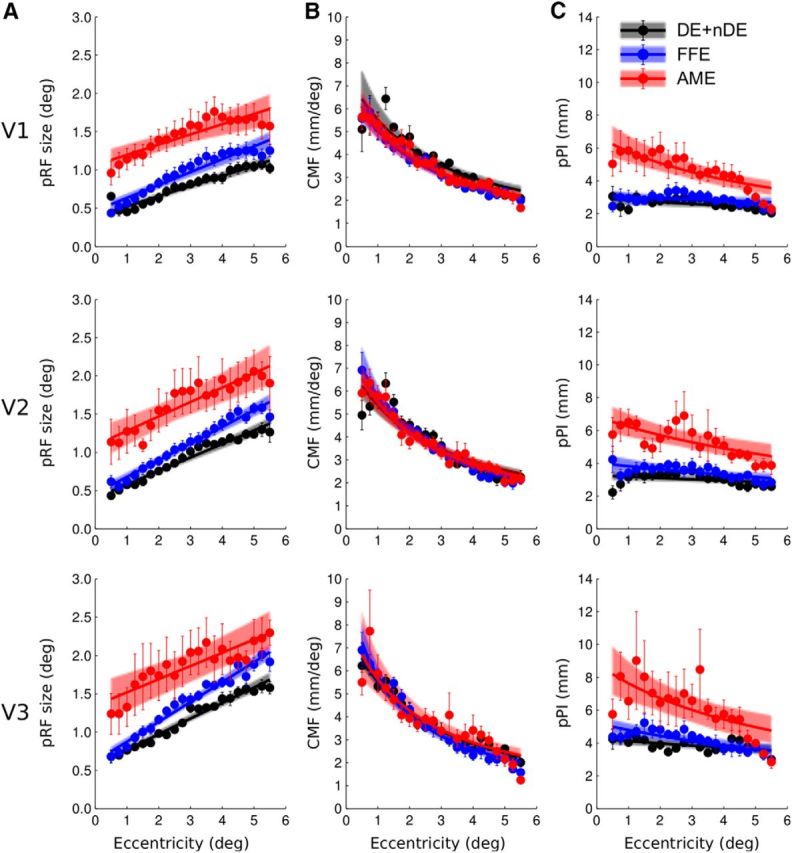
Summary of the group data. A, Change of pRF sizes. B, Change of CMF. C, Change of pPI with respect of visual field eccentricity. Grouped data from normal eye (DE and nDE were combined) are shown in black, FFE in blue, and AME data in red. The top row summarizes the data from V1, the middle row the data from V2, and the bottom row the data from V3. The dots and error bars are respectively the mean and SEs of the binned points between subjects. The solid lines represent the best fitting functions and the colored areas reflect the 95% confidence intervals of these fits (after bootstrapping and refitting).
The data were combined per group to estimate the best fitting function for the normal eye, the FFE of the amblyopic subjects, and the AME of the amblyopic subjects. The results from V1, V2, and V3 are shown in Figure 9 and the group fitted data are reported in Table 3 with the mean parameters a–d and their 95% confidence intervals.
Table 3.
Mean terms and 95% confidence intervals for the best fitting function parameters of the group dataa
| V1 |
V2 |
V3 |
|||||||
|---|---|---|---|---|---|---|---|---|---|
| Normal | FFE | AME | Normal | FFE | AME | Normal | FFE | AME | |
| pRF (Eq. 1) | |||||||||
| a (°/°) | 0.13 (0.11–0.15) | 0.17 (0.15–0.19) | 0.13 (0.09–0.18) | 0.18 (0.16–0.20) | 0.22 (0.20–0.24) | 0.19 (0.12–0.26) | 0.20 (0.19–0.22) | 0.26 (0.24–0.28) | 0.17 (0.10–0.25) |
| b (°) | 0.3 (0.34–0.45) | 0.46 (0.40–0.52) | 1.06 (0.93–1.21) | 0.40 (0.35–0.46) | 0.46 (0.40–0.53) | 1.09 (0.88–1.34) | 0.57 (0.51–0.62) | 0.61 (0.55–0.68) | 1.35 (1.06–1.63) |
| CMF (Eq. 2) | |||||||||
| c (mm−1) | 0.05 (0.04–0.06) | 0.06 (0.05–0.07) | 0.06 (0.05–0.07) | 0.05 (0.04–0.06) | 0.06 (0.06–0.07) | 0.06 (0.05–0.06) | 0.06 (0.05–0.06) | 0.07 (0.06–0.08) | 0.06 (0.04–0.07) |
| d (mm/°) | 0.13 (0.10–0.16) | 0.14 (0.12–0.16) | 0.14 (0.12–0.16) | 0.13 (0.11–0.15) | 0.11 (0.09–0.13) | 0.12 (0.11–0.14) | 0.12 (0.11–0.13) | 0.10 (0.08–0.12) | 0.12 (0.08–0.15) |
aThe values of a, b, c, and d are from the best fitting curves in the group data (averaged in bins of eccentricity). The bins were bootstrapped and fits repeated to give 95% confidence intervals, reported in brackets.
Increased pRF sizes in the AME in V2 and V3
If one considers only feedforward effects, one can assume that later visual areas should mainly derive their visual representation from those in early visual areas. To estimate how many of the differences found between the AME-derived and FFE-derived models in the amblyopes' V2 and V3 solely depends on that found in V1, we computed the corticocortical pRF (cc-pRF) in V2 and V3 where pRFs are expressed relative to the preceding cortical processing stages (for a complete explanation, see Harvey and Dumoulin, 2011). These cc-pRFs relative to V1 are shown in Figure 10. The data on the first row assumed that the pRF sizes in V2 and V3 arise solely from the combination of the pRF in V1 (direct relationship between pRF sizes in V2 or V3 and pRFs sizes in V1). The data multiplied by the CMF in V1 are shown on the second row. As previously shown, in normals, receptive field sizes in V2 and V3 can be explained by a constant sampling from V1 (Harvey and Dumoulin, 2011; Haak et al., 2013). This is also valid for the fixing eye data of the amblyopic subjects. But the data derived from the AME in V2 and V3 cannot be explained by the predicted constant sampling in V1.
Figure 10.
pRF differences between visual areas and measures of the cc-pRF sizes of V2 and V3 from V1. A, Normal eyes (black). B, FFEs (blue). C, AMEs (red). The top row shows that pRF size differences of V2 and V3 compared with those of V1 increase up the visual pathway and increase in slope up the hierarchy too for the eyes of the normal subjects and for the fixing eye of the amblyopes but not for the AME of the amblyopes. The bottom row shows the cc-pRFs. cc-pRF sizes of V2 and V3 do not vary with eccentricity for the eyes of normal subjects and for the fixing eye of the amblyopes but decreases in the AME. Lines were fit to bins, and the bins were bootstrapped and fits repeated to give 95% confidence intervals (colored areas).
Intra-areal cortical topography
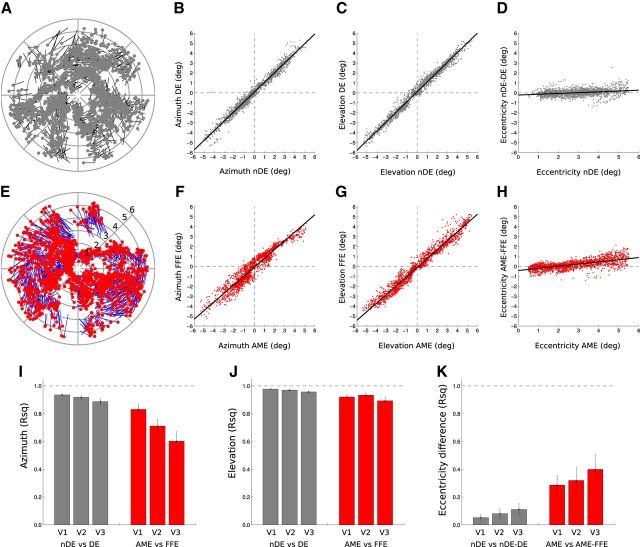
To estimate the topological fidelity of the maps within areas V1, V2, and V3 from the AME data, we compared the preferred pRF location in the visual field for each voxel per ROI. Figure 11 shows the topological correspondence between the model-derived receptive fields for the fixing and AME within area V1. The pRF positions between the eyes of normals were very similar. The correlations of positions in azimuth are represented by mean R2 = 0.94 (SE: 0.01) for V1, mean R2 = 0.92 (SE: 0.01) for V2, and mean R2 = 0.89 (SE: 0.02) for V3. The correlations of positions in elevation are represented by mean R2 = 0.98 (SE: 0.01) for V1, R2 = 0.97 (SE: 0.01) for V2, and mean R2 = 0.96 (SE: 0.02) for V3. The correlation remained stable between the areas in azimuth (comparison between V1 and V3, paired t test, T(7) = 1.88, p = 0.10), but decreased between areas in elevation (comparison between V1 and V3, paired t test, T(7) = 3.22, p < 0.05). Even if there was more variability in the amblyopes, the correspondence in pRF positions was still very high. The correlations of positions in azimuth are represented by mean R2 = 0.83 (SE: 0.03) for V1, mean R2 = 0.71 (SE: 0.05) for V2, and mean R2 = 0.60 (SE: 0.07) for V3. The correlations of positions in elevation are represented by mean R2 = 0.92 (SE: 0.02) for V1, mean R2 = 0.93 (SE: 0.02) for V2, and mean R2 = 0.89 (SE: 0.02) for V3. The correlations were always lower between the AMEs than between the normal eyes (unpaired t test for azimuth in V1: T(22) = 3.12, p < 0.01; in V2: T(22) = 4.21, p < 0.001; in V3: T(22) = 3.98, p < 0.01; unpaired t test for elevation; V1: T(22) = 3.07, p < 0.01; in V2: T(22) = 2.18, p < 0.05; in V3: T(22) = 2.41, p < 0.05).
Figure 11.
Comparison of the distribution of the pRFs between the data for two eyes in V1, V2, and V3 voxels. The first two rows show the distribution of pRFs in the visual field, estimated from voxels in V1 of one normal subject (black and gray) and one amblyopic subject (A8, in blue and red). A, For each voxel (with a >30% variance explained for both eyes) the position of its pRFs in a polar plot of the normal participant. The black line represents the shift between the position from DE to nDE. The light gray dots represent the position of the pRFs of the nDE. B, The correlation between the azimuth coordinates between the two eyes. C, Correlation between the elevation coordinates. D, Relationship between the eccentricity of the pRFs of the nDE and the difference in eccentricity between the two eyes. A–D show how similar the pRFs positions are between the two eyes in normals. E, For each voxel (with a >30% variance explained for both eyes) the position of its pRFs in a polar plot of one amblyopic participant. The blue line represents the shift between the position from FFE to AME. The red dots represent the positions from the AME. F, The correlation between the azimuth coordinates between the two eyes. G, The correlation between the elevation coordinates. H, Relationship between the eccentricity of the pRFs of the AME and the difference in eccentricity between the two eyes. E–H, The pRF positions were highly correlated in amblyopic subjects. The corresponding correlation values were reported in I–K (respectively, azimuth, elevation coordinates, and eccentricity) for V1, V2, and V3. There was more variability in the azimuth position between the two eyes in the amblyopes, and that the variability increases along the visual pathway from V1 to V3. K shows that the pRFs tend to be more eccentric in AMEs and that this tendency increases with eccentricity but not with visual hierarchy.
This increased receptive field positional variability was seen to increase as one goes along the visual pathway from V1 to V3 and it was mostly related to the azimuthal position (Figure 11I; azimuth: comparison between Pearson's r correlation for each subject in V1 and V2, T(15) = 4.02, p < 0.01; between V2 and V3, T(15) = 2.52, p < 0.05); elevation: comparison between V1 and V2, T(15) = −1.62, p = 0.17; between V2 and V3, T(15) = 3.56, p < 0.01). We did not observe a constant shift of the pRFs in the AME to the visual field periphery (the regression line in Fig. 11H does not have slope of 0), but we performed a correlation analysis to detect any slope change that would suggest an expansion (the distance in eccentricity between the AME-derived pRFs and the FFE-derived pRFs increased with the eccentric position of the AME-derived pRFs). Indeed, while there was no such tendency in normals (respectively for V1, V2, and V3: mean R2 = 0.05, 0.08, and 0.11), these correlation values were significantly higher in the amblyopes (respectively for V1, V2 and V3: mean R2 = 0.29, 0.32, and 0.40; unpaired t test between normals and amblyopes: in V1, T(22) = −3.18, p < 0.01; in V2, T(22) = −2.45, p < 0.05; in V3, T(22) = −2.52, p < 0.05), as shown in Figure 11K. The correlation values remained stable from V1 to V3 (comparison between V1 and V2, T(15) = −0.58, p = 0.57; between V1 and V3, T(15) = −1.43, p < 0.18). There was no correlation between pRF positional shifts and clinical features or behavioral measures (correlation in azimuthal position with visual acuity, r = 0.32, p = 0.45; with fixation instability, r = −0.29 p = 0.47; with squint angle, r = −0.06, p = 0.89). There was no correlation between the tendency of the pRFs from the AME to be more eccentric in the periphery either with fixation instability (r = 0.16, p = 0.70) or with squint angle (r = 0.01, p = 0.98). But there was a significant inverse correlation with visual acuity deficit (r = −0.80, p < 0.05).
Discussion
In this study, we addressed three questions that are key to understanding the nature of cortical dysfunction in human amblyopia: (1) Is cortical magnification reduced in the AME's representation? (2) Is there a loss of spatial resolution of cells? (3) Is the topological cortical map within the central field disordered for the projection from the AME?
The answer to the first question bears upon a current explanation for the reduced spatial positional sensitivity in amblyopia, namely reduced cortical magnification (Hussain et al., 2015). We find no support for this view. There is also a view that reduced resolution in amblyopia (Levi, 1991), reduced vernier acuity (Levi and Klein, 1985, 1986), and increased positional uncertainty (Levi and Klein, 1983; Levi et al., 1999) could result from the AME driving fewer cells, particularly in the foveal representation in the early cortical areas, resulting in an undersampled representation. Reduced sampling alone would not lead to any changes in pRF size and so cannot be the sole explanation.
The second question relates to receptive field size and we show that the pRF size is, in general, enlarged for the AME representation and that this is the case for areas V1, V2, and V3. However, this is not the case in every amblyope and the fact that there is not a strong correlation between the extent of this foveal receptive field enlargement and the behavioral acuity deficit is not unexpected at the level of the pRF. There are a number of factors that potentially could explain the enlarged pRFs for AME input reported here. First, it could be the result of unsteady eye movements in the AME eye (Levin et al., 2010). This is not the case because not only did we not find any relationship between the magnitude of the fixational eye movements during scanning and the pRF size across our subjects (Fig. 7), but also, as detailed in Materials and Methods, we corrupted the stimulus positions for the FFE with the eye movements measured for the AME at each TR to ensure all our FFE/AME comparisons were valid (Fig. 8). The second explanation is in terms of the positional scatter of receptive fields that contribute to the pRF average (Hubel and Wiesel, 1974; Dumoulin and Wandell, 2008). We show that there is increased scatter in the position of the pRFs themselves, but have no way of knowing whether this also extends to the position of the component receptive fields that comprise pRFs (Fig. 1, left, simulations). Finally, enlarged pRFs may simply mean that there is a reduced contribution from smaller receptive fields for the AME input. The present data cannot discriminate between a reduced contribution as a result of a reduction in contrast sensitivity, for example, and a complete absence of small receptive field sizes. It should also be noted that the spatial frequency of our stimulus was 1.75 cpd and may have underestimated the extent of the deficit even in these moderate-to-severe amblyopes. One finding worth mentioning is that for the AME, fewer voxels survived the thresholding criterion. This could have a number of possible explanations: fewer neurons contributing to the fMRI signal, more neurons with lower signal-to-noise ratio, or, as our evidence shows, disorganization of the map leading to a poorer fit of the pRF model to the data.
The third question relates to the topological fidelity of the intra-areal projections. It has long been known that amblyopes not only have reduced spatial resolution (Hess and Howell, 1977; Levi and Harwerth, 1977), but also experience spatial distortions (Pugh, 1958; Hess et al., 1978) and reduced positional accuracy (Hess et al., 1978; Bedell and Flom, 1981; Levi et al., 1987; Lagrèze and Sireteanu, 1991; Hess and Holliday, 1992; Mansouri et al., 2009; Hussain et al., 2015). A number of alternative explanations include spatial undersampling from fewer cells (Levi, 1991; Levi and Klein, 1996), reduced cortical magnification (Hussain et al., 2015), spatial disarray from a disordered representation of a normal complement of cells (Hess, 1982; Hess and Field, 1994), and anomalous orientation interactions (Barrett et al., 2004). The present results lend some support to the third explanation in that we show, in support of a previous result using a phase-encoded design (Li et al., 2007a), that there is more variability in the positions of pRFs in the AME. We also show that this positional anomaly is evident in areas outside V1 (i.e., V2 and V3).
Initially, animal studies (Eggers and Blakemore, 1978; Blakemore and Vital-Durand, 1986; Movshon et al., 1987; Crewther and Crewther, 1990) have sought to provide an explanation for amblyopia solely in terms of V1 processing as it is here where the competitive interaction between the eyes occurs (Blakemore and Eggers, 1978; Blakemore and Vital-Durand, 1992). There is now a consensus that extrastriate processing is also affected because of the wide range of visual functions affected (Levi, 1991; Levi et al., 1997; Simmers et al., 2003, 2005; Ho et al., 2006; Husk et al., 2012), the limited range of V1 neurophysiological deficits (Levi, 1991; Levi et al., 1997; Kiorpes et al., 1998; Kiorpes and McKee, 1999; Simmers et al., 2003, 2005; Ho et al., 2006; Husk et al., 2012), and the extent of the human fMRI cortical deficit (Barnes et al., 2001; Li et al., 2007b). It is of interest to know the extent to which the anomalies found in V1 are simply reflected in the processing of later areas or whether additional processing anomalies occur in extrastriate areas to which V1 projects. Our cc-pRF analysis addresses this. The results suggest that the V2 anomalies cannot be simply explained by the known V1 deficits and the V3 anomalies cannot be simply explained by the V2 deficits; additional processing deficits occur in V2 and V3. A similar conclusion has been suggested by a recent study of monkeys with anisometropic amblyopia: area V2 contributes an additional projection disarray to that present in V1 (Tao et al., 2014). This is at odds with the purely V1 contribution in the deprivation model suggested by Sincich et al. (2012).
In this study we have relied on a single Gaussian model of the pRF and therefore it is biased toward excitatory feedforward processing. We did attempt to model our data with a difference-of-Gaussian (DoG) model to derive an estimate of surround inhibitory effects (Zuiderbaan et al., 2012) that are thought to involve feedback processing (Schwabe et al., 2006, 2010). However, owing to our focus on foveal processing, our restricted field size (radius, 6°) may not have provided optimal conditions under which the DoG model could make a significantly contribution. This was the case for the data for normal eyes, FFEs, and AMEs. Future studies should use stimulus conditions that are more conducive to deriving estimates of surround inhibition so that feedback processing can be evaluated.
In summary, we compare the projections from the amblyopic and fellow normal eyes of amblyopes with those of normal observers. The projection from the AME has a normal CMF in all early visual areas, enlarged pRF sizes in striate and extrastriate cortex, and more topographic disorder in extrastriate areas. This is consistent with an explanation based on a normal complement of cells whose spatial resolution is reduced and whose topographical map is disordered.
Footnotes
This work was supported by two Canadian Institutes of Health Research grants (MOP-53346 and MOP-10818) to R.F.H. We thank Ben M. Harvey for helpful discussion and the amblyopic volunteers for their patience and support.
The authors declare no competing financial interests.
References
- Aaen-Stockdale C, Ledgeway T, Hess RF. Second-order optic flow deficits in amblyopia. Invest Ophthalmol Vis Sci. 2007;48:5532–5538. doi: 10.1167/iovs.07-0447. [DOI] [PubMed] [Google Scholar]
- Algaze A, Roberts C, Leguire L, Schmalbrock P, Rogers G. Functional magnetic resonance imaging as a tool for investigating amblyopia in the human visual cortex: a pilot study. J AAPOS. 2002;6:300–308. doi: 10.1067/mpa.2002.124902. [DOI] [PubMed] [Google Scholar]
- Barnes GR, Hess RF, Dumoulin SO, Achtman RL, Pike GB. The cortical deficit in humans with strabismic amblyopia. J Physiol. 2001;533:281–297. doi: 10.1111/j.1469-7793.2001.0281b.x. [DOI] [PMC free article] [PubMed] [Google Scholar]
- Barrett BT, Bradley A, McGraw PV. Understanding the neural basis of amblyopia. Neuroscientist. 2004;10:106–117. doi: 10.1177/1073858403262153. [DOI] [PubMed] [Google Scholar]
- Bedell HD, Flom MC. Monocular spatial distortion in strabismic amblyopia. Invest Ophthalmol Vis Sci. 1981;20:263–268. [PubMed] [Google Scholar]
- Blakemore C, Eggers HM. Animal models for human visual development. In: Cool SJ, Smith EL 3rd, editors. Frontiers in visual science. New York: Springer; 1978. pp. 651–659. [Google Scholar]
- Blakemore C, Vital-Durand F. Effects of visual deprivation on the development of the monkey's lateral geniculate nucleus. J Physiol. 1986;380:493–511. doi: 10.1113/jphysiol.1986.sp016298. [DOI] [PMC free article] [PubMed] [Google Scholar]
- Blakemore C, Vital-Durand F. Different neural origins for ‘blur’ amblyopia and Strabismic amblyopia. Opthalmic Physiol Opt. 1992;12:83. [Google Scholar]
- Brainard DH. The psychophysics toolbox. Spat Vis. 1997;10:433–436. doi: 10.1163/156856897X00357. [DOI] [PubMed] [Google Scholar]
- Choi MY, Lee KM, Hwang JM, Choi DG, Lee DS, Park KH, Yu YS. Comparison between anisometropic and strabismic amblyopia using functional magnetic resonance imaging. Br J Ophthalmol. 2001;85:1052–1056. doi: 10.1136/bjo.85.9.1052. [DOI] [PMC free article] [PubMed] [Google Scholar]
- Conner IP, Mendola JD. What does an amblyopic eye tell human visual cortex? J Vis. 2005;5:295. doi: 10.1167/5.8.295. [DOI] [Google Scholar]
- Conner IP, Odom JV, Schwartz TL, Mendola JD. Monocular activation of V1 and V2 in amblyopic adults measured with functional magnetic resonance imaging. J AAPOS. 2007;11:341–350. doi: 10.1016/j.jaapos.2007.01.119. [DOI] [PMC free article] [PubMed] [Google Scholar]
- Crewther DP, Crewther SG. Neural site of strabismic amblyopia in cats: spatial frequency deficit in primary cortical neurons. Exp Brain Res. 1990;79:615–622. doi: 10.1007/BF00229329. [DOI] [PubMed] [Google Scholar]
- Dale AM, Fischl B, Sereno MI. Cortical surface-based analysis. I. Segmentation and surface reconstruction. Neuroimage. 1999;9:179–194. doi: 10.1006/nimg.1998.0395. [DOI] [PubMed] [Google Scholar]
- Demanins R, Wang YZ, Hess RF. The neural deficit in strabismic amblyopia: sampling considerations. Vision Res. 1999;39:3575–3585. doi: 10.1016/S0042-6989(99)00070-X. [DOI] [PubMed] [Google Scholar]
- Demer JL, von Noorden GK, Volkow ND, Gould KL. Imaging of cerebral blood flow and metabolism in amblyopia by positron emission tomography. Am J Ophthalmol. 1988;105:337–347. doi: 10.1016/0002-9394(88)90294-2. [DOI] [PubMed] [Google Scholar]
- Dumoulin SO, Wandell BA. Population receptive field estimates in human visual cortex. Neuroimage. 2008;39:647–660. doi: 10.1016/j.neuroimage.2007.09.034. [DOI] [PMC free article] [PubMed] [Google Scholar]
- Duncan RO, Boynton GM. Cortical magnification within human primary visual cortex correlates with acuity thresholds. Neuron. 2003;38:659–671. doi: 10.1016/S0896-6273(03)00265-4. [DOI] [PubMed] [Google Scholar]
- Eggers HM, Blakemore C. Physiological basis of anisometropic amblyopia. Science. 1978;201:264–267. doi: 10.1126/science.663654. [DOI] [PubMed] [Google Scholar]
- Engel SA, Rumelhart DE, Wandell BA, Lee AT, Glover GH, Chichilnisky EJ, Shadlen MN. fMRI of human visual cortex. Nature. 1994;369:525. doi: 10.1038/369525a0. [DOI] [PubMed] [Google Scholar]
- Fischl B, Dale AM. Measuring the thickness of the human cerebral cortex from magnetic resonance images. Proc Natl Acad Sci U S A. 2000;97:11050–11055. doi: 10.1073/pnas.200033797. [DOI] [PMC free article] [PubMed] [Google Scholar]
- Friston KJ, Fletcher P, Josephs O, Holmes A, Rugg MD, Turner R. Event-related fMRI: characterizing differential responses. Neuroimage. 1998;7:30–40. doi: 10.1006/nimg.1997.0306. [DOI] [PubMed] [Google Scholar]
- Glover GH. Deconvolution of impulse response in event-related BOLD fMRI. Neuroimage. 1999;9:416–429. doi: 10.1006/nimg.1998.0419. [DOI] [PubMed] [Google Scholar]
- Goodyear BG, Nicolle DA, Humphrey GK, Menon RS. BOLD fMRI response of early visual areas to perceived contrast in human amblyopia. J Neurophysiol. 2000;84:1907–1913. doi: 10.1152/jn.2000.84.4.1907. [DOI] [PubMed] [Google Scholar]
- Haak KV, Winawer J, Harvey BM, Renken R, Dumoulin SO, Wandell BA, Cornelissen FW. Connective field modeling. Neuroimage. 2013;66:376–384. doi: 10.1016/j.neuroimage.2012.10.037. [DOI] [PMC free article] [PubMed] [Google Scholar]
- Harvey BM, Dumoulin SO. The relationship between cortical magnification factor and population receptive field size in human visual cortex: constancies in cortical architecture. J Neurosci. 2011;31:13604–13612. doi: 10.1523/JNEUROSCI.2572-11.2011. [DOI] [PMC free article] [PubMed] [Google Scholar]
- Hess RF. Developmental sensory impairment: amblyopia or tarachopia? Hum Neurobiol. 1982;1:17–29. [PubMed] [Google Scholar]
- Hess RF, Field DJ. Is the spatial deficit in strabismic amblyopia due to loss of cells or an uncalibrated disarray of cells? Vision Res. 1994;34:3397–3406. doi: 10.1016/0042-6989(94)90073-6. [DOI] [PubMed] [Google Scholar]
- Hess RF, Holliday IE. The spatial localization deficit in amblyopia. Vision Res. 1992;32:1319–1339. doi: 10.1016/0042-6989(92)90225-8. [DOI] [PubMed] [Google Scholar]
- Hess RF, Howell ER. The threshold contrast sensitivity function in strabismic amblyopia: evidence for a two type classification. Vision Res. 1977;17:1049–1055. doi: 10.1016/0042-6989(77)90009-8. [DOI] [PubMed] [Google Scholar]
- Hess RF, Pointer JS. Differences in the neural basis of human amblyopia: the distribution of the anomaly across the visual field. Vision Res. 1985;25:1577–1594. doi: 10.1016/0042-6989(85)90128-2. [DOI] [PubMed] [Google Scholar]
- Hess RF, Campbell FW, Greenhalgh T. On the nature of the neural abnormality in human amblyopia; neural aberrations and neural sensitivity loss. Pflugers Arch. 1978;377:201–207. doi: 10.1007/BF00584273. [DOI] [PubMed] [Google Scholar]
- Ho CS, Paul PS, Asirvatham A, Cavanagh P, Cline R, Giaschi DE. Abnormal spatial selection and tracking in children with amblyopia. Vision Res. 2006;46:3274–3283. doi: 10.1016/j.visres.2006.03.029. [DOI] [PubMed] [Google Scholar]
- Hubel DH, Wiesel TN. Binocular interaction in striate cortex of kittens reared with artificial squint. J Neurophysiol. 1965;28:1041–1059. doi: 10.1152/jn.1965.28.6.1041. [DOI] [PubMed] [Google Scholar]
- Hubel DH, Wiesel TN. Uniformity of monkey striate cortex: a parallel relationship between field size, scatter, and magnification factor. J Comp Neurol. 1974;158:295–305. doi: 10.1002/cne.901580305. [DOI] [PubMed] [Google Scholar]
- Husk JS, Farivar R, Hess RF. Amblyopic deficits in processing structure-from-motion. J Vis. 2012;12(4):4. doi: 10.1167/12.4.4. pii. [DOI] [PubMed] [Google Scholar]
- Hussain Z, Svensson C, Besle J, Webb B, Barrett B, McGraw P. Estimation of cortical magnification from positional error in normally sighted and amblyopic subjects. J Vis. 2015;15(2):25. doi: 10.1167/15.2.25. pii. [DOI] [PMC free article] [PubMed] [Google Scholar]
- Imamura K, Richter H, Fischer H, Lennerstrand G, Franzén O, Rydberg A, Andersson J, Schneider H, Onoe H, Watanabe Y, Långström B. Reduced activity in the extrastriate visual cortex of individuals with strabismic amblyopia. Neurosci Lett. 1997;225:173–176. doi: 10.1016/S0304-3940(97)00211-5. [DOI] [PubMed] [Google Scholar]
- Kabasakal L, Devranoğlu K, Arslan O, Erdil TY, Sönmezoğlu K, Uslu I, Tolun H, Isitman AT, Ozker K, Onsel C. Brain SPECT evaluation of the visual cortex in amblyopia. J Nucl Med. 1995;36:1170–1174. [PubMed] [Google Scholar]
- Kiorpes L, McKee SP. Neural mechanisms underlying amblyopia. Curr Opin Neurobiol. 1999;9:480–486. doi: 10.1016/S0959-4388(99)80072-5. [DOI] [PubMed] [Google Scholar]
- Kiorpes L, Kiper DC, O'Keefe LP, Cavanaugh JR, Movshon JA. Neuronal correlates of amblyopia in the visual cortex of macaque monkeys with experimental strabismus and anisometropia. J Neurosci. 1998;18:6411–6424. doi: 10.1523/JNEUROSCI.18-16-06411.1998. [DOI] [PMC free article] [PubMed] [Google Scholar]
- Lagrèze WD, Sireteanu R. Two-dimensional spatial distortions in human strabismic amblyopia. Vision Res. 1991;31:1271–1288. doi: 10.1016/0042-6989(91)90051-6. [DOI] [PubMed] [Google Scholar]
- Levi DM. Spatial vision in amblyopia. In: Regan D, editor. Vision and visual dysfunction. Houndmills, UK: Macmillan; 1991. pp. 212–238. [Google Scholar]
- Levi DM, Harwerth RS. Spatio-temporal interactions in anisometropic and strabismic amblyopia. Invest Ophthalmol Vis Sci. 1977;16:90–95. [PubMed] [Google Scholar]
- Levi DM, Klein SA. Spatial localization in normal and amblyopic vision. Vision Res. 1983;23:1005–1017. doi: 10.1016/0042-6989(83)90011-1. [DOI] [PubMed] [Google Scholar]
- Levi DM, Klein SA. Vernier acuity, crowding and amblyopia. Vision Res. 1985;25:979–991. doi: 10.1016/0042-6989(85)90208-1. [DOI] [PubMed] [Google Scholar]
- Levi DM, Klein SA. Sampling in spatial vision. Nature. 1986;320:360–362. doi: 10.1038/320360a0. [DOI] [PubMed] [Google Scholar]
- Levi DM, Klein SA. Limitations on position coding imposed by undersampling and univariance. Vision Res. 1996;36:2111–2120. doi: 10.1016/0042-6989(95)00264-2. [DOI] [PubMed] [Google Scholar]
- Levi DM, Klein SA, Aitsebaomo AP. Vernier acuity, crowding and cortical magnification. Vision Res. 1985;25:963–977. doi: 10.1016/0042-6989(85)90207-X. [DOI] [PubMed] [Google Scholar]
- Levi DM, Klein SA, Yap YL. Positional uncertainty in peripheral and amblyopic vision. Vision Res. 1987;27:581–597. doi: 10.1016/0042-6989(87)90044-7. [DOI] [PubMed] [Google Scholar]
- Levi DM, Sharma V, Klein SA. Feature integration in pattern perception. Proc Natl Acad Sci U S A. 1997;94:11742–11746. doi: 10.1073/pnas.94.21.11742. [DOI] [PMC free article] [PubMed] [Google Scholar]
- Levi DM, Klein SA, Sharma V. Position jitter and undersampling in pattern perception. Vision Res. 1999;39:445–465. doi: 10.1016/S0042-6989(98)00125-4. [DOI] [PubMed] [Google Scholar]
- Levin N, Dumoulin SO, Winawer J, Dougherty RF, Wandell BA. Cortical maps and white matter tracts following long period of visual deprivation and retinal image restoration. Neuron. 2010;65:21–31. doi: 10.1016/j.neuron.2009.12.006. [DOI] [PMC free article] [PubMed] [Google Scholar]
- Li X, Dumoulin SO, Mansouri B, Hess RF. The fidelity of the cortical retinotopic map in human amblyopia. Eur J Neurosci. 2007a;25:1265–1277. doi: 10.1111/j.1460-9568.2007.05356.x. [DOI] [PubMed] [Google Scholar]
- Li X, Dumoulin SO, Mansouri B, Hess RF. Cortical deficits in human amblyopia: their regional distribution and their relationship to the contrast detection deficit. Invest Ophthalmol Vis Sci. 2007b;48:1575–1591. doi: 10.1167/iovs.06-1021. [DOI] [PubMed] [Google Scholar]
- Mansouri B, Hansen BC, Hess RF. Disrupted retinotopic maps in amblyopia. Invest Ophthalmol Vis Sci. 2009;50:3218–3225. doi: 10.1167/iovs.08-2914. [DOI] [PubMed] [Google Scholar]
- Movshon JA, Eggers HM, Gizzi MS, Hendrickson AE, Kiorpes L, Boothe RG. Effects of early unilateral blur on the macaque's visual system. III. Physiological observations. J Neurosci. 1987;7:1340–1351. doi: 10.1523/JNEUROSCI.07-05-01340.1987. [DOI] [PMC free article] [PubMed] [Google Scholar]
- Pelli DG. The VideoToolbox software for visual psychophysics: transforming numbers into movies. Spat Vis. 1997;10:437–442. doi: 10.1163/156856897X00366. [DOI] [PubMed] [Google Scholar]
- Pugh M. Visual distortion in amblyopia. Br J Ophthalmol. 1958;42:449–460. doi: 10.1136/bjo.42.8.449. [DOI] [PMC free article] [PubMed] [Google Scholar]
- Reuter M, Rosas HD, Fischl B. Highly accurate inverse consistent registration: a robust approach. Neuroimage. 2010;53:1181–1196. doi: 10.1016/j.neuroimage.2010.07.020. [DOI] [PMC free article] [PubMed] [Google Scholar]
- Roelfsema PR, König P, Engel AK, Sireteanu R, Singer W. Reduced synchronization in the visual cortex of cats with strabismic amblyopia. Eur J Neurosci. 1994;6:1645–1655. doi: 10.1111/j.1460-9568.1994.tb00556.x. [DOI] [PubMed] [Google Scholar]
- Schwabe L, Obermayer K, Angelucci A, Bressloff PC. The role of feedback in shaping the extra-classical receptive field of cortical neurons: a recurrent network model. J Neurosci. 2006;26:9117–9129. doi: 10.1523/JNEUROSCI.1253-06.2006. [DOI] [PMC free article] [PubMed] [Google Scholar]
- Schwabe L, Ichida JM, Shushruth S, Mangapathy P, Angelucci A. Contrast-dependence of surround suppression in macaque V1: experimental testing of a recurrent network model. Neuroimage. 2010;52:777–792. doi: 10.1016/j.neuroimage.2010.01.032. [DOI] [PMC free article] [PubMed] [Google Scholar]
- Sengpiel F, Blakemore C. The neural basis of suppression and amblyopia in strabismus. Eye (Lond) 1996;10:250–258. doi: 10.1038/eye.1996.54. [DOI] [PubMed] [Google Scholar]
- Sereno MI, Dale AM, Reppas JB, Kwong KK, Belliveau JW, Brady TJ, Rosen BR, Tootell RB. Borders of multiple visual areas in humans revealed by functional magnetic resonance imaging. Science. 1995;268:889–893. doi: 10.1126/science.7754376. [DOI] [PubMed] [Google Scholar]
- Sharma V, Levi DM, Coletta NJ. Sparse-sampling of gratings in the visual cortex of strabismic amblyopes. Vision Res. 1999;39:3526–3536. doi: 10.1016/S0042-6989(99)00028-0. [DOI] [PubMed] [Google Scholar]
- Shooner C, Hallum LE, Kumbhani RD, Ziemba CM, Garcia-Marin V, Kelly JG, Majaj NJ, Movshon JA, Kiorpes L. Population representation of visual information in areas V1 and V2 of amblyopic macaques. Vision Res. 2015;114:56–67. doi: 10.1016/j.visres.2015.01.012. [DOI] [PMC free article] [PubMed] [Google Scholar]
- Simmers AJ, Ledgeway T, Hess RF, McGraw PV. Deficits to global motion processing in human amblyopia. Vision Res. 2003;43:729–738. doi: 10.1016/S0042-6989(02)00684-3. [DOI] [PubMed] [Google Scholar]
- Simmers AJ, Ledgeway T, Hess RF. The influences of visibility and anomalous integration processes on the perception of global spatial form versus motion in human amblyopia. Vision Res. 2005;45:449–460. doi: 10.1016/j.visres.2004.08.026. [DOI] [PubMed] [Google Scholar]
- Sincich LC, Jocson CM, Horton JC. Neuronal projections from V1 to V2 in amblyopia. J Neurosci. 2012;32:2648–2656. doi: 10.1523/JNEUROSCI.4799-11.2012. [DOI] [PMC free article] [PubMed] [Google Scholar]
- Sireteanu R, Tonhausen N, Mickli L, Zanella FE, Singer W. Cortical site of amblyopic deficit in strabismic and anisometropic subjects. Invest Ophthalmol Vis Sci. 1998;39:s909. [Google Scholar]
- Sled JG, Zijdenbos AP, Evans AC. A nonparametric method for automatic correction of intensity nonuniformity in MRI data. IEEE Trans Med Imaging. 1998;17:87–97. doi: 10.1109/42.668698. [DOI] [PubMed] [Google Scholar]
- Smith EL, 3rd, Chino YM, Ni J, Cheng H, Crawford ML, Harwerth RS. Residual binocular interactions in the striate cortex of monkeys reared with abnormal binocular vision. J Neurophysiol. 1997;78:1353–1362. doi: 10.1152/jn.1997.78.3.1353. [DOI] [PubMed] [Google Scholar]
- Tao X, Zhang B, Shen G, Wensveen J, Smith EL, 3rd, Nishimoto S, Ohzawa I, Chino YM. Early monocular defocus disrupts the normal development of receptive-field structure in V2 neurons of macaque monkeys. J Neurosci. 2014;34:13840–13854. doi: 10.1523/JNEUROSCI.1992-14.2014. [DOI] [PMC free article] [PubMed] [Google Scholar]
- Wandell BA, Chial S, Backus BT. Visualization and measurement of the cortical surface. J Cogn Neurosci. 2000;12:739–752. doi: 10.1162/089892900562561. [DOI] [PubMed] [Google Scholar]
- Wandell BA, Dumoulin SO, Brewer AA. Visual field maps in human cortex. Neuron. 2007;56:366–383. doi: 10.1016/j.neuron.2007.10.012. [DOI] [PubMed] [Google Scholar]
- Winawer J, Horiguchi H, Sayres RA, Amano K, Wandell BA. Mapping hV4 and ventral occipital cortex: the venous eclipse. J Vis. 2010;10(5):1. doi: 10.1167/10.5.1. [DOI] [PMC free article] [PubMed] [Google Scholar]
- Worsley KJ, Liao CH, Aston J, Petre V, Duncan GH, Morales F, Evans AC. A general statistical analysis for fMRI data. Neuroimage. 2002;15:1–15. doi: 10.1006/nimg.2001.0933. [DOI] [PubMed] [Google Scholar]
- Zuiderbaan W, Harvey BM, Dumoulin SO. Modeling center-surround configurations in population receptive fields using fMRI. J Vis. 2012;12(3):10. doi: 10.1167/12.3.10. [DOI] [PubMed] [Google Scholar]


