

Abstract
At the sensory-motor neuron synapse of Aplysia, either spaced or continuous (massed) exposure to serotonin (5-HT) induces a form of intermediate-term facilitation (ITF) that requires new protein synthesis but not gene transcription. However, spaced and massed ITF use distinct molecular mechanisms to maintain increased synaptic strength. Synapses activated by spaced applications of 5-HT generate an ITF that depends on persistent protein kinase A (PKA) activity, whereas an ITF produced by massed 5-HT depends on persistent protein kinase C (PKC) activity. In this study, we demonstrate that eukaryotic elongation factor 2 (eEF2), which catalyzes the GTP-dependent translocation of the ribosome during protein synthesis, acts as a biochemical sensor that is tuned to the pattern of neuronal stimulation. Specifically, we find that massed training leads to a PKC-dependent increase in phosphorylation of eEF2, whereas spaced training results in a PKA-dependent decrease in phosphorylation of eEF2. Importantly, by using either pharmacological or dominant-negative strategies to inhibit eEF2 kinase (eEF2K), we were able to block massed 5-HT-dependent increases in eEF2 phosphorylation and subsequent PKC-dependent ITF. In contrast, pharmacological inhibition of eEF2K during the longer period of time required for spaced training was sufficient to reduce eEF2 phosphorylation and induce ITF. Finally, we find that the massed 5-HT-dependent increase in synaptic strength requires translation elongation, but not translation initiation, whereas the spaced 5-HT-dependent increase in synaptic strength is partially dependent on translation initiation. Thus, bidirectional regulation of eEF2 is critical for decoding distinct activity patterns at synapses by activating distinct modes of translation regulation.
Keywords: elongation factor 2, facilitation, intermediate memory, protein kinase C, synaptic plasticity, translational control
Introduction
In the marine mollusk Aplysia californica, serotonin (5-HT) acts at the sensory-to-motor neuron synapse to induce synaptic facilitation, an increase in synaptic strength that underlies sensitization of withdrawal reflexes (Kandel, 2001). The ability to recapitulate the synaptic facilitation seen in vivo in isolated neurons is a unique advantage of this model and studies examining facilitation have identified conserved mechanisms underlying memory formation (Kandel, 2001). 5-HT acts via distinct G-protein coupled receptors to activate protein kinase A (PKA) and protein kinase C (PKC; Dumitriu et al., 2006; Lee et al., 2009; Nagakura et al., 2010) and these kinases can mediate distinct forms of synaptic plasticity and behavior (Byrne and Kandel, 1996; Hawkins et al., 2006; Sossin, 2007). In particular, five spaced applications of 5-HT generate a protein synthesis-dependent, intermediate-term facilitation (ITF) at the sensory-motor neuron synapse that requires PKA (Müller and Carew, 1998; Sutton and Carew, 2000), whereas one massed 5-HT application generates a protein synthesis-dependent ITF that requires PKC (Sossin et al., 1994; Jin et al., 2011). Furthermore, spaced 5-HT applications lead to greater desensitization of PKC activation than massed 5-HT application, which is driven by differential production of proteins induced by the different stimuli (Farah et al., 2009; Naqib et al., 2011). Thus, massed and spaced applications of 5-HT activate distinct mechanisms of translational control.
Translational control is an important step leading to the encoding of long-lasting forms of memory (Costa-Mattioli et al., 2009). Although much research has focused on translation initiation (Sonenberg and Hinnebusch, 2009), regulating elongation, and in particular the phosphorylation of eukaryotic elongation factor 2 (eEF2), is also important for synaptic plasticity (Taha et al., 2013; Heise et al., 2014). Interestingly, eEF2 phosphorylation can either be increased (Scheetz et al., 1997; Belelovsky et al., 2005; Kanhema et al., 2006; Sutton et al., 2007; Park et al., 2008; Panja et al., 2009; Verpelli et al., 2010; Weatherill et al., 2011) or decreased (Carroll et al., 2004; Inamura et al., 2005; Sutton et al., 2007; Im et al., 2009; Autry et al., 2011) depending on the stimulus used in learning or synaptic plasticity paradigms. Examining the specific contributions of increases and decreases in eEF2 phosphorylation to learning and memory is difficult. For example, in eEF2 kinase (eEF2K) knock-out animals (Park et al., 2008), whereas increases in eEF2 phosphorylation are abolished, decreases in eEF2 phosphorylation are occluded, confounding interpretation of the results. In the present study, we show that phosphorylation of eEF2 is increased in Aplysia sensory neurons by massed application of 5-HT but decreased by spaced applications. Critically, we were able to inhibit increases in phosphorylation of eEF2 without affecting its basal state of phosphorylation and this was sufficient to block expression of PKC-dependent ITF. In contrast, inhibition of eEF2K during the longer period of time required for spaced 5-HT was sufficient to reduce eEF2 phosphorylation and induce ITF. Our results suggest that eEF2 acts as a biochemical sensor that is able to decode two distinct neuronal activity patterns, resulting in differential protein synthesis and synaptic plasticity.
Materials and Methods
Cell culture.
Aplysia californica were obtained from the University of Miami National Institutes of Health Aplysia resource facility (Miami, FL) and maintained in an aquarium containing reconstituted seawater (Crystal Sea, MEI) at 15°C. Animals were anesthetized with isotonic MgCl2, and the pleural-pedal and abdominal ganglia were removed and digested with 1.4% Dispase II (Roche Applied Science) in isotonic Leibovitz-15 medium (Sigma-Aldrich). The pleural and abdominal ganglia were desheathed, and tail sensory neurons (SNs) removed from the pleural and L7 motor neurons (MNs) removed from the abdominal ganglia. The dissociated neurons were plated in Leibovitz-15 with 50% hemolymph and 2 mm l-glutamine on single-well glass bottom well dishes (MatTek), precoated with poly-l-lysine (molecular weight >300,000; Sigma). Eighty to 100 g Aplysia were used for isolation of sensory neurons, and juvenile animals of 1–5 g were used for isolation of the motor neuron L7. Sharp glass electrodes for microdissection were prepared with a Sutter P-97 using thick-walled glass (1.5 mm outer diameter, 0.86–1.12 mm inner diameter, and 100 mm in length).
After plating of the MNs, cells were allowed to adhere to the culture dish for 1 h. Next, the SN was added, and using a sharp glass electrode, the neurite was straightened using currents generated by slightly waving the electrode and the SN cell was maneuvered into a position next to the MN. The neurite of the SN was moved into position so that the distal end overlapped and came into contact with the MN. After plating and pairing of neurons, the culture dishes were left on the stereoscope stage overnight at 22–25°C, and then transferred to a humidity controlled incubator at 18°C. DNA plasmids encoding eEF2 kinase or vesicle associated membrane protein (VAMP), were microinjected into the nucleus of the SN or the MN soma 36 h after plating. Expression was monitored by confocal microscopy 24–48 h later.
eEF2 kinase constructs.
We previously generated an expression construct for Aplysia eEF2K, but this original construct was missing the first 81 aa (Weatherill et al., 2011). Therefore, we generated a new full-length Aplysia eEF2K construct and added an mRFP N-terminal tag as follows: First, the missing 81 aa N-terminal fragment was PCR-amplified from an Aplysia cDNA library using the following primers: GAGCAGTCAAGATGGAACTC and GCAGATTTAGCAGATGCTGTGT, and cloned into pJET (Thermo Scientific). The N-terminal fragment was then amplified with the same primers flanked by KpnI and XhoI sites, and ligated into a pNEX3-mRFP construct (Weatherill et al., 2011). The mRFP-eEF2K N-terminal fragment was excised with SalI and NheI and inserted into the original, truncated pNEX-eEF2K at SalI and NheI to create pNEX-mRFP-eEF2K. The D309A and S481A, S482A mutations were made using overlap PCR and pNEX-mRFP-eEF2K as a template as previously described (Nakhost et al., 1999). All constructs were confirmed by sequencing.
Measurement of protein synthesis.
The overall cellular translation rate was measured by the incorporation of the methionine analog, l-azidohomoalanine (AHA; Invitrogen). This method was adapted for use in Aplysia as previously described (Dyer and Sossin, 2013).
Sf9 cell culture and immunoblotting.
Sf9 cells were purchased from Sigma-Aldrich and grown in Grace's medium (Invitrogen) supplemented with 10% fetal bovine serum (Cansera) as a monolayer at 27°C. For infection, cells were plated at a density of 0.5 × 10⁶ cells/60 mm dish. Baculoviral constructs for eEF2K were previously described (Weatherill et al., 2011). Forty-eight hours postinfection, the cells were treated with NH125 (3 μm), Bis-1 (1 μm), or vehicle for 2 h. Cells were then collected and washed once with PBS and then suspended in the lysis buffer (PBS, 1% SDS, 0.1% IGEPAL) to which complete EDTA-free mixture of protease inhibitors (Roche) was added before use. Cells were incubated in the lysis buffer for 30 min at 4°C on a rocking platform and the resulting lysate centrifuged at 12,000 × g for 20 min at 4°C. The supernatant was then collected and protein dosage was performed using the Bradford method. Immunoblotting was performed as previously described (Weatherill et al., 2011). The antibodies used were phospho-eEF2 antibody (1:500) and a phospho-eEF2K antibody (1:500; Weatherill et al., 2011).
Immunocytochemistry.
In all isolated SN experiments, cultures were treated with 10 μm 5-HT (Sigma-Aldrich) in artificial seawater (ASW) or mock-treated with ASW alone. In all experiments, cultures were rinsed briefly with ASW and fixed with 4% paraformaldehyde with 30% sucrose in PBS for at least 45 min and then immunostained. The fixed cells were washed briefly with 30% sucrose in PBS, permeabilized with 0.1% Triton X-100 with 30% sucrose in PBS for 10 min, and then washed again briefly with PBS alone. Free aldehydes were then quenched with 50 mm ammonium chloride for 15 min and cells were washed again briefly with PBS. Nonspecific antibody binding was blocked by incubating the cells with 10% normal goat serum (Sigma-Aldrich) plus 0.5% Triton X-100 in PBS for 1 h before incubating with phospho-eEF2 (T56) antibody (1:300, Cell Signaling Technology) in the blocking solution overnight at 4°C. After washing the primary antibody with PBS (3 × 10 min washes), the cells were incubated for 2 h with a secondary, Alexa Fluor 647-conjugated goat, anti-rabbit antibody (1:200, Invitrogen) at 22–25°C. The cells were washed again with PBS and were imaged using a LSM 710 (Zeiss) laser confocal scanning microscope equipped with an Axiovert 100 inverted microscope (Zeiss) and a 63×, NA 1.4 objective. Alexa Fluor 647 fluorescence was passed through a HFT UV/488/543/633 main beam splitter and a NFT 635 VIS secondary beam splitter and detected with the META detector set for a range covering 644–719 nm. In experiments where eEF2K-mRFP or mRFP alone was expressed, Alexa Fluor 647 fluorescence and mRFP fluorescence were imaged sequentially and were passed through the HFT UV/488/543/633 beam splitter. In addition, mRFP fluorescence was reflected by the NFT 635 VIS secondary beam splitter and passed through another NFT 545 secondary beam splitter, as well as a BP 565-615 IR emission filter. In all experiments examining somatic staining, the confocal plane in the middle of the nucleus was chosen to standardize the plane within and between experiments.
Electrophysiology.
After 36 h in culture, either the SN or the MN of cocultured pairs was microinjected with a construct encoding either eEF2K(WT)-mRFP, eEF2K(S481A-S482A)-mRFP or mRFP alone in conjunction with equimolar amounts of empty pNEX-3 vector along with 0.1% Fast Green dye. Synaptic connectivity was recorded by measuring the EPSP amplitude between the cocultured neurons using sharp electrode electrophysiology as previously described (Weatherill et al., 2010). On day 4 in vitro, recordings were performed with intracellular microelectrodes using an Axoclamp 2B amplifier (Molecular Devices) in bridge mode and microelectrodes (15–30 MΩ) filled with 2 m potassium acetate. The MNs were maintained at −80 mV, and the SNs were stimulated with an extracellular concentric electrode (FHC). During massed 5-HT experiments, chronic recordings of 65 min were performed and input resistances were measured every 10 min. Following 10 min 5-HT, a fast perfusion of saline was activated for the duration of recording. For spaced 5-HT experiments, a single EPSP was evoked in the MN through extracellular stimulating current into the SN. Subsequently, the cultures were treated either with five pulses of 5 min 5-HT (10 μm) with a 20 min interpulse interval. In between pulses, 5-HT was washed away using a 1:1 mixture (v/v) of Leibovitz-15 and ASW. Input resistances and EPSPs were recorded again immediately following 5-HT and 24 h later. Data were discarded if any of the following parameters changed by more then two SDs from the means of the accumulated dataset: the input resistance of the MN (>100 MΩ), the increase in the input resistance of the MN (>60%), and the slope of the initial EPSP (<1.5 mV/ms).
Data analysis.
To quantify images, imaging software package ImageJ (http://rsbweb.nih.gov/ij/download.html) was used. The mean pixel intensity within the cytoplasm was quantified and background subtracted to account for fluorescence from the media. The mean fluorescence in control cells was calculated, and the values of all individual cells from all groups, were normalized to the control mean within a single experiment.
All PSP amplitudes are normalized to the first PSP observed at the synapse (baseline PSP). At synapses with PSPs large enough to activate voltage-dependent currents in the motor neuron, PSP rise rate was measured over 1 ms and normalized to the baseline PSP.
eGFP-PKC Apl II cytosol to membrane translocation was quantified as previously described (Zhao et al., 2006; Farah et al., 2008, 2009; Nagakura et al., 2010; Farah and Sossin, 2011a,b). Briefly, the level of PKC Apl II translocation was determined by tracing three rectangles at different locations at the plasma membrane and three rectangles at different locations in the cytosol. The width of the membrane rectangles was three-five pixels wide to minimize cytoplasmic contamination, but otherwise the size of the rectangles was not constrained. The first two rectangles were traced at opposite sides of the plasma membrane of the cell and the third at an angle of ∼45° to the first and second rectangles. The cytosol rectangles were traced in the areas adjacent to the membrane rectangles. The translocation ratio was measured as follows: average intensity (membrane)/average intensity (cytosol) [Im/Ic] normalized to the degree of translocation before the addition of pharmacological agents (Post/Pre). Cells with no significant translocation (Post/Pre <1.1) were not used. The person quantifying was blinded to the groups being measured. In some cases, when translocation was very patchy, the entire membrane was outlined and used.
The statistical significances of the differences between means were tested using either Student's t tests, or ANOVA. One-tailed t tests were used only when specifically testing a hypothesis that the means would differ in a given direction, otherwise a two-tailed t test was used. One-way and two-way ANOVAs with one repeated measure (time) were performed, followed by planned comparisons of the individual groups if there were more than two.
Results
Massed and spaced 5-HT applications bidirectionally modulate p-eEF2 levels
During protein synthesis, eEF2 promotes translocation of peptidyl-tRNA from the A-site to the P-site on the ribosome (Montanaro et al., 1976). eEF2 is phosphorylated on Thr-56 in mammals (Thr-57 in Aplysia) by its dedicated kinase, eEF2K, reducing its affinity for the ribosome causing inhibition of elongation (Nairn et al., 2001). To determine the ability of spaced or massed applications of 5-HT to regulate eEF2 phosphorylation (p-eEF2) in the cell soma, we used antibodies against the conserved eEF2K phosphorylation site on eEF2 (Carroll et al., 2004; Fig. 1A). Five spaced applications of 5-HT (5 × 5 min spaced by 20 min) decreased the cytoplasmic levels of p-eEF2, whereas one or three spaced applications (1 or 3 × 5 min spaced by 20 min) did not significantly affect levels of p-eEF2 (Fig. 1A). Notably, neither one nor three applications of 5-HT was sufficient to induce translation-dependent ITF (Mauelshagen et al., 1996). In contrast to five spaced applications of 5-HT, one continuous massed application of 5-HT of 10 min or longer had the opposite effect. The time course of massed 5-HT application shows an increase in p-eEF2 staining after 10 min (consistent with our earlier report; Weatherill et al., 2011), 25 min, and 90 min but no increase after 5 min, suggesting a delayed upregulation of p-eEF2 that persists up to 90 min with bath application of 5-HT (Fig. 1A). To verify that the bidirectional change in phosphorylation state was not due to changes in eEF2 protein levels, the same experiment was performed using a non-phospho antibody directed against eEF2 (Carroll et al., 2004). Our results show that only three spaced applications of 5-HT were sufficient to change the levels of eEF2 protein relative to ASW controls (Fig. 1B), despite the fact that the eEF2 mRNA contains a terminal oligpyrimidine tract and its rate of synthesis can be increased by 5-HT (Carroll et al., 2004). Thus, the timing of 5-HT application has a differential effect on eEF2 phosphorylation state independent of eEF2 synthesis, decreasing with spaced and increasing with massed 5-HT treatment.
Figure 1.

Massed and spaced 5-HT applications bidirectionally modulate p-eEF2 levels. A, Representative cells showing p-eEF2 staining are shown with the quantification of the mean ± SEM of the net fluorescence values that were normalized to the mean of the control group from each experiment. Results are shown for a single 5 min pulse of 5-HT [1× 5-HT, n = 15 cells; control, n = 13 cells; not significant (N.S.), p > 0.05], three spaced 5-HT pulses of 5 min duration with 20 min intervals between applications (spaced 3× 5-HT, n = 35 cells; ASW control, n = 47 cells; N.S., *, p > 0.05), five spaced 5-HT pulses of 5 min duration (spaced 5× 5-HT, n = 31 cells; ASW control, n = 16 cells, ***, p < 0.001), continuous applications of 5-HT of 10 min (massed 10 min, 5-HT, n = 23 cells; control, n = 26 cells; ***, p < 0.001), continuous application of 5-HT for 25 min (massed 25 min; 5-HT, n = 29 cells; control, n = 21 cells; ***, p < 0.001) and continuous application of 5-HT for 90 min (massed 90 min; 5-HT, n = 17 cells; control, n = 23 cells; **, p < 0.01). Statistical significance was calculated by two-tailed unpaired Student's t test. Scale bar, 60 μm. B, Representative cells showing eEF2 staining are shown with the quantification of the mean ± SEM of the net fluorescence values that were normalized to the mean of the control group from each experiment. Results are shown for a single 5 min pulse of 5-HT (spaced 1× 5-HT, n = 22 cells; control, n = 34 cells; N.S., *, p > 0.05), 3 spaced 5-HT pulses of 5 min duration with 20 min intervals between applications (spaced 3× 5-HT, n = 28 cells; control, n = 37 cells; **, p < 0.01), 5 spaced 5-HT pulses of 5 min duration with 20 min intervals between applications (spaced 5× 5-HT, n = 36 cells; control, n = 46 cells; N.S., *, p > 0.05), continuous applications of 5-HT of 10 min (massed 10 min, 5-HT, n = 25 cells; control, n = 36 cells; N.S., *, p > 0.05), continuous application of 5-HT for 25 min (massed 25 min, 5-HT, n = 16 cells; control, n = 18 cells; N.S., *, p > 0.05) and continuous application of 5-HT for 90 min (massed 90 min, 5-HT, n = 14 cells; control, n = 15 cells; N.S., *, p > 0.05). All tests were two-tailed unpaired Student's t test. Scale bar, 60 μm. C, Dose–response of NH125. Cells were treated with 5-HT for 10 min in the presence of varying concentrations of NH125 and the mean ± SEM of the net fluorescence values were normalized to the mean of the control group (10 min 5-HT + ASW) from each experiment (10 μm, n = 20 cells; 5 μm, n = 13 cells; 1 μm, n = 17 cells; 0.75 μm, n = 21 cells; 0.1 μm, n = 18 cells; 0 μm, n = 48 cells). D, The increase in p-eEF2 levels following a 10 min application of 5-HT is blocked by the addition of NH125 during 5-HT exposure. Representative cells showing p-eEF2 staining are shown with the quantification of the mean ± SEM of the net cytoplasmic fluorescence values, which were normalized to the mean of the control group from each experiment; ASW control (n = 19 cells), 10 min 5-HT (n = 24 cells), ASW+NH125 (n = 19 cells), 5-HT+NH125 (n = 23 cells). One-way ANOVA results in a significant overall effect of group (F(3,125) = 25.43, ***, p < 0.001). Tukey post hoc tests results are shown between groups. 10 min 5-HT was significantly different from control (***, p < 0.001) and 10 min 5-HT was significantly different from 10 min 5-HT+NH125 (***, p < 0.001). Scale bar, 60 μm. E, The decrease in p-eEF2 levels following five spaced 5-HT pulses was mimicked by the addition of NH125 alone, and there were no additional effects of 5-HT. ASW control (n = 22 cells), 5×5-HT (n = 20 cells), 5×ASW + NH125 (n = 17 cells), and 5×5-HT + NH125 (n = 27 cells). One-way ANOVA results in a significant overall effect of group (F(3,72) = 14.22, ***, p < 0.001). Tukey post hoc tests results are shown between groups. 5×5-HT, 5×ASW + NH125, and 5×5-HT + NH125 were significantly different from control (***, p < 0.001). Asterisk directly above the error bars are comparisons with the ASW control group. All other comparisons are indicated with brackets. Scale bar, 60 μm. All data in this figure represent cells from at least three independent experiments.
Next we sought to pharmacologically inhibit eEF2K-mediated phosphorylation of eEF2. NH125 is a selective and potent inhibitor that has been used in a number of studies to inhibit eEF2K in neurons (Sutton et al., 2007; Zhang et al., 2009; Oyang et al., 2011). We first treated sensory neurons with different concentrations of NH125, to confirm its effectiveness in Aplysia and found a dose-dependent inhibition of eEF2 phosphorylation in neurons treated for 10 min with 5-HT (Fig. 1C). We used 3 μm of NH125 for the remainder of this study. We proceeded to examine the effect of NH125-mediated eEF2K inhibition on p-eEF2 levels during massed and spaced applications of 5-HT. Importantly, acute treatment (20 min) with NH125 alone had no effect on the basal phosphorylation state of eEF2, but significantly inhibited the massed 5-HT-mediated induction of p-eEF2 (Fig. 1D). We next asked whether chronic treatment with NH125, one that mimics the duration of spaced 5-HT application (a protocol that lasts for >90 min) could cause a reduction in eEF2 phosphorylation. Indeed, addition of NH125 for this long period of time was sufficient to decrease eEF2 phosphorylation and moreover, occluded the effect of spaced 5-HT on p-eEF2 (Fig. 1E). Together, our results suggest that massed (1 × 10 min) and spaced (5 × 5 min with 20 min intervals) 5-HT treatments induce bidirectional changes in eEF2 phosphorylation through eEF2K.
We next sought to investigate whether bidirectional eEF2 modulation was important during synaptic plasticity. Sensory-motor neuron synapses were cultured and ITF induced with either massed (1 × 10 min) or spaced (5 × 5 min with 20 min intervals) 5-HT treatments in the presence or absence of NH125. Using the massed protocol, EPSPs were recorded and synaptic facilitation was seen 5 min after addition of 5-HT to the bath, with a peak increase at 20 min and slow decay approaching baseline after 65 min (Fig. 2A), similar to previous reports (Villareal et al., 2007; Jin et al., 2011). The addition of NH125 10 min before 5-HT, inhibited massed ITF measured between 20 and 70 min, while leaving short-term facilitation (STF) measured at 5 min intact, consistent with specific inhibition of the protein synthesis-dependent phase of ITF (Fig. 2A,B; Jin et al., 2011). Furthermore, application of NH125 alone for 20 min had no effect on basal synaptic transmission (Fig. 2A,B), consistent with the lack of change in basal p-eEF2 levels we observed in the presence of NH125 for this time period (Fig. 1D).
Figure 2.

eEF2 kinase activity is required for ITF mediated by massed 5-HT, but not by spaced 5-HT. A, A single continuous 10 min 5-HT exposure that is washed away by rapid perfusion of saline causes both STF and ITF at cultured sensory-motor neuron synapses. Representative EPSPs are shown at three different time points within a recording; baseline (10 min before 5-HT addition), STF (5 min after 5-HT addition), and ITF (50 min following 5-HT addition). A time course shows the mean EPSP amplitude, normalized to the first EPSP in each experiment, and the error bars indicate the SEM; ASW control (n = 4 synapses), 10 min 5-HT (n = 6 synapses), 10 min NH125 (n = 4 synapses), and 10 min 5-HT+NH125 (n = 5 synapses). The addition of NH125 with the 10 min 5-HT did not inhibit STF but did block the induction of ITF. There was a significant overall effect of group (F(3,84) = 24.73, ***, p < 0.001) in a two-way ANOVA with one repeated measure (time). B, The results of Tukey post hoc tests performed at 5 min (STF) and 50 min (ITF) after 5-HT addition are shown. During STF, 5-HT and 5-HT + NH125 were significantly different from control (**, p < 0.01, *, p < 0.05). ASW + NH125 was significantly different from 5-HT + NH125 (**, p < 0.01). Asterisk directly above the error bars are comparisons with the ASW control group. All other comparisons are indicated with brackets. C, Effect of NH125 on ITF at cultured synapses after spaced applications of 5-HT. Representative EPSPs are shown at two different time points within a recording; baseline (10 min before 5-HT addition), and ITF (120–140 min after the first 5-HT addition). A time course shows the mean EPSP amplitude, normalized to the first EPSP in each experiment, and the error bars indicate the SEM; ASW control (n = 9 synapses), 5×5-HT (n = 7 synapses), NH125 (n = 7 synapses), and 5×5-HT + NH125 (n = 9 synapses). There was a significant overall effect of group (F(3,74) = 7.672, ***, p < 0.001) in a two-way ANOVA with one repeated measure (time). D, The results of Tukey post hoc tests for spaced ITF. 5×5-HT, NH125, and 5×5-HT + NH125 groups are all significantly different from control (*, p < 0.05, **, p < 0.01, ***, p < 0.001, respectively). NH125 and 5×5-HT+NH125 are significantly different from each other (**, p < 0.01). Asterisk directly above the error bars are comparisons with the ASW control group. All other comparisons are indicated with brackets.
We next examined the role of eEF2K in spaced ITF. Consistent with our observations in the p-eEF2 experiments, long chronic application of NH125 (10 min before and during the entire spaced protocol) was sufficient to induce an increase in synaptic strength (Fig. 2C,D). Interestingly, spaced 5-HT applications in the presence of NH125 had an additional significant effect beyond that of NH125 alone, suggesting that the effect of 5-HT on facilitation was not completely occluded by NH125 (Fig. 2D). The effects of NH125 and 5-HT were not additive though, as the combination of 5-HT and NH125 was not significantly different from 5-HT alone (Fig. 2D).
These results suggest that eEF2K-mediated induction of p-eEF2 is required for expression of massed ITF, whereas an eEF2K-mediated decrease in p-eEF2 is sufficient to partially induce expression of spaced ITF. Moreover, whereas eEF2K plays a significant role, 5-HT acts on additional targets that are required for the full expression of spaced ITF.
Different signaling cascades mediate bidirectional eEF2 phosphorylation
We next sought to delineate the intracellular pathways activated by 5-HT that converge on eEF2. Previous work has shown that synapses activated by massed 5-HT training lead to PKC-dependent facilitation (Sossin et al., 1994; Jin et al., 2011). To investigate whether PKC was important for the increase in eEF2 phosphorylation observed after massed training, isolated SNs were treated with 5-HT for 10 min in the presence of the PKC inhibitor Bis-1, an ATP-based inhibitor (Toullec et al., 1991). Bis-1 acts differentially on the three PKC isoforms in Aplysia (the classical PKC Apl I, the novel PKC Apl II, and the atypical PKC Apl III). When used at a low concentration (1 μm), Bis-1 selectively inhibits the classical and novel PKCs (Villareal et al., 2009; Jin et al., 2011; Bougie et al., 2012). As shown in Figure 3A, Bis-1 treatment effectively blocks the induction of p-eEF2 following massed application of 5-HT, suggesting that either classical or novel PKC activity is required in this context. To ensure that Bis-1 is not acting directly on eEF2K, we expressed Aplysia eEF2K in a heterologous system, SF9 cells, that lack endogenous eEF2K but contain phosphorylatable eEF2 (Oldfield and Proud, 1993). SF9 cells expressing Aplysia eEF2K were incubated for 2 h with either Bis-1 or NH125 as a positive control. Whereas NH125 strongly decreased eEF2K activity, Bis-1 had no effect (Fig. 3B).
Figure 3.

Different signaling cascades mediate bidirectional eEF2 phosphorylation. A, The increase in p-eEF2 levels following a 10 min application of 5-HT is blocked by the addition of Bis-1. Representative cells showing p-eEF2 staining are shown with the quantification of the mean ± SEM of the net cytoplasmic fluorescence values, which were normalized to the mean of the control group for each experiment; 10 min ASW (n = 35 cells), 10 min 5-HT (n = 51 cells), 10 min ASW + Bis (n = 33 cells), and 10 min 5-HT+Bis (n = 31 cells). One-way ANOVA results in a significant overall effect of group (F(3,145) = 33.15, ***, p < 0.001). Bonferroni post hoc test shows 10 min 5-HT to be significantly different from control (***, p < 0.001) and 10 min 5-HT to be significantly different from 10 min 5-HT + Bis (***, p < 0.001). The data represents cells from three independent experiments. N.S., not significant. B, Sf9 cells were infected with the recombinant baculovirus containing eEF2K (Weatherill et al., 2011). At 48 h postinfection, cells were treated with the drugs and then lysed as described in methods and 10 μg of cell lysates was separated by SDS-PAGE (10%). The proteins were transferred to a nitrocellulose membrane and the phosphorylation of eEF2 was revealed by a phospho-eEF2 antibody. Expression of eEF2 Kinase was confirmed using an eEF2K antibody (Weatherill et al., 2011). The control lane represents noninfected cells. Quantification of phospho-eEF2 staining normalized to eEF2K levels (n = 2). C, NH125 does not disrupt phorbol ester (PMA) mediated enhancement of synaptic strength. Representative EPSPs are shown at baseline (10 min pretreatment) and 10 min post-treatment. A time course shows the mean EPSP amplitude, normalized to the first EPSP in each experiment, and the error bars indicate the SEM; ASW control (n = 3 synapses), PMA (n = 4 synapses), NH125 (n = 4 synapses), and PMA + NH125 (n = 4 synapses). PMA and PMA + NH125 groups were not significantly different. D, The decrease in p-eEF2 levels following five spaced 5-HT pulses was blocked by the PKA inhibitor KT5720. Representative cells showing p-eEF2 staining are shown with the quantification of the mean ± SEM of the net cytoplasmic fluorescence values, which were normalized to the mean of the control group; 5×ASW (n = 39 cells), 5×5-HT (n = 29 cells), 5×ASW + KT5720 (n = 37 cells), and 5×5-HT + KT5720 (n = 38 cells). One-way ANOVA results in a significant overall effect of group (F(3,148) = 6.441, p < 0.001). Bonferroni post hoc test shows 5×5-HT is significantly different from control (*, p < 0.05). 5×5-HT is significantly different from 5×5-HT + KT5720 (*, p < 0.05). Asterisk directly above the error bars are comparisons to ASW control group. All other comparisons are indicated with brackets. NS, not significant. The data represent cells from three independent experiments. Scale bar, 60 μm. E, The decrease in p-eEF2 levels following five spaced 5-HT pulses was blocked by the mTORC1 inhibitor, rapamycin. Representative cells showing p-eEF2 staining are presented with the quantification of the mean ± SEM of the net cytoplasmic fluorescence values, which were normalized to the mean of the control group; 5×ASW (n = 41 cells), 5×5-HT (n = 45 cells), 5×ASW + rapamycin (n = 36 cells), and 5×5-HT+rapamycin (n = 43 cells). One-way ANOVA results in a significant overall effect of group (F(3,161) = 8.419, ***, p < 0.001). Bonferroni post hoc test show 5×5-HT is significantly different from control (*, p < 0.05). 5×5-HT is significantly different from 5×5-HT + rapamycin (**, p < 0.01). Asterisk directly above the error bars are comparisons with the ASW control group. All other comparisons are indicated with brackets. NS, not significant. The data represent cells from three independent experiments. Scale bar, 60 μm. F, The increase in p-eEF2 levels following 10 min massed 5-HT was occluded by the mTORC1 inhibitor, rapamycin. Representative cells showing p-eEF2 staining are presented with the quantification of the mean ± SEM of the net cytoplasmic fluorescence values, which were normalized to the mean of the control group; 10 min ASW (n = 33 cells), 10 min 5-HT (n = 39 cells), 10 min ASW + rapamycin (n = 34 cells), and 10 min 5-HT + rapamycin (n = 32 cells). One-way ANOVA results in a significant overall effect of group (F(3,134) = 19.58, p < 0.001). Bonferroni post hoc test shows that 10 min 5-HT is significantly different from 10 min 5-HT + rapamycin (***, p < 0.001). Asterisk directly above the error bars **, p < 0.01; ***, p < 0.001 are comparisons with the ASW control group. All other comparisons are indicated with brackets. NS, not significant. The data represent cells from three independent experiments. Scale bar, 60 μm.
Both Bis-1 and NH125 block the increase in p-eEF2 immunoreactivity observed following massed 5-HT treatment, therefore it is possible that, in addition to blocking eEF2K activity, NH125 inhibits PKC under these conditions. Indeed, there has been some recent controversy about the specificity of NH125 in vitro (Chen et al., 2011; Devkota et al., 2012). To test this possibility, we induced a purely PKC-dependent synaptic facilitation (Braha et al., 1990; Houeland et al., 2007) using PMA. Sensorimotor neuron synapses were cultured and treated with either ASW (control), PMA alone, or PMA in the presence of NH125. Synaptic strength was significantly enhanced by 10 min PMA treatment both in the presence and absence of NH125, demonstrating that NH125 does not act by directly inhibiting PKC (Fig. 3C).
In contrast to massed 5-HT training, spaced 5-HT training generates synaptic facilitation that depends on persistent PKA activity, not PKC (Müller and Carew, 1998; Sutton and Carew, 2000). Indeed, inhibition of PKA, using the PKA inhibitor KT5720, blocked the decrease in p-eEF2 levels seen with five spaced applications of 5-HT, although KT5720 on its own had no effect (Fig. 3D). Previously, we had shown that 5-HT could reverse the increase in eEF2 phosphorylation seen in neurites after being cut from the cell soma. This required 5-HT activation of the target of rapamycin complex 1 (TORC1) pathway and was blocked by rapamycin (Carroll et al., 2004; Weatherill et al., 2011). Using rapamycin to specifically inhibit TORC1, we found that TOR signaling was also important for the decrease in eEF2 phosphorylation seen after spaced applications of 5-HT (Fig. 3E). To determine whether the effects of massed and spaced applications could be differentiated by their dependence on TORC1, we examined the effect of rapamycin on eEF2 phosphorylation after massed applications of 5-HT. Surprisingly, the short treatment with rapamycin significantly increased eEF2 phosphorylation on its own, and occluded the effect of 5-HT (Fig. 3F). Indeed, in the presence of rapamycin, 5-HT actually decreased eEF2 phosphorylation (Fig. 3F). The effect of rapamycin on its own is consistent with earlier experiments where we demonstrated that 10 min of 5-HT decreases phosphorylation of the S6K site in eEF2K, a known negative regulator of eEF2K activity (Weatherill et al., 2011). Together, these results highlight a novel and important signaling cascade in which PKCs and PKAs act downstream of massed and spaced applications of 5-HT, respectively, to mediate bidirectional changes in basal eEF2 phosphorylation states.
Protein synthesis-dependent maintenance of PKC at the membrane requires eEF2K
We have previously reported that PKC Apl II translocation to the plasma membrane of the cell soma shows a reduced desensitization with a massed versus spaced 5-HT training protocol (Farah et al., 2009). This protection from desensitization was shown to be PKC- and also protein synthesis-dependent. This is in contrast to spaced training, where there is a PKA- and protein synthesis-dependent increase in desensitization (Farah et al., 2009). This paradigm has proven useful to examine the protein synthesis-dependent kinetics of PKC activation in response to 5-HT in real-time and therefore, provides a convenient method to examine whether eEF2K is required for the prevention of PKC desensitization in living neurons. Thus, we examined the effect of blocking eEF2 phosphorylation on the desensitization of eGFP-PKC Apl II translocation in cultured SNs. As shown in Figure 4, eGFP-PKC Apl II translocated from the cytosol to the plasma membrane in response to application of 5-HT. There was no difference in the amount of translocation (fold increase in membrane/cytosol ratio of eGFP-PKC Apl II 5 min after 5-HT addition) in 5-HT + vehicle-treated SNs (1.95 ± 0.14, n = 10) or 5-HT + NH125-treated SNs (1.95 ± 0.11, n = 10, Student's t test, p > 0.1). Importantly, we observed that in the presence of NH125, 5-HT-mediated desensitization is significantly increased at 25 min (Fig. 4). This would be expected if NH125 blocks the PKC-dependent production of a protein that prevents desensitization, as we recently hypothesized (Farah et al., 2009; Naqib et al., 2011). Thus, both this protein synthesis-dependent decrease in PKC desensitization and ITF produced by massed 5-HT training require eEF2K activity.
Figure 4.

Protein synthesis-dependent maintenance of PKC at the membrane requires eEF2K. A, Representative confocal fluorescence images of Aplysia sensory neurons expressing enhanced green fluorescent protein (eGFP)-PKC Apl II before (Pre 5-HT), 5 min, and 25 min following the addition of 5-HT. Representative images of control treated sensory neurons are in the top row, and images of neurons treated with 5-HT+NH125 are in the bottom row. Scale bar, 10 μm. B, The translocation ratio normalized to 5 min is shown for the conditions cited in A. Error bars represent SE of the mean. The translocation ratio of eGFP-PKC Apl II in the 5-HT + NH125 group (n = 11 cells) was significantly lower than that of eGFP-PKC Apl II with 5-HT alone (n = 10 cells; *, p < 0.05 by two-tailed unpaired Student's t test).
Massed serotonin causes a local presynaptic increase in eEF2 phosphorylation
Synaptic plasticity-dependent regulation of translation elongation is an important target for local translational control (Taha et al., 2013). In cultured Aplysia synapses, massed (10 min) 5-HT-mediated ITF requires protein synthesis in both the presynaptic and postsynaptic neurons (Jin et al., 2011). To explore the possibility of p-eEF2 being regulated locally at the synapse in both compartments, GFP-tagged VAMP was overexpressed at low levels in the SN (Fig. 5A) to mark presynaptic release sites (Wang et al., 2009). In this experiment, levels of eEF2 phosphorylation were measured by immunocytochemistry in fixed cells following treatment with 5-HT or ASW for 10 min. Varicosities of green fluorescence were selected to define the presynaptic terminal, and differential interference contrast (DIC) was used to define the postsynaptic region next to the varicosity (Fig. 5A). As expected, massed application of 5-HT resulted in a significant increase in p-eEF2 immunostaining in VAMP-positive presynaptic varicosities (Fig. 5B,C). There was no change in p-eEF2 levels in the opposing postsynaptic region of the MN, demonstrating a specific presynaptic effect of massed 5-HT on the phosphorylation of eEF2. This is consistent with phosphorylation of eEF2 occurring downstream of PKC Apl II, because although 5-HT is sufficient to translocate the novel PKC Apl II in the sensory neuron, it is not sufficient to activate this PKC isoform in the motor neuron (Zhao et al., 2006).
Figure 5.
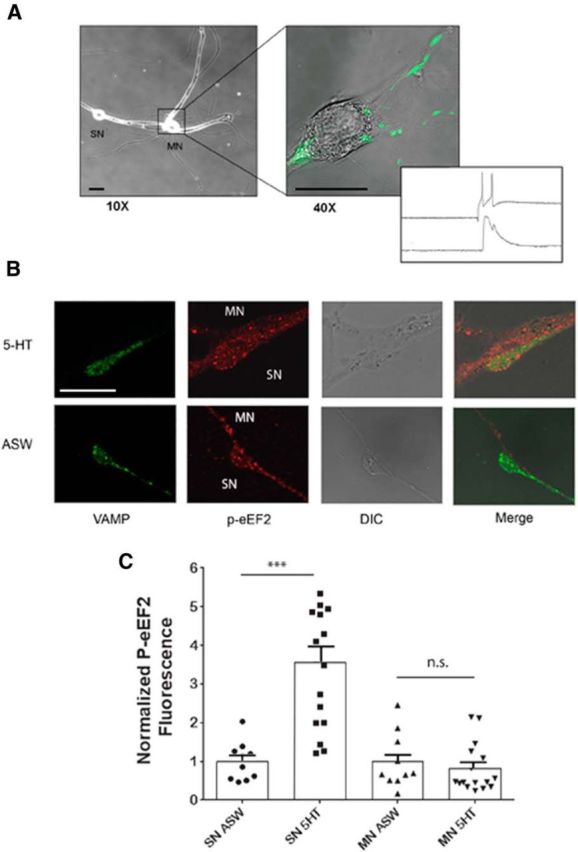
Massed serotonin causes a local, presynaptic increase in eEF2 phosphorylation. A, Representative images of a sensory-motor neuron synapse expressing green fluorescent protein-tagged VAMP in the sensory neuron. Low-magnification (10×) DIC image of the cultured neurons is expanded into a higher-magnification (40×) merged DIC and GFP fluorescence image showing the punctate distribution of VAMP-positive presynaptic varicosities overlapping the motor neuron neurite. After 3 d in culture, SNs were injected with the VAMP construct and expression and synaptic connectivity verified the next day (inset). Scale bar, 60 μm. B, Immediately following mock ASW control or 5-HT treatments, the cultures were fixed and processed for immunocytochemistry. Representative 60× confocal fluorescence images of VAMP (green signal), p-eEF2 (red signal), DIC, and merged for control and 5-HT treated groups are shown. The green signal was used as a marker of presynaptic release sites and the DIC was used to select the motor neuron neurite opposing the VAMP-positive varicosities. Scale bar, 10 μm. C, Quantification of the mean ± SEM of the immunofluorescence intensity of the p-eEF2 signal, normalized to the mean of the control group. The 5-HT treated group (n = 16 varicosities at 5 sensory–motor neuron pairs) has significantly higher p-eEF2 staining than the control group (n = 10 varicosities at 4 sensory–motor neuron pairs; ***, p < 0.001 by two-tailed unpaired Student's t test). n.s., not significant.
Dominant-negative disruption of eEF2K inhibits ITF by massed 5-HT
To distinguish presynaptic versus postsynaptic changes, and to avoid issues with the specificity of pharmacological agents, we used a more targeted approach to disrupt eEF2K activity. The use of knock-out animals or RNA interference is an effective approach when looking at modulation in a single direction; however, the complete loss of eEF2K would make interpreting bidirectional regulation impossible as abolishing the pathway responsible for the increase in eEF2 phosphorylation would also occlude any changes that are mediated by decreases in phosphorylation. Therefore, we made dominant-negative constructs that are predicted to block the increase in eEF2 phosphorylation. Gildish et al. (2012) previously described a mutation in the catalytic domain of mouse eEF2K (D273A) that created a kinase-impaired eEF2K, thus we made the equivalent mutation in the conserved residue in Aplysia, eEF2K(D309A; Fig. 6A). In addition, eEF2K is activated by phosphorylation at serine 499 (Diggle et al., 2001), so we chose to make point mutations in the corresponding conserved residues in Aplysia, to inhibit eEF2K activity (Fig. 6A). In the Aplysia orthologue of eEF2K there are two serine residues in close proximity to the conserved 499 site in mouse, therefore a double serine-to-alanine mutation was made (S481A-S482A), because often adjoining sites can be used in compensation when one site is removed (Fig. 6A). We next proceeded to characterize the effects of these mutations on massed ITF. In these experiments we used an mRFP-tagged full-length eEF2K, which appears to have less constitutive activity than a truncated untagged construct used in our earlier studies (Weatherill et al., 2011). Plasmid DNA encoding eEF2K constructs were microinjected into isolated SNs (Fig. 6B). Although overexpression of wild-type eEF2K significantly increased p-eEF2 immunostaining compared with mRFP-expressing neurons, both eEF2K(D309A)- and eEF2K(S481A-S482A)-expressing neurons had significantly less p-eEF2 immunostaining than the neurons expressing the wild-type kinase (Fig. 6B), and this staining was not significantly different from neurons expressing mRFP alone. This was not due to different expression levels, because the level of the mRFP staining was equivalent between wild-type and mutants (Fig. 6C).
Figure 6.

Dominant negative disruption of eEF2K inhibits ITF by massed 5-HT. A, The conserved domains of eEF2K targeted for dominant-negative mutants. The two regions expanded here are a conserved region of the catalytic domain and the start of the exon containing the PKA site. At the end of this exon is the beginning of the conserved eEF2-binding domain. To illustrate conservation over evolution, we compared sequence identity between the gastropod mollusk Aplysia, a deuterostome sea urchin (Strongylocentrotus purpuratus) and two mammals (rat and human). The sites where point mutations were introduced are boxed in red. B, Representative confocal p-eEF2 fluorescence images of isolated sensory neurons, showing either control-injected with mRFP alone (n = 10 cells), eEF2K wild-type (n = 13 cells), eEF2K(D-A) (n = 14 cells) and eEF2K(SS-AA) (n = 12 cells). Quantification of the mean ± SEM of the p-eEF2 immunofluorescence signal, normalized to the mean of the control group. One-way ANOVA results in a significant overall effect of group (F(3,65) = 16.31, ***, p < 0.001). The result of Tukey post hoc test comparisons between individual groups shows a significant increase between eEF2K wild-type and control (***, p < 0.001), and no significant change between either the eEF2K(D-A) and control or eEF2K(SS-AA) and control. There was a significant difference between eEF2K wild-type and eEF2K(D-A) (***, p < 0.001), and between eEF2K wild-type and eEF2K(SS-AA) (***, p < 0.001). Scale bar, 60 μm. C, Representative wide-field mRFP fluorescence images of the same set of sensory neurons in B. Quantification of the mean ± SEM of the mRFP fluorescence, normalized to the mean of the wild-type shows that there was no difference in expression between the groups by one-way ANOVA (F(2,49) = 0.724, p > 0.1). Scale bar, 60 μm. D, Representative p-eEF2 confocal fluorescence images of sensory neurons treated either with ASW or 5-HT in uninjected controls (ASW, n = 16 cells; 5-HT, n = 13 cells) or overexpressing eEF2K(D-A) (ASW, n = 18 cells; 5-HT, n = 21 cells). Quantification of the mean ± SEM of the p-eEF2 immunofluorescence signal, normalized to the mean of the uninjected ASW control group. One-way ANOVA results in a significant overall effect of group (F(3,46) = 10.38, ***, p < 0.001). The results of Tukey post hoc tests comparisons between individual groups shows a significant difference between uninjected 5-HT group and control (***, p < 0.001) but not between eEF2K(D-A) + 5-HT and control. There was a significant difference between uninjected + 5-HT and eEF2K(D-A) + 5-HT (***, p < 0.001). Scale bar, 60 μm. E, Ten minute 5-HT causes both STF and ITF, and representative EPSPs are shown at three different time points within a recording; baseline (10 min before 5-HT addition), STF (5 min after 5-HT addition), and ITF (50 min following 5-HT addition). A time course shows the mean EPSP amplitude, normalized to the first EPSP in each experiment, and the error bars indicate the SEM; mRFP + ASW control (n = 6 synapses), mRFP + 5-HT (n = 7 synapses), eEF2K (D-A) + ASW (n = 5 synapses), and eEF2K(D-A) + 5-HT (n = 6 synapses). Overexpression in the SN of eEF2K(D-A) inhibits both STF and the induction of ITF. There was a significant overall effect of group (F(3,19) = 12.43, ***, p < 0.001) in a two-way ANOVA with one repeated measure (time). F, The results of Tukey post hoc tests performed at 5 min (STF) and 50 min (ITF) after 5-HT addition. During STF, there was a significant difference between mRFP + 5-HT and mRFP + ASW control (*, p < 0.05). During ITF, there was a significant difference between mRFP + 5-HT and mRFP + ASW control (***, p < 0.001). Asterisk directly above the error bars are comparisons with the ASW control group. All other comparisons are indicated with brackets. NS, not significant.
We next examined the effect of the D309A mutation on p-eEF2 and synaptic facilitation. Overexpression of eEF2K(D309A) blocked the massed 5-HT-mediated increase in p-eEF2 fluorescence in SN cell bodies (Fig. 6D), demonstrating that this dominant-negative kinase can disrupt eEF2K-eEF2 signaling. To see whether the catalytic domain mutation could perturb synaptic facilitation following massed 5-HT, synapses were cultured and eEF2K(D309A) mutant overexpressed presynaptically. However, expression of this dominant-negative mutant blocked both STF and ITF (Fig. 6E,F) and had a negative effect of the strength of basal synaptic transmission, reducing EPSP amplitudes (mean amplitude 5.13 ± 1.06 mV, n = 11 synapses) compared with control (mean amplitude 9.12 mV ± 2.46, n = 10 synapses). The effects on basal synaptic strength and STF suggests that long-term expression of this largely kinase-dead eEF2K had additional effects beyond those of NH125 and precluded any conclusion on the specific role of an increase in eEF2K phosphorylation on ITF.
We next characterized the effects of eEF2K (S481A-S482A), which is predicted to block the activation of eEF2K, but not its basal activity and thus would be a weaker dominant-negative construct. Similar to the D-A mutant, overexpression of eEF2K(S481A-S482A) inhibited the massed 5-HT-mediated increase in p-eEF2 fluorescence in isolated SN cell bodies (Fig. 7A). Next, sensory-motor neuron synapses were cultured and the eEF2K(S481A-S482A) mutant was overexpressed presynaptically. In contrast to the eEF2K(D309A) mutant, overexpression of eEF2K(S481A-S482A) did not affect basal synaptic strength (mean EPSP amplitude: 10.28 ± 2.33 mV, n = 8 synapses) compared with control (mean amplitude: 8.55 ± 2.11 mV, n = 8 synapses), nor did it affect the protein synthesis-independent stage of facilitation, observed 5 min after addition of 5-HT (Fig. 7B). Presynaptic overexpression of dominant-negative eEF2K(S481A-S482A) did however completely inhibit massed ITF (Fig. 7C). This result is consistent with the pharmacological data obtained with NH125 and suggests that there is a presynaptic requirement for activation of eEF2K in ITF induced by 10 min of 5-HT.
Figure 7.

Presynaptic but not postsynaptic overexpression of dominant-negative eEF2K inhibits ITF by massed 5-HT. A, Representative p-eEF2 confocal fluorescence images of sensory neurons treated either with ASW or 5-HT as uninjected controls (ASW n = 15 cells, 5-HT n = 13 cells) or overexpressing eEF2K(D-A) (ASW n = 17 cells, 5-HT n = 16 cells). Quantification of the mean ± SEM of the p-eEF2 immunofluorescence signal, normalized to the mean of the uninjected ASW control group. One-way ANOVA results in a significant overall effect of group (F(3,58) = 9.868, ***, p < 0.001). The results of Tukey post hoc test comparisons between individual groups shows a significant difference between 5-HT and control (*, p < 0.05) but not between eEF2K(SS-AA) + 5-HT and control. There was also a significant difference between 5-HT and eEF2K(SS-AA) + 5-HT (***, p < 0.001). Results are from three independent experiments. Scale bar, 60 μm. B, Presynaptic overexpression in the SN of eEF2K(SS-AA) does not inhibit STF but does block the induction of ITF. A single continuous 10 min 5-HT exposure that was washed away by rapid perfusion of saline caused both STF and ITF at cultured synapses. Representative EPSPs are shown at three different time points within a recording: baseline (10 min before 5-HT addition), STF (5 min after 5-HT addition), and ITF (50 min following 5-HT addition). A time course shows the mean EPSP amplitude, normalized to the first EPSP in each experiment, and the error bars indicate the SEM mRFP + ASW control (n = 5 synapses), mRFP + 5-HT (n = 6 synapses), eEF2K(SS-AA) + ASW (n = 5 synapses), and eEF2K(SS-AA) + 5-HT (n = 4 synapses). There was a significant overall effect of group (F(3,15) = 8.330, ***, p < 0.001) in a two-way ANOVA with one repeated measure (time). C, The results of Tukey post hoc tests performed at 5 min (STF) and 50 min (ITF) after 5-HT addition. During STF there was a significant difference between mRFP + 5-HT and control (*, p < 0.05), and a significant difference between eEF2K(SS-AA) + ASW and eEF2K(SS-AA) + 5-HT. During ITF there was a significant difference between mRFP+5-HT and control (***, p < 0.001), and mRFP + 5-HT was significantly different from eEF2K(SS-AA) + 5-HT (*, p < 0.05). Asterisk directly above the error bars are comparisons with the ASW control group. All other comparisons are indicated with brackets. NS, not significant. D, Postsynaptic overexpression in the MN of eEF2K(SS-AA) inhibits neither STF nor the induction of ITF. Ten minute 5-HT causes both STF and ITF and representative EPSPs are shown at three different time points within a recording; baseline (10 min before 5-HT addition), STF (5 min after 5-HT addition), and ITF (50 min following 5-HT addition). A time course shows the mean EPSP amplitude, normalized to the first EPSP in each experiment, and the error bars indicate the SEM mRFP + ASW control (n = 6 synapses), mRFP + 5-HT (n = 5 synapses), eEF2K(SS-AA) + ASW (n = 4 synapses), and eEF2K(SS-AA) + 5-HT (n = 7 synapses). There was a significant overall effect of group (F(3,18) = 19.35, p < 0.001) in a two-way ANOVA with one repeated measure (time). E, Postsynaptic overexpression in the MN of eEF2K(SS-AA) did not inhibit STF or the induction of ITF. The results of Tukey post hoc tests performed at 5 min (STF) and 50 min (ITF) after 5-HT addition. During STF there was a significant difference between mRFP + 5-HT and control (*, p < 0.05) and a significant difference between eEF2K(SS-AA) + ASW and eEF2K (SS-AA)+ 5-HT (**, p < 0.01). During ITF there was also a significant difference between mRFP + 5-HT and control (***, p < 0.001) and a significant difference between eEF2K(SS-AA) + ASW and eEF2K(SS-AA) + 5-HT (**, p < 0.01). Asterisk directly above the error bars are comparisons with the ASW control group. All other comparisons are indicated with brackets. NS, not significant.
5-HT induced by 10 min of ITF requires protein synthesis in both the presynaptic and the postsynaptic motor neuron (Jin et al., 2011), therefore we next injected eEF2K(S481A-S482A) plasmid into the MNs of cultured sensorimotor synapses. As with expression in the presynaptic neuron, postsynaptic overexpression did not affect basal synaptic strength (mean EPSP amplitude: 10.76 ± 1.32 mV, n = 8 synapses) compared with control (mean amplitude: 11.57 ± 2.10 mV, n = 10 synapses), and STF was observed 5 min after addition of 5-HT (Fig. 7D). However, the dominant-negative eEF2K did not inhibit ITF, when injected into the MN (Fig. 7E), consistent with our earlier results showing a local increase in p-eEF2 in the presynaptic varicosities (Fig. 5) and not the adjoining postsynaptic area. Together, these results suggest that increased phosphorylation of eEF2 in the presynaptic SN but not in the postsynaptic MN is required for ITF after massed application of 5-HT.
Dominant-negative disruption of eEF2K inhibits maintenance of PKC at the membrane
We also examined whether dominant-negative eEF2K could also enhance PKC desensitization in live neurons. Cultured SNs were injected with plasmids encoding either eGFP-PKC Apl II and mRFP, or eGFP-PKC Apl II and mRFP-eEF2K(S481A-S482A). Following massed 5-HT treatment, eGFP-PKC Apl II translocated to the plasma membrane equally in mRFP and mRFP-eEF2K(S481A-S482A) injected sensory neurons (fold increase in membrane/cytosol ratio of eGFP-PKC Apl II 5 min after 5-HT addition; 2.45 ± 0.16, n = 15 for mRFP and 2.41 ± 0.20, n = 12 for mRFP-eEF2K(S481A-S482A) injected sensory neurons; p > 0.1, Student's t test). However, overexpression of eEF2K(S481A-S482A) significantly increased eGFP-PKC Apl II desensitization at 25 min compared with expression of mRFP (Fig. 8A,B). This result is consistent with the pharmacological data obtained with NH125 and demonstrates that the requirement for protein synthesis to retain PKC at the plasma membrane during massed 5-HT-dependent plasticity is mediated by the activation of a 5-HT-eEF2K-eEF2 signaling pathway.
Figure 8.

Dominant-negative disruption of eEF2K inhibits maintenance of PKC at the membrane. A, Representative confocal fluorescence images of Aplysia sensory neurons expressing eGFP-tagged PKC Apl II alone or eGFP-PKC Apl II + eEF2K(SS-AA), before (Pre 5-HT), 5 min, and 25 min following the addition of 5-HT. Representative images of eGFP-PKC Apl II injected sensory neurons are in the top row, and images of neurons injected with eGFP-PKC Apl II + eEF2K(SS-AA) are in the bottom row. Scale bar, 10 μm. B, The translocation ratio normalized to 5 min is shown for both conditions and the error bars represent SEM. The translocation ratio of eGFP-PKC Apl II + eEF2K (SS-AA) group (n = 14 cells) was significantly lower than that of eGFP-PKC Apl II alone (n = 12 cells, *, p < 0.05 by two-tailed unpaired Student's t test).
Massed 5-HT induced ITF requires elongation, but not translation initiation
Phosphorylation of eEF2 dissociates eEF2 from the ribosome and should slow elongation of all transcripts. However, our earlier results with translational reporters suggested that increased phosphorylation of eEF2 could increase translation of some mRNAs while decreasing others (Weatherill et al., 2011). Similar results have been seen after the increase in eEF2 phosphorylation during mGLUR-LTD in mammalian neurons (Davidkova and Carroll, 2007; Park et al., 2008). During mGLUR-LTD, some regulated translation is independent of initiation and requires elongation of preinitiated mRNAs stored in stalled polysomes (Graber et al., 2013). To determine whether this was also the case for the protein synthesis required for massed facilitation, we used the translation inhibitor homoharringtonine (HHT) that works by specifically blocking only the initial step of elongation and thus effectively blocking the translation of newly initiated transcripts, while allowing elongation on mRNAs where translation has already proceeded past the initial step of elongation. As expected, the elongation inhibitor Emetine blocked massed ITF without affecting the translation-independent synaptic facilitation observed at 5 min. In contrast, HHT did not block translation-dependent ITF after massed training, suggesting that initiation is not required for this form of translation-dependent plasticity (Fig. 9A,B). Neither HHT alone nor emetine alone affected synaptic strength and these results were pooled with the vehicle control. In contrast, HHT significantly inhibited spaced ITF (Fig. 9C,D), demonstrating that these two forms of plasticity are dissociable by their dependence on translation initiation. Although emetine completely blocked spaced ITF, there was still remaining facilitation in the presence of HHT, suggesting that initiation-independent protein translation also contributes to spaced ITF (Fig. 9C,D). Neither HHT alone nor emetine alone affected synaptic strength and these results were pooled with the vehicle control. To confirm that the inhibitors were effective, we measured overall protein synthesis using incorporation of the methionine analog AHA, followed by conjugation to a fluorophore after fixation (Dieterich et al., 2010). Both HHT and emetine strongly and equally blocked basal translation over a 40 min period, suggesting that the difference between HHT and Emetine was not their potency at blocking basal translation (Fig. 9E). As seen previously with incorporation of radioactive methionine (Barzilai et al., 1989; Yanow et al., 1998), massed 5-HT does not increase overall translation in either the cell soma or neurites (Fig. 9F). Surprisingly, there was not a significant 5-HT-mediated increase in overall translation even in the presence of HHT (Fig. 9F), as might have been expected if 5-HT caused the release of a large number of stalled polysomes.
Figure 9.

Massed and Spaced 5-HT induced plasticity are dissociable by their dependence on translation initiation. A, Incubation with emetine (125 μg/ml), but not with HHT (5 μm) blocks ITF after 10 min of massed 5-HT. A single continuous 10 min 5-HT exposure that was washed away by rapid perfusion of saline caused both STF and ITF. Representative EPSPs are shown at three different time points within a recording; baseline (10 min before 5-HT addition), STF (5 min after 5-HT addition), and ITF (50 min following 5-HT addition). A time course shows the mean EPSP amplitude, normalized to the first EPSP in each experiment, and the error bars indicate the SEM. Emetine alone and HHT alone recordings were no different from the DMSO control and were therefore pooled into the control group; Control (n = 9 synapses), 5-HT (n = 5 synapses), 5-HT + emetine (n = 6 synapses), and 5-HT + HHT (n = 4 synapses). There was a significant overall effect of group (F(3,74) = 11.82, ***, p < 0.001) in a two-way ANOVA with one repeated measure (time). B, The results of Tukey post hoc tests performed at 5 min (STF) and 50 min (ITF) after 5-HT addition. During STF, 5-HT, 5-HT + HHT, and 5-HT + emetine were significantly different from control (***, p < 0.001). 5-HT, 5-HT + HHT and 5-HT + emetine were not significantly different from each other. During ITF, 5-HT and 5-HT+HHT were significantly different from control (***, p < 0.001). 5-HT was significantly different from 5-HT + emetine (***, p < 0.001) and 5-HT+HHT was also significantly different from 5-HT + emetine (***, p < 0.001). Asterisk directly above the error bars are comparisons with the ASW control group. All other comparisons are indicated with brackets. C, Emetine and HHT both reduce ITF after spaced applications of 5-HT. Representative EPSPs are shown at two different time points within a recording: baseline (10 min before 5-HT addition) and ITF (120–140 min after the first 5-HT addition). A time course shows the mean EPSP amplitude, normalized to the first EPSP in each experiment, and the error bars indicate the SEM. Emetine alone and HHT alone control recordings were not different from the DMSO control and were therefore pooled with the control group; Control (n = 10 synapses), 5×5-HT (n = 6 synapses), 5×5-HT + emetine (n = 5 synapses), and 5×5-HT + HHT (n = 5 synapses). There was a significant overall effect of group (F(3,20) = 17.64, ***, p < 0.001) in a two-way ANOVA with one repeated measure (time). D, The results of Tukey post hoc tests for spaced ITF revealed that 5×5-HT, and 5×5-HT + HHT groups are significantly different from control (***, p < 0.001 for both). 5×5-HT + HHT and 5×5-HT + emetine are significantly different (***, p < 0.001) and 5×5-HT is significantly different from 5×5-HT + HHT (**, p < 0.01). Asterisk directly above the error bars are comparisons with ASW control group. All other comparisons are indicated with brackets. E, Labeling of new protein synthesis confirms that the translation inhibitors were effective. A diagram illustrates the protocol used to measure overall protein synthesis using incorporation of the methionine analog AHA. Representative confocal fluorescence images of sensory neurons, showing fluorescence from incorporated AHA (see Materials and Methods) with quantification of the mean ± SEM of the AHA immunofluorescence signal, normalized to the mean of the ASW control group; ASW (n = 138), emetine (n = 152, ***, p < 0.001), or HHT (n = 130, ***, p < 0.001). One-way ANOVA results in a significant overall effect of group (F(2,417) = 431.6, ***, p < 0.001). N.S., not significant. Results are from three independent experiments. Scale bar, 60 μm. F, Massed 5-HT does not increase overall translation in either the sensory neuron cytoplasm or neurite. A diagram illustrates the protocol used to measure overall protein synthesis. Representative confocal fluorescence images of sensory neuron cell bodies and neurites, showing fluorescence from incorporated AHA with quantification of the mean ± SEM of the AHA immunofluorescence signal, normalized to the mean of the ASW control group; ASW (n = 24 somas/16 neurites), 5-HT (n = 16 somas/21 neurites N.S., not significant), emetine (n = 50 somas/46 neurites, ***, p < 0.001 compared with ASW), emetine + 5-HT (n = 48 somas/47 neurites, ***, p < 0.001), HHT (n = 26 somas/22 neurites, ***, p < 0.001 compared with ASW), or HHT + 5-HT (n = 27 somas/16 neurites, ***, p < 0.001 compared with ASW). One-way ANOVA results in a significant overall effect of group for the cytoplasm (F(5,185) = 99.22, ***, p < 0.001) and the neurite (F(5,162) = 22.76, ***, p < 0.001). Results are from three independent experiments. Scale bar, 60 μm.
Discussion
We have demonstrated that eEF2 acts as a bidirectional switch, sensing patterns of neuromodulation, and coupling them to translational control. Previous studies have revealed an interaction between increased phosphorylation of eEF2 (Belelovsky et al., 2009; Panja et al., 2009) and decreases in eEF2 phosphorylation (Park et al., 2008; Im et al., 2009) and translational regulation during synaptic plasticity and memory. However, due to the differential activation of translation by the change in eEF2 phosphorylation (increase or decrease) previous studies are either confounded by the total loss of eEF2K causing a decrease in p-eEF2 or have demonstrated only a correlation between p-eEF2 and synaptic plasticity. To our knowledge, this is the first study dissociating the differential effects of increases and decreases in p-eEF2 on synaptic plasticity. Specifically, we find that eEF2 phosphorylation driven by massed serotonin exposure occurs both in the cell soma and locally within VAMP-positive varicosities and is required to produce ITF after 10 min applications of 5-HT. Conversely, eEF2 dephosphorylation driven by spaced 5-HT activity and subsequent PKA activity, contributes to ITF seen after spaced application of 5-HT. Furthermore, prevention of PKC desensitization, which is also induced specifically by massed 5-HT and has been shown to require new protein synthesis (Farah et al., 2009), was also found to be dependent on eEF2K activity. Because this effect is seen in isolated sensory neurons, it suggests that increases in eEF2 phosphorylation are important in both the soma and the synapse for regulating translation.
Bidirectional regulation of protein translation by eEF2 phosphorylation
Increases in eEF2 phosphorylation have been linked to mGluR-LTD (Park et al., 2008) and decreases in eEF2 phosphorylation have been linked to late-LTP (Park et al., 2008; Im et al., 2009) either through examining mice lacking eEF2K (Park et al., 2008) or through transgenic overexpression of eEF2K (Im et al., 2009). However, these experiments are confounded by the bidirectional regulation of eEF2K. For example, late-LTP was enhanced by removing eEF2K (Park et al., 2008), but whether this was due to a role for eEF2 dephosphorylation in late-LTP or due to the inhibition of production of proteins associated with mGluR-LTD is not clear. Similarly, the lack of mGluR-LTD in slices from eEF2K knock out mice (Park et al., 2008) could be mediated by the increase in the levels of proteins associated with LTP as opposed to the loss of translation of LTD genes, because both would be expected to occur with a total loss of eEF2 phosphorylation. eEF2 phosphorylation is also increased during associative taste learning and this learning is impaired in eEF2K knock-in mice containing the D-A mutation (Gildish et al., 2012). However, basal eEF2 phosphorylation was strongly decreased in this model (Gildish et al., 2012), and it is not clear if the block in the increase in phosphorylation or the basal decrease in phosphorylation underlies the impairment of learning.
Different intracellular mechanisms operate to couple activity patterns to translational control
In our study, we show that different signaling arms mediate changes in p-eEF2, with the increase in eEF2 phosphorylation after massed 5-HT blocked by inhibitors of PKC, and the decrease in eEF2 phosphorylation after spaced 5-HT blocked by inhibitors of PKA. Indeed, it has been shown that in Aplysia, serotonin can act via G-protein-coupled receptors to activate PKA or PKC (Dumitriu et al., 2006; Lee et al., 2009) and synapses activated by spaced 5-HT generate a protein synthesis-dependent ITF that requires PKA (Müller and Carew, 1998; Sutton and Carew, 2000), whereas massed training generates a protein synthesis-dependent ITF that requires PKC (Jin et al., 2011).
How does 5-HT stimulation increase p-eEF2? Because eEF2K is activated by phosphorylation at serine 499, which is a putative PKA and/or autophosphorylation site, (Diggle et al., 2001; Tavares et al., 2012) we made point mutations in the corresponding conserved residues in Aplysia, to inhibit eEF2K activity. In the Aplysia sequence there are two serine residues in close proximity, therefore a double serine-to-alanine mutation was made (S481A-S482A). Overexpression of the eEF2K(S481A-S482A) mutant led to less phosphorylation of eEF2 then did the wild-type eEF2K. In addition, massed 5-HT-mediated increases in p-eEF2 and ITF were blocked by the expression of eEF2K(S481A-S482A) suggesting that in Aplysia the phosphorylation of one, or both of these serines is required, and could potentially be mediated by PKC, because its activity is also required. However, there are many additional possible mechanisms, such as PKC inactivation of a phosphatase, PKC activation of eEF2K through a distinct mechanism that then requires autophosphorylation of this site to maintain increased eEF2K activity, or PKC activation of a distinct kinase that targets this site.
We have previously shown that the decrease in phosphorylation of eEF2 at T57 is mediated by TORC1/S6 kinase phosphorylation of eEF2K at a conserved serine (Carroll et al., 2004; Weatherill et al., 2011). Spaced applications of 5-HT are likely to work by inactivating eEF2K since the eEF2K inhibitor NH125 partially occluded its effects. Massed facilitation also works in part through opposite modulation of this site, because phosphorylation of the S6 kinase site is decreased by 10 min of 5-HT treatment (Weatherill et al., 2011) and the increase in eEF2 phosphorylation is occluded by rapamycin (Fig. 3F). One attractive possibility is that phosphorylation of the 499 site leads to dephosphorylation of the S6 kinase site, but further work will be required to understand the interaction between these two conserved phosphorylation sites.
The timing of the changes in eEF2 phosphorylation appears critical in determining the type of plasticity. Five minutes of 5-HT is sufficient to maximally activate the novel PKC Apl II (Zhao et al., 2006), but does not increase eEF2 phosphorylation. Indeed, five min of 5-HT is also insufficient to induce ITF. Understanding why prolonged 5-HT addition is required to induce eEF2 phosphorylation may provide insight into the transition between STF and ITF. Interestingly, autophosphorylation at Ser 499 in purified eEF2K is slow and requires free calmodulin, but not calcium (Tavares et al., 2012). This may be important in the delay in activation of eEF2K.
Adding NH125 for 20 min was insufficient to decrease basal eEF2 phosphorylation, but addition for >90 min did decrease eEF2 phosphorylation (Fig. 1). This is in contrast to the much faster effect of NH125 in blocking 5-HT-mediated increases in eEF2 phosphorylation at 10 min (Fig. 1). Thus, the effect of NH125 at blocking increases in eEF2 phosphorylation can be partially dissociated from its effect on blocking basal eEF2K activity. This may be due to indirect actions of NH125 (i.e., inhibiting an eEF2K kinase), or perhaps to greater effects of NH125 on eEF2K autophosphorylation than eEF2 phosphorylation because the former may be particularly important for the activation of eEF2K activity as opposed to its basal activity.
The effects of overexpression of the eEF2K (D-A) kinase impaired mutant appeared distinct from NH125. First, expression of the D-A mutant did not lead to a significant decrease in basal phosphorylation. Second, expression of the D-A mutant led to an overall decrease in synaptic strength, while prolonged incubation with NH125 led to an increase in synaptic strength. One possibility is that the longer expression of the D-A mutant (∼48 h as opposed to 2 h) led to homeostatic changes in the neuron, such as increases in phosphatase activity. Alternatively, expressing the D-A mutant may have additional effects outside of simply decreasing eEF2 kinase activity that led to changes in synaptic strength.
How does bidirectional modulation of eEF2 phosphorylation lead to distinct translational products?
Because elongation is important for translation of every message, the activation of specific mRNA translation after the decrease in elongation mediated by increases in eEF2 phosphorylation has been a challenge to explain. One explanation has been that some mRNAs are poorly initiated due to competition for initiation factors by well translated mRNAs (for review, see Sossin and Lacaille, 2010). The decrease in elongation slows the initiation process and thus frees up initiation factors to increase these poorly initiated mRNAs. However, we have recently shown that one form of plasticity requiring eEF2 phosphorylation, mGluR-LTD, can occur independently of initiation (Graber et al., 2013). These results suggest that increases in eEF2 phosphorylation may be required to reactivate stalled polysomes, allowing specific translation of mRNAs stored in these structures. Indeed, we show that the translation required for massed facilitation is independent of translation initiation, as it is not blocked by HHT, an inhibitor that specifically blocks the first step of elongation and effectively acts as an initiation inhibitor. However, unlike during mGLUR-LTD, we could not detect this initiation-independent protein synthesis using AHA incorporation, suggesting that if stalled polysomes are released, the level of synthesis is below the level of detection using this technique. This could be due to increased background in the Aplysia system, measurements being made in cells lacking synapses, or other differences between these two systems.
Conclusion
In summary, we have shown that spaced and massed serotonin induce ITF through differential regulation of eEF2 phosphorylation, identifying this phosphorylation site as an important hub for translational control underlying synaptic plasticity.
Footnotes
This work was supported by Canadian Institutes of Health Research Grant MOP 119286 (W.S.S.). P.K.M was supported by fellowships from the National Science and Engineering Research Council of Canada and the Fonds de la Recherche en Santé du Québec. W.S.S. is a James McGill Scholar.
The authors declare no competing financial interests.
References
- Autry AE, Adachi M, Nosyreva E, Na ES, Los MF, Cheng PF, Kavalali ET, Monteggia LM. NMDA receptor blockade at rest triggers rapid behavioural antidepressant responses. Nature. 2011;475:91–95. doi: 10.1038/nature10130. [DOI] [PMC free article] [PubMed] [Google Scholar]
- Barzilai A, Kennedy TE, Sweatt JD, Kandel ER. 5-HT modulates protein synthesis and the expression of specific proteins during long-term facilitation in Aplysia sensory neurons. Neuron. 1989;2:1577–1586. doi: 10.1016/0896-6273(89)90046-9. [DOI] [PubMed] [Google Scholar]
- Belelovsky K, Elkobi A, Kaphzan H, Nairn AC, Rosenblum K. A molecular switch for translational control in taste memory consolidation. Eur J Neurosci. 2005;22:2560–2568. doi: 10.1111/j.1460-9568.2005.04428.x. [DOI] [PubMed] [Google Scholar]
- Belelovsky K, Kaphzan H, Elkobi A, Rosenblum K. Biphasic activation of the mTOR pathway in the gustatory cortex is correlated with and necessary for taste learning. J Neurosci. 2009;29:7424–7431. doi: 10.1523/JNEUROSCI.3809-08.2009. [DOI] [PMC free article] [PubMed] [Google Scholar]
- Bougie JK, Cai D, Hastings M, Farah CA, Chen S, Fan X, McCamphill PK, Glanzman DL, Sossin WS. Serotonin-induced cleavage of the atypical protein kinase C Apl III in Aplysia. J Neurosci. 2012;32:14630–14640. doi: 10.1523/JNEUROSCI.3026-11.2012. [DOI] [PMC free article] [PubMed] [Google Scholar]
- Braha O, Dale N, Hochner B, Klein M, Abrams TW, Kandel ER. Second messengers involved in the two processes of presynaptic facilitation that contribute to sensitization and dishabituation in Aplysia sensory neurons. Proc Natl Acad Sci U S A. 1990;87:2040–2044. doi: 10.1073/pnas.87.5.2040. [DOI] [PMC free article] [PubMed] [Google Scholar]
- Byrne JH, Kandel ER. Presynaptic facilitation revisited: state and time dependence. J Neurosci. 1996;16:425–435. doi: 10.1523/JNEUROSCI.16-02-00425.1996. [DOI] [PMC free article] [PubMed] [Google Scholar]
- Carroll M, Warren O, Fan X, Sossin WS. 5-HT stimulates eEF2 dephosphorylation in a rapamycin-sensitive manner in Aplysia neurites. J Neurochem. 2004;90:1464–1476. doi: 10.1111/j.1471-4159.2004.02634.x. [DOI] [PubMed] [Google Scholar]
- Chen Z, Gopalakrishnan SM, Bui MH, Soni NB, Warrior U, Johnson EF, Donnelly JB, Glaser KB. 1-Benzyl-3-cetyl-2-methylimidazolium iodide (NH125) induces phosphorylation of eukaryotic elongation factor-2 (eEF2): a cautionary note on the anticancer mechanism of an eEF2 kinase inhibitor. J Biol Chem. 2011;286:43951–43958. doi: 10.1074/jbc.M111.301291. [DOI] [PMC free article] [PubMed] [Google Scholar]
- Costa-Mattioli M, Sossin WS, Klann E, Sonenberg N. Translational control of long-lasting synaptic plasticity and memory. Neuron. 2009;61:10–26. doi: 10.1016/j.neuron.2008.10.055. [DOI] [PMC free article] [PubMed] [Google Scholar]
- Davidkova G, Carroll RC. Characterization of the role of microtubule-associated protein 1B in metabotropic glutamate receptor-mediated endocytosis of AMPA receptors in hippocampus. J Neurosci. 2007;27:13273–13278. doi: 10.1523/JNEUROSCI.3334-07.2007. [DOI] [PMC free article] [PubMed] [Google Scholar]
- Devkota AK, Tavares CD, Warthaka M, Abramczyk O, Marshall KD, Kaoud TS, Gorgulu K, Ozpolat B, Dalby KN. Investigating the kinetic mechanism of inhibition of elongation factor 2 kinase by NH125: evidence of a common in vitro artifact. Biochemistry. 2012;51:2100–2112. doi: 10.1021/bi201787p. [DOI] [PMC free article] [PubMed] [Google Scholar]
- Dieterich DC, Hodas JJ, Gouzer G, Shadrin IY, Ngo JT, Triller A, Tirrell DA, Schuman EM. In situ visualization and dynamics of newly synthesized proteins in rat hippocampal neurons. Nat Neurosci. 2010;13:897–905. doi: 10.1038/nn.2580. [DOI] [PMC free article] [PubMed] [Google Scholar]
- Diggle TA, Subkhankulova T, Lilley KS, Shikotra N, Willis AE, Redpath NT. Phosphorylation of elongation factor-2 kinase on serine 499 by cAMP-dependent protein kinase induces Ca2+/calmodulin-independent activity. Biochem J. 2001;353:621–626. doi: 10.1042/0264-6021:3530621. [DOI] [PMC free article] [PubMed] [Google Scholar]
- Dumitriu B, Cohen JE, Wan Q, Negroiu AM, Abrams TW. Serotonin receptor antagonists discriminate between PKA- and PKC-mediated plasticity in Aplysia sensory neurons. J Neurophysiol. 2006;95:2713–2720. doi: 10.1152/jn.00642.2005. [DOI] [PubMed] [Google Scholar]
- Dyer J, Sossin WS. Characterization of the role of eIF4G in stimulating cap- and IRES-dependent translation in Aplysia neurons. PloS one. 2013;8:e74085. doi: 10.1371/journal.pone.0074085. [DOI] [PMC free article] [PubMed] [Google Scholar]
- Farah CA, Sossin WS. Live-imaging of PKC translocation in Sf9 cells and in aplysia sensory neurons. J Vis Exp. 2011a;50:2516. doi: 10.3791/2516. [DOI] [PMC free article] [PubMed] [Google Scholar]
- Farah CA, Sossin WS. A new mechanism of action of a C2 domain-derived novel PKC inhibitor peptide. Neurosci Lett. 2011b;504:306–310. doi: 10.1016/j.neulet.2011.09.053. [DOI] [PubMed] [Google Scholar]
- Farah CA, Nagakura I, Weatherill D, Fan X, Sossin WS. Physiological role for phosphatidic acid in the translocation of the novel protein kinase C Apl II in Aplysia neurons. Mol Cell Biol. 2008;28:4719–4733. doi: 10.1128/MCB.00178-08. [DOI] [PMC free article] [PubMed] [Google Scholar]
- Farah CA, Weatherill D, Dunn TW, Sossin WS. PKC differentially translocates during spaced and massed training in Aplysia. J Neurosci. 2009;29:10281–10286. doi: 10.1523/JNEUROSCI.1533-09.2009. [DOI] [PMC free article] [PubMed] [Google Scholar]
- Gildish I, Manor D, David O, Sharma V, Williams D, Agarwala U, Wang X, Kenney JW, Proud CG, Rosenblum K. Impaired associative taste learning and abnormal brain activation in kinase-defective eEF2K mice. Learn Mem. 2012;19:116–125. doi: 10.1101/lm.023937.111. [DOI] [PMC free article] [PubMed] [Google Scholar]
- Graber TE, Hébert-Seropian S, Khoutorsky A, David A, Yewdell JW, Lacaille JC, Sossin WS. Reactivation of stalled polyribosomes in synaptic plasticity. Proc Natl Acad Sci U S A. 2013;110:16205–16210. doi: 10.1073/pnas.1307747110. [DOI] [PMC free article] [PubMed] [Google Scholar]
- Hawkins RD, Kandel ER, Bailey CH. Molecular mechanisms of memory storage in Aplysia. Biol Bull. 2006;210:174–191. doi: 10.2307/4134556. [DOI] [PubMed] [Google Scholar]
- Heise C, Gardoni F, Culotta L, di Luca M, Verpelli C, Sala C. Elongation factor-2 phosphorylation in dendrites and the regulation of dendritic mRNA translation in neurons. Front Cell Neurosci. 2014;8:35. doi: 10.3389/fncel.2014.00035. [DOI] [PMC free article] [PubMed] [Google Scholar]
- Houeland G, Nakhost A, Sossin WS, Castellucci VF. PKC modulation of transmitter release by SNAP-25 at sensory-to-motor synapses in Aplysia. J Neurophysiol. 2007;97:134–143. doi: 10.1152/jn.00122.2006. [DOI] [PubMed] [Google Scholar]
- Im HI, Nakajima A, Gong B, Xiong X, Mamiya T, Gershon ES, Zhuo M, Tang YP. Post-training dephosphorylation of eEF-2 promotes protein synthesis for memory consolidation. PloS One. 2009;4:e7424. doi: 10.1371/journal.pone.0007424. [DOI] [PMC free article] [PubMed] [Google Scholar]
- Inamura N, Nawa H, Takei N. Enhancement of translation elongation in neurons by brain-derived neurotrophic factor: implications for mammalian target of rapamycin signaling. J Neurochem. 2005;95:1438–1445. doi: 10.1111/j.1471-4159.2005.03466.x. [DOI] [PubMed] [Google Scholar]
- Jin I, Kandel ER, Hawkins RD. Whereas short-term facilitation is presynaptic, intermediate-term facilitation involves both presynaptic and postsynaptic protein kinases and protein synthesis. Learn Mem. 2011;18:96–102. doi: 10.1101/lm.1949711. [DOI] [PMC free article] [PubMed] [Google Scholar]
- Kandel ER. The molecular biology of memory storage: a dialog between genes and synapses. Biosci Rep. 2001;21:565–611. doi: 10.1023/A:1014775008533. [DOI] [PubMed] [Google Scholar]
- Kanhema T, Dagestad G, Panja D, Tiron A, Messaoudi E, Håvik B, Ying SW, Nairn AC, Sonenberg N, Bramham CR. Dual regulation of translation initiation and peptide chain elongation during BDNF-induced LTP in vivo: evidence for compartment-specific translation control. J Neurochem. 2006;99:1328–1337. doi: 10.1111/j.1471-4159.2006.04158.x. [DOI] [PubMed] [Google Scholar]
- Lee YS, Choi SL, Lee SH, Kim H, Park H, Lee N, Lee SH, Chae YS, Jang DJ, Kandel ER, Kaang BK. Identification of a serotonin receptor coupled to adenylyl cyclase involved in learning-related heterosynaptic facilitation in Aplysia. Proc Natl Acad Sci U S A. 2009;106:14634–14639. doi: 10.1073/pnas.0907502106. [DOI] [PMC free article] [PubMed] [Google Scholar]
- Mauelshagen J, Parker GR, Carew TJ. Dynamics of induction and expression of long-term synaptic facilitation in Aplysia. J Neurosci. 1996;16:7099–7108. doi: 10.1523/JNEUROSCI.16-22-07099.1996. [DOI] [PMC free article] [PubMed] [Google Scholar]
- Montanaro L, Sperti S, Testoni G, Mattioli A. Effect of elongation factor 2 and of adenosine diphosphate-ribosylated elongation factor 2 on translocation. Biochem J. 1976;156:15–23. doi: 10.1042/bj1560015. [DOI] [PMC free article] [PubMed] [Google Scholar]
- Müller U, Carew TJ. Serotonin induces temporally and mechanistically distinct phases of persistent PKA activity in Aplysia sensory neurons. Neuron. 1998;21:1423–1434. doi: 10.1016/S0896-6273(00)80660-1. [DOI] [PubMed] [Google Scholar]
- Nagakura I, Dunn TW, Farah CA, Heppner A, Li FF, Sossin WS. Regulation of protein kinase C Apl II by serotonin receptors in Aplysia. J Neurochem. 2010;115:994–1006. doi: 10.1111/j.1471-4159.2010.06986.x. [DOI] [PubMed] [Google Scholar]
- Nairn AC, Matsushita M, Nastiuk K, Horiuchi A, Mitsui K, Shimizu Y, Palfrey HC. Elongation factor-2 phosphorylation and the regulation of protein synthesis by calcium. Prog Mol Subcell Biol. 2001;27:91–129. doi: 10.1007/978-3-662-09889-9_4. [DOI] [PubMed] [Google Scholar]
- Nakhost A, Dyer JR, Pepio AM, Fan X, Sossin WS. Protein kinase C phosphorylated at a conserved threonine is retained in the cytoplasm. J Biol Chem. 1999;274:28944–28949. doi: 10.1074/jbc.274.41.28944. [DOI] [PubMed] [Google Scholar]
- Naqib F, Farah CA, Pack CC, Sossin WS. The rates of protein synthesis and degradation account for the differential response of neurons to spaced and massed training protocols. PLoS Comput Biol. 2011;7:e1002324. doi: 10.1371/journal.pcbi.1002324. [DOI] [PMC free article] [PubMed] [Google Scholar]
- Oldfield S, Proud CG. Phosphorylation of elongation factor-2 from the lepidopteran insect, Spodoptera frugiperda. FEBS Lett. 1993;327:71–74. doi: 10.1016/0014-5793(93)81042-X. [DOI] [PubMed] [Google Scholar]
- Oyang EL, Davidson BC, Lee W, Poon MM. Functional characterization of the dendritically localized mRNA neuronatin in hippocampal neurons. PloS One. 2011;6:e24879. doi: 10.1371/journal.pone.0024879. [DOI] [PMC free article] [PubMed] [Google Scholar]
- Panja D, Dagyte G, Bidinosti M, Wibrand K, Kristiansen AM, Sonenberg N, Bramham CR. Novel translational control in Arc-dependent long term potentiation consolidation in vivo. J Biol Chem. 2009;284:31498–31511. doi: 10.1074/jbc.M109.056077. [DOI] [PMC free article] [PubMed] [Google Scholar]
- Park S, Park JM, Kim S, Kim JA, Shepherd JD, Smith-Hicks CL, Chowdhury S, Kaufmann W, Kuhl D, Ryazanov AG, Huganir RL, Linden DJ, Worley PF. Elongation factor 2 and fragile X mental retardation protein control the dynamic translation of Arc/Arg3.1 essential for mGluR-LTD. Neuron. 2008;59:70–83. doi: 10.1016/j.neuron.2008.05.023. [DOI] [PMC free article] [PubMed] [Google Scholar]
- Scheetz AJ, Nairn AC, Constantine-Paton M. N-methyl-d-aspartate receptor activation and visual activity induce elongation factor-2 phosphorylation in amphibian tecta: a role for N-methyl-d-aspartate receptors in controlling protein synthesis. Proc Natl Acad Sci U S A. 1997;94:14770–14775. doi: 10.1073/pnas.94.26.14770. [DOI] [PMC free article] [PubMed] [Google Scholar]
- Sonenberg N, Hinnebusch AG. Regulation of translation initiation in eukaryotes: mechanisms and biological targets. Cell. 2009;136:731–745. doi: 10.1016/j.cell.2009.01.042. [DOI] [PMC free article] [PubMed] [Google Scholar]
- Sossin WS. Isoform specificity of protein kinase CS in synaptic plasticity. Learn Mem. 2007;14:236–246. doi: 10.1101/lm.469707. [DOI] [PubMed] [Google Scholar]
- Sossin WS, Lacaille JC. Mechanisms of translational regulation in synaptic plasticity. Curr Opin Neurobiol. 2010;20:450–456. doi: 10.1016/j.conb.2010.03.011. [DOI] [PMC free article] [PubMed] [Google Scholar]
- Sossin WS, Sacktor TC, Schwartz JH. Persistent activation of protein kinase C during the development of long-term facilitation in Aplysia. Learn Mem. 1994;1:189–202. doi: 10.1101/lm.1.3.189. [DOI] [PubMed] [Google Scholar]
- Sutton MA, Carew TJ. Parallel molecular pathways mediate expression of distinct forms of intermediate-term facilitation at tail sensory-motor synapses in Aplysia. Neuron. 2000;26:219–231. doi: 10.1016/S0896-6273(00)81152-6. [DOI] [PubMed] [Google Scholar]
- Sutton MA, Taylor AM, Ito HT, Pham A, Schuman EM. Postsynaptic decoding of neural activity: eEF2 as a biochemical sensor coupling miniature synaptic transmission to local protein synthesis. Neuron. 2007;55:648–661. doi: 10.1016/j.neuron.2007.07.030. [DOI] [PubMed] [Google Scholar]
- Taha E, Gildish I, Gal-Ben-Ari S, Rosenblum K. The role of eEF2 pathway in learning and synaptic plasticity. Neurobiol Learn Mem. 2013;105:100–106. doi: 10.1016/j.nlm.2013.04.015. [DOI] [PubMed] [Google Scholar]
- Tavares CD, O'Brien JP, Abramczyk O, Devkota AK, Shores KS, Ferguson SB, Kaoud TS, Warthaka M, Marshall KD, Keller KM, Zhang Y, Brodbelt JS, Ozpolat B, Dalby KN. Calcium/calmodulin stimulates the autophosphorylation of elongation factor 2 kinase on Thr-348 and Ser-500 to regulate its activity and calcium dependence. Biochemistry. 2012;51:2232–2245. doi: 10.1021/bi201788e. [DOI] [PMC free article] [PubMed] [Google Scholar]
- Toullec D, Pianetti P, Coste H, Bellevergue P, Grand-Perret T, Ajakane M, Baudet V, Boissin P, Boursier E, Loriolle F. The bisindolylmaleimide GF 109203X is a potent and selective inhibitor of protein kinase C. J Biol Chem. 1991;266:15771–15781. [PubMed] [Google Scholar]
- Verpelli C, Piccoli G, Zibetti C, Zanchi A, Gardoni F, Huang K, Brambilla D, Di Luca M, Battaglioli E, Sala C. Synaptic activity controls dendritic spine morphology by modulating eEF2-dependent BDNF synthesis. J Neurosci. 2010;30:5830–5842. doi: 10.1523/JNEUROSCI.0119-10.2010. [DOI] [PMC free article] [PubMed] [Google Scholar]
- Villareal G, Li Q, Cai D, Glanzman DL. The role of rapid, local, postsynaptic protein synthesis in learning-related synaptic facilitation in Aplysia. Curr Biol. 2007;17:2073–2080. doi: 10.1016/j.cub.2007.10.053. [DOI] [PMC free article] [PubMed] [Google Scholar]
- Villareal G, Li Q, Cai D, Fink AE, Lim T, Bougie JK, Sossin WS, Glanzman DL. Role of protein kinase C in the induction and maintenance of serotonin-dependent enhancement of the glutamate response in isolated siphon motor neurons of Aplysia californica. J Neurosci. 2009;29:5100–5107. doi: 10.1523/JNEUROSCI.4149-08.2009. [DOI] [PMC free article] [PubMed] [Google Scholar]
- Wang DO, Kim SM, Zhao Y, Hwang H, Miura SK, Sossin WS, Martin KC. Synapse- and stimulus-specific local translation during long-term neuronal plasticity. Science. 2009;324:1536–1540. doi: 10.1126/science.1173205. [DOI] [PMC free article] [PubMed] [Google Scholar]
- Weatherill DB, Dyer J, Sossin WS. Ribosomal protein S6 kinase is a critical downstream effector of the target of rapamycin complex 1 for long-term facilitation in Aplysia. J Biol Chem. 2010;285:12255–12267. doi: 10.1074/jbc.M109.071142. [DOI] [PMC free article] [PubMed] [Google Scholar]
- Weatherill DB, McCamphill PK, Pethoukov E, Dunn TW, Fan X, Sossin WS. Compartment-specific, differential regulation of eukaryotic elongation factor 2 and its kinase within Aplysia sensory neurons. J Neurochem. 2011;117:841–855. doi: 10.1111/j.1471-4159.2011.07251.x. [DOI] [PubMed] [Google Scholar]
- Yanow SK, Manseau F, Hislop J, Castellucci VF, Sossin WS. Biochemical pathways by which serotonin regulates translation in the nervous system of Aplysia. J Neurochem. 1998;70:572–583. doi: 10.1046/j.1471-4159.1998.70020572.x. [DOI] [PubMed] [Google Scholar]
- Zhang SY, Xu M, Miao QL, Poo MM, Zhang XH. Endocannabinoid-dependent homeostatic regulation of inhibitory synapses by miniature excitatory synaptic activities. J Neurosci. 2009;29:13222–13231. doi: 10.1523/JNEUROSCI.1710-09.2009. [DOI] [PMC free article] [PubMed] [Google Scholar]
- Zhao Y, Leal K, Abi-Farah C, Martin KC, Sossin WS, Klein M. Isoform specificity of PKC translocation in living Aplysia sensory neurons and a role for Ca2+-dependent PKC APL I in the induction of intermediate-term facilitation. J Neurosci. 2006;26:8847–8856. doi: 10.1523/JNEUROSCI.1919-06.2006. [DOI] [PMC free article] [PubMed] [Google Scholar]