

Abstract
Neural control of synergist muscles is not well understood. Presumably, each muscle in a synergistic group receives some unique neural drive and some drive that is also shared in common with other muscles in the group. In this investigation, we sought to characterize the strength, frequency spectrum, and force dependence of the neural drive to the human vastus lateralis and vastus medialis muscles during the production of isometric knee extension forces at 10 and 30% of maximum voluntary effort. High-density surface electromyography recordings were decomposed into motor unit action potentials to examine the neural drive to each muscle. Motor unit coherence analysis was used to characterize the total neural drive to each muscle and the drive shared between muscles. Using a novel approach based on partial coherence analysis, we were also able to study specifically the neural drive unique to each muscle (not shared). The results showed that the majority of neural drive to the vasti muscles was a cross-muscle drive characterized by a force-dependent strength and bandwidth. Muscle-specific neural drive was at low frequencies (<5 Hz) and relatively weak. Frequencies of neural drive associated with afferent feedback (6–12 Hz) and with descending cortical input (∼20 Hz) were almost entirely shared by the two muscles, whereas low-frequency (<5 Hz) drive comprised shared (primary) and muscle-specific (secondary) components. This study is the first to directly investigate the extent of shared versus independent control of synergist muscles at the motor neuron level.
SIGNIFICANCE STATEMENT Precisely how the nervous system coordinates the activity of synergist muscles is not well understood. One possibility is that muscles of a synergy share a common neural drive. In this study, we directly compared the relative strength of shared versus independent neural drive to synergistically activated thigh muscles in humans. The results of this analysis support the notion that synergistically activated muscles share most of their neural drive. Scientifically, this study addressed an important gap in our current understanding of how neural drive is delivered to synergist muscles. We have also demonstrated the feasibility of a novel approach to the study of muscle synergies based on partial coherence analysis of motor unit activity.
Keywords: EMG, motor units, muscle synergy, partial coherence, quadriceps
Introduction
It has long been suspected that actions involving multiple muscles are controlled through a simplified set of high-level commands, the fingerprints of which can be observed as coordinated activity among muscles, i.e., “muscle synergies” (for review, see Tresch and Jarc, 2009; Bizzi and Cheung, 2013). However, there is an important controversy as to whether such activity implies that multiple muscles are controlled together by shared neural input or whether it simply reflects the mechanical constraints of a given task (Tresch and Jarc, 2009; Kutch and Valero-Cuevas, 2012; Bizzi and Cheung, 2013). In several species, stimulation of cutaneous (Tresch et al., 1999), spinal (Giszter et al., 1993; Levine et al., 2014), or cortical (Graziano et al., 2002; Overduin et al., 2012, 2014) neurons produces coordinated muscle activities, strongly suggesting the construction of muscle synergies by the nervous system. However, many questions remain related to the usage of such circuitry in humans and, in particular, the extent to which muscles of a synergy are driven by shared versus independent inputs. The most common methods used to characterize muscle synergies in humans cannot assess the distribution/delivery of neural drive to the activated muscles.
For decades, neuromuscular control signals have been investigated by examining correlated activity among motor units (Sears and Stagg, 1976; De Luca et al., 1982; Rosenberg et al., 1989; Farmer et al., 1993; Halliday et al., 1995), because this reflects their shared (and “effective”) neural drive (Farina et al., 2014; Farina and Negro, 2015). The strategy has not generally been applied to the analysis of groups of muscles. It has been exceedingly rare in past studies for both within-muscle and across-muscle motor unit correlations to be evaluated during execution of a motor task. Even with such measurements, it is not possible to determine the relative strength/proportion of neural drive that is unique to a given muscle versus shared with other simultaneously activated muscles.
In this study, we have overcome these limitations to investigate a simple synergy. Specifically, we investigated two synergist muscles of the quadriceps, the vastus lateralis and vastus medialis, during production of two isometric knee extension forces (10 and 30% of maximum voluntary effort). To comprehensively evaluate within-muscle and across-muscle neural drive, we used the well established technique of motor unit coherence analysis (Rosenberg et al., 1989; Farmer et al., 1993; Halliday et al., 1995; Amjad et al., 1997), which describes the frequency spectrum of neural input. We then applied a novel method based on partial coherence analysis to separate the total neural drive to each muscle into shared (cross-muscle) and unique (muscle-specific) components and to evaluate the relative strength of each.
Our overall hypothesis was that the two vasti muscles would be controlled primarily by a shared neural drive, with relatively little unique drive to each muscle. This prediction was motivated by the high degree of synchronized motor unit discharges (Mellor and Hodges, 2005) and firing rate fluctuations (Beck et al., 2012) across the two vasti muscles, which attain magnitudes similar to what has been reported for within-muscle motor unit correlations (De Luca et al., 2009; Beck et al., 2011).
The idea that multiple muscles can be controlled mainly through shared input is of great importance for understanding muscle synergies. Our study represents the first direct test (and direct support) of this concept at the level of neural drive in humans, for a simple task and synergy. We also present the most comprehensive characterization of neural drive to the vasti muscles to date.
Materials and Methods
All procedures were approved by the University of Medicine Göttingen (Reference 24/1/14) and were conducted in accordance with the Declaration of Helsinki. Written consent was obtained from all study participants. Ten healthy adult males (mean ± SD) aged 27 ± 4 years participated in the study, all free from musculoskeletal or neurological conditions affecting the lower extremities and all without history of lower limb surgery.
Task
Participants were seated upright in the chair of a Biodex System 3 (Biodex Medical Systems), which enabled stable fixation of the torso, right thigh, and lower leg. The knee was flexed at a 90° angle, and isometric knee extension force was exerted on a dynamometer fixed to the lower leg just above the lateral malleolus. Knee extension forces wereabove the lateral malleolus. Knee extension forces were quantified for each individual as a percentage of their maximum voluntary contraction (%MVC) level, established at the beginning of each recording session. During each recording session, the participants used visual feedback of their exerted force (displayed on a computer screen) to maintain 20 s contractions at 10 or 30% MVC. Three contractions at each force level were accomplished per session, separated by at least 2 min and in randomized order. Each individual participated in three sessions, resulting in a total of nine contractions per force level for each subject.
Electromyography
Surface electromyography (EMG) signals were recorded over the vastus medialis and vastus lateralis of each subject using high-density, 64-channel surface EMG arrays (LISiN-OT Bioelettronica). Each electrode array consists of a 5 × 13 grid of electrodes (1 mm diameter, 8 mm interelectrode distance), with one electrode absent from the upper right corner. The arrays were located centrally between the proximal and distal tendons of the muscles, with the long axis of each rectangular array aligned with the muscle fibers (see Fig. 2). The proper positioning of the electrodes was confirmed by moving a non-adhesive linear electrode array over the skin during a voluntary muscle contraction, allowing the innervation zone, tendon regions, and appropriate orientation angle to be determined (Masuda et al., 1985; Farina et al., 2001). Signals were amplified and recorded (2048 Hz sampling rate) using an OT Bioelettronica USB2 amplifier and associated OT Biolab software (LISiN-OT Bioelettronica). The EMG data were processed and analyzed offline using MATLAB (MathWorks). Before decomposition, the 64 monopolar EMG channels (referenced at the knee) were re-referenced offline to form 59 bipolar channels (i.e., using the difference between adjacent electrodes in the direction of the muscle fibers).
Figure 2.

Recordings and data analysis. High-density surface EMG signals (64 channels) were recorded from the vastus lateralis and vastus medialis muscles of healthy participants during production of isometric knee extension force (10 and 30% of maximum force). The EMG signals were then decomposed to reveal the firing activities of single motor units. A schematic representation of the task and motor unit recording methodology is shown at the left. A total of 80 trials (20 s each) were recorded across nine subjects. For each trial, neural drive to the vasti muscles was characterized using the decomposed motor unit data. First, the pooled coherence between all concurrently active pairs of single motor units was derived for each muscle. The red traces in the top and bottom at the right show this analysis for a single trial at 30% maximum force. Motor unit coherence reveals the frequency content of neural drive to each muscle. The major component occurred in the 1–5 Hz range for both muscles, with smaller peaks present at ∼10 Hz (mainly in the vastus lateralis in this trial) and just below 20 Hz. In addition, the pooled coherence of motor units recorded from opposite muscles was calculated to derive the frequency content of cross-muscle neural drive (red trace, middle right). The profile of cross-muscle coherence appears very similar to that observed within each muscle. The brown traces in the top and bottom at the right show a residual coherence representing the within-muscle motor unit coherence that remains after removing any components that can be explained by cross-muscle neural drive. Therefore, the residual represents the frequency content of independent (muscle-specific) neural drive. In the trial depicted, the greatly reduced magnitudes of the brown (residual) coherence traces compared with the red traces suggest that the majority of within-muscle motor unit coherence stems from cross-muscle drive. The brown trace in the middle right represents a similar analysis in which the effects of knee extension force are removed from the cross-muscle motor unit coherence. The residual in this case characterizes the frequency content of any cross-muscle drive that is uncorrelated with total knee extension force. In this trial, cross-muscle neural drive above ∼5 Hz (especially near 20 Hz) appears to be uncorrelated with force, whereas lower frequencies are highly correlated with force.
Motor unit decomposition
EMG signals were decomposed into single motor unit activity using an automatic blind source separation algorithm that has undergone extensive validation (Holobar and Zazula, 2004, 2007; Farina et al., 2008, 2009). The algorithm reconstructs signals as outputs of a convolutive mixing model. In this model, spike trains represent the motor unit activity, whereas the motor unit action potential (MUAP) shapes are treated as mixing coefficients. The model can account for arbitrary differences in MUAP shapes observed from different EMG channels (for review, see Holobar and Farina, 2014). The method is fundamentally different from common template-matching procedures, which are typically used for decomposing multiunit signals recorded from a single spatial location.
Because the decomposition algorithm is automatic, each output spike train must be evaluated for quality before use. Only units whose firing rates were stable over the entire contraction (no pauses >500 ms) were used in additional analysis. Also, motor units were discarded if the coefficient of variation of their interspike intervals was >30%, because this would indicate a high number of erroneously classified or missed action potentials (Holobar et al., 2014). Mean discharge rates were required to fall between 5 and 30 Hz (Enoka and Fuglevand, 2001). Additionally, a signal-based performance metric called pulse/noise ratio (PNR) was used to test the accuracy of the decomposed units. The PNR is an indicator of the mean square error between the true discharge pattern of each identified unit and its estimation, in which units with PNR >30 dB exhibit a sensitivity >90% and a false-alarm rate <2% (Holobar et al., 2014). For the present study, only motor units with a PNR >30 dB were used.
For additional analysis, the activity of each motor unit was expressed as a binary spike train in which each time sample (2048 Hz sampling frequency) was assigned either a 0 or 1, depending on whether the particular time sample marked the beginning of an MUAP. Trials in which fewer than three motor units were decomposed were excluded from additional analysis. This left a total of 80 trials for each force level, spread over nine subjects.
Motor unit coherence analysis
Much of the input to a motor neuron pool is distributed widely, and it can be argued that this “shared” or “common” input is the effective neural drive to muscles (Farina et al., 2014). Because this neural drive entrains the activity of the motor unit population, it can be characterized by examining correlated/synchronized activity between pairs of motor units. For example, simultaneous (within a few milliseconds) firing between two units occurs more often than expected by chance when premotor axons branch onto both motor neurons (Sears and Stagg, 1976). On a longer timescale, motor units show concurrent fluctuations in their firing rates, also termed “common drive” (De Luca et al., 1982). A more complete picture can be obtained by extending correlation procedures into the frequency domain using coherence analysis (Rosenberg et al., 1989). This method provides the most comprehensive description of common input (Myers et al., 2004; Negro and Farina, 2012) in use and is especially popular because different frequencies of neural drive can be attributed to different sources of input, for example, the stretch reflex loop (Erimaki and Christakos, 1999, 2008; Christakos et al., 2006) or the motor cortex (Farmer et al., 1993, 1997; Conway et al., 1995; Salenius et al., 1997; Brown et al., 1998).
In derivation, coherence analysis is a frequency domain extension of Pearson's product moment correlation. The coherence calculated at a given frequency represents the linear correlation between the two signals at that frequency, with a value of 0 representing no correlation and a value of 1 representing perfect correlation. For interpretation, it is important to note that coherence is primarily a measure of phase locking, with signal power being a less important factor. This is ideal for measuring motor unit synchronization because the power spectra of single motor unit spike trains are not themselves very informative, as they tend to be dominated by their mean firing rates and do not faithfully reflect the frequency content of their neural input (Negro and Farina, 2012).
To assess the frequency content of common synaptic input to the motor units within each muscle, we calculated the pooled coherence (Amjad et al., 1997) between all unique pairs of simultaneously active motor unit spike trains. The method essentially concatenates all unique pairs of spike trains into two long trains, which are then subjected to coherence analysis. The mathematical details of this procedure are described below. To characterize unique drive to each muscle, we conducted a novel type of pooled partial coherence analysis. Partial coherence evaluates synchrony between two signals after statistically removing any components that are also synchronous with a third “reference” signal (Halliday et al., 1995, 1999; Rosenberg et al., 1998; Ward et al., 2013). The remaining “residual” coherence profile has the same interpretation as standard coherence. In the present case, the reference signal was the sum of all motor unit spike trains recorded from one muscle, repeated to reach the length of the concatenated motor unit spike trains derived from the other muscle. Using this technique, any activity in the reference muscle that was synchronous with the motor units of the other muscle is removed from their coherence, leaving a pooled residual coherence profile that reflects only the muscle-specific portion of the neural drive. Finally, to understand the extent to which cross-muscle neural drive reflected fluctuations in knee extension force, we calculated the partial motor unit coherence across muscles using force as the reference signal. The residual cross-muscle motor unit coherence in this case represents the cross-muscle drive that is uncorrelated with knee extension force. Figure 1 depicts a graphical representation of the above logic and how each method of coherence analysis relates to a specific type of neural drive. Figure 2 shows an example of motor unit decomposition and subsequent coherence analysis for a single trial.
Figure 1.

General methods. The motor units of the vastus lateralis and vastus medialis muscles are shown here as receiving a mixture of shared (black) and unique (yellow, red) neural command signals. Both sources of input are assumed to be distributed widely and would therefore synchronize/entrain the activities of each targeted motor unit population. In this study, we characterized such synchronous activity among motor units in the frequency domain using coherence analysis. The technique reveals the frequency spectrum of synchronous activity between the spike trains of simultaneously active motor units. When coherence analysis is conducted on pairs of motor units recorded from the same muscle, the resulting spectrum describes the total common input to that muscle. The total input includes contributions from both muscle-specific and shared (cross-muscle) sources of drive. For this reason, the blocks representing within-muscle coherence are colored with stripes representing both the shared and unique sources of input influencing motor unit behavior. When coherence analysis is conducted using motor units recorded from different muscles, the common input to both muscles is revealed. This input does not include muscle-specific components and is therefore represented in the diagram using a single color (black). We then used partial coherence analysis to reveal the unique input to each muscle. The technique of calculating partial coherence involves removing any coherence between two signals that could be explained by a common third signal. Therefore, the resulting residual coherence describes the correlation between two signals that is independent of the third signal. In this study, the method was used to remove any components of within-muscle coherence that could be explained by activity in the other muscle. Therefore, we were able to assess the strength of unique/independent drive to each muscle and determine the relative contribution of cross-muscle drive to the total within-muscle coherence.
Mathematical procedures
Coherence analysis.
As described previously, each signal was first divided into consecutive time segments, 3 s in duration. The FFT was then calculated for each segment using the spectrogram function in MATLAB, specifying that time segments be non-overlapping and weighted by a rectangular window function. For each frequency, the complex values obtained across N time segments were used to derive the auto-spectra and cross-spectra of the signals x and y (xx, yy, and xy, respectively) as follows:
 |
 |
 |
where conj (…) refers to the complex conjugate of Xi or Yi.
The magnitude squared coherence (typically referred to as “coherence”) for each frequency was then calculated as follows:
 |
Each coherence profile was then smoothed in the frequency domain using a three-point (0.5 Hz) running median. To assess the frequency content of the neural drive shared by both muscles, we repeated the same procedure using all combinations of motor unit pairs recorded from different muscles.
Partial coherence analysis.
To calculate partial coherence, we first derived the auto-spectra for the reference signal z as described for x and y above. Then, the cross-spectra of signal z with signal x were calculated as below:
 |
 |
The cross-spectra yz and zy were calculated similarly. From these, the cross-spectra and auto-spectra between x and y accounting for signal z were calculated as follows:
 |
 |
 |
Finally, the residual coherence between x and y after accounting for signal z can was calculated as follows:
 |
In this study, we were interested in removing the effects of shared drive from the total drive to a given muscle. Therefore, the signals x and y represent the concatenated pairs of motor unit spike trains recorded from one muscle, whereas the reference signal was formed from the summation of all individual motor unit spike trains recorded simultaneously from the other muscle. The reference signal, as a composite spike train, will strongly reflect the activity that is common to all units. The reference signal was repeated to reach the length of the concatenated spike trains. In this way, each unique pair of units from a given trial was referenced to the same signal within the pooled partial coherence analysis.
Statistical comparisons
For each coherence profile, a 95% confidence level (CL) can be derived (Carter, 1987; Rosenberg et al., 1989) as follows:
 |
where N is the number of data segments used to calculate the coherence profile. For residual coherence profiles, the N − 1 in the above equation is replaced by N − 2. We then calculated the proportion of total trials showing significant coherence at each frequency. Under the assumption that no true motor unit coherence exists at a given frequency, the use of a 95% CL will result in a false-positive rate of ∼5%. Therefore, a binomial test was used to determine whether the proportion of trials showing significant coherence exceeded the expected error rate. The test provided a conservative evaluation of the relevant frequency content of neural drive within and between muscles.
To compare the strength/frequency content of neural drive between force levels, we first converted the coherence values at each frequency to standard Z-scores as follows:
where N is the number of segments used to calculate coherence (COH), and the bias is derived empirically as the mean COH_zscore calculated between 250 and 500 Hz, because this frequency band should contain no actual coherence (Baker et al., 2003). This conversion was necessary before statistical testing because it sets coherence values on an interval (and ratio) scale and accounts for any differences in the number of units used in each pooled coherence calculation. To test differences in coherence at a given frequency across force levels, a randomization test on medians was used. In this test, the median difference in coherence across conditions was first calculated and then compared against a set of 10,000 median differences that had been derived after randomly shuffling the force level designations of each paired trial (80 pairs in total). By paired trials, we mean that the Nth 10% MVC contraction recorded for a given subject was always compared with the Nth 30% MVC contraction for the same subject. In the randomization test, the sign of their difference was assigned randomly in each of the 10,000 iterations. Shuffling paired trials controlled for any cross-subject or over-time effects that might complicate the statistics. The final p value was calculated directly as the proportion of shuffled median differences exceeding the original in absolute magnitude. This test was ideal for our purposes because it makes no assumptions concerning distribution shapes or the partitioning of variance across subjects and trials. When comparing coherence across force levels, the test was run on every frequency that showed a significant degree of coherence across the population (according to the binomial test) in at least one of the conditions being compared. In this way, we limited analysis to frequencies that were consistently present in the neural drive to the muscles.
Finally, we estimated the relative proportion of total within-muscle motor unit coherence not explainable by shared (cross-muscle) neural drive. To do this, we calculated the total area of significant coherence for each coherence profile and its associated residual coherence profile. The area of significant coherence was the summation, across all frequencies, of COH_zscores >1.65. The ratio of significant coherence area (residual/total) was calculated for each trial and averaged per subject. This analysis yielded a per-subject estimate of the proportion of total common input that was unique to each muscle.
Results
Motor unit decomposition
After exclusion of any trials in which either muscle had fewer than three motor units decomposed for either force level, a total dataset of 80 trials from across nine subjects was available for additional analysis. A total of nine contractions per force level were analyzed from each of the first eight subjects, whereas eight trials were analyzed from subject 9. Subject 10 had too few units decomposed at the 10% MVC level to be included in additional analysis. From the vastus lateralis recordings, the mean ± SD number of motor units decomposed was 7.5 ± 2.3 for 10% MVC trials and 7 ± 3.2 for 30% MVC trials. The mean ± SD firing rates for these units was 8.8 ± 1.0 Hz at 10% MVC and 10.7 ± 1.6 Hz at 30% MVC. From the vastus medialis, an average of 7.7 ± 2.8 units were decomposed at 10% MVC and 7.5 ± 3.5 units at 30% MVC. The mean ± SD firing rates of vastus medialis motor units were 9 ± 0.9 and 10.9 ± 1.6 Hz for 10 and 30% MVC, respectively.
Motor unit coherence within and between muscles
Figure 3, A and B, depicts the percentage of trials that showed significant coherence at each frequency for the vastus lateralis and vastus medials, respectively. Proportions greater than the marked 95% CL indicate that coherence was observed more often than expected by chance. The figures indicate which frequencies were consistently components of the overall drive to each muscle, for each force level. Below the x-axis of each plot are the results of a randomization test comparing the magnitude of coherence between the two force levels. The black bars represent frequencies at which the coherence differed significantly. For convenience of interpretation, the p value for significance in this test was set to 0.01, which allows each bar to represent a 1 Hz bin (five frequency samples). The overall coherence profiles are similar between both muscles, with the main features of neural drive comprising a 1–5 Hz component, an ∼10 Hz component, and an ∼20 Hz component, the latter two occurring only at 30% MVC. Comparing across force levels, differences in coherence occurred at frequencies >5 Hz and were particularly strong in the vastus medialis (both ∼10 and ∼20 Hz components showing strong force dependence).
Figure 3.

Total within-muscle motor unit coherence and muscle-specific motor unit coherence for the vasti muscles. A and B show the proportion of trials (80 total) in which significant within-muscle motor unit coherence was observed for the vastus lateralis and vastus medialis, respectively. The red traces show results for muscle contractions held at 30% MVC, whereas the brown traces show the results for 10% MVC. The dashed horizontal line indicates the highest proportion that could have been observed simply by chance. Below the x-axis of each plot are the results of a randomization test comparing the coherence values observed at 10% MVC with 30% MVC. The black bars indicate frequencies at which a significant difference existed between coherence magnitudes measured across trials at each force level. The significance level has been set to 0.01 to correct for multiple comparisons and thus allow each bar to represent a frequency bin of 1 Hz. C and D represent the same analysis as in A and B but after removing the effects of cross-muscle drive on within-muscle coherence. Therefore, the residuals shown represent the frequency content of muscle-specific neural drive. E and F show the results of a randomization test comparing the magnitude of total within-muscle coherence to the residual (muscle-specific) coherence at 30% MVC (top) and 10% MVC (bottom). Both muscles show similar profiles of total within-muscle coherence, with the primary component of each occurring below 5 Hz but extending farther to include components near 10 and 20 Hz when force increases from 10% MVC to 30% MVC. The magnitude of coherence <5 Hz appeared not to change with force, in contrast to higher-frequency components that did show force dependence. Muscle-specific coherence was weaker, limited primarily to frequencies <5 Hz, and was not highly dependent on force.
Figure 3, C and D, depicts the percentage of trials having significant coherence after statistically removing the common cross-muscle signal from the total within-muscle motor unit coherence. The resulting residual coherence reflects the unique, “muscle-specific” drive to a given muscle. In general, only a 1–5 Hz component of muscle-specific drive appeared to exist for either muscle. A small peak at 18 Hz was present for the vastus medialis (30% MVC), although this was weak in terms of strength, bandwidth, and consistency. There was no difference in muscle-specific drive to the vastus lateralis across force levels, whereas for the vastus medialis, there were some small differences, primarily <3 Hz.
Figure 3, E and F, shows the results of a randomization test comparing the magnitudes of total coherence to residual (muscle-specific) coherence at 30% MVC (top) and 10% MVC (bottom). At 30% MVC, the muscle-specific component was significantly smaller than the total coherence, at nearly every frequency where it existed and in both muscles. The same was true for 10% MVC.
Figure 4 depicts the percentage of trials showing significant cross-muscle motor unit coherence. In this case, residual coherences represent the remaining coherence after subtracting any components that are correlated with force. Figure 4A shows that the cross-muscle coherence contained essentially the same frequency content as within-muscle coherence, again with frequencies above ∼5 Hz showing significant force dependence. Figure 4B shows that the component of cross-muscle drive not correlated with temporal fluctuations in force depended on the overall force level. At 30% MVC, frequencies greater than ∼8 Hz form significant components of the residual coherence, meaning that cross-muscle drive at this force level was not translated faithfully into force. Figure 4C shows a clear reduction in low-frequency cross-muscle coherence after removing any components synchronized with force fluctuations. At 10% MVC, essentially every frequency <6 Hz was reduced, whereas at 30% MVC, all frequencies <10 Hz were reduced. The effects >10 Hz at 30% MVC were less consistent.
Figure 4.
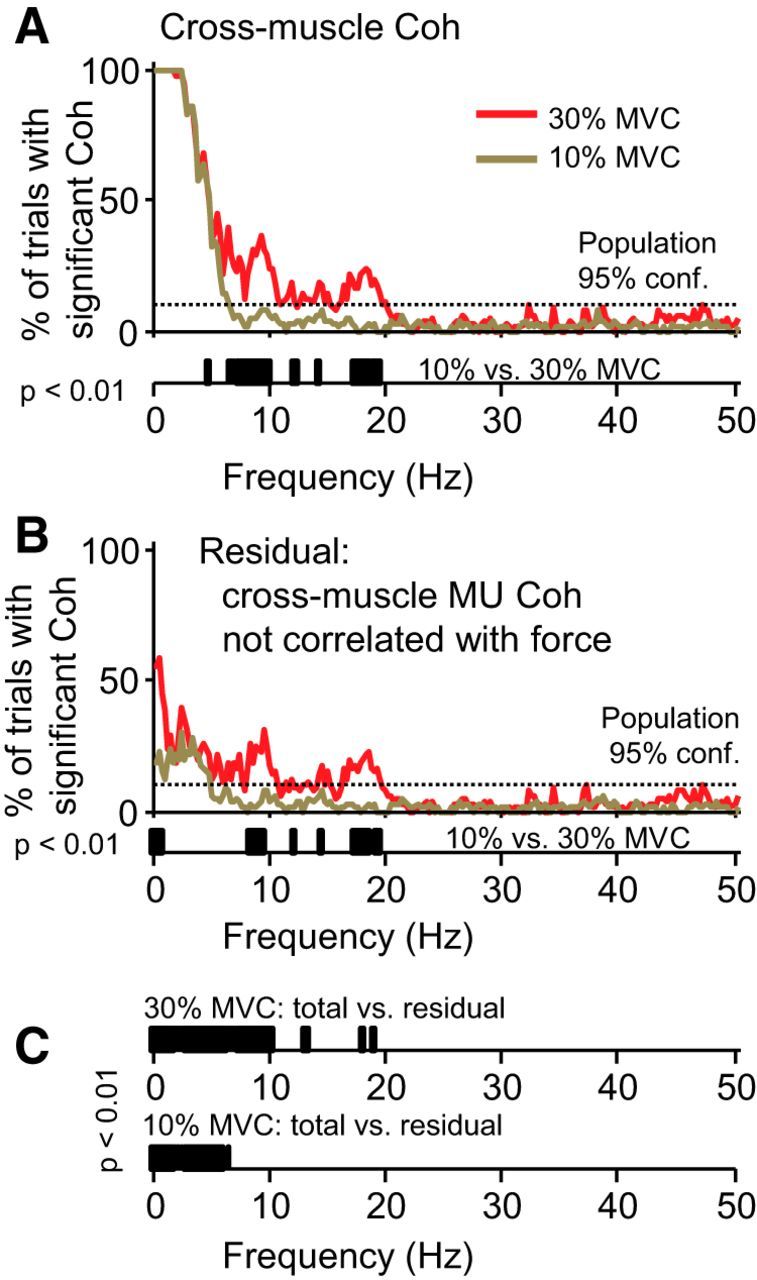
Cross-muscle coherence and its reflection in knee extension force. A shows the proportion of trials having significant cross-muscle motor unit coherence. As before, red traces show results for 30% MVC force, and brown traces show results for 10% MVC. The overall frequency content of cross-muscle drive was very similar to the with-muscle drive, with a primary component from 1–5 Hz that extended to include components near 10 and 20 Hz at 30% MVC. Below the x-axis of A, the results of a randomization test show that neural drive above ∼5 Hz showed clear force dependence, whereas the lowest frequencies (under ∼5 Hz) did not. B shows the same analysis as in A but after removing any components of cross-muscle coherence that were synchronized with knee extension force. The residual coherence represents the cross-muscle drive that does not become translated into force fluctuations. Again, frequencies in the 10–20 Hz range were force dependent, whereas frequency components <5 Hz generally were not. C shows the comparison of total with residual coherence at each force level. The removal of force from cross-muscle coherence greatly reduced its magnitude at nearly every frequency <10 Hz in which coherence was observed consistently. The reduction of higher-frequency (10–20 Hz) coherence was less pronounced.
The contribution of muscle-specific drive to the total (within-muscle) coherence
For each muscle and force level, the area of significant within-muscle motor unit coherence was calculated before and after removing the effects of cross-muscle drive. The residual coherence represents the unique, muscle-specific drive. In Figure 5, the ratio between the residual coherence area and the total within-muscle coherence area is shown per subject for each muscle. The top row shows results for 30% MVC contractions, and the bottom shows results for 10% MVC contractions. The bar heights represent the mean proportion calculated across the trials completed by each subject, and the error bars represent the SD across repeated trials. These error bars show the approximate consistency of this measure across different trials and are not intended for statistical comparisons. The proportion of total motor unit coherence explained by muscle-specific drive was low in all cases, with averages <20% in the majority of subjects.
Figure 5.
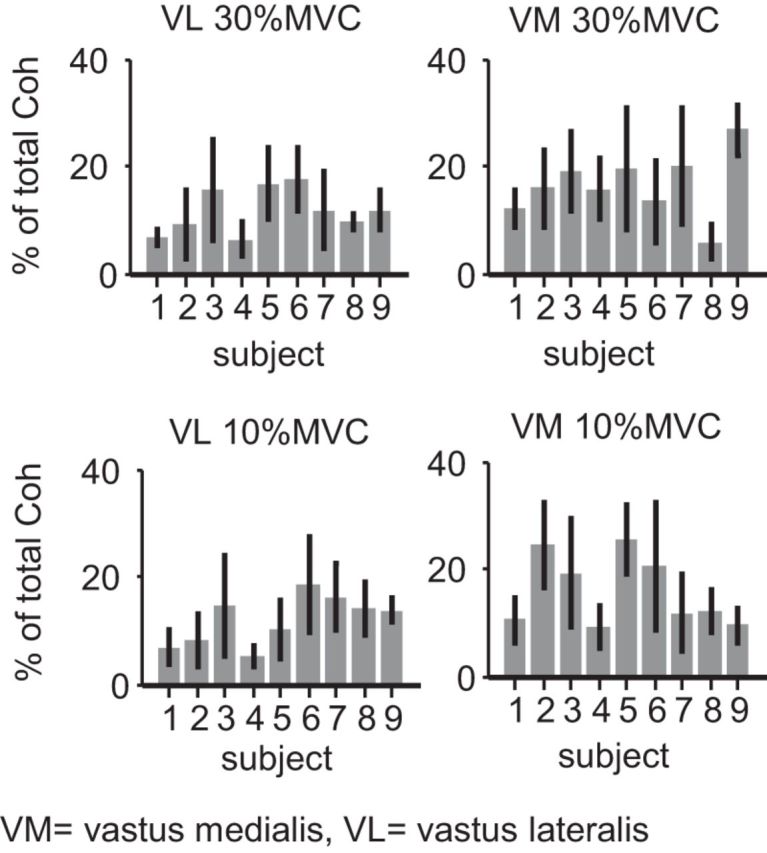
Proportion of total within-muscle coherence represented by muscle-specific drive. The proportion of total within-muscle motor unit coherence explained by independent drive to the vastus lateralis (left) or vastus medialis (right) is shown for each subject. Each bar represents the mean proportion calculated over all trials for a given subject. The error bars show the SD of proportions calculated across trial replicates for each individual and indicate that the measure was relatively stable across trials and recording sessions. At knee extension forces of 30% MVC (top) and 10% MVC (bottom), nearly all trials showed proportions of muscle-specific drive <20%. In other words, >80% of the unit-to-unit coherence measured in either muscle was attributable to cross-muscle drive.
Proportion of cross-muscle coherence unrelated to force
Figure 6 shows the proportion of cross-muscle coherence remaining after removing any components that were synchronous with force fluctuations over time. For both 30% MVC (top) and 10% MVC (bottom), the proportion of coherence unrelated to force was <20% for all subjects. This implies that the cross- muscle neural drive is tightly coupled with the overall force.
Figure 6.
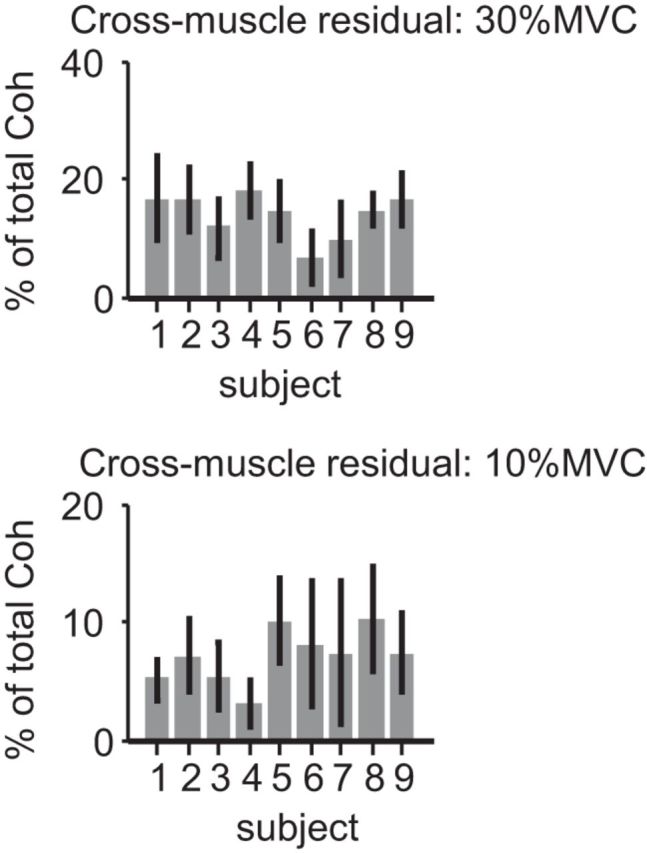
Proportion of cross-muscle coherence unrelated to knee extension force. The figure depicts the per-subject proportion of cross-muscle motor unit coherence that was uncorrelated with force. At both 30% MVC (top) and 10% MVC (bottom), the proportion is very low, suggesting that the majority (>80%) of cross-muscle drive is related to force. As in Figure 5, the error bars show the SD of proportions calculated across trial replicates for each individual.
Discussion
In this study, we have characterized the frequency content and force dependence of both shared (cross-muscle) and independent (muscle-specific) neural drive to the motor units of synergist muscles. Our findings lend direct neurophysiological support to the theory that synergistically activated muscles are controlled primarily by a shared neural drive. Our study also represents the most comprehensive characterization of neural drive to the vasti muscles to date.
The frequency content of neural drive to the vastus lateralis and vastus medialis were very similar. At 10% MVC, the neural drive to either muscle spanned frequencies up to ∼6 Hz, with significant coherence <3 Hz in most trials. In general, motor unit coherence at frequencies <5 Hz reflects common drive, i.e., concurrent fluctuations in motor unit firing rates (De Luca et al., 1982; Myers et al., 2004). Common drive is of unknown physiological origin, but the lowest frequencies (<3 Hz) are unaffected by capsular stroke (Farmer et al., 1993) and are strengthened in cerebellar stroke (Sauvage et al., 2006). Common drive extends to antagonist muscle pairs if they are functionally linked (De Luca and Mambrito, 1987) and may depend on task context (Mochizuki et al., 2006; Laine et al., 2013, 2014) and proprioceptive input (De Luca et al., 2009; Laine et al., 2014).
At 10% MVC, neural drive at frequencies >6 Hz was not strongly reflected in the motor unit coherence of either muscle. When contraction force was increased to 30% MVC, a 6–12 Hz input (peak between 8 and 10 Hz) was observed, along with a new component in the beta band (∼15–35 Hz), with a peak at 20 Hz. The neural drive in the 6–12 Hz frequency range is associated with physiological tremor and may partly stem from oscillations of excitation around the Ia afferent feedback loop (Sutton and Sykes, 1967; Lippold, 1970; Hagbarth and Young, 1979; Young and Hagbarth, 1980; Erimaki and Christakos, 1999, 2008; Christakos et al., 2006). Higher-frequency components in the neural drive (15–35 Hz) are most often considered to be of cortical origin (Farmer et al., 1993, 1997; Conway et al., 1995; Salenius et al., 1997; Brown et al., 1998). If these associations are true for the present scenario, it follows that afferent feedback and cortical drive were only strong enough to evoke significant motor unit coherence at force levels >10% MVC. Of course, lack of significant coherence may not indicate complete absence of neural drive at high frequencies, given the variety of factors that can limit the sensitivity of coherence measures (Negro and Farina, 2012).
The cross-muscle motor unit coherence was nearly identical to the within-muscle motor unit coherence, in terms of both frequency content and force dependence. The ∼10 and ∼20 Hz peaks in motor unit coherence at 30% MVC are particularly interesting, because they suggest that cross-muscle drive contains both Ia feedback and a descending cortical component. Surprisingly, our partial coherence analysis showed that these higher frequencies of coherence exclusively reflect cross-muscle drive, because the unique drive to either muscle contained no significant coherence above ∼6 Hz. It is worth noting that, if cortical drive is essentially a cross-muscle signal, then our findings directly support a core principle of the muscle synergy theory, namely, that cortical commands are of lower dimensionality than the muscles controlled.
We found that force fluctuations <6 Hz were well synchronized with cross-muscle drive. For both force levels, the vast majority (>80%) of cross-muscle motor unit coherence was explainable by fluctuations in force. During visually guided force control, low-frequency fluctuations in force reflect voluntary error corrections and involuntary common firing rate modulation (common drive) among motor units (Sutton and Sykes, 1967; Allum et al., 1978; De Luca et al., 1982; Miall et al., 1993; Slifkin et al., 2000; Squeri et al., 2010). Because of the low-pass filtering effects of muscle tissue and the rest of the leg/leg-fixation system, force fluctuations above ∼5 Hz are extremely small and are negligible in terms of the overall force control (excluding the scenario of pathological tremor). As expected, cross-muscle drive >10 Hz was not well correlated with force fluctuations.
The unique neural drive to each muscle appeared to be limited to the common drive (1–5 Hz) frequency range. In this study, muscle-specific coherence reflects either an actual unique drive to one muscle or a cross-muscle signal that has been obscured in one of the two muscles, for example, as a result of noise. The 1–5 Hz drive to each vasti muscle consistently showed a muscle-specific component. Although relatively weak, its consistency suggests that it does represent a distinct source of 1–5 Hz drive. Regardless of the source, the magnitude of 1–5 Hz coherence was not strongly force dependent. That said, the relation between coherence strength and neural drive strength may be somewhat complex and depends on many factors, including the physical distribution of axonal inputs, as well as the firing rates of the motor units in relation to the frequency of shared input (Negro and Farina, 2012).
We also observed a small component of muscle-specific drive to the vastus medialis at 18 Hz during 30% MVC contractions. The limited bandwidth (1 Hz) and consistency (two more trials than expected by chance) of this input suggest that ∼20 Hz cross-muscle drive was reflected poorly in the vastus lateralis, making it appear unique to the vastus medialis. The vastus lateralis itself did not show any muscle-specific input >6 Hz.
In terms of proportions, we found that the within-muscle coherence attributable to muscle-specific drive was between 5 and 25% of the total within-muscle coherence, regardless of the force level or the muscle recorded from. This ratio was generally consistent across subjects, trials, and force levels. Although the detectable bandwidth of cross-muscle drive was larger at higher force levels, the global degree of within-muscle motor unit coherence attributable to cross-muscle drive was fairly stable. Although increasing force resulted in a larger bandwidth of cross-muscle drive, the acquired high-frequency input had little influence on force, and, as a result, the proportion of coherent activity not correlated with force was found to be larger at 30% MVC than at 10% MVC.
Because our findings support the theory that synergistically activated muscles are controlled primarily by shared neural drive, it is important to further discuss how this result adds to previous literature supporting the notion of muscle synergies. There is ample evidence that synergies, or “motor primitives,” do have a neural origin (for review, see Bizzi and Cheung, 2013). For example, they can be evoked and modified through afferent feedback in spinalized frog preparations (Tresch et al., 1999; Kargo and Giszter 2000a,b), they can be evoked through stimulation of spinal interneurons in frogs (Giszter et al., 1993) and mice (Levine et al., 2014), and they can be recruited by intracortical microstimulation in rhesus monkeys (Graziano et al., 2002; Overduin et al., 2012, 2014). In the frog, spinal interneurons involved in the organization of motor primitives have been characterized extensively (Hart and Giszter, 2010). That said, many questions remain unanswered, especially in the context of voluntary motor control in humans. For one, humans (and some higher primates) have direct cortico-motoneuronal cells that may have evolved specifically to free voluntary behavior from the constraints of spinal motor primitives (Rathelot and Strick, 2009). Of course, these direct cortico-motoneuronal cells coexist with the “old” corticospinal track, in which M1 cells project directly onto the spinal interneurons, which may coordinate muscle activation (Rathelot and Strick, 2009). Regardless of the specific level at which motor primitives may be prepared (spinal or cortical), it is not clear precisely how this signal is delivered to the targeted muscles. For example, multiple muscles could show fixed ratios of activation even if each muscle were to receive its own unique input and receive no shared/common drive. Alternatively, motor neurons of synergist muscles might share a low-frequency common drive originating at the spinal level but not a higher-frequency neural drive originating from the cortex. The precise circuitry of synergy formation is not well understood, and our results suggest that valuable information can be gained by approaching this problem from the motor neuron level.
It will require additional research to fully understand how shared versus muscle-specific drive to synergistically activated muscles changes in relation to task context or disease. For example, it is likely that characterization of synergistic muscle activation may yield important information about plasticity and adaptation in the CNS after injury, for example, stroke (Gizzi et al., 2011). In addition, the theory of coherence and partial coherence contains many variations and extensions that have been described previously (Rosenberg et al., 1989, 1998) and that may be of particular benefit in studying coordination among larger sets of muscles. Importantly, our results provide the first neural support in humans for the assumption that muscles can be controlled primarily through shared neural drive (Tresch and Jarc, 2009; Kutch and Valero-Cuevas, 2012; Bizzi and Cheung, 2013). Overall, our study has expanded the current understanding of vasti muscle activation and has introduced a new approach for investigating neural drive to multi-muscle systems.
Footnotes
This project was funded by European Research Council Advanced Grant DEMOVE (Decoding the Neural Code of Human Movements for a New Generation of Man–Machine Interfaces) under Contract 267888 (D.Far.). E.M.-V. was supported by a PhD scholarship from the University of Potsdam, based on the postgraduate funding regulations of the federal state of Brandenburg, Germany.
The authors declare no competing financial interests.
References
- Allum JH, Dietz V, Freund HJ. Neuronal mechanisms underlying physiological tremor. J Neurophysiol. 1978;41:557–571. doi: 10.1152/jn.1978.41.3.557. [DOI] [PubMed] [Google Scholar]
- Amjad AM, Halliday DM, Rosenberg JR, Conway BA. An extended difference of coherence test for comparing and combining several independent coherence estimates: theory and application to the study of motor units and physiological tremor. J Neurosci Methods. 1997;73:69–79. doi: 10.1016/S0165-0270(96)02214-5. [DOI] [PubMed] [Google Scholar]
- Baker SN, Pinches EM, Lemon RN. Synchronization in monkey motor cortex during a precision grip task. II. Effect of oscillatory activity on corticospinal output. J Neurophysiol. 2003;89:1941–1953. doi: 10.1152/jn.00832.2002. [DOI] [PubMed] [Google Scholar]
- Beck TW, Defreitas JM, Stock MS, Dillon MA. Effects of resistance training on force steadiness and common drive. Muscle Nerve. 2011;43:245–250. doi: 10.1002/mus.21836. [DOI] [PubMed] [Google Scholar]
- Beck TW, Stock MS, Defreitas JM. Effects of fatigue on intermuscular common drive to the quadriceps femoris. Int J Neurosci. 2012;122:574–582. doi: 10.3109/00207454.2012.693997. [DOI] [PubMed] [Google Scholar]
- Bizzi E, Cheung VCK. The neural origin of muscle synergies. Front Comput Neurosci. 2013;7:51. doi: 10.3389/fncom.2013.00051. [DOI] [PMC free article] [PubMed] [Google Scholar]
- Brown P, Salenius S, Rothwell JC, Hari R. Cortical correlate of the piper rhythm in humans. J Neurophysiol. 1998;80:2911–2917. doi: 10.1152/jn.1998.80.6.2911. [DOI] [PubMed] [Google Scholar]
- Carter GC. Coherence and time delay estimation. Proc IEEE. 1987;75:236–255. doi: 10.1109/PROC.1987.13723. [DOI] [Google Scholar]
- Christakos CN, Papadimitriou NA, Erimaki S. Parallel neuronal mechanisms underlying physiological force tremor in steady muscle contractions of humans. J Neurophysiol. 2006;95:53–66. doi: 10.1152/jn.00051.2005. [DOI] [PubMed] [Google Scholar]
- Conway BA, Halliday DM, Farmer SF, Shahani U, Maas P, Weir AI, Rosenberg JR. Synchronization between motor cortex and spinal motoneuronal pool during the performance of a maintained motor task in man. J Physiol. 1995;489:917–924. doi: 10.1113/jphysiol.1995.sp021104. [DOI] [PMC free article] [PubMed] [Google Scholar]
- De Luca CJ, Mambrito B. Voluntary control of motor units in human antagonist muscles: coactivation and reciprocal activation. J Neurophysiol. 1987;58:525–542. doi: 10.1152/jn.1987.58.3.525. [DOI] [PubMed] [Google Scholar]
- De Luca CJ, LeFever RS, McCue MP, Xenakis AP. Control scheme governing concurrently active human motor units during voluntary contractions. J Physiol. 1982;329:129–142. doi: 10.1113/jphysiol.1982.sp014294. [DOI] [PMC free article] [PubMed] [Google Scholar]
- De Luca CJ, Gonzalez-Cueto JA, Bonato P, Adam A. Motor unit recruitment and proprioceptive feedback decrease the common drive. J Neurophysiol. 2009;101:1620–1628. doi: 10.1152/jn.90245.2008. [DOI] [PMC free article] [PubMed] [Google Scholar]
- Enoka RM, Fuglevand AJ. Motor unit physiology: some unresolved issues. Muscle Nerve. 2001;24:4–17. doi: 10.1002/1097-4598(200101)24:1<4::AID-MUS13>3.0.CO;2-F. [DOI] [PubMed] [Google Scholar]
- Erimaki S, Christakos CN. Occurrence of widespread motor-unit firing correlations in muscle contractions: their role in the generation of tremor and time-varying voluntary force. J Neurophysiol. 1999;82:2839–2846. doi: 10.1152/jn.1999.82.5.2839. [DOI] [PubMed] [Google Scholar]
- Erimaki S, Christakos CN. Coherent motor unit rhythms in the 6–10 Hz range during time-varying voluntary muscle contractions: neural mechanism and relation to rhythmical motor control. J Neurophysiol. 2008;99:473–483. doi: 10.1152/jn.00341.2007. [DOI] [PubMed] [Google Scholar]
- Farina D, Negro F. Common synaptic input to motor neurons, motor unit synchronization, and force control. Exerc Sport Sci Rev. 2015;43:23–33. doi: 10.1249/JES.0000000000000032. [DOI] [PubMed] [Google Scholar]
- Farina D, Muhammad W, Fortunato E, Meste O, Merletti R, Rix H. Estimation of single motor unit conduction velocity from surface electromyogram signals detected with linear electrode arrays. Med Biol Eng Comput. 2001;39:225–236. doi: 10.1007/BF02344807. [DOI] [PubMed] [Google Scholar]
- Farina D, Negro F, Gazzoni M, Enoka RM. Detecting the unique representation of motor-unit action potentials in the surface electromyogram. J Neurophysiol. 2008;100:1223–1233. doi: 10.1152/jn.90219.2008. [DOI] [PMC free article] [PubMed] [Google Scholar]
- Farina D, Holobar A, Gazzoni M, Zazula D, Merletti R, Enoka RM. Adjustments differ among low-threshold motor units during intermittent, isometric contractions. J Neurophysiol. 2009;101:350–359. doi: 10.1152/jn.90968.2008. [DOI] [PMC free article] [PubMed] [Google Scholar]
- Farina D, Negro F, Dideriksen JL. The effective neural drive to muscles is the common synaptic input to motor neurons. J Physiol. 2014;592:3427–3441. doi: 10.1113/jphysiol.2014.273581. [DOI] [PMC free article] [PubMed] [Google Scholar]
- Farmer SF, Bremner FD, Halliday DM, Rosenberg JR, Stephens JA. The frequency content of common synaptic inputs to motoneurones studied during voluntary isometric contraction in man. J Physiol. 1993;470:127–155. doi: 10.1113/jphysiol.1993.sp019851. [DOI] [PMC free article] [PubMed] [Google Scholar]
- Farmer SF, Halliday DM, Conway BA, Stephens JA, Rosenberg JR. A review of recent applications of cross-correlation methodologies to human motor unit recording. J Neurosci Methods. 1997;74:175–187. doi: 10.1016/S0165-0270(97)02248-6. [DOI] [PubMed] [Google Scholar]
- Giszter SF, Mussa-Ivaldi FA, Bizzi E. Convergent force fields organized in the frog's spinal cord. J Neurosci. 1993;13:467–491. doi: 10.1523/JNEUROSCI.13-02-00467.1993. [DOI] [PMC free article] [PubMed] [Google Scholar]
- Gizzi L, Nielsen JF, Felici F, Ivanenko YP, Farina D. Impulses of activation but not motor modules are preserved in the locomotion of subacute stroke patients. J Neurophysiol. 2011;106:202–210. doi: 10.1152/jn.00727.2010. [DOI] [PubMed] [Google Scholar]
- Graziano MSA, Taylor CSR, Moore T. Complex movements evoked by microstimulation of precentral cortex. Neuron. 2002;34:841–851. doi: 10.1016/S0896-6273(02)00698-0. [DOI] [PubMed] [Google Scholar]
- Hagbarth KE, Young RR. Participation of the stretch reflex in human physiological tremor. Brain. 1979;102:509–526. doi: 10.1093/brain/102.3.509. [DOI] [PubMed] [Google Scholar]
- Halliday DM, Rosenberg JR, Amjad AM, Breeze P, Conway BA, Farmer SF. A framework for the analysis of mixed time series/point process data—theory and application to the study of physiological tremor, single motor unit discharges and electromyograms. Prog Biophys Mol Biol. 1995;64:237–278. doi: 10.1016/S0079-6107(96)00009-0. [DOI] [PubMed] [Google Scholar]
- Halliday DM, Conway BA, Farmer SF, Rosenberg JR. Load-independent contributions from motor-unit synchronization to human physiological tremor. J Neurophysiol. 1999;82:664–675. doi: 10.1152/jn.1999.82.2.664. [DOI] [PubMed] [Google Scholar]
- Hart CB, Giszter SF. A neural basis for motor primitives in the spinal cord. J Neurosci. 2010;30:1322–1336. doi: 10.1523/JNEUROSCI.5894-08.2010. [DOI] [PMC free article] [PubMed] [Google Scholar]
- Holobar A, Farina D. Blind source identification from the multichannel surface electromyogram. Physiol Meas. 2014;35:R143–R165. doi: 10.1088/0967-3334/35/7/R143. [DOI] [PubMed] [Google Scholar]
- Holobar A, Zazula D. Correlation-based decomposition of surface electromyograms at low contraction forces. Med Biol Eng Comput. 2004;42:487–495. doi: 10.1007/BF02350989. [DOI] [PubMed] [Google Scholar]
- Holobar A, Zazula D. Multichannel blind source separation using convolution kernel compensation. IEEE Trans Sig Proc. 2007;55:4487–4496. doi: 10.1109/TSP.2007.896108. [DOI] [Google Scholar]
- Holobar A, Minetto MA, Farina D. Accurate identification of motor unit discharge patterns from high-density surface EMG and validation with a novel signal-based performance metric. J Neural Eng. 2014;11 doi: 10.1088/1741-2560/11/1/016008. 016008. [DOI] [PubMed] [Google Scholar]
- Kargo WJ, Giszter SF. Rapid corrections of aimed movements by combination of force-field primitives. J Neurosci. 2000a;20:409–426. doi: 10.1523/JNEUROSCI.20-01-00409.2000. [DOI] [PMC free article] [PubMed] [Google Scholar]
- Kargo WJ, Giszter SF. Afferent roles in hindlimb wiping reflex: free limb kinematics and motor patterns. J Neurophysiol. 2000b;83:1480–1501. doi: 10.1152/jn.2000.83.3.1480. [DOI] [PubMed] [Google Scholar]
- Kutch JJ, Valero-Cuevas FJ. Challenges and new approaches to proving the existence of muscle synergies of neural origin. PLoS Comput Biol. 2012;8:e1002434. doi: 10.1371/journal.pcbi.1002434. [DOI] [PMC free article] [PubMed] [Google Scholar]
- Laine CM, Negro F, Farina D. Neural correlates of task-related changes in physiological tremor. J Neurophysiol. 2013;110:170–176. doi: 10.1152/jn.00041.2013. [DOI] [PubMed] [Google Scholar]
- Laine CM, Yavuz şU, Farina D. Task-related changes in sensorimotor integration influence the common synaptic input to motor neurones. Acta Physiol (Oxf) 2014;211:229–239. doi: 10.1111/apha.12255. [DOI] [PubMed] [Google Scholar]
- Levine AJ, Hinckley CA, Hilde KL, Driscoll SP, Poon TH, Montgomery JM, Pfaff SL. Identification of a cellular node for motor control pathways. Nat Neurosci. 2014;17:586–593. doi: 10.1038/nn.3675. [DOI] [PMC free article] [PubMed] [Google Scholar]
- Lippold OCJ. Oscillation in the stretch reflex arc and the origin of the rhythmical, 8–12 c/s component of physiological tremor. J Physiol. 1970;206:359–382. doi: 10.1113/jphysiol.1970.sp009018. [DOI] [PMC free article] [PubMed] [Google Scholar]
- Masuda T, Miyano H, Sadoyama T. The position of innervation zones in the biceps brachii investigated by surface electromyography. IEEE Trans Biomed Eng. 1985;32:36–42. doi: 10.1109/TBME.1985.325614. [DOI] [PubMed] [Google Scholar]
- Mellor R, Hodges P. Motor unit synchronization between medial and lateral vasti muscles. Clin Neurophysiol. 2005;116:1585–1595. doi: 10.1016/j.clinph.2005.04.004. [DOI] [PubMed] [Google Scholar]
- Miall RC, Weir DJ, Stein JF. Intermittency in human manual tracking tasks. J Mot Behav. 1993;25:53–63. doi: 10.1080/00222895.1993.9941639. [DOI] [PubMed] [Google Scholar]
- Mochizuki G, Semmler JG, Ivanova TD, Garland SJ. Low-frequency common modulation of soleus motor unit discharge is enhanced during postural control in humans. Exp Brain Res. 2006;175:584–595. doi: 10.1007/s00221-006-0575-7. [DOI] [PubMed] [Google Scholar]
- Myers LJ, Erim Z, Lowery MM. Time and frequency domain methods for quantifying common modulation of motor unit firing patterns. J Neuroeng Rehabil. 2004;1:2. doi: 10.1186/1743-0003-1-2. [DOI] [PMC free article] [PubMed] [Google Scholar]
- Negro F, Farina D. Factors influencing the estimates of correlation between motor unit activities in humans. PLoS One. 2012;7:e44894. doi: 10.1371/journal.pone.0044894. [DOI] [PMC free article] [PubMed] [Google Scholar]
- Overduin SA, d'Avella A, Carmena JM, Bizzi E. Microstimulation activates a handful of muscle synergies. Neuron. 2012;76:1071–1077. doi: 10.1016/j.neuron.2012.10.018. [DOI] [PMC free article] [PubMed] [Google Scholar]
- Overduin SA, d'Avella A, Carmena JM, Bizzi E. Muscle synergies evoked by microstimulation are preferentially encoded during behavior. Front Comput Neurosci. 2014;8:20. doi: 10.3389/fncom.2014.00020. [DOI] [PMC free article] [PubMed] [Google Scholar]
- Rathelot JA, Strick PL. Subdivisions of primary motor cortex based on cortico-motoneuronal cells. Proc Natl Acad Sci U S A. 2009;106:918–923. doi: 10.1073/pnas.0808362106. [DOI] [PMC free article] [PubMed] [Google Scholar]
- Rosenberg JR, Amjad AM, Breeze P, Brillinger DR, Halliday DM. The Fourier approach to the identification of functional coupling between neuronal spike trains. Prog Biophys Mol Biol. 1989;53:1–31. doi: 10.1016/0079-6107(89)90004-7. [DOI] [PubMed] [Google Scholar]
- Rosenberg JR, Halliday DM, Breeze P, Conway BA. Identification of patterns of neuronal connectivity—partial spectra, partial coherence, and neuronal interactions. J Neurosci Methods. 1998;83:57–72. doi: 10.1016/S0165-0270(98)00061-2. [DOI] [PubMed] [Google Scholar]
- Salenius S, Portin K, Kajola M, Salmelin R, Hari R. Cortical control of human motoneuron firing during isometric contraction. J Neurophysiol. 1997;77:3401–3405. doi: 10.1152/jn.1997.77.6.3401. [DOI] [PubMed] [Google Scholar]
- Sauvage C, Manto M, Adam A, Roark R, Jissendi P, De Luca CJ. Ordered motor-unit firing behavior in acute cerebellar stroke. J Neurophysiol. 2006;96:2769–2774. doi: 10.1152/jn.00268.2006. [DOI] [PubMed] [Google Scholar]
- Sears TA, Stagg D. Short-term synchronization of intercostal motoneurone activity. J Physiol. 1976;263:357–381. doi: 10.1113/jphysiol.1976.sp011635. [DOI] [PMC free article] [PubMed] [Google Scholar]
- Slifkin AB, Vaillancourt DE, Newell KM. Intermittency in the control of continuous force production. J Neurophysiol. 2000;84:1708–1718. doi: 10.1152/jn.2000.84.4.1708. [DOI] [PubMed] [Google Scholar]
- Squeri V, Masia L, Casadio M, Morasso P, Vergaro E. Force-field compensation in a manual tracking task. PLoS One. 2010;5:e11189. doi: 10.1371/journal.pone.0011189. [DOI] [PMC free article] [PubMed] [Google Scholar]
- Sutton GG, Sykes K. The effect of withdrawal of visual presentation of errors upon the frequency spectrum of tremor in a manual task. J Physiol. 1967;190:281–293. doi: 10.1113/jphysiol.1967.sp008208. [DOI] [PMC free article] [PubMed] [Google Scholar]
- Tresch MC, Jarc A. The case for and against muscle synergies. Curr Opin Neurobiol. 2009;19:601–607. doi: 10.1016/j.conb.2009.09.002. [DOI] [PMC free article] [PubMed] [Google Scholar]
- Tresch MC, Saltiel P, Bizzi E. The construction of movement by the spinal cord. Nat Neurosci. 1999;2:162–167. doi: 10.1038/5721. [DOI] [PubMed] [Google Scholar]
- Ward NJ, Farmer SF, Berthouze L, Halliday DM. Rectification of EMG in low force contractions improves detection of motor unit coherence in the beta-frequency band. J Neurophysiol. 2013;110:1744–1750. doi: 10.1152/jn.00296.2013. [DOI] [PMC free article] [PubMed] [Google Scholar]
- Young RR, Hagbarth KE. Physiological tremor enhanced by manoeuvres affecting the segmental stretch reflex. J Neurol Neurosurg Psychiatry. 1980;43:248–256. doi: 10.1136/jnnp.43.3.248. [DOI] [PMC free article] [PubMed] [Google Scholar]