

Abstract
The distribution of mitochondria within mature, differentiated neurons is clearly adapted to their regional physiological needs and can be perturbed under various pathological conditions, but the function of mitochondria in developing neurons has been less well studied. We have studied mitochondrial distribution within developing mouse cerebellar Purkinje cells and have found that active delivery of mitochondria into their dendrites is a prerequisite for proper dendritic outgrowth. Even when mitochondria in the Purkinje cell bodies are functioning normally, interrupting the transport of mitochondria into their dendrites severely disturbs dendritic growth. Additionally, we find that the growth of atrophic dendrites lacking mitochondria can be rescued by activating ATP-phosphocreatine exchange mediated by creatine kinase (CK). Conversely, inhibiting cytosolic CKs decreases dendritic ATP levels and also disrupts dendrite development. Mechanistically, this energy depletion appears to perturb normal actin dynamics and enhance the aggregation of cofilin within growing dendrites, reminiscent of what occurs in neurons overexpressing the dephosphorylated form of cofilin. These results suggest that local ATP synthesis by dendritic mitochondria and ATP-phosphocreatine exchange act synergistically to sustain the cytoskeletal dynamics necessary for dendritic development.
Keywords: actin, ATP homeostasis, creatine kinase, dendrite, mitochondria, Purkinje cell
Introduction
The highly branched dendrites of vertebrate CNS neurons possess huge volumes and surface areas, compared with their cell bodies. These giant expansions arise during neural development, as dendrites grow and arborize extensively (Ulfhake and Kellerth, 1981). Clearly, such a dramatic form of growth and differentiation must require robust and specific mechanisms for transporting organelles and proteins into growing dendrites, and for maintaining proper homeostatic control of their intracellular environment during growth (Ramírez and Couve, 2011; Ehlers, 2013).
Mitochondria produce the majority of cellular energy, in the form of ATP, via aerobic metabolism. They also sequester cytosolic calcium and thereby regulate the calcium dynamics that control neuronal signaling and synaptic strength. Neuronal mitochondria change their shape dynamically by repeated fission and fusion events, and also undergo long-range, bidirectional transport along axons and dendrites (Saxton and Hollenback, 2012; Sheng and Cai, 2012). Additionally, mitochondria are known to be strategically enriched at certain regions that have high activity and high energy demands, including synapses, nodes of Ranvier, and growth cones, by a mechanism involving calcium-binding protein Miro and microtubule motor-adaptor proteins TRAK1/2 (TRAK2 is also termed Grif-1; Guo et al., 2005; Hollenbeck and Saxton, 2005; Saotome et al., 2008; Macaskill et al., 2009a; Wang and Schwarz, 2009; Zhang et al., 2010). Dysfunction of mitochondria is thought to contribute directly to the pathogenesis of certain neurodegenerative diseases (Chen and Chan, 2009; McInnes, 2013). It has also been shown that proper targeting and anchoring of mitochondria is critical for outgrowth and branching of axons (Ruthel and Hollenbeck, 2003; Courchet et al., 2013; Tao et al., 2014). In contrast, the significance of mitochondrial localization in dendrites is controversial. Mistargeting of mitochondria by manipulating their fusion/fission dynamics has been shown to inhibit dendrite morphogenesis and dendritic spine formation (Li et al., 2004; Chen et al., 2007; Ishihara et al., 2009). However, disturbance of this fusion/fission balance inevitably alters mitochondrial shape and metabolic activity, so it has been difficult to determine exactly how local mitochondrial function actually affects dendrite development. Indeed, a recent report has indicated that depletion of dendritic mitochondria by excess fusion enhances proximal dendrite formation in cortical neurons (Kimura and Murakami, 2014). The issue of what downstream mechanism(s) are regulated by local mitochondria also remains obscure. It has been reported that calcium-buffering activity of mitochondria is critically involved in regulating dendritic development (Lohmann et al., 2002; Dickey and Strack, 2011).
With these issues in mind, here we have reinvestigated the function of dendritic mitochondria in developing Purkinje cells. The complex dendritic arbors of Purkinje cells are known to be particularly sensitive to mitochondrial dysfunction during neurodegeneration (Girard et al., 2012). We show that local ATP synthesis by dendritic mitochondria, at least when it is supported by the CK/PCr system but not by glycolysis, is required to maintain the ATP levels that dendrites need for their continuous outgrowth, both in vitro and in vivo. Additionally, our results indicate that actin turnover appears to be critically dependent on proper maintenance of this local ATP supply during dendritic outgrowth.
Materials and Methods
Animals.
Pregnant ICR mice and pups of either sex (Nihon-SLC) were used in this study. All experiments involving mice were handled in agreement with guidelines of the Animal Experiment Committee of Kyoto University.
Reagents.
Commercial sources for reagents used for supplemental experiments were as follows: creatine and cyclocreatine (Sigma-Aldrich), 1-fluoro-2,4-dinitrobenzene (FDNB) and 2-deoxy-d-glucose (2-DG; Sigma-Aldrich), sodium azide (Nacalai Tesque), BAPTA-AM (Calbiochem), dantrolene (Sigma-Aldrich), 2-aminoethoxydiphenyl borate (2-APB; Sigma-Aldrich), nifedipine (Calbiochem), ω-agatoxin-IVA (Calbiochem), ω-conotoxin-GVIA (Peptide Institute), mibefradil (Sigma-Aldrich), and 488-phalloidin (Invitrogen).
Plasmids.
pAAV-CAG-Mito-EGFP/DsRed was created by cloning of mitochondria-targeting sequence tagged with EGFP or DsRed into pAAV-CAG vector. pAAV-CAG-tdTomato and pAAV-CAG-EGFP were created as previously described (Kaneko et al., 2011). pAAV-EGFP-Rab5a and pAAV-myc-Hrs were created by insertion of Rab5a cDNA and Hrs cDNA cloned from a mouse brain cDNA library into pAAV-CAG vector. EGFP and myc were inserted at the N terminus of respective cDNAs. ATeam1.03 (gifted from H. Imamura; Imamura et al., 2009) was inserted into pAAV-CAG vector. GFP-actin and Golgi-GFP sequences were derived from pAcGFP1-Actin and pAcGFP1-GFP-Golgi (Clontech), respectively. For making pAAV-CAG-T20-GFP-GM130Cterm, Tom20 cDNA (1–47aa), EGFP cDNA, and GM130Cterm cDNA (900–999aa) were amplified and inserted into pAAV-CAG vector. The EGFP sequence of T20-GFP-GM130Cterm was replaced with mCherry derived from pmCherry-N1 (Clontech), myc-tag, or ECFP sequences to make respective variants. For making pAAV-CAG-PEX-EGFP-GM130Cterm, The Tom20 sequence was replaced with the N-terminal domain of Pex3 cDNA (1–42aa). pAAV-CAG-Lifeact-EGFP was created by insertion of Lifeact sequence (a short 17 aa peptide derived from yeast Abp140p) tagged with EGFP. pAAV-myc-TRAK2ΔN was created by insertion of myc-tagged kinesin-binding domain depletion mutant of TRAK2 (476–913aa:, MacAskill et al., 2009b). The myc tag was replaced by ECFP to create pAAV-CAG-ECFP-Trak2ΔN. The full-length cofilin cDNA was amplified from a human cDNA library and fused with mCherry-tag. Cofilin(S3A) and Cofilin(S3E) with a point mutation in third Ser to Ala or Glu were generated by PCR. CK-B and CK-M cDNAs were amplified from a mouse brain cDNA library and mutagenized by the QuikChange Site-Directed Mutagenesis Kit (Stratagene) to generate CK-BR and CK-MR cDNA, which contain three silent mutations introduced in the respective shRNA target sequence. The shRNA-resistant mutant cDNAs were fused with mCherry-tag and inserted into pAAV-CAG vector. CK-B shRNA (5′-GAGAGTTACGACGTATTCAAG) and CK-M shRNA (5′-GAGTTCAAGGGCAAGTACTAC) target sequences were designed by using Web-based software siDirect. The DNA oligonucleotides containing the shRNA target sequence, a 7 nucleotide loop region (tgtgctt), and the shRNA antisense sequence were ligated and cloned into pAAV-hH1 modified to express EGFP or tdTomato under a CAG promoter. pAAV-hH1 expressing a scrambled shRNA (5′-GACTCGCTAGAGAACGTAGTA) was used as a negative control.
Adeno-associated virus preparation and primary neuron cultures.
Adeno-associated viruses (AAVs; 109–1010 plaque-forming units) were made by using the AAV Purification ViraKit (Virapur) as described previously (Kaneko et al., 2011). Primary culture of Purkinje cells was performed as previously described (Fujishima et al., 2012). Purified AAVs were added into the medium at 0 DIV. For expression of Cofilin(WT), virus was added into the medium at 3 DIV. For primary cultures of hippocampal neurons, P0 mouse hippocampi were dissected and dissociated in plating medium [MEM supplemented with 10% horse serum (Invitrogen), 1 mm sodium pyruvate, 0.6% d-glucose, and 1% penicillin streptomycin] and plated on poly-d-lysine-coated coverslips at a density of 1.6 × 10⁵ cells/cm2. Three hours later, the medium was replaced by maintenance medium [Neurobasal (Invitrogen) supplemented with 0.5 mm l-glutamine (σ), B-27 supplement (Invitrogen), and 1% penicillin streptomycin]. Neurons were cultured at 37°C in 5% CO2. Neurons were transfected with plasmids at 3 DIV by using Lipofectamine 2000 (Invitrogen).
Immunofluorescence.
Detailed methods for immunostaining and confocal analyses of labeled Purkinje cells were described previously (Kaneko et al., 2011). Primary and secondary antibodies used for immunofluorescence were as follows: rabbit anti-DsRed (Clontech); mouse anti-Calbindin D28K (Swant); rabbit anti-myc-tag; chick anti-GFP (Millipore); goat anti-GABAAR β2 (N-19; Santa Cruz Biotechnology); goat anti-CK-B (N-20; Santa Cruz Biotechnology); mouse anti-CK-M (B-1; Santa Cruz Biotechnology); and Alexa 488-, Alexa 568-, or Alexa 647-conjugated anti-rabbit, anti-mouse, anti-goat, or anti-chick IgG (Invitrogen).
Image acquisition and analysis.
Confocal images were acquired using confocal microscopy (FV1000; Olympus) with a 40× or 100× objective (NA 0.95 or 1.40, respectively). Z-stack images were flattened into a single image by using ImageJ (NIH). For morphometric analysis, dendrites were traced by using Neurolucida software (MBF Bioscience). The area covered by dendrites was quantified by using ImageJ. For quantification of dendrite mito content (ratio of mitochondrial area to dendrite area), acquired images were binarized and area filled with Mito-EGFP/DsRed signals and volume markers were quantified by using ImageJ.
Live-cell imaging.
For long-term time-lapse imaging of developing dendrites, labeled Purkinje cells were observed by an incubator microscopy (LCV100; Olympus) with a 20× objective (NA 0.7; Olympus) at 3 h intervals for 3 d. For visualization of mitochondria, cultured Purkinje cells infected with Mito-EGFP and tdTomato were imaged by using confocal microscopy (IX81; Olympus) with a 100× objective (NA 1.35). Transport of mitochondria in dendrites was observed at 5 s intervals after the Mito-EGFP signals in a dendritic segment were photobleached for 10 s with 488 nm laser. Speed of motile mitochondria was quantified by using the manual tracing plugin of ImageJ.
For ATP imaging, Purkinje cells expressing ATeam were excited by a 458 laser and detected by two emission filters (475–520 nm for CFP and 515–615 nm for YFP) with 60× objective (NA 1.40; Olympus). The YFP/CFP ratio was calculated by FV10-ASW (Olympus). Acquired z-stack images were flattened into a single image using a maximum projection. Shot noise was reduced using a median filter. For comparison of the ATP level along dendrites, the YFP/CFP ratio along a 1 pixel wide line near the midline of primary dendrites was scanned from the point 10 μm inside the contour limit of the soma. The values were normalized to the YFP/CFP ratio at the soma. For the measurement of relative ATP levels in distal dendrites, the mean YFP/CFP ratio in distal-most 10 μm long dendritic areas of 1 pixel width was normalized to the averaged YFP/CFP ratio in the soma. For quantification of time-dependent changes in ATP levels after drug treatments, the YFP/CFP ratio in dendritic areas at a point 10 μm away from the soma was measured in time-lapse image series and analyzed using ImageJ.
Fluorescence recovery after photobleaching (FRAP) analysis was performed by using confocal microscopy (IX81; Olympus) with a 60× objective (NA 1.40). Purkinje cells were infected with GFP-actin and subjected to FRAP analysis at 10 DIV. The peripheral actin networks in distal dendritic areas were bleached for 1 s with 488 nm laser. The recovery of GFP-actin was observed at 2 s intervals for 2 min. Recovery curves were calculated by using ImageJ and Excel.
For calcium imaging in Purkinje cells, cells were infected with virus carrying GCaMP3 and imaged at 10 DIV by using confocal microscopy (IX81; Olympus). For creating pAAV-CAG-GCaMP3, GCaMP3 cDNA derived from pCAG-play-GCaMP3 (gifted from Y. Tagawa) was amplified and inserted into pAAV-CAG vector. Cells were treated with 10 μm DHPG (Tocris Bioscience) before the observation. Infected Purkinje cells were excited by 488 laser and calcium spikes were observed at 1 s intervals for 2 min. The percentage change of GCaMP3 fluorescence (ΔF/F0) was quantified by using Excel.
AAV injection and in utero electroporation.
AAV-Mito-EGFP and AAV-tdTomato were injected into the molecular layer of the cerebellum in P0 mice and analyzed at P14 as described previously (Kaneko et al., 2011). In utero electroporation of plasmids was performed as described previously (Nishiyama et al., 2012). Briefly, pregnant mice on day 12.5 of gestation were anesthetized by an intra-abdominal injection of somnopentyl (Kyoritsu). The plasmid DNA solution (1 μg/μl) purified using the Qiagen Plasmid Maxi Kit was injected by using an aspirator tube (Drummond) into the fourth ventricle of embryos. The positive electrode (CUY650P3; Nepa Gene) was placed on the anterior end of the fourth ventricle through the uterus. Five current pulses (amplitude, 33 V; duration, 30 ms; intervals, 970 ms) were delivered with a square-wave electroporation generator (CUY21; Nepa Gene).
Western blotting.
HEK293T cells were transfected with shRNA constructs together with mDsRed-CK-B or mDsRed-CK-M. Twenty-four hours after the transfection, cells were lysed, electrophoresed, and blotted onto a nitrocellulose membrane (GE Healthcare). The membrane was blocked in PBST (0.2% Tween in PBS) containing 2% skim milk for 1 h and probed with primary and secondary antibodies either 1 h at room temperature (RT) or overnight at 4°C. HRP-labeled probes were detected by using ImmPACT DAB (Vector Laboratories). Antibodies used in this experiment were as follows: rabbit anti-DsRed (Clontech) and mouse anti-β-actin (Sigma) for primary antibodies and mouse anti-HRP (Millipore) and rabbit anti-HRP (Invitrogen) for secondary antibodies.
Mitochondrial membrane potential.
Measurement of mitochondrial membrane potential (ΔΨm) was performed as previously described (Chazotte, 2011). Briefly, HEK293T cells cultured in DMEM containing 10% FBS (Invitrogen) were transfected with ECFP, ECFP-TRAK2ΔN, or T20-ECFP-GM130Cterm by Lipofectamine 2000 (Invitrogen). Cells were treated with the labeling medium containing 600 nm TMRE (Invitrogen) for 20 min at 37°C and then with a new medium containing 150 nm TMRE for dye equilibration. Cells were excited by a 515 nm laser and detected at 530–630 nm. TMRE fluorescence in mitochondrial regions, relative to that in cytoplasmic regions, was averaged in each cell. Image analysis was processed by ImageJ and Excel.
Electron microscopy.
HEK293T cells expressing EGFP or T20-GFP-GM130Cterm were cultured on Aclar coverslips (Nisshin EM) and chemically fixed with 2% glutaraldehyde in NaHCa buffer (100 mm NaCl and 30 mm HEPES buffer, pH 7.4, with 2 mm CaCl2 at RT, for 2–24 h). Then they were postfixed with 0.25% OsO4 and 0.25% K4Fe(CN)6 mixed together in cacodylate buffer, pH 7 (100 mm, with 2 mm CaCl2 at RT for 30 min), and finally poststained by brief treatment with 1% tannic acid in the same cacodylate buffer, followed immediately by 1% uranyl acetate in 50 mm acetate buffer, pH 5.2. Thereafter, they were dehydrated in a graded series of ethanols, passed briefly through propylene oxide, and embedded in Araldite 502 epoxy resin (Polysciences). After polymerization at 65°C for 2 d, 70 nm thin sections were cut with a diamond knife in an ultramicrotome (Leica FC6), mounted on Formvar carbon-coated EM grids, stained for 5 min with Reynolds lead citrate, and finally observed at 80 KV with a conventional TEM (JEOL JEM1400).
Statistical analysis.
Data were analyzed by Student's t test by Excel for single comparisons and by ANOVA with Tukey's HSD post hoc analysis by R, free statistical software for multiple comparisons.
Results
Rapid transport and distribution of mitochondria in growing dendrites of the cerebellar Purkinje cell
To analyze mitochondrial distribution in growing dendrites, we infected developing Purkinje cells with the AAV vector carrying Mito-EGFP (AAV-CAG-Mito-EGFP; EGFP fused to mitochondria-targeting sequence of cytochrome c oxidase; Rizzuto et al., 1995; Li et al., 2004), together with a volume marker AAV-CAG-tdTomato (Fujishima et al., 2012). Consistent with previous reports (Altman and Bayer, 1995; Chen et al., 2007), we found that mitochondria were distributed throughout the large dendritic arbors of Purkinje cells, both in intact cerebella as well as in culture (Fig. 1A,B). Moreover, in contrast to their relatively sparse and random-looking distribution in hippocampal neurons (Fig. 1C; Li et al., 2004), the labeled mitochondria in Purkinje cell dendrites were clearly more abundant, and appeared to accumulate especially in their broader aspects, including at their branch points.
Figure 1.

Dynamics of mitochondrial transport in growing dendrites. A, B, Distribution of mitochondria in dendrites of Purkinje cells in vivo and in vitro. A, Purkinje cells were labeled with AAV-derived Mito-EGFP (green) and tdTomato (magenta) and imaged at P14. B, Purkinje cells in dissociated culture were labeled with Mito-EGFP (green) and costained with anti-Calbindin antibody (magenta) at 14 DIV. Scale bars: Left, 10 μm; Middle and right, 5 μm. C, Cultured hippocampal neurons were transfected with tdTomato (magenta) and Mito-EGFP (green) at 3 DIV and imaged at 7 DIV. Bottom, Shows the higher magnification images from the indicated area on top. Scale bars: Top, 10 μm; Bottom, 5 μm. D, Mitochondrial motility labeled with Mito-EGFP in growing dendrites (tdTomato; magenta) was observed by time-lapse imaging at 3 h intervals from 8 DIV. E, A high-magnified view of mitochondria in dendrites. Tubular mitochondria were observed along dendritic shafts of cultured Purkinje cells at 10 DIV. Broken lines indicate the contour of the dendrite depicted by Calbindin staining. F, G, The motility of individual mitochondria at 10 DIV. F, Trajectories of individual mitochondria in a bleached dendrite during the 140 s observation. G, Sequential images of mitochondrial transport at 5 s intervals. Scale bars: D–G, 2 μm.
We next sought to observe the dynamics of mitochondria in growing Purkinje cell dendrites, using time-lapse imaging. Cultured Purkinje cells infected with AAV-CAG-Mito-EGFP and AAV-CAG-tdTomato were monitored at 3 h intervals starting at 8 DIV, the time when dendrites generally initiate their extension (Fujishima et al., 2012). Indeed, we observed that mitochondria are actively delivered in these growing dendrites, and clearly tend to cluster along their emerging tracts and branches. Newly formed branches became populated with mitochondria within 6 h after bifurcating from the dendritic shaft (Fig. 1D). Most of these mitochondria appeared to be tubular in shape (averaging 2.8 ± 0.8 μm in length and <1 μm in diameter) and, consequently, they invariably oriented longitudinally along the shafts (Fig. 1E). Consistent with previous electron microscopic observations, mitochondrial transport into the most rapidly growing dendrites did not extend into their actual tips; it lagged behind by ∼5–10 μm (Altman and Bayer, 1995). These observations on the distribution and architecture of dendritic mitochondria labeled with Mito-EGFP fit well with the results of previous papers (Li et al., 2004).
To further monitor the motility of individual mitochondria, we performed FRAP analysis on Purkinje cell dendrites. This demonstrated that mitochondria moved along the dendritic shaft at an average speed of 0.25 ± 0.05 μm/s. Additionally, it showed that mitochondria moved fastest along the dendritic shafts, while they slowed at branch points and broader regions where the Mito-EGFP signal was strongest in fixed preparations, suggesting that mitochondria are at least transiently anchored at these sites (Fig. 1F,G). We never observed apparent fusion of labeled mitochondria at these branch points (data not shown).
Trafficking of mitochondria into dendrites is necessary for normal dendritic outgrowth
To determine the functional significance of this enrichment of mitochondria in dendrites, we next explored the effects of treating Purkinje cultures with constructs that should perturb mitochondrial transport and abolish this enrichment. To this end, we first determined the effect of expressing a dominant-negative form of TRAK2 (TRAK2ΔN, which is TRAK2 deleted of its N-terminal kinesin- and Hrs-binding domains). It has been shown previously that TRAK2 is the major player in dendritic transport of mitochondria and that its deletion mutant lacking the motor binding domain blocks the transport of mitochondria into dendrites (MacAskill et al., 2009b; van Spronsen et al., 2013). We confirmed in our Purkinje cultures that expressing TRAK2ΔN decreased the abundance of mitochondria in dendrites, without reducing the mitochondria in axons to any obvious extent (Fig. 2A–A″,B–B″,D). Commensurately, TRAK2ΔN-expression also led to a marked decrease in dendritic outgrowth in Purkinje cells (Fig. 2E,F). However, overexpression of TRAK2ΔN decreased mitochondrial membrane potential ΔΨm as measured by the potential-sensitive fluorescent dye TMRM, indicating that their electron-transport activity was impaired to some extent (Fig. 2G). Still, this effect must have been minor, as it had no obvious effect on the overall viability of our Purkinje cell cultures (data not shown).
Figure 2.

Depletion of dendritic mitochondria inhibits dendritic outgrowth. A–A″, Control Purkinje cells labeled with Mito-EGFP were analyzed for morphology (A), mitochondrial distribution in dendrites (A′), and axon (A″) at 10 DIV. Cellular morphology was visualized by immunostaining with anti-Calbindin (black in A, magenta in A′ and A″). B–B″, Purkinje cell-expressing TRAK2ΔN had truncated dendrites (B). Mitochondria labeled with Mito-DsRed were depleted from dendrites (B′) but not affected in the axon (B″). C–C″, T20-GFP-GM130Cterm expression inhibited dendritic outgrowth (C). Mitochondria were depleted from dendrites (C′) but not in the axon (C″). Scale bars: C, 10 μm; C′, C″, 5 μm. D, Quantification of mitochondrial content in dendrites (total mitochondrial area/dendrite area) in Purkinje cells at 10 DIV. E, F, Quantification of total length (E) and Sholl analysis (F) of dendrites at 10 DIV. N ≥ 20 for all data points. Data represent means ± SEM, ***p < 0.001, ANOVA with Tukey's HSD post hoc analysis. G, Quantification of TMRE fluorescence to assess ΔΨm in cells expressing ECFP, ECFP-TRAK2ΔN, or T20-ECFP-GM130Cterm. N = 30 cells from three independent experiments for each data point. H, EM images of mitochondria in cells expressing EGFP or T20-GFP-GM130Cterm. Left, Clustering of mitochondria (yellow) in cell center is observed in T20-EGFP-GM130Cterm-expressing cells. The Golgi apparatus is shown in green. Magnified views of mitochondria (middle) and Golgi (right). The size and structure of mitochondria are comparable to control cells. Scale bars: Left, 2 μm; Middle and right, 500 nm.
To gather more evidence that the dendrite outgrowth defect in TRAK2ΔN-expressing cells was caused specifically by the loss of dendritic mitochondria, we next examined a chimeric construct of the N-terminal domain of the mitochondrial outer membrane protein TOM20 conjugated with EGFP and the GRASP65-binding domain of GM130 (so-called T20-GFP-GM130Cterm). We also constructed T20-mCherry-GM130Cterm, which was conjugated with mCherry instead of EGFP for multicolor imaging of various combinations. Overexpression of T20-GFP-GM130Cterm has been shown to cross-bridge mitochondria in the perinuclear regions of cells, apparently without affecting their fusion/fission dynamics (Sengupta et al., 2009). We observed in the HEK293 cells that the expression of T20-GFP-GM130Cterm induced clustering of mitochondria in and around their cell centers (Fig. 2H). By electron microscopy, the individual mitochondria in these clusters looked normal in size and morphology, plus they maintained their normal membrane potential ΔΨm, which were important indications that the clustering caused by the T20-GFP-GM130Cterm construct does not alter mitochondrial function (Fig. 2G).
When we expressed T20-GFP-GM130Cterm in cultured Purkinje cells, we found that mitochondria also became clustered in their somata at the expense of dendritic localization (Fig. 2C′). That is, the mitochondrial content of dendrites in these cells was significantly decreased, as calculated by the ratio of cumulative mitochondria area over total dendritic area (Fig. 2D). In contrast, there was no apparent change in mitochondrial distribution in the axons of these Purkinje cells, probably because the AAV-driven gene expression system we used had a relatively late onset (∼6 DIV, somewhat after axon formation is completed in Purkinje cells; compare Fig. 2C″). Importantly, we found that this expression of T20-GFP-GM130Cterm affected dendritic outgrowth quite severely (Fig. 2C,E). Sholl analysis revealed that the extension of distal branches was strongly suppressed, although proximal dendrites appeared to remain rather unaffected (Fig. 2F). There was no apparent effect on overall cell survival, at least until 15 DIV (data not shown).
Finally, we confirmed that expression of T20-GFP-GM130Cterm in vivo, during development, inhibited dendritic localization of mitochondria and retarded dendrite arborization in native Purkinje cells, just as in cultured cells (Fig. 3A,B). In addition, expressing T20-myc-GM130Cterm also disrupts dendrite development in hippocampal pyramidal neurons (Fig. 3C–F).
Figure 3.

Depletion of dendritic mitochondria inhibits dendritic outgrowth in vivo Purkinje cells and in vitro hippocampal neurons. A, Dendritic morphology of Purkinje cells. Cells were transfected with tdTomato (green) with or without T20-GFP-GM130Cterm at E12.5 and fixed at P14 for Calbindin immunostaining (magenta). Scale bars: 10 μm. B, Quantification of the total sagittal-sectional area of the molecular layer covered by the dendrites. N ≥ 20 for each data point: ***p < 0.001, Student's t test. Data represent means ± SEM. C, D, Cultured hippocampal neurons were transfected with tdTomato (magenta) and Mito-EGFP (green) together with T20-myc-GM130Cterm at 3 DIV, and stained with anti-myc antibody at 7 DIV. Each part shows the representative morphology of neurons (C) and distribution of mitochondria in dendrites (D). Scale bars: 10 μm. E, F, Quantification of total dendrite length (E) and dendritic branch distribution (F) in 7 DIV hippocampal neurons. N = 10 for each data point: **p < 0.01, Student's t test. Data represent means ± SEM.
Specificity of molecular manipulations of mitochondrial localization
In addition to mitochondrial transport, TRAK2 has been implicated in trafficking of other cargoes including potassium channel Kir2.1 (Grishin et al., 2006), β2 subunit of GABAA receptor (Beck et al., 2002), and endosomes (Webber et al., 2008). It is thus possible that the dendritic atrophy caused by TRAK2ΔN overexpression might be mediated by a change in the distribution of these cargoes rather than a change in mitochondrial distribution. We therefore performed immunofluorescence with anti-Kir2.1 and anti-β2-subunit of GABAA receptor. Consistent with previous reports (Prüss et al., 2005; Allen Brain Atlas at http://developingmouse.brain-map.org), Kir2.1 was expressed very weakly in both control and TRAK2ΔN-expressing Purkinje cells, precluding the possible effect of its subcellular localization in dendrite morphology (data not shown). The β2-subunit of GABAA receptor was expressed primarily in the soma of Purkinje cells in agreement with previous reports (Kelley et al., 2013). The overexpression of TRAK2ΔN did not induce significant changes in its subcellular localization, possibly due to the compensation by endogenous TRAK1 (Fig. 4A; Gilbert et al., 2006). We next examined the distribution of early endosomes by introducing EGFP-Rab5a in Purkinje cells with or without TRAK2ΔN expression. While dendritic distribution of mitochondria was markedly reduced by TRAK2ΔN expression (Fig. 4B), Rab5a-positive endosomes were similarly localized in distal tips of growing dendrites in control and TRAK2ΔN-expressing Purkinje cells (Fig. 4C). Furthermore, we tested whether disruption of endosome–lysosome trafficking by overexpression of hepatocyte growth factor-regulated tyrosine kinase substrate (Hrs) would induce dendritic defects similar to TRAK2ΔN overexpression. TRAK2s have been shown to bind to Hrs in early endosomes, where they regulate endosome–lysosome trafficking (Webber et al., 2008). Overexpression of Hrs, however, induced cell death of Purkinje cells before dendritogenesis was initiated, which was never seen by TRAK2ΔN overexpression (data not shown). These results suggest that the observed defects in dendritic morphogenesis in TRAK2ΔN-expressing Purkinje cells are not caused by altered distribution of these other TRAK2 cargoes.
Figure 4.

Specificity of molecular manipulations for mitochondrial localization. A, Localization of β2-subunit of GABAA receptors in control and TRAK2ΔN-expressing Purkinje cells at 10 DIV. Insets show higher magnification images of the boxed area. Scale bar, 10 μm. B, C, Localization of mitochondria (B) and Rab5a (C) in Purkinje cells at 8 DIV. Insets show higher magnification images of the boxed area. Scale bar, 10 μm. D, Localization of the Golgi in Purkinje cells infected with Golgi-GFP alone, Golgi-GFP, and T20-myc-GM130Cterm, Golgi-GFP, and mCherry-GM130Cterm and Golgi-GFP and PEX-mCherry-GM130Cterm. Immunostaining with anti-Calbindin antibody (magenta) was performed at 10 DIV. Scale bar, 10 μm. E–G, Mitochondrial distribution in Purkinje cells at 10 DIV infected with Mito-EGFP alone, Mito-EGFP, and mCherry-GM130Cterm and Mito-EGFP and PEX-mCherry-GM130Cterm. Immunostaining with anti-Calbindin antibody (magenta) was performed at 10 DIV. Scale bars: Top, 10 μm; Bottom, 5 μm. F, G, Quantification of total dendritic length (F) and mitochondrial content in dendrites (G) in Purkinje cells at 10 DIV. N = 20 for all data points. Data represent means ± SEM, ***p < 0.001, ANOVA with Tukey's HSD post hoc analysis.
It is also possible that the overexpression of T20-GFP-GM130Cterm sequesters endogenous GRASP65 and disrupts the distribution and function of the Golgi apparatus. To address this, we analyzed the effect of overexpression of mCherry-GM130Cterm, which lacked the mitochondrial targeting sequence but was otherwise identical to T20-mCherry-GM130Cterm. We also constructed a modified version of mCherry-GM130Cterm specifying targeting to the peroxisomal membrane instead of mitochondria (PEX-mCherry-GM130Cterm). Overexpression of these GM130Cterm constructs occasionally induced dissociation of the Golgi (Fig. 4D). Nonetheless, we observed no significant effects on mitochondrial distribution and dendritic development of these Purkinje cells (Fig. 4E–G). Thus, the dendritic defects in T20-GFP-GM130Cterm-expressing cells are unlikely caused by possible dysfunction and/or mislocalization of the Golgi.
Together, these results strongly suggest that dendritic localization of mitochondria is indispensable for dendrite outgrowth in developing neurons. We mainly used T20-GFP-GM130Cterm to block mitochondrial transport in the next series of experiments.
Enhanced ATP synthesis restores dendrite outgrowth in the absence of dendritic mitochondria
ATP production and calcium homeostasis are the major physiological functions of mitochondria. Previous studies have suggested that mitochondrial sequestering of excessive calcium influx into dendrites may be critical for their proper growth and extension (Dickey and Strack, 2011). To determine whether calcium dysregulation contributes to the defects we observed in dendrite morphogenesis, we next examined the effect of calcium chelation on neurons expressing T20-GFP-GM130Cterm. Specifically, we treated cultured Purkinje cells expressing T20-GFP-GM130Cterm with 10 μm BAPTA-AM, but we could not demonstrate that this rescued their hypoplastic dendrites to any significant extent (Fig. 5A,B). Nor could we rescue the hypoplastic phenotypes by completely inhibiting their voltage-gated calcium channels (their L-, P/Q-, N-, and T-types), which we accomplished by applying a mixture of nifedipine, ω-agatoxin, ω-conotoxin, and mibefradil (Fig. 5A). Finally, we also could not rescue the hypoplastic phenotype of Purkinje cells expressing T20-GFP-GM130Cterm by inhibiting calcium release from their intracellular pools, by blocking their ryanodine receptors and IP3 receptors (Fig. 5A). None of these treatments affected dendrite morphogenesis of control Purkinje cells (Fig. 5A). These results diminish the likelihood that the observed inhibition of dendritic outgrowth can be attributed simply to a loss of the calcium buffering activity of dendritic mitochondria.
Figure 5.
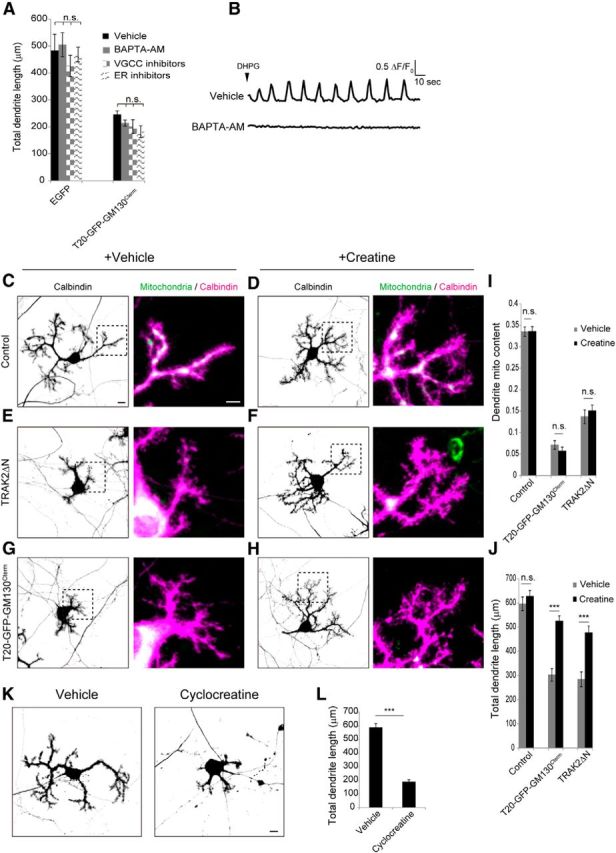
Hypomorphic dendrites by loss of dendritic mitochondria are rescued by creatine supplementation. A, Purkinje cells infected with EGFP or T20-GFP-GM130Cterm were treated with either 10 μm BAPTA-AM or VGCC inhibitors (10 μm nifedipine, 1 μm ω-conotoxin-GVIA, 2 μm mibefradil, and 100 nm ω-agatoxin-IVA) or ER calcium-release inhibitors (10 μm dantrolene, 10 μm 2-APB) from 8 to 10 DIV. The total dendrite length was measured at 10 DIV. N = 10 for each data point, ***p < 0.001, ANOVA with Tukey's HSD post hoc analysis. Data represent means ± SEM. B, Purkinje cells were infected with AAV carrying GCaMP3 and imaged at 10 DIV. Purkinje cells were treated with or without 10 μm BAPTA-AM for 30 min. Calcium spikes were observed at 1 s intervals for 2 min in the presence of 10 μm DHPG. BAPTA-AM efficiently blocked calcium spikes. C–H, Purkinje cells were infected with Mito-EGFP (C, D), TRAK2ΔN, and Mito-DsRed (E, F), or T20-GFP-GM130Cterm (G, H) at 0 DIV, and then treated with (D, F, H) or without (C, E, G) 20 mm creatine from 7 to 10 DIV. Scale bars: Left, 10 μm; Right, 5 μm. I, J, Mitochondrial content in dendrites (I) and total dendritic length (J) in Purkinje cells cultured in the presence and absence of creatine. N ≥ 21 for all data points. Data represent means ± SEM, ***p < 0.001, ANOVA with Tukey's HSD post hoc analysis. K, Purkinje cells treated with or without 5 mm cyclocreatine from 8 to 10 DIV were stained with anti-Calbindin. Scale bar, 10 μm. L, Quantification of total dendrite length. N = 30 for each data point, means ± SEM, ***p < 0.001, Student's t test.
We next sought to determine whether ATP deficiency could be responsible for the observed attenuation of outgrowth of dendrites with diminished mitochondria. To this end, we treated the affected neurons with high concentrations of creatine (Cr), which is known to increase ATP levels in a variety of cells, including neurons (Walsh et al., 2001; Li et al., 2004). Cr is converted to PCr by creatine kinase (CK), which is transported to distant sites as a diffusive, nonconsumable intermediate of high-energy triphosphate for generation of ATP at the site of high ADP levels (Wallimann et al., 2011). Cr supplementation (20 mm) markedly rescued the defective dendrites, with no apparent effect on mitochondrial localization in neurons expressing either TRAK2ΔN or T20-GFP-GM130Cterm (Fig. 5C–H). Dendrites developed long, well branched arbors comparable to those of wild-type neurons, even in the relative absence of dendritic mitochondria (Fig. 5I,J). On the other hand, Cr supplementation did not affect dendrite outgrowth in control Purkinje cells that had a normal distribution of dendritic mitochondria. Conversely, cultured Purkinje cells treated with the Cr analog cyclocreatine (5 mm) exhibited defects in dendrite outgrowth that was phenotypically similar to those of TRAK2ΔN- or T20-GFP-GM130Cterm-expressing cells (Fig. 5K,L). Cyclocreatine is readily phosphorylated to phosphocyclocreatine by CK activity, but it is a poor phosphate donor and specifically reduces ATP concentration (Boehm et al., 1996).
These results substantiate the view that ATP generation by dendritic mitochondria may be critical for the normal growth of Purkinje cell dendrites, and add the important qualification that the CK/PCr-system may also play an important corollary role in ATP metabolism in growing Purkinje dendrites.
Further evidence that creatine kinases help to regulate normal dendritic outgrowth in Purkinje cells
Mitochondrially generated ATP are exported to cytoplasm either directly or after being transphosphorylated into Cr by mitochondrial CK. PCr is then used for ATP regeneration by cytosolic CK at energy-consuming sites (Andres et al., 2008; Wallimann et al., 2011). Purkinje cell dendrites are thought to express the ubiquitous mitochondrial CK (so-called umtCK), plus two isoforms of cytosolic CKs (brain-type CK (B-CK) and muscle-type CK (M-CK); Tachikawa et al., 2004; Jost et al., 2002; Kaldis et al., 1996; Allen Brain Atlas: http://developingmouse.brain-map.org). To confirm this, we found expression of both B-CK and M-CK in Purkinje cell dendrites (data not shown).
Then, to further show that CK activity is required for dendrite outgrowth, we treated our cultured Purkinje cells with the cell-permeant CK inhibitor FDNB (Buechter et al., 1992). Indeed, we found that treatment with 5 μm FDNB significantly interfered with dendrite extension (Fig. 6A,B), though it also had a slight but significant effect on overall cell viability in these cultures (data not shown). Mitochondrial distribution in dendrites appeared normal in these cells (Fig. 6A). Next, to determine whether glycolysis should also be implicated in ATP production in developing dendrites, we treated our Purkinje cell cultures with the glycolysis inhibitor 2-DG (at 10 mm). This had little or no effect on dendrite development and dendritic distribution of mitochondria (Fig. 6A,B), consistent with the fact that we observe very little glycogen in these dendrites by electron microscopy (data not shown).
Figure 6.

Cytosolic creatine kinases are required for dendritic outgrowth. A, Morphology (top) and mitochondrial distribution (bottom) of cultured Purkinje cells treated with saline, 5 μm FDNB, or 10 mm 2-DG from 8 to 10 DIV. Cells were labeled with Mito-EGFP (green in bottom) and stained with anti-Calbindin (magenta in bottom) at 10 DIV. Scale bars: Top, 10 μm; Bottom, 5 μm. B, Total dendritic length. N = 20 for each data point. C, HEK293T cells expressing mDsRed-CK-B or mDsRed-CK-M were transfected with indicated shRNA constructs. Cells were lysed 1 d after transfection and analyzed by Western blotting with anti-DsRed and anti-β-actin antibodies. D, Purkinje cells were infected with viruses carrying indicated shRNAs, and stained with anti-CK-M or CK-B antibody at 10 DIV. Scale bar, 5 μm. E–G, Purkinje cells were infected with viruses carrying indicated shRNA constructs with or without respective shRNA-resistant mutants (CK-BR or CK-MR). Morphology (top) and mitochondrial distribution (bottom) of Purkinje cells infected with indicated shRNA constructs (E). Scale bars: Top, 10 μm; Bottom, 5 μm. Number of dendritic branches (F) and total dendrite length (G) were quantified at 10 DIV. N = 20 for each data point, ***p < 0.001, ANOVA with Tukey's HSD post hoc analysis. Data represent means ± SEM. H, Morphology of P14 Purkinje cells transfected with indicated shRNA constructs. I, The total sagittal-sectional area covered by the dendrite in the molecular layer. N ≥ 19 for each data point. Data represent means ± SEM; ***p < 0.001, ANOVA with Tukey's HSD post hoc analysis. Scale bars: 10 μm.
We further validated the importance of CK activity for dendrite outgrowth by inhibiting cytosolic CK activity via shRNA-mediated knockdown. To do this, we first demonstrated the efficacy of this shRNA in reducing CK-B or CK-M in HEK293 cells, by directly analyzing protein levels of the respective CK subtypes in these cells, and then did the same in our Purkinje cells after infecting them with AAV constructs that express EGFP and shRNA (Fig. 6C,D). Specifically, we found that Purkinje cells infected with AAVs carrying either CK-B shRNA or CK-M shRNA showed a marked decrease in dendritic branch number with no obvious change in the distribution of dendritic mitochondria (Fig. 6E,F). Interestingly, CK-M shRNA also reduced dendritic length, while CK-B shRNA seemed to have no significant effect on total dendritic length (Fig. 6G). As a control, we next confirmed that concomitant expression of shRNA-resistant mutants of CK (CK-BR and CK-MR) largely prevented the effect of expressing these shRNAs (Fig. 6F,G). In contrast to the pharmacological treatment with FDNB, above, we found that even simultaneous knockdown of CK-B and CK-M, which strongly prevented dendrite outgrowth, had no apparent effect on overall cell survival (data not shown). Finally, we also sought to determine whether CK-M and CK-B are required for dendritic outgrowth in vivo. To this end, we delivered these shRNA constructs directly into the cerebellum of E12.5 mice, via electroporation in utero. Indeed, Purkinje cells expressing CK-B shRNA or CK-M shRNA in these animals showed marked defects in dendritic development (Fig. 6H,I).
These data indicate that the CK/PCr system (but not glycolysis) functions as an important support mechanism for ATP transport and supply in growing dendrites.
Maintenance of ATP concentration in dendrites requires both dendritic mitochondria and CK activity
To verify that the observed dendritic localization of mitochondria is indeed required to maintain the local supply of ATP in growing dendrites, we next directly monitored ATP levels in neurons that were or were not depleted of dendritic mitochondria. To do this, we infected Purkinje cells with an AAV construct carrying the ATP-biosensor ATeam (AAV-CAG-ATeam), along with (or without) AAV-T20-mCherry-GM130Cterm. Purkinje cells without T20-mCherry-GM130Cterm, which again showed a normal complement of dendritic mitochondria, contained high ATP levels, both in their growing dendrites and in their cell bodies. In contrast, ATP levels were high in the somata but sharply declined in the atrophic distal dendrites of T20-mCherry-GM130Cterm-expressing cells (Fig. 7A–C).
Figure 7.
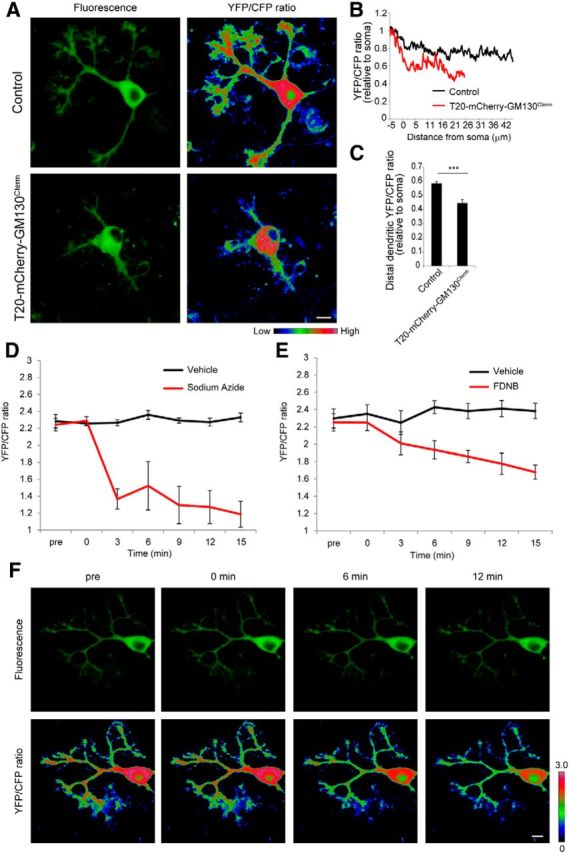
Dendritic mitochondria and CK activity are required for the maintenance of ATP levels in dendrites. A, Purkinje cells infected with AAV-CAG-ATeam with or without T20-mCherry-GM130Cterm were monitored for cytoplasmic ATP levels at 10 DIV. Each part shows representative image of fluorescence (left) and YFP/CFP ratio (right). Warmer colors represent higher ATP levels. B, Averaged line scans of YFP/CFP ratio along dendrites from the soma in control (black) and T20-mCherry-GM130Cterm-expressing (red) Purkinje cells. The YFP/CFP ratio was normalized to the somal YFP/CFP ratio. C, Quantification of ATP levels in distal dendrites relative to the soma in control and T20-mCherry-GM130Cterm-expressing Purkinje cells. Data represent means ± SEM, ***p < 0.001, Student's t test, control, n ≥ 19 cells from three independent experiments. D, E, Dynamic changes in cytoplasmic ATP levels in Purkinje cells after inhibition of oxidative phosphorylation (D) or CK activity (E). Then 5 mm sodium azide or 10 μm FDNB was added at time 0 min and monitored at 3 min intervals. Error bars represent SEM, n = 4 for each data points. F, Confocal images of fluorescence (top) and the pseudocolored YFP/CFP emission ratio (bottom) of a Purkinje cell before and at 0, 6, and 12 min after the addition of FDNB. Scale bars: 10 μm.
We next sought to determine directly that CK activity is required for the normal maintenance of ATP levels in growing dendrites. As a reference, we confirmed that oxidative stress by treatment with 5 mm sodium azide induced a rapid drop of ATP levels throughout the entire Purkinje cell (Fig. 7D). Direct inhibition of CK activity by FDNB treatment also induced a rapid decline in ATP levels throughout these cells, indicating that the CK/PCr system prevents rapid ATP consumption in neurons (Fig. 7E,F). These results further support the view that both dendritic mitochondria and CK activity (but again, not glycolysis) are needed to maintain proper ATP levels for growing dendrites.
Altered actin dynamics and abnormal ADF/cofilin activation in mitochondria-depleted dendrites
We next sought to determine what molecular mechanism(s) actually underlies the observed retardation of growth of dendrites that lack sufficient local energy supplies. We considered that ATP regulates many phosphorylation reactions and supports a variety of dendritic functions, including the maintenance of ionic homeostasis via support of the Na+-K+-ATPase and other membrane pumps that maintain membrane potential, as well as supporting the assembly and dynamics of the actin cytoskeleton (Attwell and Laughlin, 2001). We focused on the latter possibility, since actin dynamics are very active in dendrites and are likely to be essential for dendritic growth and arborization. To observe F-actin, we used confocal microscopy to visualize Purkinje cells labeled with Lifeact-EGFP. It was clear that actin filaments are strikingly more abundant and more dynamic in distal dendrites than they are in the somata in normal Purkinje cells (Fig. 8A). In contrast, confocal recordings of neurons depleted of dendritic mitochondria by expression of T20-GFP-GM130Cterm showed more irregular deposits of F-actin in their dendrites, but seemingly more abundant labeling of their somata (Fig. 8B).
Figure 8.

Altered actin dynamics in dendrites depleted with mitochondria or CK activity. A, B, Purkinje cells were infected with Lifeact-EGFP alone (A) or with T20-mCherry-GM130Cterm (B). Scale bar, 5 μm. C, Reduced actin turnover in the dendrite depleted with local mitochondria or CK activity. Purkinje cells were infected with either GFP-actin alone (control), coinfected with T20-mCherry-GM130Cterm, or treated with 5 mm cyclocreatine at 9–10 DIV. Recovery of GFP-actin at photobleached area (dotted frame) was monitored at 2 s intervals at 10 DIV. Pseudocolors show the intensity of GFP-actin signal. Scale bar, 2 μm. D, Time course of the fluorescence recovery of GFP-actin. Error bars represent SEM, n = 15 for each data point.
Seeing such irregular deposits of disordered filaments in neurons expressing T20-GFP-GM130Cterm strongly suggested that they have some defects in actin turnover. To substantiate this, we next performed FRAP, which revealed a significant delay in the restoration of GFP-actin signals in the peripheral actin networks of distal dendrites in T20-GFP-GM130Cterm-expressing neurons, compared with controls (Fig. 8C,D). Finally, we directly monitored and recorded actin dynamics in neurons that were treated with CK inhibitor cyclocreatine, and found that recovery of actin in dendritic tips was markedly downregulated (Fig. 8C,D). Thus, actin dynamics were slowed and perturbed in growing dendrites deficient in local mitochondria or local CK activity.
One known consequence of ATP deficiency in mature neurons is the dysregulation of actin depolymerizing factor (ADF) family proteins, which leads to the formation of abnormal actin-containing inclusions called “rods” in dendrites and axons (Minamide et al., 2000). Indeed, severe reduction in ATP levels can cause massive increases in the concentration of dephosphorylated (e.g., activated) ADF family proteins, and these can form relatively massive cofilin-G-actin complexes that can severely attenuate actin turnover (Huang et al., 2008; van Rheenen et al., 2009). With these reports in mind, we therefore sought to determine the distribution of cofilin—known to be a major ADF family protein in neurons (Minamide et al., 2000)—in atrophic dendrites with low ATP levels. To do this, we expressed full-length cofilin conjugated to mCherry (AAV-Cofilin-mCherry) in cultured Purkinje cultures. This conjugate distributed diffusely throughout the cytoplasm of control Purkinje cells, but formed numerous aggregates, in dendrites as well as axons, in cultures we depleted of ATP by oxidative stress (Fig. 9A,B). These aggregates did not exactly overlap with the phalloidin stains for actin, but appeared to be closely juxtaposed to the actin, consistent with the fact that ADF/cofilin and phalloidin competitively bind to the same domain in actin (McGough et al., 1997). We found that in Purkinje cells expressing T20-GFP-GM130Cterm, cofilin also formed short rod-like aggregates in their growth-retarded dendrites—aggregates that we never observed in control Purkinje cells (Fig. 9C,D). Likewise, we observed similar rod-like aggregates in the dendrites of cyclocreatine-treated neurons (Fig. 9C,D).These observations support the notion that ADF/cofilin is prone to form actin-containing inclusions in developing dendrites that are deficient in mitochondria and/or CK activity. We next assessed the causality of the formation of cofilin aggregates and ATP deficiency in the neurons deprived of dendritic mitochondria. We found that enhanced ATP synthesis by Cr treatment significantly reduced the formation of cofilin rods as it rescued dendritic growth in Purkinje cells expressing T20-GFP-GM130Cterm (Fig. 9E,F).
Figure 9.

Abnormal cofilin activity in dendrites depleted with local mitochondria or CK activity. A, B, Purkinje cells were infected with Cofilin(WT)-mCherry. Purkinje cells at 10 DIV were fixed 10 min after the treatment with an inhibitor of oxidative phosphorylation (5 mm sodium azide for 10 min), and stained with Calbindin (green) and DsRed (magenta) antibodies and 488 phalloidin. A, Many cofilin rods (magenta) were observed in distal dendrites. Scale bar, 10 μm. B, Cofilin rods (magenta) did not colocalize with phalloidin (green) in dendrites (blue). Insets show higher magnification images of the boxed area. Scale bar, 5 μm. C, Purkinje cells expressing Cofilin(WT)-mCherry were coinfected with T20-GFP-GM130Cterm (middle) or treated with 5 mm cyclocreatine (right) at 8–10 DIV. Bottom, Shows the higher magnification images of mCherry signals in the indicated areas on top. Cofilin rods appeared in tapered inclusions in dendrites of T20-GFP-GM130Cterm-expressing and cyclocreatine-treated cells. Scale bars: Top, 10 μm; Bottom, 5 μm. D, Percentages of cells formed cofilin rods. Data represent means ± SEM from three independent experiments, ***p < 0.001, ANOVA with Tukey's HSD post hoc analysis. E, Purkinje cells were coinfected with Cofilin(WT)-mCherry and T20-GFP-GM130Cterm and treated with or without 20 mm creatine at 7–10 DIV. Bottom, Shows the higher magnification images of mCherry signals in distal dendrites on top. Scale bars: Top, 10 μm; Bottom, 5 μm. F, Percentages of cells forming cofilin rods. Data represent means ± SEM from three independent experiments, ***p < 0.001, ANOVA with Tukey's HSD post hoc analysis.
To gather further evidence for a link between perturbation of dendritic outgrowth and this disturbance of ADF/cofilin activity, we next introduced a dephospho-mimic mutant of cofilin (Cofilin-S3A) into Purkinje cells. Expression of this construct was sufficient to form rod-like aggregates in the Purkinje cell dendrites, confirming that the rods consisted of dephosphorylated cofilin (Fig. 10A). On the other hand, expressing a phospho-mimic (or inactive) mutant of cofilin (Cofilin-S3E) did not form such aggregates. Instead, it distributed diffusely within the dendrites, like normal cofilin (Fig. 10A). Commensurately, Purkinje cells expressing Cofilin-S3A extended significantly smaller dendritic arbors, reminiscent of neurons expressing T20-GFP-GM130Cterm (Fig. 10B–D), while cells expressing Cofilin-S3E showed no significant defects in dendritic outgrowth. Finally, additional FRAP analyses revealed that actin dynamics were slowed in the distal dendrites of Cofilin-S3A-expressing neurons (Fig. 10E).These results suggest that the retardation we observe in the growth of dendrites depleted of mitochondria and/or CK activity can indeed be attributed, at least in part, to abnormal ADF/cofilin function with resultant abnormalities in actin dynamics, most probably due to the concomitant depletion of ATP.
Figure 10.
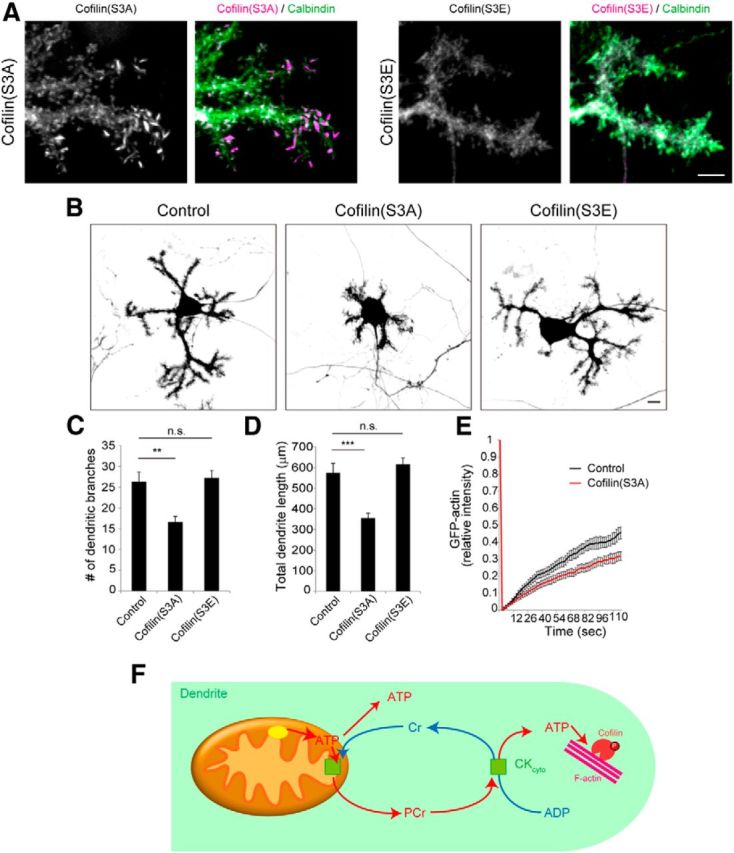
Abnormal cofilin activity induces suppressed dendritic growth and slowed actin turnover. A, Purkinje cells infected with dephospho-mutant or phospho-mutant of cofilin were stained for DsRed and Calbindin at 10 DIV. Cofilin rods were formed in dendrites of Cofilin(S3A)-expressing Purkinje cells but not in Cofilin(S3E)-expressing cells. Scale bar, 5 μm. B, Morphology of Purkinje cells expressing cofilin mutants. Scale bar, 10 μm. C, D, The number (C) and total length (D) of dendritic branches at 10 DIV. Data represent means ± SEM, n = 20 for each data point, **p < 0.01 and ***p < 0.001, ANOVA with Tukey's HSD post hoc analysis. E, FRAP analysis of GFP-actin turnover in dendritic tip areas in control (black) and Cofilin(S3A)-expressing (red) Purkinje cells at 10 DIV. Data represent means ± SEM, n = 15 for each point. F, Schematic image of the mechanism of ATP homeostasis in growing dendrites. ATP generation by local mitochondria and the CK/PCr shuttle system supports cofilin-mediated actin turnover in growing Purkinje cell dendrites. See Discussion for details.
Discussion
The complex geometry of dendrites critically controls the elaborate chemical and electrical signaling of neurons, by allowing complex and independent information-processing events to occur within individual, spatially distinct dendritic compartments (London and Häusser, 2005). This complex geometry also restricts the diffusion of chemical signals within dendrites, and necessitates a complex organization of all the organelles and other cellular machines that regulate those chemical signals within different dendritic subdomains. Our present results indicate that neurons acquire an elaborate mechanism for the supply and maintenance of ATP in expanding dendritic branches by synergistic action of mitochondria, CK, and actin dynamics.
To determine exactly how local mitochondrial function actually affects dendrite development, we sought experimental manipulations that selectively alter mitochondrial distribution, but minimally effect mitochondrial shape or function. Among the several molecular manipulations we examined, the most successful was the tethering of mitochondria to each other, which clamped them in somata and prevented their efficient movement into growing dendrites, without exerting any obvious effects on the shapes or membrane potentials of individual mitochondria. This means of preventing mitochondrial movement into dendrites severely retarded dendrite extension both in vitro and in vivo, permitting us to conclude that local mitochondrial function is indeed necessary for dendrite development.
We considered ATP and calcium to be the two most likely candidates for what dendritic mitochondria might be controlling on a local scale, within specific regions of growing dendrites. However, nothing in our data supported the involvement of local calcium buffering by dendritic mitochondria as being a primary mechanism of controlling dendrite outgrowth. Indeed, current thinking is that mitochondria do not play a major role in calcium clearance in mature Purkinje cell dendrites, either (Ivannikov et al., 2010). In contrast, we found that enhanced ATP synthesis by Cr supplementation dramatically restored dendritic outgrowth in our cultures, even in the absence of dendritic mitochondria. This led us to garner several other lines of evidence to support the view that the main role of dendritic mitochondria is to maintain the ATP levels required for dendritic growth and arborization.
We found that mitochondria were unevenly distributed within the dendrites, and few mitochondria were localized in the growing dendritic tips and some interbranch segments. It is known that ATP can be quickly consumed after it emerges from synthetic sources like mitochondria, and thus can display sharp concentration gradients within cells that consume ATP rapidly, like muscle cells and nerve cells with high ion-pumping activity (Shin et al., 2007; Okawa et al., 2008). Developing Purkinje cell dendrites express high levels of ATP-dependent ion pumps including Na/K-ATPases and plasma membrane Ca2+ ATPases (Biser et al., 2000; Marcos et al., 2009). In addition, molecular diffusion is markedly slowed in Purkinje dendrites covered with many spines (Santamaria et al., 2006). The biased and inhomogeneous distribution of mitochondria likely means that ATP availability is not equal throughout the large volume of Purkinje cell dendrites. So the critical question becomes: Where else may they be getting ATP from?
Glycolysis is inefficient at producing ATP, compared with mitochondria, yet it is considered by many to be the major alternative energy source in dendrites remote from the neuronal soma (Wakade et al., 1985; Bernstein et al., 2006; Ivannikov et al., 2010). Indeed, recent studies have demonstrated that glycolysis can provide enough ATP to support constitutive neuronal activities such as ion pumping and axonal vesicle trafficking, at least in small-caliber processes that have a very limited supply of mitochondria (Shin et al., 2007; Zala et al., 2013). However, we were unable to demonstrate that glycolysis contributed significantly to dendrite outgrowth in our Purkinje cells. Instead, our results indicated that the PCr shuttle was much more important for maintaining ATP levels in growing dendrites. Importantly, treatment with the CK inhibiter FDNB caused a rapid drop of ATP levels in cultured Purkinje cells, and a variety of other molecular and pharmacological approaches to inhibiting CK activity significantly retarded dendrite extension.
The CK/PCr shuttle system has been shown to be an important buffer of ATP in a variety of cells that have highly polarized shapes and greatly fluctuating energy demands (Wallimann and Hemmer, 1994; Shin et al., 2007; Andres et al., 2008; Linton et al., 2010). Moreover, it has been shown that Cr supplementation can protect against dendritic degeneration in mature neurons under certain ATP-deficient conditions (Brewer and Wallimann, 2000). The results presented here add a new dimension to the function of the CK/PCr shuttle system in energy homeostasis in developing neurons by preventing rapid ATP consumption in dendrites and allocating savings to further extension of dendrites. However, they do not agree with earlier studies that claimed a double deficiency of both CK-B and umtCK (the two major CK isoforms in the brain) caused no overt changes in cortical development (in 't Zandt et al., 2004; Streijger et al., 2005). We can only reconcile these disparate data by assuming that in those previous studies there must have been some sort of compensatory increase in ATP production, presumably by mitochondria and/or glycolysis, when CK activity was chronically downregulated during the whole of embryonic development. Indeed, such long-term adaptive changes in metabolic capacity have been shown to occur in the brains and muscles of animals genetically deficient in CK activities (Steeghs et al., 1995, 1998; Veksler et al., 1995; Kuiper et al., 2008). So we are confident in concluding that in our system, the CK/PCr shuttle system is indeed necessary to support the development of Purkinje cell dendrites.
Previous studies have demonstrated that inhibition of actin turnover under anoxic condition in chick ciliary neurons attenuates ATP depletion by nearly 50% (Bernstein and Bamburg, 2003), implying that another major pathway of ATP consumption within growing dendrites may be their ATP-mediated actin polymerization and depolymerization. Consistently, we found that actin turnover was significantly slowed in growth-retarded dendrites that lacked mitochondria or CK activity. Our results support the notion that cofilin dephosphorylation contributes, at least to some extent, to the inhibition of actin turnover and dendrite extension we see in developing neurons lacking a proper ATP supply. A previous finding indicated that the rod formation is reversibly regulated by immediate ATP levels (Bernstein et al., 2006). This supports the notion that the transient cofilin aggregates may prevent rapid ATP loss by slowing of actin dynamics and dendrite extension at the sites of ATP deficiency, and thus contribute to energy homeostasis in developing neurons with increasing cellular volume.
Of course, mitochondrial ATP production also supports many other important cellular processes that are likely to be important for dendritic outgrowth, including microtubule-based intracellular transport, membrane endocytosis/exocytosis, and a host of phosphorylation reactions on many intracellular kinases. In addition, even though we garnered no evidence for it here, it is still quite probable that calcium buffering by local mitochondria must influence dendrite growth and branching. Calcium buffering by dendritic mitochondria has been implicated in other aspects of dendritic development in cortical and hippocampal neurons (Dickey and Strack, 2011; Kimura and Murakami, 2014). Further studies are needed to elucidate all of these, and possibly other relevant mechanisms, by which local mitochondria can regulate dendritic development.
Footnotes
This work was supported by the NEXT program of the Japan Society for the Promotion of Science (JSPS) and Daiichi Sankyo Foundation of Life Science to M.K., by JSPS Grant-in-Aid for Young Scientists (B) to K. Fujishima, and by JSPS Fellowship for Young Scientists to K. Fukumitsu. We thank Dr. H. Imamura for the ATeam construct and advices on ATP imaging, Dr. Y. Tagawa for the GCaMP3 construct, Drs. Y. Takeo and M. Yuzaki for kind instruction of in utero electroporation techniques, and Dr. A. Kusumi for critical reading of this manuscript. We thank the members of Kengaku lab and iCeMS for helpful discussions.
The authors declare no competing financial interests.
References
- Altman J, Bayer SA. An atlas of the developing rat brain. Boca Raton, FL: CRC; 1995. [Google Scholar]
- Andres RH, Ducray AD, Schlattner U, Wallimann T, Widmer HR. Functions and effects of creatine in the central nervous system. Brain Res Bull. 2008;76:329–343. doi: 10.1016/j.brainresbull.2008.02.035. [DOI] [PubMed] [Google Scholar]
- Attwell D, Laughlin SB. An energy budget for signaling in the grey matter of the brain. J Cereb Blood Flow Metab. 2001;21:1133–1145. doi: 10.1097/00004647-200110000-00001. [DOI] [PubMed] [Google Scholar]
- Beck M, Brickley K, Wilkinson HL, Sharma S, Smith M, Chazot PL, Pollard S, Stephenson FA. Identification, molecular cloning, and characterization of a novel GABAA receptor-associated protein, GRIF-1. J Biol Chem. 2002;277:30079–30090. doi: 10.1074/jbc.M200438200. [DOI] [PubMed] [Google Scholar]
- Bernstein BW, Bamburg JR. Actin-ATP hydrolysis is a major energy drain for neurons. J Neurosci. 2003;23:1–6. doi: 10.1523/JNEUROSCI.23-01-00002.2003. [DOI] [PMC free article] [PubMed] [Google Scholar]
- Bernstein BW, Chen H, Boyle JA, Bamburg JR. Formation of actin-ADF/cofilin rods transiently retards decline of mitochondrial potential and ATP in stressed neurons. Am J Physiol Cell Physiol. 2006;291:C828–C839. doi: 10.1152/ajpcell.00066.2006. [DOI] [PubMed] [Google Scholar]
- Biser PS, Thayne KA, Kong JQ, Fleming WW, Taylor DA. Quantification of the alpha(3) subunit of the Na(+)/K(+)-ATPase in developing rat cerebellum. Brain Res Dev Brain Res. 2000;123:165–172. doi: 10.1016/S0165-3806(00)00084-5. [DOI] [PubMed] [Google Scholar]
- Boehm EA, Radda GK, Tomlin H, Clark JF. The utilisation of creatine and its analogues by cytosolic and mitochondrial creatine kinase. Biochim Biophys Acta. 1996;1274:119–128. doi: 10.1016/0005-2728(96)00018-7. [DOI] [PubMed] [Google Scholar]
- Brewer GJ, Wallimann TW. Protective effect of the energy precursor creatine against toxicity of glutamate and beta-amyloid in rat hippocampal neurons. J Neurochem. 2000;74:1968–1978. doi: 10.1046/j.1471-4159.2000.0741968. [DOI] [PubMed] [Google Scholar]
- Buechter DD, Medzihradszky KF, Burlingame AL, Kenyon GL. The active site of creatine kinase. Affinity labeling of cysteine 282 with N-(2,3-epoxypropyl)-N-amidinoglycine. J Biol Chem. 1992;267:2173–2178. [PubMed] [Google Scholar]
- Chazotte B. Labeling mitochondria with TMRM or TMRE. Cold Spring Harb Protoc. 2011;2011:895–897. doi: 10.1101/pdb.prot5641. [DOI] [PubMed] [Google Scholar]
- Chen H, Chan DC. Mitochondrial dynamics–fusion, fission, movement, and mitophagy–in neurodegenerative diseases. Hum Mol Genet. 2009;18:R169–R76. doi: 10.1093/hmg/ddp326. [DOI] [PMC free article] [PubMed] [Google Scholar]
- Chen H, McCaffery JM, Chan DC. Mitochondrial fusion protects against neurodegeneration in the cerebellum. Cell. 2007;130:548–562. doi: 10.1016/j.cell.2007.06.026. [DOI] [PubMed] [Google Scholar]
- Courchet J, Lewis TL, Jr, Lee S, Courchet V, Liou DY, Aizawa S, Polleux F. Terminal axon branching is regulated by the LKB1-NUAK1 kinase pathway via presynaptic mitochondrial capture. Cell. 2013;153:1510–1525. doi: 10.1016/j.cell.2013.05.021. [DOI] [PMC free article] [PubMed] [Google Scholar]
- Dickey AS, Strack S. PKA/AKAP1 and PP2A/Bβ2 regulate neuronal morphogenesis via Drp1 phosphorylation and mitochondrial bioenergetics. J Neurosci. 2011;31:15716–15726. doi: 10.1523/JNEUROSCI.3159-11.2011. [DOI] [PMC free article] [PubMed] [Google Scholar]
- Ehlers MD. Dendritic trafficking for neuronal growth and plasticity. Biochem Soc Trans. 2013;41:1365–1382. doi: 10.1042/BST20130081. [DOI] [PubMed] [Google Scholar]
- Fujishima K, Horie R, Mochizuki A, Kengaku M. Principles of branch dynamics governing shape characteristics of cerebellar Purkinje cell dendrites. Development. 2012;139:3442–3455. doi: 10.1242/dev.081315. [DOI] [PMC free article] [PubMed] [Google Scholar]
- Gilbert SL, Zhang L, Forster ML, Anderson JR, Iwase T, Soliven B, Donahue LR, Sweet HO, Bronson RT, Davisson MT, Wollmann RL, Lahn BT. Trak1 mutation disrupts GABA(A) receptor homeostasis in hypertonic mice. Nat Genet. 2006;38:245–250. doi: 10.1038/ng1715. [DOI] [PubMed] [Google Scholar]
- Girard M, Larivière R, Parfitt DA, Deane EC, Gaudet R, Nossova N, Blondeau F, Prenosil G, Vermeulen EG, Duchen MR, Richter A, Shoubridge EA, Gehring K, McKinney RA, Brais B, Chapple JP, McPherson PS. Mitochondrial dysfunction and Purkinje cell loss in autosomal recessive spastic ataxia of Charlevoix-Saguenay (ARSACS) Proc Natl Acad Sci U S A. 2012;109:1661–1666. doi: 10.1073/pnas.1113166109. [DOI] [PMC free article] [PubMed] [Google Scholar]
- Grishin A, Li H, Levitan ES, Zaks-Makhina E. Identification of gamma-aminobutyric acid receptor-interacting factor 1 (TRAK2) as a trafficking factor for the K+ channel Kir2.1. J Biol Chem. 2006;281:30104–30111. doi: 10.1074/jbc.M602439200. [DOI] [PubMed] [Google Scholar]
- Guo X, Macleod GT, Wellington A, Hu F, Panchumarthi S, Schoenfield M, Marin L, Charlton MP, Atwood HL, Zinsmaier KE. The GTPase dMiro is required for axonal transport of mitochondria to Drosophila synapses. Neuron. 2005;47:379–393. doi: 10.1016/j.neuron.2005.06.027. [DOI] [PubMed] [Google Scholar]
- Hollenbeck PJ, Saxton WM. The axonal transport of mitochondria. J Cell Sci. 2005;118:5411–5419. doi: 10.1242/jcs.02745. [DOI] [PMC free article] [PubMed] [Google Scholar]
- Huang TY, Minamide LS, Bamburg JR, Bokoch GM. Chronophin mediates an ATP-sensing mechanism for cofilin dephosphorylation and neuronal cofilin-actin rod formation. Dev Cell. 2008;15:691–703. doi: 10.1016/j.devcel.2008.09.017. [DOI] [PMC free article] [PubMed] [Google Scholar]
- Imamura H, Nhat KP, Togawa H, Saito K, Iino R, Kato-Yamada Y, Nagai T, Noji H. Visualization of ATP levels inside single living cells with fluorescence resonance energy transfer-based genetically encoded indicators. Proc Natl Acad Sci U S A. 2009;106:15651–15656. doi: 10.1073/pnas.0904764106. [DOI] [PMC free article] [PubMed] [Google Scholar]
- in 't Zandt HJA, Renema WK, Streijger F, Jost C, Klomp DW, Oerlemans F, Van der Zee CE, Wieringa B, Heerschap A. Cerebral creatine kinase deficiency influences metabolite levels and morphology in the mouse brain: a quantitative in vivo 1H and 31P magnetic resonance study. J Neurochem. 2004;90:1321–1330. doi: 10.1111/j.1471-4159.2004.02599.x. [DOI] [PubMed] [Google Scholar]
- Ishihara N, Nomura M, Jofuku A, Kato H, Suzuki SO, Masuda K, Otera H, Nakanishi Y, Nonaka I, Goto Y, Taguchi N, Morinaga H, Maeda M, Takayanagi R, Yokota S, Mihara K. Mitochondrial fission factor Drp1 is essential for embryonic development and synapse formation in mice. Nat Cell Biol. 2009;11:958–966. doi: 10.1038/ncb1907. [DOI] [PubMed] [Google Scholar]
- Ivannikov MV, Sugimori M, Llinás RR. Calcium clearance and its energy requirements in cerebellar neurons. Cell Calcium. 2010;47:507–513. doi: 10.1016/j.ceca.2010.04.004. [DOI] [PMC free article] [PubMed] [Google Scholar]
- Jost CR, Van Der Zee CE, In 't Zandt HJ, Oerlemans F, Verheij M, Streijger F, Fransen J, Heerschap A, Cools AR, Wieringa B. Creatine kinase B-driven energy transfer in the brain is important for habituation and spatial learning behaviour, mossy fibre field size and determination of seizure susceptibility. Eur J Neurosci. 2002;15:1692–1706. doi: 10.1046/j.1460-9568.2002.02001.x. [DOI] [PubMed] [Google Scholar]
- Kaldis P, Hemmer W, Zanolla E, Holtzman D, Wallimann T. “Hot spots” of creatine kinase localization in brain: cerebellum, hippocampus and choroid plexus. Dev Neurosci. 1996;18:542–554. doi: 10.1159/000111452. [DOI] [PubMed] [Google Scholar]
- Kaneko M, Yamaguchi K, Eiraku M, Sato M, Takata N, Kiyohara Y, Mishina M, Hirase H, Hashikawa T, Kengaku M. Remodeling of monoplanar Purkinje cell dendrites during cerebellar circuit formation. PLoS One. 2011;6:e20108. doi: 10.1371/journal.pone.0020108. [DOI] [PMC free article] [PubMed] [Google Scholar]
- Kelley MH, Ortiz J, Shimizu K, Grewal H, Quillinan N, Herson PS. Alterations in Purkinje cell GABAA receptor pharmacology following oxygen and glucose deprivation and cerebral ischemia reveal novel contribution of β1-subunit-containing receptors. Eur J Neurosci. 2013;37:555–563. doi: 10.1111/ejn.12064. [DOI] [PMC free article] [PubMed] [Google Scholar]
- Kimura T, Murakami F. Evidence that dendritic mitochondria negatively regulate dendritic branching in pyramidal neurons in the neocortex. J Neurosci. 2014;34:6938–6951. doi: 10.1523/JNEUROSCI.5095-13.2014. [DOI] [PMC free article] [PubMed] [Google Scholar]
- Kuiper JW, Oerlemans FT, Fransen JA, Wieringa B. Creatine kinase B deficient neurons exhibit an increased fraction of motile mitochondria. BMC Neurosci. 2008;9:73. doi: 10.1186/1471-2202-9-73. [DOI] [PMC free article] [PubMed] [Google Scholar]
- Li Z, Okamoto K, Hayashi Y, Sheng M. The importance of dendritic mitochondria in the morphogenesis and plasticity of spines and synapses. Cell. 2004;119:873–887. doi: 10.1016/j.cell.2004.11.003. [DOI] [PubMed] [Google Scholar]
- Linton JD, Holzhausen LC, Babai N, Song H, Miyagishima KJ, Stearns GW, Lindsay K, Wei J, Chertov AO, Peters TA, Caffe R, Pluk H, Seeliger MW, Tanimoto N, Fong K, Bolton L, Kuok DL, Sweet IR, Bartoletti TM, Radu RA, et al. Flow of energy in the outer retina in darkness and in light. Proc Natl Acad Sci U S A. 2010;107:8599–8604. doi: 10.1073/pnas.1002471107. [DOI] [PMC free article] [PubMed] [Google Scholar]
- Lohmann C, Myhr KL, Wong RO. Transmitter-evoked local calcium release stabilizes developing dendrites. Nature. 2002;418:177–181. doi: 10.1038/nature00850. [DOI] [PubMed] [Google Scholar]
- London M, Häusser M. Dendritic computation. Annu Rev Neurosci. 2005;28:503–532. doi: 10.1146/annurev.neuro.28.061604.135703. [DOI] [PubMed] [Google Scholar]
- Macaskill AF, Rinholm JE, Twelvetrees AE, Arancibia-Carcamo IL, Muir J, Fransson A, Aspenstrom P, Attwell D, Kittler JT. Miro1 is a calcium sensor for glutamate receptor-dependent localization of mitochondria at synapses. Neuron. 2009a;61:541–555. doi: 10.1016/j.neuron.2009.01.030. [DOI] [PMC free article] [PubMed] [Google Scholar]
- MacAskill AF, Brickley K, Stephenson FA, Kittler JT. GTPase dependent recruitment of Grif-1 by Miro1 regulates mitochondrial trafficking in hippocampal neurons. Mol Cell Neurosci. 2009b;40:301–312. doi: 10.1016/j.mcn.2008.10.016. [DOI] [PubMed] [Google Scholar]
- Marcos D, Sepulveda MR, Berrocal M, Mata AM. Ontogeny of ATP hydrolysis and isoform expression of the plasma membrane Ca(2+)-ATPase in mouse brain. BMC Neurosci. 2009;10:112. doi: 10.1186/1471-2202-10-112. [DOI] [PMC free article] [PubMed] [Google Scholar]
- McGough A, Pope B, Chiu W, Weeds A. Cofilin changes the twist of F-actin: implications for actin filament dynamics and cellular function. J Cell Biol. 1997;138:771–781. doi: 10.1083/jcb.138.4.771. [DOI] [PMC free article] [PubMed] [Google Scholar]
- McInnes J. Insights on altered mitochondrial function and dynamics in the pathogenesis of neurodegeneration. Transl Neurodegener. 2013;2:12. doi: 10.1186/2047-9158-2-12. [DOI] [PMC free article] [PubMed] [Google Scholar]
- Minamide LS, Striegl AM, Boyle JA, Meberg PJ, Bamburg JR. Neurodegenerative stimuli induce persistent ADF/cofilin-actin rods that disrupt distal neurite function. Nat Cell Biol. 2000;2:628–636. doi: 10.1038/35023579. [DOI] [PubMed] [Google Scholar]
- Nishiyama J, Hayashi Y, Nomura T, Miura E, Kakegawa W, Yuzaki M. Selective and regulated gene expression in murine Purkinje cells by in utero electroporation. Eur J Neurosci. 2012;36:2867–2876. doi: 10.1111/j.1460-9568.2012.08203.x. [DOI] [PubMed] [Google Scholar]
- Okawa H, Sampath AP, Laughlin SB, Fain GL. ATP consumption by mammalian rod photoreceptors in darkness and in light. Curr Biol. 2008;18:1917–1921. doi: 10.1016/j.cub.2008.10.029. [DOI] [PMC free article] [PubMed] [Google Scholar]
- Prüss H, Derst C, Lommel R, Veh RW. Differential distribution of individual subunits of strongly inwardly rectifying potassium channels (Kir2 family) in rat brain. Brain Res Mol Brain Res. 2005;139:63–79. doi: 10.1016/j.molbrainres.2005.05.006. [DOI] [PubMed] [Google Scholar]
- Ramírez OA, Couve A. The endoplasmic reticulum and protein trafficking in dendrites and axons. Trends Cell Biol. 2011;21:219–227. doi: 10.1016/j.tcb.2010.12.003. [DOI] [PubMed] [Google Scholar]
- Rizzuto R, Brini M, Pizzo P, Murgia M, Pozzan T. Chimeric green fluorescent protein as a tool for visualizing subcellular organelles in living cells. Curr Biol. 1995;5:635–642. doi: 10.1016/S0960-9822(95)00128-X. [DOI] [PubMed] [Google Scholar]
- Ruthel G, Hollenbeck PJ. Response of mitochondrial traffic to axon determination and differential branch growth. J Neurosci. 2003;23:8618–8624. doi: 10.1523/JNEUROSCI.23-24-08618.2003. [DOI] [PMC free article] [PubMed] [Google Scholar]
- Santamaria F, Wils S, De Schutter E, Augustine GJ. Anomalous diffusion in Purkinje cell dendrites caused by spines. Neuron. 2006;52:635–648. doi: 10.1016/j.neuron.2006.10.025. [DOI] [PMC free article] [PubMed] [Google Scholar]
- Saotome M, Safiulina D, Szabadkai G, Das S, Fransson A, Aspenstrom P, Rizzuto R, Hajnóczky G. Bidirectional Ca2+-dependent control of mitochondrial dynamics by the Miro GTPase. Proc Natl Acad Sci U S A. 2008;105:20728–20733. doi: 10.1073/pnas.0808953105. [DOI] [PMC free article] [PubMed] [Google Scholar]
- Saxton WM, Hollenbeck PJ. The axonal transport of mitochondria. J Cell Sci. 2012;125:2095–2104. doi: 10.1242/jcs.053850. [DOI] [PMC free article] [PubMed] [Google Scholar]
- Sengupta D, Truschel S, Bachert C, Linstedt AD. Organelle tethering by a homotypic PDZ interaction underlies formation of the Golgi membrane network. J Cell Biol. 2009;186:41–55. doi: 10.1083/jcb.200902110. [DOI] [PMC free article] [PubMed] [Google Scholar]
- Sheng ZH, Cai Q. Mitochondrial transport in neurons: impact on synaptic homeostasis and neurodegeneration. Nat Rev Neurosci. 2012;13:77–93. doi: 10.1038/nrg3141. [DOI] [PMC free article] [PubMed] [Google Scholar]
- Shin JB, Streijger F, Beynon A, Peters T, Gadzala L, McMillen D, Bystrom C, Van der Zee CE, Wallimann T, Gillespie PG. Hair bundles are specialized for ATP delivery via creatine kinase. Neuron. 2007;53:371–386. doi: 10.1016/j.neuron.2006.12.021. [DOI] [PMC free article] [PubMed] [Google Scholar]
- Steeghs K, Oerlemans F, Wieringa B. Mice deficient in ubiquitous mitochondrial creatine kinase are viable and fertile. Biochim Biophys Acta. 1995;1230:130–138. doi: 10.1016/0005-2728(95)00044-J. [DOI] [PubMed] [Google Scholar]
- Steeghs K, Oerlemans F, de Haan A, Heerschap A, Verdoodt L, de Bie M, Ruitenbeek W, Benders A, Jost C, van Deursen J, Tullson P, Terjung R, Jap P, Jacob W, Pette D, Wieringa B. Cytoarchitectural and metabolic adaptations in muscles with mitochondrial and cytosolic creatine kinase deficiencies. Mol Cell Biochem. 1998;184:183–194. doi: 10.1023/A:1006811717709. [DOI] [PubMed] [Google Scholar]
- Streijger F, Oerlemans F, Ellenbroek BA, Jost CR, Wieringa B, Van der Zee CE. Structural and behavioural consequences of double deficiency for creatine kinases BCK and UbCKmit. Behav Brain Res. 2005;157:219–234. doi: 10.1016/j.bbr.2004.07.002. [DOI] [PubMed] [Google Scholar]
- Tachikawa M, Fukaya M, Terasaki T, Ohtsuki S, Watanabe M. Distinct cellular expressions of creatine synthetic enzyme GAMT and creatine kinases uCK-Mi and CK-B suggest a novel neuron-glial relationship for brain energy homeostasis. Eur J Neurosci. 2004;20:144–160. doi: 10.1111/j.1460-9568.2004.03478.x. [DOI] [PubMed] [Google Scholar]
- Tao K, Matsuki N, Koyama R. AMP-activated protein kinase mediates activity-dependent axon branching by recruiting mitochondria to axon. Dev Neurobiol. 2014;74:557–573. doi: 10.1002/dneu.22149. [DOI] [PubMed] [Google Scholar]
- Ulfhake B, Kellerth JO. A quantitative light microscopic study of the dendrites of cat spinal alpha-motoneurons after intracellular staining with horseradish peroxidase. J Comp Neurol. 1981;202:571–583. doi: 10.1002/cne.902020409. [DOI] [PubMed] [Google Scholar]
- van Rheenen J, Condeelis J, Glogauer M. A common cofilin activity cycle in invasive tumor cells and inflammatory cells. J Cell Sci. 2009;122:305–311. doi: 10.1242/jcs.031146. [DOI] [PMC free article] [PubMed] [Google Scholar]
- van Spronsen M, Mikhaylova M, Lipka J, Schlager MA, van den Heuvel DJ, Kuijpers M, Wulf PS, Keijzer N, Demmers J, Kapitein LC, Jaarsma D, Gerritsen HC, Akhmanova A, Hoogenraad CC. TRAK/Milton motor-adaptor proteins steer mitochondrial trafficking to axons and dendrites. Neuron. 2013;77:485–502. doi: 10.1016/j.neuron.2012.11.027. [DOI] [PubMed] [Google Scholar]
- Veksler VI, Kuznetsov AV, Anflous K, Mateo P, van Deursen J, Wieringa B, Ventura-Clapier R. Muscle creatine kinase-deficient mice. II. Cardiac and skeletal muscles exhibit tissue-specific adaptation of the mitochondrial function. J Biol Chem. 1995;270:19921–19929. doi: 10.1074/jbc.270.34.19921. [DOI] [PubMed] [Google Scholar]
- Wakade AR, Prat JC, Wakade TD. Sympathetic neurons extend neurites in a culture medium containing cyanide and dinitrophenol but not iodoacetate. FEBS Lett. 1985;190:95–98. doi: 10.1016/0014-5793(85)80435-X. [DOI] [PubMed] [Google Scholar]
- Wallimann T, Hemmer W. Creatine kinase in non-muscle tissues and cells. Mol Cell Biochem. 1994;133–134:193–220. doi: 10.1007/BF01267955. [DOI] [PubMed] [Google Scholar]
- Wallimann T, Tokarska-Schlattner M, Schlattner U. The creatine kinase system and pleiotropic effects of creatine. Amino Acids. 2011;40:1271–1296. doi: 10.1007/s00726-011-0877-3. [DOI] [PMC free article] [PubMed] [Google Scholar]
- Walsh B, Tonkonogi M, Söderlund K, Hultman E, Saks V, Sahlin K. The role of phosphorylcreatine and creatine in the regulation of mitochondrial respiration in human skeletal muscle. J Physiol. 2001;537:971–978. doi: 10.1113/jphysiol.2001.012858. [DOI] [PMC free article] [PubMed] [Google Scholar]
- Wang X, Schwarz TL. The mechanism of Ca2+-dependent regulation of kinesin-mediated mitochondrial motility. Cell. 2009;136:163–174. doi: 10.1016/j.cell.2008.11.046. [DOI] [PMC free article] [PubMed] [Google Scholar]
- Webber E, Li L, Chin LS. Hypertonia-associated protein Trak1 is a novel regulator of endosome-to-lysosome trafficking. J Mol Biol. 2008;382:638–651. doi: 10.1016/j.jmb.2008.07.045. [DOI] [PMC free article] [PubMed] [Google Scholar]
- Zala D, Hinckelmann MV, Yu H, Lyra da Cunha MM, Liot G, Cordelières FP, Marco S, Saudou F. Vesicular glycolysis provides on-board energy for fast axonal transport. Cell. 2013;152:479–491. doi: 10.1016/j.cell.2012.12.029. [DOI] [PubMed] [Google Scholar]
- Zhang CL, Ho PL, Kintner DB, Sun D, Chiu SY. Activity-dependent regulation of mitochondrial motility by calcium and Na/K-ATPase at nodes of Ranvier of myelinated nerves. J Neurosci. 2010;30:3555–3566. doi: 10.1523/JNEUROSCI.4551-09.2010. [DOI] [PMC free article] [PubMed] [Google Scholar]