

Abstract
The role of basal ganglia in motivational processes has been under scrutiny in recent decades, with increasing evidence from clinical studies of cognitive and motivational deficits in patients with basal ganglia lesions. Tonically active neurons (TANs), the presumed striatal cholinergic interneurons, could be important actors in integrating and relaying motivational information arising from various modalities. Their multiphasic responses to rewards and to conditioned stimuli associated with reward conferred them a role in limbic processes. They are also modulated by a task's motor aspect. Recent studies suggest they are influenced by the context in which behavioral responses are expressed. To investigate the role of TANs in motor-limbic interaction processes, we recorded 169 TANs in the striatum of two monkeys performing a motivational task, in which they had to develop a variable force to receive different amounts of reward in response to visual stimuli. Our results reveal new features of TANs response properties. First, TANs usually responded either by a pause or an elevation of discharge rate to the visual cues and the reward, with few neurons combining both pause and rebound. Second, the elevations of discharge rate after the cues were most sensitive to the least valuable (high force or small reward) task conditions. Finally, the responses of TANs to the visual cues were time locked on the onset of the animal's movement. TANs' population and responses could thus play a role in signaling less attractive situations, those with either a high motor demand and/or small reward.
SIGNIFICANCE STATEMENT Tonically active neurons (TANs) are known for their responses to unpredictable positive or negative events. However, here we show that TANs respond by a pause or an increase in their activity to all rewarding events in a task in which combined visual cues indicate to the monkeys the levels of force to produce and the upcoming reward. Unlike the pause, the increase in activity is modulated by task parameters and is most sensitive to the least attractive task conditions (high force and/or small reward). TANs' responses triggered by cue occurrence are also modulated by movement-related information (movement onset). We therefore propose here that TANs could play a role, via their action on striatal projections neurons, in maintaining high cost/low benefit ratio behaviors.
Keywords: basal ganglia, cholinergic interneurons, effort, electrophysiology, motivation, nonhuman primates
Introduction
Basal ganglia, and more specifically one of their input structures, the striatum, have been considered to be important for performing and maintaining adapted motivated behaviors.
Clinical studies have reported that basal ganglia disorders not only trigger motor, but also cognitive and motivational deficits (Brown et al., 1997; Pessiglione et al., 2006). Tonically active neurons (TANs), presumed to be cholinergic interneurons, are distributed throughout the striatum, and their responses have generally been described as homogeneous (Aosaki et al., 1995; Apicella, 2002; Adler et al., 2012). TANs are known to be involved in reward-related processes and associative learning. Most studies have shown that their activity is modulated by the temporal prediction of a conditioned stimulus or a reward, its probability of occurrence, and the affective significance of stimuli. Their responses are also modulated by the general context in which learning or the expression of the learned behavior take place (Aosaki et al., 1994; Apicella et al., 1997, 2009, 2011; Sardo et al., 2000; Shimo and Hikosaka, 2001; Ravel et al., 2003; Morris et al., 2004; Yamada et al., 2004; Joshua et al., 2008; Deffains et al., 2010). An important feature of the responses of TANs is that the responses are usually transferred from the reward to the preceding conditioned stimulus during learning (Apicella et al., 1997; Ravel et al., 2003), and TANs' modulations are more pronounced in response to unpredictable, highly rewarding stimuli. It has also been reported that the activity of TANs can be modulated, under some conditions, by movement in both nonhuman primates and rodents (Lee et al., 2006; Benhamou et al., 2014).
The responses of TANs classically consist of a pause followed by a rebound in activity, sometimes preceded by a short initial increase. TANs could, in turn, modulate the activity of phasically active neurons (PANs), the striatal projection neurons, by a modification of their excitability state during the pause displayed by TANs in relation with stimuli associated with reward or reward itself, resulting in a time window during which other afferences could be expressed (Akins et al., 1990). PAN responses show various modulations in relation to movement, reward, or reward expectancy, depending on their location in the striatum (Hikosaka et al., 1989; Crutcher and Alexander, 1990; Apicella et al., 1991). Thus, TANs could potentially directly, or indirectly by acting on presynaptic afferences on PANs, participate in motor, cognitive, and/or motivational processes, via the PANs.
The role of TANs in motivational processes has been mainly studied in the context of classical conditioning or instrumental tasks in which the reward has been manipulated, in its occurrence or size for instance, but very little attention has been devoted to their response properties in more complex tasks modulating both motor and reward aspects. However, in day to day life, animals and humans must often apply different levels of effort in response to environmental stimuli to achieve variable quantities of reward. To investigate this situation, we studied the activity of TANs in a single experimental protocol in which visual cues provide information about both required effort and expected reward. If TANs can encode complex motivational value, we thus expect that they would respond to visual cues predictive of the reward as a function of their rewarding value (computed from the effort required and the expected reward). Moreover, the development of the required force is necessary to succeed in our task. Consequently, the activity of TANs, in this context, could also be modulated by the movement as it has been reported previously.
Materials and Methods
Animal and apparatus
Two male rhesus monkeys (Macaca mulatta) weighing 8 and 7 kg at the beginning of the experiments (Monkeys M and Y, respectively) were trained to exert and maintain a force on a lever in response to visual stimuli to receive a liquid reward. All experimental procedures were in compliance with the National Institutes of Health's Guide for the Care and Use of Laboratory Animals, the French laws on animal experimentation, and the European directive on the protection of animals used for scientific purposes.
Behavioral procedures
The monkeys were seated in a Plexiglas primate chair and faced a panel supporting a 17 inch screen on which visual stimuli could be presented. The screen was positioned 18 cm from the monkey; a lever equipped with strain gauges in the lower part of the panel was positioned at waist level. A sliding door at the front of the primate chair could be opened to allow the animal to position his hand on the lever. The liquid reward (water) was delivered via a metal spout positioned directly in front of the monkey's mouth. The liquid was delivered through a solenoid valve located outside the recording room.
The trial structure is illustrated in Figure 1A. At the beginning of each trial, the monkey had to develop a basal pressing force on the lever, between 0 and 20% of the maximal force, defined experimentally at 900 g based on the capabilities of the animals, during a 1 s preparatory period. After this period, two visual stimuli, a green one and a red one, each being either a filled circle or filled square, were presented vertically in the center of the screen. The shape of the green stimulus indicated the amount of force the animals had to develop on the lever; that of the red stimulus indicated the amount of the upcoming reward. A green filled circle indicated that the animals had to develop a force between 20 and 55% of the maximal force [180 to 495 g; “low force” (f)], and a green filled square a force between 55 and 90% of the maximal force [495 to 810 g; “high force” (F)]. In the same way, a red filled circle indicated to the animals that the reward delivered would be small [0.3 ml of water; “small reward” (r)]; a filled red square indicated that it would be large [1.2 ml of water; “large reward” (R)]. The four possible combinations of visual stimuli (fr, fR, Fr, FR) set the four different conditions of the task. In response to these stimuli, monkeys had to increase their pressing force on the lever to reach the required force in a period shorter than 1 s [maximal reaction time (RT)] and hold this force for 1 s (holding time) to receive the reward. For each correct trial, monkeys were rewarded with the small or large reward according to the shape of the red stimuli. Both visual stimuli were extinguished as soon as the reward was delivered. To monitor force, monkeys were helped by visual feedback, a vertical rectangle representing the range of the required force located just below the visual stimuli. In this rectangle, a white cursor indicated in real time the force developed on the lever when in the required force range. After receiving the reward, the monkeys returned to a basal pressing force in preparation for the next trial, which did not begin until the total duration of the current trial (4.5 s) had elapsed.
Figure 1.

Task design and reconstruction of recording locations. A, Task design. A pair of visual stimuli appeared after the maintenance of a basal pressing force by the animal for 1 s. In response to these stimuli, the monkey increased his pressing force, reached the required force range, and held this force for 1 s to obtain the reward. Four possible combinations of visual stimuli indicated to the animal the force he had to develop and the size of the upcoming reward. The top stimulus represented the force and the bottom one the reward. A filled circle represented a small amount, and a filled square a large one. B–D, Reconstruction of recording locations of TANs. All electrode recording sites were obtained from MR images. Electrode artifacts are visible in MR images of both monkeys, and the location of each recorded neuron was extrapolated from the tip of these electrodes. B, Recording sites for Monkey M from AC −1 to AC +6 (one more neuron, recorded in AC −3 is not represented on the figure). Each dot represents the location of one neuron recorded during the task. The white ones represent the locations of associative neurons, and the black ones the locations of sensorimotor neurons. C, Recording sites for Monkey Y from AC −2 to AC +3 (same representation as in B). D, Three-dimensional reconstruction of the anterior part of the striatum (transparent gray) of Monkey Y, AC +4 in the background.
There were three different cases in which a trial was considered as failed and no reward given. First, trials in which the required force was not reached within a 1 s period were considered omission errors. Second, trials in which the required force was not held for at least 1 s (holding time) were considered holding errors. Last, trials in which the force developed was greater than the upper limit of the required force (495 and 810 g, respectively, for the low and the high forces) were considered threshold errors. Both holding and threshold errors were considered as execution errors. After an error, a correction trial ensued; the same association of visual stimuli was presented again to the monkeys until they performed the trial correctly. Moreover, trials in which the monkeys began to increase their pressing force on the lever within 100 ms after the occurrence of the visual stimuli were considered as anticipations and were excluded from analysis.
Before the electrophysiological recordings began, the monkeys were extensively trained (4 to 6 months) until a performance threshold of 80% correct trials was achieved, in which the preparatory period, the maximal reaction time, and the holding time were all of 1 s. In each recording session, the four different combinations of visual stimuli were presented pseudorandomly, from trial to trial. The first trial of a session was randomly chosen from a list of trials where each condition was present in the same proportion. If trials were performed correctly, the same visual stimuli were not presented more than times sequentially.
Surgery
Initial anesthesia was administered by an intramuscular injection of ketamine (10 mg/kg) and xylazine (0.5 mg/kg), followed by deep anesthesia induced by isoflurane. A polyether ether ketone recording chamber (19 mm inner diameter) was implanted over the left hemisphere. Recording chambers in both monkeys were positioned with a 20° angle laterally in the coronal plane. The targeted stereotaxic coordinates, relative to ear bars, were as follows: Monkey M, anterior, 18 mm; lateral, 16 mm; Monkey Y, anterior, 14 mm; lateral, 16 mm [based on the atlas of Saleem and Logothetis (2007)]. During the same surgery, two titanium cylinders were embedded in the orthopedic cement (Palacos with gentamicin) and fixed to the skull with titanium orthopedic bone screws for subsequent head restraint during neuronal recordings. Following surgery, monkeys were given antibiotics (Marbocyl, 2 mg/kg) and analgesics (Tolfedine, 4 mg/kg) on the day of the surgery and for the following 4 d. The recording chamber was filled with an antibiotic solution (Marbocyl, 2 mg/ml) and sealed with a removable cap.
Electrophysiological recordings
While the monkeys were performing the task, with head immobilization, extracellular activity of single neurons was recorded with custom-made glass-insulated tungsten microelectrodes based on the technique of Merrill and Ainsworth (1972). To record from the basal ganglia structures, a stainless steel guide tube (diameter, 0.6 mm) was lowered below the surface of the dura, and the microelectrode was passed inside the guide and advanced using a manual hydrolic microdrive (M096, Narishige). The microelectrode was connected to a preamplifier located in close proximity to the microdrive. The neuronal signal was then amplified 5000 times and filtered at 0.3–1.5 kHz, and spikes were detected on-line by threshold crossing using a window discriminator (Neurolog, Digitimer). The presentation of visual stimuli, the force developed by the animal, the delivery of the reward, and digital pulses from neuronal activity were controlled/collected by a computer using custom-designed software written in LabVIEW (National Instrument). The signals from the strain gauge allowing the measure of the force were digitized at 500 Hz.
The recording electrode was lowered to isolate neurons while the monkey performed the task. We isolated single neurons by continuously monitoring the waveform of the recorded neuronal impulses on an oscilloscope. Tonic striatal neurons were distinguished on the basis of their spontaneous firing rate and the duration of their spikes (Kimura et al. 1984; Apicella et al. 1997). The activity of the first well-isolated neuron in a trajectory was recorded for at least ten trials per condition. After recording from a TAN, the electrode was moved forward until another TAN was encountered. Data from all TANs recorded were included in analyses.
Localization of recordings
To assess the localization of our recordings, we obtained a high-resolution magnetic resonance imaging (MRI) scan for each monkey with electrodes positioned (five for Monkey M, six for Monkey Y) in trajectories on which we recorded TANs. Based on the localization of the tip of these electrodes, we extrapolated the inferior/superior, anterior/posterior, and medial/lateral position of each recorded neuron to generate a three-dimensional reconstruction using Brainsight software (Rogue Research; Fig. 1B). One hundred and sixty-nine neurons were localized to the striatum and identified as TANs. In the anteroposterior plane from the anterior commissure (AC), neurons were recorded from AC −3 to AC +6 and AC −2 to AC +3, for Monkey M and Monkey Y, respectively. For Monkey M, only one neuron was recorded in AC −3 and none in AC −2; these two anteroposterior planes are not illustrated in Figure 1B. Neurons from AC +1 and posterior locations located in the putamen were considered as located in the sensorimotor part of the striatum. Neurons from AC +1 and posterior locations located in the caudate nucleus and all neurons anterior to AC +1 were considered as located in the associative part of the striatum (Parent and Hazrati, 1995).
Data analyses
All data analyses were performed using conventional statistical procedures with the R statistical computing environment (R Development Core Team, 2011).
Behavioral analyses.
Behavioral analyses were performed on data collected during the recordings of 169 TANs (81 from Monkey M; average number of trials, 92; range, 52–131; 88 from Monkey Y, average number of trials, 95; range, 55–117).
RTs, which were the times between the onset of the visual stimuli and the time at which the monkey started to increase his pressing force on the lever, were measured only for correct trials. The time at which monkeys started to increase their pressing force on the lever to reach the required force was determined manually by moving a cursor on the force graph trial by trial using LabVIEW. An automatic detection procedure, using the force derivate compared to a threshold, failed to give reliable values of RTs since monkeys were sometimes slightly releasing the lever (and decreasing their force) before pressing to reach the required force. Thus, manual detection was required. Since, on trials in which RTs could be automatically detected, values were identical to those that we could determined manually, we estimated that it was more reliable to analyze all trials with the same method, and did it manually. RTs were changed into z-scores for normalization purposes, and a two-way ANOVA was performed with required force and expected reward as the two factors. Error rates (ERs; i.e., the total number of errors performed in a condition divided by the total number of trials, both correct and error trials, performed in this condition) were calculated and compared with a Pearson's χ2 test. Each p value was corrected by Bonferroni correction and differences considered as significant when p < 0.0083 (0.05/6, six possible comparisons). In each condition, the proportion of omission and execution errors was determined by dividing the number of one type of error (execution or omission) by the total number of errors in the condition.
Electrophysiological analyses.
Electrophysiological data were analyzed only for correct trials performed during the recording sessions.
Determination of response periods.
TAN responses to rewarding stimuli have been described previously as being mainly multiphasic, with a pause followed by a rebound (Aosaki et al., 1995; Apicella et al., 1997, Ravel et al., 1999). This biphasic response could rarely be preceded by a short initial excitation. Thus, we will focus on the classically described pause and rebound (when it follows the pause) or elevation of discharge rate in the following analyses. To evaluate statistically the responses to the occurrence of the cues and the reward, we set unique test windows for all recorded TANs, and for each TAN, we counted the number of spikes within these windows for each neuron. The test windows were determined on the basis of the population histogram aligned on cues and reward onsets averaged across all recorded TANs, using the following procedure [based on the procedure of Shimo and Hikosaka, (2001)]. A sliding time window with a duration of 100 ms was moved in 10 ms steps starting at the onset of the cue, for the cue responses, and starting at the occurrence of the reward, for reward responses. We established four test windows, two for the decrease of TAN activity after cue and reward occurrence and two for the increase. The sliding window was moved until the averaged firing rate within the window was significantly different from the baseline firing rate (within a 900 ms window before the occurrence of the cues) for five consecutive steps (two-tailed t test, p < 0.001). For detection of a decrease in the firing rate, these significant differences had to be combined with a negative t value, and for detection of an increase in the firing rate, with a positive t value. The onset of the test windows were taken to be the beginning of the window that was the earliest among the five consecutive steps. The 100 ms window was further moved until the averaged firing rate was not significantly different from the baseline firing rate or the t value was no longer of the same sign for five consecutive steps. The offset of the test window was taken to be the beginning of the window that was the earliest among the five consecutive steps.
Presence or absence of cues responses.
We then determined whether each TAN showed a response. For each trial, we calculated the response firing rate in the four test windows (converted from the spike count within the window) and the baseline firing rate in the control window (900 ms period before onset of the cues). If the difference between the response and the baseline firing rate was statistically significant (Wilcoxon signed rank test, p < 0.05), it was judged that the TAN showed a response during this window. For the two windows targeting the decrease of TAN activity, it was verified that significant responses corresponded to decreases of the firing rate. For the two windows targeting the increases of TAN activity, it was also verified that significant responses were increases of the firing rate.
Force and reward selectivity.
To examine the force and reward sensitivities of TANs, we performed a two-way ANOVA on the spike count of each of the four determined response periods. We used the amount of force and the amount of reward as the two factors. We considered a TAN as modulated by the amount of force during a period if the p value “force” of the ANOVA was <0.05 in this period. In the same way, a TAN was considered as modulated by the amount of reward in a period if the p value “reward” of the ANOVA was <0.05 in this period. Finally, a TAN was considered as modulated by an interaction between the amount of force and the amount of reward in a period if the p value “interaction” of the ANOVA was <0.05 in this period. This analysis was performed on the entire population of TANs, not only those categorized as responsive, to avoid omission of nonresponsive TANs that could nevertheless be sensitive to the amount of a force and/or reward.
For each neuron and each period, we estimated a force selectivity index (FSI) and a reward selectivity index (RSI) to determine the weight of these modulations based on the firing rate for pairs of conditions with a common factor (same reward or same force; Peck et al., 2013). For each selectivity index (SI), we computed SI = (μ1 − μ2)/√[(SS1 + SS2)/(df1 + df2)], where μx is the firing rate during a given period, SSx is the sum of squares, and dfx is the degree of freedom (number of trials minus 1) for each pair of conditions described below (Peck et al., 2013). To calculate the FSI, we compared the neuronal activity during trials in the high force conditions (Fr and FR) to the neuronal activity during trials in the low force conditions (fr and fR). In the same way, to calculate the RSI, we compared, in the same periods, the neuronal activity during trials in the large reward conditions (fR and FR) with the neuronal activity during trials in the small reward conditions (fr and Fr). An index superior to zero indicated, for the force, a stronger modulation in the high force conditions, and for the reward, a stronger modulation in the large reward conditions. Similarly, an index inferior to zero indicated, for the force, a stronger modulation in the low force conditions, and for the reward, a stronger modulation in the small reward conditions.
Relation to the time of onset of the change in force.
Based on visual inspection of the rasters, the activity of some neurons seemed to be more aligned on the onset of the change in force (OCF) than on the occurrence of the cues. To investigate the influence of the OCF on the neuronal responses and determine whether those responses were triggered by the movement or by sensory information (cues), we performed the same series of analysis as described previously with the neuronal activity aligned on the OCF of the animals. Different methods described in the literature have been successfully used to investigate this question in other brain structures (DiCarlo and Maunsell, 2005; Lee et al., 2010). However, the electrophysiological properties of TANs made those methods unsuitable. Thus, we used an alternative method in which we successively defined periods of decrease and increase of activity around the OCF, determined whether each TAN showed a pause or an elevation of discharge rate, and examined the force and reward sensitivities of each TAN when its activity was aligned on the time of the OCF. To compare the amplitude of the response period of the whole population of TANs aligned on the occurrence of the visual stimuli versus that aligned on the OCF, a two-tailed t test was performed between the average firing rates of each significant bin defining the test window aligned on the cues versus each significant bin defining the test window aligned on the OCF.
A complementary analysis was performed, in situations in which a response was detected when the neuronal activity was aligned on cue occurrence and on the OCF, to specify which of these two events was most likely to modulate the response. A Wilcoxon rank sum test was performed to determine whether the detected pauses, aligned on the cues and on the OCF, were significantly different (in terms of magnitude) and which one was more pronounced. The same tests were performed for the elevation of the discharge rate.
Results
Behavioral results: modulation of the behavioral responses by the force required and the expected reward size
Reaction times
Average RTs to start increasing the force on the lever after the occurrence of visual stimuli were computed from the correct trials only (7480 from Monkey M, 8468 from Monkey Y). RTs were significantly shorter in the large reward conditions than in the small reward ones in Monkey M (two-way ANOVA on RT z-score, preward = 7.97.10−15, F = 60.59), and there was no significant difference among the RTs in the low or high force conditions for this monkey (Fig. 2A). There was no significant difference among the RTs of Monkey Y (Fig. 2E).
Figure 2.

A–H, Behavioral results for Monkey M (A–D) and Monkey Y (E–H). A, E, Reaction times of the animals in the four conditions of the task. R, Small reward; R, large reward; solid black line, high force; dashed gray line, low force. The error bars represent the SEM. B, F, Error rates of the animals in the four conditions of the task (same conventions as in A, E). C, G, Acceptance level of the animals in the four conditions of the task (fR, low force/large reward; FR, high force/large reward; fr, low force/small reward; Fr, high force/small reward). D, H, Mean of the force developed by the animals in the four conditions of the task. Dark gray lines, Large reward; light gray lines, small reward; thick lines, high force; thin lines, low force. Asterisks indicate for the reaction times the influence of each factor on the animal's behavior (two-way ANOVA. **p < 0.05; ***p < 0.001) and for the error rates the differences among conditions (Pearson's χ2 test; ***p < 0.001, corrected).
Error rates
ERs were computed from the total number of trials performed by the animals (9115 from Monkey M, 10221 from Monkey Y), including correct and error trials. The ERs were significantly higher in the small reward than large reward conditions for the same force developed (low force, p = 3.27.10−14 and 1.44.10−17, χ2 = 57.57 and 72.79 for Monkeys M and Y, respectively; high force, p = 5.43.10−43 and 1.49.10−31, χ2 = 188.94 and 136.57 for Monkeys M and Y, respectively; Fig. 2B,F). Moreover, for the same expected reward, the ERs were significantly higher in the high than low force conditions (small reward, p = 8.05.10−53 and 0.00058, χ2 = 233.99 and 11.85 for Monkeys M and Y, respectively; large reward, p = 9.28.10−21, χ2 = 87.31 for Monkey M, nonsignificant for Monkey Y).
Acceptance level
For each monkey, we ranked the level of motivation in each of the four conditions by computing an acceptance level from the number of omission errors. For both monkeys, the four conditions could be ranked in the same order of preference: low force/large reward (fR); high force/large reward (FR); low force/small reward (fr); high force/small reward (Fr) (Fig. 2C,G). In both monkeys, the amount of reward seemed to be more important than the level of effort in the decision of animals to perform the task. In the fR condition, monkeys performed the action in 99.3% (Monkey M) and 97.6% (Monkey Y) of trials presented to them. On the contrary, in the Fr conditions, monkeys performed the action in 82.4% (Monkey M) and 83.7% (Monkey Y) of trials. For both monkeys, “intermediate” conditions (FR and fr) were ranked following the same order: they accepted FR trials more frequently (97% for Monkey M, 95.3% for Monkey Y) than fr trials (92% for Monkey M, 94.7% for Monkey Y). The relatively low level of acceptance in the Fr condition suggests that an higher effort and smaller amount of reward are perceived by the animals as being associated with a negative motivational value.
Figure 2, D and H, represents the average force developed by each monkey in the four conditions and shows that the monkeys did not modulate their force on the lever as a function of the expected reward.
Electrophysiological results
Localization of the recordings
One-hundred and sixty-nine neurons were localized to the striatum and identified as TANs.
All recorded neurons were located in the associative (138 neurons, 81.7%) and the sensorimotor (31 neurons, 18.3%) parts of the striatum. We did not investigate the ventral striatum. No obvious difference between each population of neurons during the defined periods of analysis in the encoding of the force and the reward was found. Neurons with positive and negative FSI (indicating a stronger variation in activity in high force conditions if positive, and in low force conditions if negative) and RSI (indicating a stronger variation in activity in large reward conditions if positive, and in small reward conditions if negative) were intermixed throughout the regions of the striatum from which we recorded.
Response of TANs to motivational relevant stimuli and to reward
We recorded from 169 TANs in two monkeys. The firing rate of TANs was 6.01 ± 1.1 (mean ± SD; n = 169), ranging from 2.7 to 9.1 spikes · s−1.
Data from the literature have shown that TANs respond to unpredictable stimuli, associated with reward (Aosaki et al., 1995; Apicella et al., 1997). In line with previous reports, we found that most TANs responded to motivational relevant visual stimuli (called “cues” in the following text) while the monkeys performed the instrumental task. Based on the population histogram aligned on the cues onset (Fig. 3A), a significant decrease (called “pause” in the following text) in TAN activity after the occurrence of the cues was found between 60 and 280 ms. A significant increase (called “rebound” if preceded by a pause or “elevation of discharge rate” in the following text) occurred between 300 and 530 ms. Following the same procedure for the reward occurrence (Fig. 3B), the pause in TAN activity was found between 20 and 280 ms, and the elevation of the discharge rate occurred between 450 and 610 ms. In response to cues and reward, no significant difference in the number of neurons showing a pause (χ2 = 1.85, p = 0.17 for cues, χ2 = 0, p = 1 for reward) or in the number of neurons showing an elevation of the discharge rate (χ2 = 3.42, p = 0.06 for cues, χ2 = 0.49, p = 0.49 for reward) was found between the two monkeys. Consequently, data from Monkey M and Monkey Y were pooled for further analyses of cues and reward responses.
Figure 3.

Periods of analysis after the occurrence of cues and reward. A, Population activity aligned on cue occurrence and corresponding t values of the comparison between the baseline activity and the activity during a 100 ms sliding window beginning after the occurrence of the cues. The two gray rectangles illustrate the two periods of analysis based on the statistical difference found with the baseline. The pause occurred between 60 and 280 ms, and the elevation of the discharge rate between 300 and 530 ms after cue occurrence. B, Population histogram aligned on reward occurrence (same conventions as in A). The pause occurred between 20 and 280 ms, and the elevation of the discharge rate between 450 and 610 ms after reward occurrence. C–F, Raster plots of four examples of TANs. Each line represents a trial, and each point represents a spike; the smoothed lines on the raster represent the spike density (σ = 50). Trials are ranked according to the four conditions of the task. C, Neuron showing a positive force effect during the elevation of the discharge rate after the occurrence of the visual stimuli. D, Neuron showing a negative reward effect during the elevation of the discharge rate after the occurrence of the cues. E, Neuron showing an interaction effect during the pause after reward occurrence. Its activity decreased critically in the FR condition. F, Neuron showing a negative reward effect during the elevation of the discharge rate after the reward occurrence.
Results described below are summarized in Table 1. The majority of TANs (92 of 169; 54%) showed a modulation of their activity in response to the cues: 33% (57 of 169) showed a pause, 34% (58 of 169) an elevation of the discharge rate, and 14% (23 of 169) a pause followed by a rebound. Previous reports on TAN responses to appetitive stimuli have mainly described decreases in activity (pauses; Aosaki et al., 1995; Apicella et al., 1997; Ravel et al., 1999; Morris et al., 2004). Given the large number of elevations in the discharge rate observed in our data, we checked that neurons recorded were not belonging to different populations by comparing the average firing rates and interspike intervals (ISIs). There was no difference in the average firing rate nor in the average ISI of neurons showing a pause or a combination of a pause followed by a rebound (N = 134; average firing rate, 6.02 ± 1.1; average ISI, 158.17 ± 31.86) or of neurons showing only an elevation of discharge rate (N = 35; average firing rate, 5.99 ± 1.21; average ISI, 160.72 ± 33.43; t test, p > 0.05).
Table 1.
Responses of TANs in both monkeys, after cue and reward occurrence
| Responsive | Cues | Reward | Cues and reward | |
|---|---|---|---|---|
| Pause | 105/169 (62.1%) | 57/169 (33.7%) | 67/169 (39.6%) | 19/169 (11.2%) |
| Elevation | 87/169 (51.5%) | 58/169 (34.4%) | 47/169 (27.8%) | 18/169 (10.7%) |
| Pause and elevation | 36/169 (21.3%) | 23/169 (13.6%) | 16/169 (9.5%) | 3/169 (1.8%) |
| At least one | 136/169 (80.5%) | 92/169 (54.4%) | 98/169 (58.0%) | 54/169 (32.0%) |
The row headings indicate the type of modulation (a pause, an elevation of the discharge rate, both, or at least one of the two). The columns indicate the period of modulation (after the cues and/or the reward, only after the cues, only after the reward, or after cues and reward).
TANs show responses to unpredictable rewards and usually lose their responses to reward when it is associated with a conditioned stimulus (Apicella et al., 1997; Ravel et al., 2003). Here, the majority of TANs (98 of 169; 58%) showed a modulation of their activity in response to the reward, even though it was preceded by visual cues and predictable. The population of TANs showing a pause (67 of 169; 40%) was larger than that showing an elevation of the discharge rate (47 of 169; 28%; χ2 = 4.78, p = 0.029). Nine percent (16 of 169) showed a pause followed by a rebound. There was no significant difference between the number of responses to the cues and to the reward (χ2 = 0.30, p = 0.58), for both pauses (χ2 = 1.03, p = 0.31) and elevations of the discharge rate (χ2 = 1.38, p = 0.24). As for the cues, we checked, for modulations after the reward, that the neurons showing a pause or an elevation in discharge rate were belonging to comparable populations. We found no difference in the average firing rate nor in the average ISI of neurons showing a pause or a combination of a pause followed by a rebound (N = 138; average firing rate, 6 ± 1.2; average ISI, 159.13 ± 34.38) and of neurons showing only an elevation of discharge rate (N = 31; average firing rate, 6.07 ± 0.77; average ISI, 156.77 ± 19.26; t test, p > 0.05).
It has been shown that TAN responses transfer from the reward to the preceding conditioned stimulus during learning (Apicella et al., 1997). However, in our task, we found a large number of neurons presenting modulations after cues and also after reward occurrence. We thus examined whether the same population of neurons responded to the cues, the reward, or both or whether there were distinct populations. We found that neurons showing significant pause or elevation in their firing rate responded to the cues, to the reward, or to both. Fifty-seven neurons responded by a pause only to the cues, 67 neurons responded only to the reward, and 19 neurons showed a pause to both the cues and the reward. Similarly, 58 neurons responded by an elevation of the discharge rate only to the cues, whereas 47 only showed this elevation after the reward. Eighteen neurons presented an elevation of the discharge rate to both the cues and the reward. The number of neurons showing modulations to both events (N = 19 and 18, respectively, for pause and elevation of the discharge rate) is not significantly different from the number we could have observed by chance. We calculated the percentile reflecting the chance to find this number of neurons that would respond to both events, replicated 20,000 times. We got an equivalent p value of >0.025, which means that the population of neurons showing a response to the cues is independent of the one showing a response to the reward for both pause and elevation of the discharge rate.
In summary, in our task, TANs did not respond preferentially to the cues or the reward, and responses to each event were independent; i.e., a response to one event did not preclude nor predict a response to the other, unlike what has been shown in previous reports using different behavioral tasks, in which neurons tend to lose their responses to the reward during learning of the association of reward to a conditioned stimulus. After the occurrence of the cues, we observed an equivalent number of neurons showing a pause or an elevation of the discharge rate, whereas after the reward occurrence, the predominant response was a pause.
Modulation of TAN activity by the amounts of force and reward
Responses of TANs have been shown to be modulated by the motivational significance of stimuli (Ravel et al., 1999, 2003; Blazquez et al., 2002; Joshua et al., 2008). In our task, the visual cues carried different motivational significance depending on the required force and the expected reward. We examined whether this motivational significance, translated behaviorally as shown by the acceptance levels and error rates of the animals and which should be computed from the information on force and reward, would also modulate the activity of TANs, qualitatively or quantitatively. A two-way ANOVA on the spike count within each of the four determined response periods was performed. For better reading, a modulation of the neuronal activity by the amount of force will be called a “force effect,” and a modulation by the amount of reward a “reward effect.” All neurons, not only those categorized as responsive, were taken into account to include neurons that would respond in only two conditions and show a modulation by the amount of force or reward but might not be considered as responsive if all conditions were combined. Results described in the following paragraphs are displayed in Table 2. After the occurrence of the cues, only 12% (21 of 169) of TANs showed a modulation during the pause: 4% (7 of 169) showed a force effect, 3% (6 of 169) a reward effect, and 5% (8 of 169) an interaction effect. Conversely, during the elevation of the discharge rate after the occurrence of the cue, we observed a strong modulation of the neuronal activity, with 37% (62 of 169) of TANs modulated. Surprisingly, we observed a similar proportion of TANs showing a reward effect (29 of 169; 17%) and a force effect (34 of 169; 20%). TANs showed an interaction effect (10 of 169; 6%) usually associated with a force or reward main effect (7 of 169; 4%). We noticed that very few neurons showed both force and reward main effects (4 of 169; 1%), suggesting that these types of information were encoded by independent groups of neurons. We calculated the percentile reflecting chance to find the number of neurons that would encode both force and reward information (replicated 20,000 times). We got an equivalent p value of >0.025, meaning that the group of neurons showing a force effect is independent of the one showing a reward effect. Thus, the encoding of force was neither predictive nor preclusive to the encoding of reward and vice versa. Figure 3 shows two examples of neurons illustrating the force effect (Fig. 3C) and the reward effect (D) during this period. The neuron in Figure 3C has more pronounced pauses and elevations of the discharge rate in the high force conditions (FR and Fr) compared to the low force conditions (fR and fr), whereas the neuron in Figure 3D shows a stronger elevation of the discharge rate in the small reward conditions (Fr and fr) than in the large reward ones (fR and FR).
Table 2.
The row headings indicate the type of modulation (all, force effect, positive FSI, negative FSI, reward effect, positive RSI, and negative RSI) or an interaction effect

“All” corresponds to neurons showing a force, a reward, and/or an interaction effect. The columns indicate periods (cues and reward) and types of modulation (pause or elevation in discharge rate). On the right, Venn diagrams reprensent the distribution of neurons showing a force (top) or a reward (bottom) effect during the elevations of the discharge rate after the cues, the reward, or both.
After the reward occurrence, 24% (40 of 169) of TANs showed a modulation during the pause: 7% (12 of 169) showed a force effect, 11% (18 of 169) a reward effect, and 9% (15 of 169) an interaction effect. Only 10% (4 of 40) of the modulated neurons showed a combination of two of the three effects (force, reward, and/or interaction). Figure 3E shows an example of neuron with an interaction effect during the pause following the reward occurrence. This neuron shows a stronger response in the FR condition compared to the fR condition and does not respond in fr and Fr conditions. During the elevation of the discharge rate after the reward occurrence, 25% (43 of 169) showed a modulation. A larger proportion of neurons showed a reward effect (26 of 169; 15%) than a force effect (12 of 169; 7%; χ2 = 5.01; p = 0.025) or an interaction effect (9 of 169; χ2 = 8.16; p = 0.004). Only 9% (4 of 43) of the modulated neurons showed a combination of two of the three effects (force, reward, and/or interaction). Figure 3F shows an example of neuron with a reward effect during the elevation of the discharge rate following the reward occurrence, with a stronger elevation in the small reward conditions (fr/Fr) compared to the large ones (fR/FR).
Weight and direction of activity modulation by force and reward after the occurrence of the cues and the reward
An FSI and an RSI were estimated for each neuron in each period (see Materials and Methods). Results are detailed in the following section and are summarized in Table 2. During the pause following the occurrence of the cues, the small number of significant neurons did not allow us to test the direction of these modulations (Fig. 4A,B). During the elevation of the discharge rate following the occurrence of the cues, more force-modulated neurons exhibited a positive FSI than a negative one (27 of 34, 79% vs 7 of 34, 21%; mean, 0.36; binomial test, p < 0.001; Fig. 4C). Additionally, during the same period, more reward-modulated neurons exhibited a negative RSI than a positive one (22 of 29, 76% vs 7 of 29, 24%; mean, −0.38; binomial test, p < 0.01; Fig. 4C). None of the neurons was part of the two groups of neurons (positive FSI and negative RSI). We calculated the percentile reflecting the chance to find no neuron that would encode both a positive FSI and negative RSI (replicated 20,000 times). We got an equivalent p value of <0.025, meaning that the group of neurons showing a positive FSI is different from the one showing a negative RSI. Thus, the encoding of a positive FSI excludes the encoding of a negative RSI, and vice versa. This result supports the idea that positive force and negative reward information were integrated by two populations of neurons during the elevation of the discharge rate in neuronal activity after the cues (Fig. 4E,F). One population of neurons encoded the force information carried by the cues when the force to exert on the lever, the cost of the action, was high, whereas another one encoded the reward information carried by the cues when the expected reward, the benefit of the action, was small (Fig. 4C).
Figure 4.
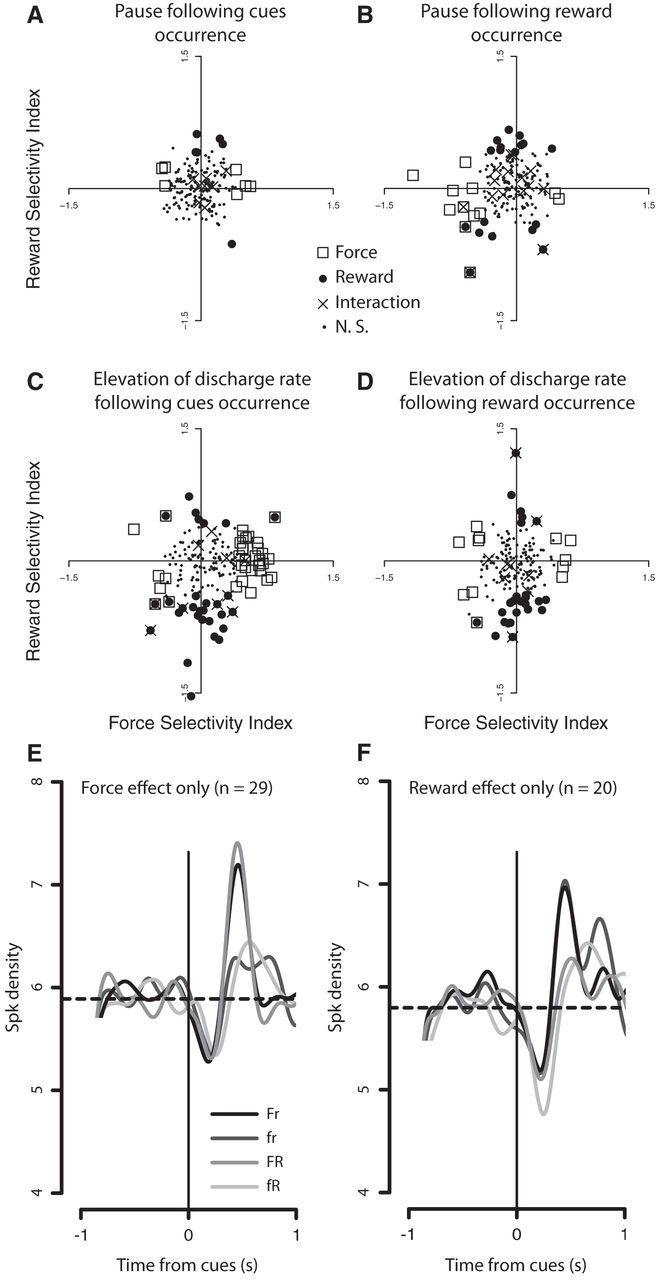
A–D, Force and reward selectivity indices (FSI and RSI) of TANs during the pause (A, B) and the elevation of the discharge rate (C, D) after cue (A, C) and reward occurrence (B, D). Scatter plots of force versus reward selectivity indices for each individual neuron in both periods. FSIs of >0 indicate higher firing rate in the high force conditions, and indices of <0 indicate higher firing rates in the low force conditions. RSIs of >0 indicate higher firing rates in the large reward conditions, and indices of <0 indicate higher firing rates in the small reward conditions. Symbols indicate the significance of the modulation for each neuron when we performed a two-way ANOVA (squares, force; filled circles, reward; crosses, interaction; small filled circles, neurons without significant modulation). E, Average spike density (σ = 80) of the neurons modulated only by the amount of force (n = 29) during the elevation of the discharge rate after the occurrence of the cues. The horizontal dashed line represents the baseline activity of this population of neurons. The four shades represent, from the black to the lightest gray, the high force/small reward, low force/small reward, high force/large reward, and small force/large reward conditions, respectively. F, Average spike density (σ = 80) of the neurons modulated only by the amount of reward (n = 20) during the elevation of the discharge rate after the occurrence of the cues (same conventions as in E).
During the pause following the reward occurrence, 83% (10 of 12) of TANs modulated by the amount of force exhibited a negative FSI, against only 17% (2 of 12) exhibiting a positive FSI (mean, −0.45; binomial test, p < 0.05). During the same period, similar proportions of neurons modulated by the amount of reward exhibited a negative RSI (8 of 18; 44%) and a positive one (10 of 18; 56%). Only two neurons were included in both populations. During the elevation of the discharge rate following the reward occurrence, a similar proportion of neurons modulated by the amount of force exhibited a positive FSI (5 of 12; 42%) and a negative FSI (7 of 12; 58%), whereas most of the neurons modulated by the amount of reward exhibited a negative RSI (20 of 26; 77%), and few a positive one (6 of 26; 23%; mean, −0.28; binomial test, p < 0.01; Fig. 4D). The encoding of the amount of force during the elevation of the discharge rate following the cues and the encoding of the amount of force during the elevation of the discharge rate following the reward were found in separate neuronal populations. Only one neuron was included in both groups. In contrast, of the 26 neurons showing a reward effect during the elevation of the discharge rate following the reward occurrence, 11 (42%) showed this modulation following the occurrence of the cues as well (Table 2).
Influence of the OCF on the activity of TANs
Response period time locked on the onset of the change in force.
Previous reports have mentioned TAN responses occurring at the time of movement onset (Lee et al., 2006; Benhamou et al., 2014). In their tasks, the movement is either the only event leading to a reward or plays a crucial role in succeeding in a trial. Even though it was not the case in our task, the control of the required force was an important parameter in performing a correct trial. Thus, despite the fact that it has rarely been reported, we studied the pattern of activity of TANs when the neuronal activity was aligned on the OCF. We observed an influence of the performance of the animal on the cue responses of TANs (Fig. 5A). Aligned on the time of OCF of the monkeys, the significant decrease of TAN activity was found between −190 and −10 ms. This pause had a shorter duration than that found when the activity was aligned on the cues; it was also more pronounced when the activity was aligned on the time of OCF (mean, 5.14 Hz; minimal frequency, 4.52 Hz) than on cue occurrence (mean, 5.42 Hz; minimal frequency, 5.07 Hz; t = −2.23; p = 0.036; Fig. 5B). When aligned on the time of OCF, the significant increase of TAN activity was found between 0 and 250 ms. The size of the elevation of the discharge rate was found to be similar if aligned on the time of OCF of the animals (mean, 6.64 Hz; maximal frequency, 7.16 Hz) or aligned on the occurrence of the cues (mean, 6.60 Hz; maximal frequency, 6.87 Hz; t = 0.54; p = 0.59; Fig. 5B). However we observed that when the neuronal activity was time locked to the OCF, the beginning of the elevation of the discharge rate corresponded exactly to the beginning of the movement of the animals.
Figure 5.

Influence of the onset of the change in force on the pause and the elevation of the discharge rate after cue occurrence. A, Example of the activity of a TAN (all conditions mingled). Left, Activity is aligned on the cue occurrence. Center, Activity is aligned on cue occurrence and sorted by the time of the OCF of the animal (down, trial with the shortest RT; up, trial with the longest RT). Right, Activity aligned on the OCF. This neuron exhibited a more pronounced pause and a more pronounced elevation of the discharge rate. B, Population histogram aligned on the OCF (same conventions as in Fig. 3A). The pause occurred between −190 and −10 ms, and the elevation of the discharge rate between 0 and 250 ms around the OCF. The period of pause is narrower and more pronounced when aligned on the OCF. C, Venn diagrams reprensent the number of neurons showing a pause (top) or an elevation of the discharge rate (bottom) when the activity was aligned on cue occurrence (left), the OCF (right), and both. For this latter case, the numbers of neurons showing a statistically significant or nonsignificant pause or elevation in discharge rate with one or the other alignment are indicated at the bottom of each diagram. D, Pie charts illustrate the number of neurons showing a force (top) or a reward (bottom) effect during the elevation of the discharge rate when the activity was aligned on the cue occurrence (black) or on the OCF (gray). The hatched black area represents the number of neurons with a stronger effect when the activity was aligned on the cue occurrence, and the hatched gray area represents the number of neurons with a stronger effect when the activity was aligned on the OCF.
Number of responsive neurons time locked to the onset of the change in force.
The analysis of the activity of TANs time locked to the OCF revealed that 57% of the recorded neurons (96 of 169) showed a significant pause in their activity in relation to this event. This proportion of neurons was higher than that observed when the activity was aligned on the occurrence of the cues (96 of 169 vs 57 of 169, χ2 = 17.24, p = 3.29.10−5). Among these neurons, half of them (48 of 96; 50%) showed a pause in their activity only if the electrophysiological signal was time locked to the OCF. In contrast, among the neurons showing a pause when their activity was aligned on the cues, 16% (9 of 57) showed a pause only if their activity was time locked to the cues. Consequently, in 48 neurons, the pause was detected in both cases. Among these neurons, the pause was more pronounced when the activity was time locked to the OCF in 9 neurons (19%; Wilcoxon rank sum text, p < 0.05) and to cue occurrence in 10 neurons (21%; Wilcoxon rank sum text, p < 0.05; Fig. 5C). Since the pause occurred before the initiation of the movement, it could not be concluded that this response was triggered by the force-generating movement. However, considering the higher number of responses detected and the higher magnitude of the responses when activities ware aligned on the time of OCF, we can hypothesize that the characteristics of the pause of TANs were dependent on the OCF. For example, beside the variation of magnitudes observed, the end of the pause was time locked on the OCF.
When the activity was time locked to the OCF, 39% (66 of 169) of the recorded neurons showed an elevation of the discharge rate in their activity, versus 33% (58 of 169) when the activity was aligned on the cues (χ2 = 0.62, p = 0.43). Among these neurons, only 13 of 66 (20%) showed an elevation of the discharge rate in their activity only if it was time locked to the OCF, and 9% (5 of 58) only if it was aligned on the occurrence of the cues. Consequently, in 53 neurons, the elevation of the discharge rate was detected in both cases. Among these neurons, the elevation of the discharge rate was greater when the activity was time locked to the OCF in 18 neurons (34%; Wilcoxon rank sum text, p < 0.05) and to cue occurrence in 26 neurons (49%; Wilcoxon rank sum text, p < 0.05; Fig. 5C). Consequently, compared to the pause, the elevation of the discharge rate seemed to be less influenced by the OCF.
Influence of the OCF on the force and reward selectivity indices.
The distributions of the FSIs and the RSIs were compared when the elevation of the discharge rate of TANs was aligned on cue occurrence or time locked to the OCF. Eighteen of 34 neurons (53%) were modulated by the amount of force for both alignments. The activity of 16 additional neurons was modulated only when their activity was aligned on the time of OCF. On the 18 neurons modulated by the amount of force in both cases, 12 (67%) neurons showed a higher FSI with their activity time locked to the OCF, and 6 neurons when their activity was time locked to cue occurrence (Fig. 5D). There were no differences in the distribution of the FSIs between these two populations. In both cases, the majority of TANs were more modulated in the high force conditions (time locked to cues, mean, 0.36; time locked to OCF, mean, 0.43). Consequently, one population of TANs seemed to encode the information related to the effort to develop force independently of the movement initiated by the animal. Another group of TANs showed significant or larger modulations when aligned to the time of OCF.
Seventeen out of 29 neurons (59%) were modulated by the amount of reward for both alignments. The activity of 16 additional neurons was modulated only when their activity was aligned to the time of OCF. Of the 17 neurons modulated by the amount of reward in both cases, 10 neurons showed a higher RSI with their activity time locked to the OCF, versus a higher RSI in 7 neurons when time locked to cue occurrence (Fig. 5D). There was no difference in the distribution of the RSIs between these two populations. In both cases, the majority of TANs were more modulated in the small reward conditions (time locked to cues, mean, 0.38; time locked to OCF, mean, −0.46). As before, one population of TANs seemed to encode the information related to the amount of reward independently of the movement initiated by the animal, whereas another one was very sensitive to the OCF.
Discussion
The present study revealed new features of TAN responses in an instrumental task modulating motivation. First, we found a large number of TANs responding to cues and/or reward occurrence by a pause or an elevation of the discharge rate in their activity. Second, this elevation, but not the pause, was modulated by the force required and expected reward in each trial, and was most sensitive to high force or small reward conditions. Finally, TAN responses appeared to be better aligned on the time of OCF than on cue occurrence (triggered by the latter, but time locked on the former). These data suggest that the striatal TAN population is not as homogeneous as previously reported, and that TANs can be involved in encoding either force or reward parameters.
TANs respond to both cues and reward
TANs are known to respond to temporally unpredictable reward or conditioned stimulus associated with reward and to lose their response to reward with learning (Aosaki et al., 1994, 1995; Apicella et al., 1997). Compared to these findings, our results have shown that a relatively small number of TANs were responsive to the temporally unpredictable visual cues associated with reward. Conversely, a large number of TANs was found to be responsive to the reward itself, even though it was predictable in time and quantity. It could be concluded that TANs held their response until the reward delivery because the animals did not know the significance of the cues; however, the behavioral results clearly demonstrate that they understood it and modulated their behavior accordingly (ERs and acceptance levels). Finding neurons responding to cues and to reward in the TAN population suggests that when there is an added complexity in the task, these neurons will encode more than the temporal predictability of a rewarding stimulus. Neurons responsive to the cues could encode the stimulus–reward association, as described previously, neurons responsive to the reward could encode the reward value. In the present task, the reward value can change from trial to trial. One hypothesis is that there is an estimation of this value by the animals at the cue's occurrence, and that its accuracy is updated by the neurons responding to the reward.
Pauses and elevations of the discharge rate in TAN activity encode different features of the task
Biphasic properties of TAN responses have been observed in response to unpredictable rewards or conditioned stimuli with motivational significance (Aosaki et al., 1994; Ravel et al., 2003; Yamada et al., 2004; Joshua et al., 2008). The neurons recorded here also showed cue- and reward-dependent pauses and elevations of the discharge rate. However, in contrast to prior findings, only a small proportion of TANs responded by a full biphasic combination of a pause followed by a rebound (Aosaki et al., 1995; Apicella et al., 1997; Ravel et al., 1999). These results build upon prior findings that TAN activity is largely influenced by context (Yamada et al., 2004; Apicella et al., 2009, 2011). In the context of our more complex cognitive task, TANs present less homogeneous responses. TANs can influence the surrounding striatal PANs by a pause or an elevation of the discharge rate in their activity. Concerning the latter, TANs were found to independently encode force and reward selectively. Since TANs are considered to be cholinergic interneurons, their tonic activity should correspond to a continuous acetylcholine (ACh) release that would stabilize PANs in an “up” (depolarized) or “down” (hyperpolarized) excitability state (Wilson et al., 1983; Calabresi et al., 1990a,b, 2000). A pause corresponds to ACh decrease, which creates a plasticity window for a change in the excitability state of PANs triggered by other afferents. In contrast, an elevation of the discharge rate should correspond to increased ACh release, serving to stabilize this new excitability state (Akins et al., 1990; Aosaki et al., 1995; Stern et al., 1998). Schulz and Reynolds (2013) suggest that the pause is relatively independent of stimulus significance, whereas the elevation of the discharge rate is more likely to be influenced by the context and involved in the mediation of action in response to external stimuli. This conceptualization is in line with the present results showing that the cue-dependent pause showed little modulation by force or reward. Conversely, both factors were encoded during the elevation of the discharge rate, with very little interaction and by independent neuronal populations. The pause after the cues might thus signal the presence of salient stimuli, triggering trial performance, as described in tasks with cues carrying single information. The elevation of the discharge rate might carry more specific information regarding the motivational level of the animals, given the force required and the expected reward.
After the reward, the pause was equally modulated by force, reward, or a force–reward interaction, suggesting that the task parameters are integrated by the pause of the TANs at the time of the outcome. As discussed above, TANs showing a pause after the reward could allow a check in the accuracy of the reward value prediction and an update of this value if necessary, via the plasticity window created by the decrease in ACh release. It is also in line with the properties of TANs to encode reward prediction error reported previously (Apicella et al., 2011). In our data, the elevation of the discharge rate after reward occurrence was bigger for a smaller reward. It has been suggested that this increase in activity is involved in maintaining the behavior in response to external stimuli (Yarom and Cohen, 2011; Schulz and Reynolds, 2013). Thus, in the present results, it could be a signal to PANs to reinforce the movement despite the small amount of reward received, while the pause modulation could allow a differential influence of striatal afferents onto PANs such that a reward received can have a distinct value depending on its size and the effort required to obtain it.
The elevation in discharge rate is mainly modulated after least attractive cues and small reward
Modulation of the elevation of the discharge rate in TAN activity after cue occurrence was higher in the high force and small reward conditions. Apicella et al. (2011) described similar modulations of TANs' elevation in discharge rate after the reward when its probability was lowest, suggesting that TANs could encode a positive reward prediction error. Our observations suggest an alternative explanation. It could be that, in both the task in the study by Apicella et al. (2011) and the current task, TANs encode the high cost–small benefit condition. In the present task, the elevation of the discharge rate is most modulated by the least attractive cues, either indicating a high effort or a small reward, in two different groups of TANs. In the task used by Apicella et al. (2011), the elevation in discharge rate modulation could reflect the fact that an animal could have to work up to four times more to receive the same reward in the lowest probability condition. In both studies, the modulation occurred after the event carrying information about effort and reward. In the present study, this modulation was after the cues, whereas in the study by Apicella et al. (2011) it was after the reward when information was computed by the animal.
TAN responses are triggered by the cues but largely time locked to the OCF
Pauses in TAN activity triggered by the cues were more pronounced when aligned on the movement onset, and elevations of the discharge rate were better time locked to the OCF. This suggests that TAN activity could be modulated by the movement of the animals, a feature rarely reported. One hypothesis to explain this new property could be that, in the present task, the behavioral response required to succeed in the trial relies on movement modulation. In monkeys, Lee et al. (2006) described modulations around the time of the movement linked to the fact that the movement could be self-initiated in some conditions in their task. In rats, Benhamou et al. (2014) reported an excitation during movement and hypothesized that the absence of such modulation in monkeys could rely on the differences in the protocols used, and thus on the behavioral context. In the present study, the modulation of the movement and the condition in which it is performed, as in the study by Lee et al. (2006), are prominent features of succeeding in the task, and might explain the influence of the OCF on TAN activity. Functionally, the pauses time locked to the OCF could serve to potentiate the movement, when it is a key feature of a task, by influencing striatal projection neuron excitability and allowing the expression of thalamic and cortical afferents.
The present results demonstrate new features in TAN response properties, particularly in poorly attractive conditions, but also their potential involvement in movement modulation, in a task demanding different efforts to get various rewards. If TAN responses can differentiate the animals' preference for performing high cost and low benefit ratio trials, it would be interesting to test whether TAN response properties at the time of the cue predict the decision of an animal to perform any given trial, based on its motivation.
Footnotes
This work was supported by Centre National de la Recherche Scientifique and the Fondation de France (Grant 2008 005902). We thank Drs. Paul Apicella, Christelle Baunez, and Janine Simmons for helpful comments and discussions.
The authors declare no competing financial interests.
References
- Adler A, Katabi S, Finkes I, Israel Z, Prut Y, Bergman H. Temporal convergence of dynamic cell assemblies in the striato-pallidal network. J Neurosci. 2012;32:2473–2484. doi: 10.1523/JNEUROSCI.4830-11.2012. [DOI] [PMC free article] [PubMed] [Google Scholar]
- Akins PT, Surmeier DJ, Kitai ST. Muscarinic modulation of a transient K+ conductance in rat neostriatal neurons. Nature. 1990;344:240–242. doi: 10.1038/344240a0. [DOI] [PubMed] [Google Scholar]
- Aosaki T, Tsubokawa H, Ishida A, Watanabe K, Graybiel AM, Kimura M. Responses of tonically active neurons in the primate's striatum undergo systematic changes during behavioral sensorimotor conditioning. J Neurosci. 1994;14:3969–3984. doi: 10.1523/JNEUROSCI.14-06-03969.1994. [DOI] [PMC free article] [PubMed] [Google Scholar]
- Aosaki T, Kimura M, Graybiel AM. Temporal and spatial characteristics of tonically active neurons of the primate's striatum. J Neurophysiol. 1995;73:1234–1252. doi: 10.1152/jn.1995.73.3.1234. [DOI] [PubMed] [Google Scholar]
- Apicella P. Tonically active neurons in the primate striatum and their role in the processing of information about motivationally relevant events. Eur J Neurosci. 2002;16:2017–2026. doi: 10.1046/j.1460-9568.2002.02262.x. [DOI] [PubMed] [Google Scholar]
- Apicella P, Scarnati E, Schultz W. Tonically discharging neurons of monkey striatum respond to preparatory and rewarding stimuli. Exp Brain Res. 1991;84:672–675. doi: 10.1007/BF00230981. [DOI] [PubMed] [Google Scholar]
- Apicella P, Legallet E, Trouche E. Responses of tonically discharging neurons in the monkey striatum to primary rewards delivered during different behavioral states. Exp Brain Res. 1997;116:456–466. doi: 10.1007/PL00005773. [DOI] [PubMed] [Google Scholar]
- Apicella P, Deffains M, Ravel S, Legallet E. Tonically active neurons in the striatum differentiate between delivery and omission of expected reward in a probabilistic task context. Eur J Neurosci. 2009;30:515–526. doi: 10.1111/j.1460-9568.2009.06872.x. [DOI] [PubMed] [Google Scholar]
- Apicella P, Ravel S, Deffains M, Legallet E. The role of striatal tonically active neurons in reward prediction error signaling during instrumental task performance. J Neurosci. 2011;31:1507–1515. doi: 10.1523/JNEUROSCI.4880-10.2011. [DOI] [PMC free article] [PubMed] [Google Scholar]
- Benhamou L, Kehat O, Cohen D. Firing pattern characteristics of tonically active neurons in rat striatum: context dependent or species divergent? J Neurosci. 2014;34:2299–2304. doi: 10.1523/JNEUROSCI.1798-13.2014. [DOI] [PMC free article] [PubMed] [Google Scholar]
- Blazquez PM, Fujii N, Kojima J, Graybiel AM. A Network representation of response probability in the striatum. Neuron. 2002;33:973–982. doi: 10.1016/S0896-6273(02)00627-X. [DOI] [PubMed] [Google Scholar]
- Brown LL, Schneider JS, Lidsky TI. Sensory and cognitive functions of the basal ganglia. Curr Opin Neurobiol. 1997;7:157–163. doi: 10.1016/S0959-4388(97)80003-7. [DOI] [PubMed] [Google Scholar]
- Calabresi P, De Murtas M, Mercuri NB, Bernardi G. Kainic acid on neostriatal neurons intracellularly recorded in vitro: electrophysiological evidence for differential neuronal sensitivity. J Neurosci. 1990a;10:3960–3969. doi: 10.1523/JNEUROSCI.10-12-03960.1990. [DOI] [PMC free article] [PubMed] [Google Scholar]
- Calabresi P, Mercuri NB, Bernardi G. Synaptic and intrinsic control of membrane excitability of neostriatal neurons. II. An in vitro analysis. J Neurophysiol. 1990b;63:663–675. doi: 10.1152/jn.1990.63.4.663. [DOI] [PubMed] [Google Scholar]
- Calabresi P, Centonze D, Gubellini P, Pisani A, Bernardi G. Acetylcholine-mediated modulation of striatal function. Trends Neurosci. 2000;23:120–126. doi: 10.1016/S0166-2236(99)01501-5. [DOI] [PubMed] [Google Scholar]
- Crutcher MD, Alexander GE. Movement-related neuronal activity selectively coding either direction or muscle pattern in three motor areas of the monkey. J Neurophysiol. 1990;64:151–163. doi: 10.1152/jn.1990.64.1.151. [DOI] [PubMed] [Google Scholar]
- Deffains M, Legallet E, Apicella P. Modulation of neuronal activity in the monkey putamen associated with changes in the habitual order of sequential movements. J Neurophysiol. 2010;104:1355–1369. doi: 10.1152/jn.00355.2010. [DOI] [PubMed] [Google Scholar]
- DiCarlo JJ, Maunsell JH. Using neuronal latency to determine sensory-motor processing pathways in reaction time tasks. J Neurophysiol. 2005;93:2974–2986. doi: 10.1152/jn.00508.2004. [DOI] [PubMed] [Google Scholar]
- Hikosaka O, Sakamoto M, Usui S. Functional properties of monkey caudate neurons. III. Activities related to expectation of target and reward. J Neurophysiol. 1989;61:814–832. doi: 10.1152/jn.1989.61.4.814. [DOI] [PubMed] [Google Scholar]
- Joshua M, Adler A, Mitelman R, Vaadia E, Bergman H. Midbrain dopaminergic neurons and striatal cholinergic interneurons encode the difference between reward and aversive events at different epochs of probabilistic classical conditioning trials. J Neurosci, 2008;28:11673–11684. doi: 10.1523/JNEUROSCI.3839-08.2008. [DOI] [PMC free article] [PubMed] [Google Scholar]
- Kimura M, Rajkowski J, Evarts E. Tonically discharging putamen neurons exhibit set-dependent responses. Proc Natl Acad Sci U S A. 1984;81:4998–5001. doi: 10.1073/pnas.81.15.4998. [DOI] [PMC free article] [PubMed] [Google Scholar]
- Lee IH, Seitz AR, Assad JA. Activity of tonically active neurons in the monkey putamen during initiation and withholding of movement. J Neurophysiol. 2006;95:2391–2403. doi: 10.1152/jn.01053.2005. [DOI] [PubMed] [Google Scholar]
- Lee J, Kim HR, Lee C. Trial-to-trial variability of spike response of V1 and saccadic response time. J Neurophysiol. 2010;104:2556–2572. doi: 10.1152/jn.01040.2009. [DOI] [PubMed] [Google Scholar]
- Merrill EG, Ainsworth A. Glass-coated platinum-plated tungsten microelectrodes. Med Biol Engrg. 1972;10:662–672. doi: 10.1007/BF02476084. [DOI] [PubMed] [Google Scholar]
- Morris G, Arkadir D, Nevet A, Vaadia E, Bergman H. Coincident but distinct messages of midbrain dopamine and striatal tonically active neurons. Neuron. 2004;43:133–143. doi: 10.1016/j.neuron.2004.06.012. [DOI] [PubMed] [Google Scholar]
- Parent A, Hazrati LN. Functional anatomy of the basal ganglia. I. The cortico-basal ganglia-thalamo-cortical loop. Brain Res Brain Res Rev. 1995;20:91–127. doi: 10.1016/0165-0173(94)00007-C. [DOI] [PubMed] [Google Scholar]
- Peck CJ, Lau B, Salzman CD. The primate amygdala combines information about space and value. Nat Neurosci. 2013;16:340–348. doi: 10.1038/nn.3328. [DOI] [PMC free article] [PubMed] [Google Scholar]
- Pessiglione M, Seymour B, Flandin G, Dolan RJ, Frith CD. Dopamine-dependent prediction errors underpin reward-seeking behaviour in humans. Nature. 2006;442:1042–1045. doi: 10.1038/nature05051. [DOI] [PMC free article] [PubMed] [Google Scholar]
- Ravel S, Legallet E, Apicella P. Tonically active neurons in the monkey striatum do not preferentially respond to appetitive stimuli. Exp Brain Res. 1999;128:531–534. doi: 10.1007/s002210050876. [DOI] [PubMed] [Google Scholar]
- Ravel S, Legallet E, Apicella P. Responses of tonically active neurons in the monkey striatum discriminate between motivationally opposing stimuli. J Neurosci. 2003;23:8489–8497. doi: 10.1523/JNEUROSCI.23-24-08489.2003. [DOI] [PMC free article] [PubMed] [Google Scholar]
- R Core Team. Vienna, Austria: R Foundation for Statistical Computing; 2014. R: A language and environment for statistical computing. Available at http://www.R-project.org/ [Google Scholar]
- Saleem K, Logothetis N. A combined MRI and histology atlas of the rhesus monkey brain in stereotaxic coordinates. San Diego: Elsevier/Academic; 2007. [Google Scholar]
- Sardo P, Ravel S, Legallet E, Apicella P. Influence of the predicted time of stimuli eliciting movements on responses of tonically active neurons in the monkey striatum. Eur J Neurosci. 2000;12:1801–1816. doi: 10.1046/j.1460-9568.2000.00068.x. [DOI] [PubMed] [Google Scholar]
- Schulz JM, Reynolds JN. Pause and rebound: Sensory control of cholinergic signaling in the striatum. Trends Neurosci. 2013;36:41–50. doi: 10.1016/j.tins.2012.09.006. [DOI] [PubMed] [Google Scholar]
- Shimo Y, Hikosaka O. Role of tonically active neurons in primate caudate in reward-oriented saccadic eye movement. J Neurosci. 2001;21:7804–7814. doi: 10.1523/JNEUROSCI.21-19-07804.2001. [DOI] [PMC free article] [PubMed] [Google Scholar]
- Stern EA, Jaeger D, Wilson CJ. Membrane potential synchrony of simultaneously recorded striatal spiny neurons in vivo. Nature. 1998;394:475–478. doi: 10.1038/28848. [DOI] [PubMed] [Google Scholar]
- Wilson CJ, Chang HT, Kitai ST. Disfacilitation and long-lasting inhibition of neostriatal neurons in the rat. Exp Brain Res. 1983;51:227–235. doi: 10.1007/BF00237198. [DOI] [PubMed] [Google Scholar]
- Yamada H, Matsumoto N, Kimura M. Tonically active neurons in the primate caudate nucleus and putamen differentially encode instructed motivational outcomes of action. J Neurosci. 2004;24:3500–3510. doi: 10.1523/JNEUROSCI.0068-04.2004. [DOI] [PMC free article] [PubMed] [Google Scholar]
- Yarom O, Cohen D. Putative cholinergic interneurons in the ventral and dorsal regions of the striatum have distinct roles in a two choice alternative association task. Front Syst Neurosci. 2011;5:36. doi: 10.3389/fnsys.2011.00036. [DOI] [PMC free article] [PubMed] [Google Scholar]