

Abstract
Proteinase cascades are part of the basic machinery of neuronal death pathways. Neuronal cathepsin B (CatB), a typical cysteine lysosomal protease, plays a critical role in neuronal death through lysosomal leakage or excessive autophagy. On the other hand, much attention has been paid to microglial CatB in neuronal death. We herein show the critical role of proteolytic relay through microglial CatB and CatE in the polarization of microglia/macrophages in the neurotoxic phenotype, leading to hypoxia/ischemia (HI)-induced hippocampal neuronal damage in neonatal mice. HI caused extensive brain injury in neonatal wild-type mice, but not in CatB−/− mice. Furthermore, HI-induced polarization of microglia/macrophages in the neurotoxic phenotype followed by the neuroprotective phenotype in wild-type mice. On the other hand, microglia/macrophages exhibited only the early and transient polarization in the neuroprotective phenotype in CatB−/− mice. CA-074Me, a specific CatB inhibitor, significantly inhibited the neuronal death of primary cultured hippocampal neurons induced by the conditioned medium from cultured microglia polarized in the neurotoxic phenotype. Furthermore, CA-074Me prevented the activation of nuclear factor-κB (NF-κB) in cultured microglia by inhibiting autophagic inhibitor of κBα degradation following exposure to oxygen–glucose deprivation. Rather surprisingly, CatE increased the CatB expression after HI by the liberation of the tumor necrosis factor-related apoptosis-inducing ligand (TRAIL) from microglia through the proteasomal pathway. A significant increase in CatB and CatE levels was found exclusively in microglia/macrophages after HI. Thus, a proteolytic relay through the early CatE/TRAIL-dependent proteosomal and late CatB-dependent autophagic pathways for NF-κB activation may play a critical role in the polarization of microglia/macrophages in the neurotoxic phenotype.
SIGNIFICANCE STATEMENT Proteinase cascades are part of the basic machinery of neuronal death pathways. Cathepsin B, a typical cysteine lysosomal protease, plays a critical role in neuronal death through lysosomal leakage or excessive autophagy in neurons. On the other hand, much attention has been also paid to the role of microglial cathepsin B in neuronal death. In this study, using in vivo and in vitro models of relevance to brain ischemia, we found a critical role of proteolytic relay through cathepsin B and cathepsin E in the neurotoxic polarization of microglia/macrophages, which is responsible for aggravation of hypoxia/ischemia-induced neuronal injury. These findings suggest orally active selective inhibitors of cathepsin B or cathepsin E as promising pharmacological agents for the treatment of ischemic brain injury.
Keywords: autophagy, cathepsin B, cathepsin E, hypoxic ischemia, microglia, phenotypic change
Introduction
A group of proteases in the endosomal/lysosomal proteolytic system has been designated as cathepsin (Cat), which is derived from the Greek term meaning “to digest.” The primary function of cathepsins is believed to be in disintegrating proteins as well as larger structures because they irreversibly cleave peptide bonds. However, there is increasing evidence that cathepsins also exert modulator actions, by which substrates are activated after limited cleavage (Nakanishi, 2003a). Proteinase cascades, including some members of the caspase family, are part of the basic machinery of neuronal death pathways (Hyman and Yuan, 2012). It is also known that neuronal CatB (EC 3.4.22.1), a typical cysteine lysosomal protease, plays a critical role in ischemic hippocampal neuronal death in primates through lysosomal leakage (Yamashima et al., 1998; Tsuchiya et al., 1999) and in neuronal death in rodents through excessive autophagy (Canu et al., 2005; Wen et al., 2008; Sun et al., 2010). On the other hand, much attention has been also paid to the role of microglial CatB in neuronal death.
Kingham and Pocock (2001) demonstrated that CatB is a major causative factor for activated microglia-induced neuronal apoptosis using neutralizing anti-CatB antibodies. Gan et al. (2014) found that Aβ42 did not cause neuronal death when added directly to neurons, but that Aβ42 activated the BV2 microglial cell line to release toxic factors that caused significant neuronal death. To determine the toxic molecules secreted from Aβ42-activated BV2 cells, Gan et al. (2014) conducted a large-scale expression profiling analysis using filter-based cDNA arrays made from BV2 cDNA libraries enriched for Aβ42-activated BV2 cell genes. CatB was identified to be one of the 554 genes transcriptionally induced by Aβ42. Furthermore, specific inhibition of CatB using either siRNA-mediated gene silencing or a specific CatB inhibitor completely abolished the neurotoxicity mediated by the Aβ42-activated BV2 microglial cell line. More recently, it has been found that the leakage of CatB from the lysosomes triggers the activation of the NLRP3 inflammasome in microglia/macrophages after the phagocytosis of various molecules, including fibrillar Aβ42 and silica crystals (Halle et al., 2008). After activation, the NLRP3 induces pro-caspase-1 activation to promote the processing and secretion of proinflammatory cytokines, such as interleukin (IL)-1β and IL-18. On the other hand, our recent observations show that CatB is involved in the processing of IL-1β and IL-18 in microglia through the proteolytic processing of pro-caspase-1 and pro-caspase-11 in phagolysosomes without leakage (Terada et al., 2010; Sun et al., 2012; Wu et al., 2013). These observations suggest potential roles for CatB in the polarization of microglia/macrophages to the proinflammatory neurotoxic phenotype.
Neonatal hypoxia/ischemia (HI) induces brain injury, causing neurological impairment, including cognitive impairment, motor dysfunction, and seizures (du Plessis and Volpe, 2002). In a neonatal HI mouse model, the polarization of microglia/macrophages to the neurotoxic phenotype significantly influenced the outcome of HI-induced pathology (Hu et al., 2012; Yamagata et al., 2013). However, little is known about the molecular mechanism underlying the polarization of microglia/macrophages to the neurotoxic phenotype. In the present study, we have attempted to elucidate a possible involvement of microglial CatB in the polarization of microglia/macrophages to the neurotoxic phenotype. In neonatal mice, CatB deficiency significantly inhibited hippocampal neuronal damage and neurotoxic polarization of microglia/macrophages following HI. Increased CatB levels were found to be responsible for the activation of nuclear factor-κB (NF-κB) through autophagic degradation of inhibitor of κBα (IκBα) in microglia/macrophages. In the course of the experiments, we have unexpectedly found that CatE increased the CatB expression in microglia/macrophages after HI through the proteolytic liberation of the tumor necrosis factor (TNF)-related apoptosis-inducing ligand (TRAIL), a member of the tumor necrosis factor superfamily. Soluble TRAIL in turn induced NF-κB activation in the proteasomal pathway. These observations suggest that the neurotoxic polarization of microglia/macrophages promoted by CatB and CatE, which is increased exclusively in microglia/macrophages, is responsible for the aggravation of HI-induced neuronal injury.
Materials and Methods
Animals.
Heterozygous mice of C57BL/6 background were kept in a specific pathogen-free condition at Kyushu University Faculty of Dental Sciences. The selection of CatB-deficient (CatB−/−) mice from their littermates, obtained by heterozygous coupling, was performed by examining the template genomic DNA isolated from tail biopsy samples, using a CatB exon 4-specific PCR with MCB11 primers (5′-GGTTGCGTTCGGTGAGG-3′) and MCBGT (5′-AACAAGAGC CGC AGG AGC-3′; Terada et al., 2010; Sun et al., 2012; Wu et al., 2013), and CatE (S1: 5′-AGG GTGGGGTTGATGGTAAG-3′; W1: 5′-TGAAAATGAGGGTGTTGAGGT-3′; N1: 5′-TGGCTGCTATTGGGCGAAGTG-3′; Tsukuba et al., 2003). Mice homozygous for CatB and CatE deficiency were generated by intercrossing CatB+/− and CatE+/− mice. The heterozygous mice that were used as control animals in the present study showed no pathological phenotypes when examined by histological, immunocytochemical, and biochemical methods. C57BL/6 wild-type, CatB−/−, CatE−/−, and double-mutant (CatB−/−/E−/−) mice of either sex were used in the present study. CatB−/− (Deussing et al., 1998), CatE−/− (Tsukuba et al., 2003), CatB−/−/E−/− mice did not show any obvious phenotype under the specific pathogen-free condition.
The HI injury model.
A neonatal HI brain injury was essentially induced in C57BL/6 wild-type, CatB−/−, CatE−/−, and CatB−/−/E−/− mice on postnatal day 7 (P7) using the methods of the Rice-Vannucci model, with minor modifications (Koike et al., 2008). After the mice were deeply anesthetized with inhalation anesthesia, the left common carotid artery was dissected and ligated with silk sutures (6/0). After the surgical procedure, the pups were allowed to recover for 1 h at 37°C in an incubator. They were then placed in chambers maintained at 37°C through which 8% humidified oxygen (balanced with nitrogen) flowed for 45 min. After hypoxic exposure, the pups were returned to their dams and the plastic cages. The animals were allowed to recover for 12, 24, 48, or 72 h. At each stage, the brains were processed for biochemical or morphological analyses. This procedure resulted in a brain injury in the ipsilateral hemisphere, consisting of cerebral infarction that was mainly localized to the hippocampus. The control littermates were neither operated on nor subjected to hypoxia. To minimize experimental variations, the same person conducted the surgery through this study. Furthermore, both wild-type and cathepsin-deficient mice were exposed to the hypoxic condition simultaneously by placing them in the same chamber.
Quantitative real-time PCR analysis.
The mRNA isolated from mice subjected to HI injury at various time points or CD11b+ cells stimulated by interferon-γ (IFN-γ) plus lipopolysaccharide (LPS) or IL-4 were subjected to a quantitative real-time PCR (RT-PCR). The total RNA was extracted with RNAiso Plus according to the manufacturer instructions. A total of 800 ng of extracted RNA was reverse transcribed to cDNA using the QuantiTect Reverse Transcription Kit (Qiagen). After an initial denaturation step at 95°C for 5 min, temperature cycling was initiated. Each cycle consisted of denaturation at 95°C for 5 s, annealing at 60°C for 10 s, and elongation for 30 s. In total, 40 cycles were performed. The cDNA was amplified in duplicate using a Rotor-Gene SYBR Green RT-PCR Kit (Qiagen) with a Corbett Rotor-Gene RG-3000A Real-Time PCR System. The data were evaluated using the RG-3000A software program (version Rotor-Gene 6.1.93, Corbett). The sequences of primer pairs are described as follows: CatB: 5′-GCAGCCAACTCTTGGAACCTT-3′ and 5′-GGATTCCAGCCACAATTTC TG-3′; inducible nitric oxide synthase (iNOS): 5′-GCCACCAACAATGGCAAC-3′ and 5′-CGTACCGGATGAGCTGT GAATT-3′; IL-1β: 5′-CAACCAACAAGTGAT ATTCTCCATG-3′ and 5′-GATCCA CACTCTCCAGCTGCA-3′; TNF-α: 5′-ATGGCCTCCCTC TCAGTTC-3′ and 5′-TTG GTGGTTTGCTACGACGTG-3′; arginase1: 5′-CGCCTT TCTCAAAAGGACAG-3′ and 5′-CCAGCTCTTCATTGGCTTTC-3′; IL-10: 5′-ATG CTGCCTGCTCTTACTGA CTG-3′ and 5′-CCCAAGTAACCCTTAAAGTCCTGC-3′; IL-4: 5′-TGGGTCTCAA CCCCCAGCTAGT-3′ and 5′-TGCATGGCGTCCCTTCTC CTGT-3′; CatE: 5′-CAG TCCGACACATACACG-3′ and 5′-TGGCCTGGCTCCTTG AC-3′; TRAIL: 5′-GACCAGCTCTCCATTCCTA-3′ and 5′-GAAGACCTCAGAAAG TGGC-3′; and DR5: 5′-AAGTGTGTCTCCAAAACGG-3′ and 5′-AATGCACAGAGTT CGCACT-3′.
For data normalization, an endogenous control (actin) was assessed to control for the cDNA input, and the relative units were calculated by a comparative Ct method. All of the RT-PCR experiments were repeated three times, and the results are presented as the means of the ratios ± SEMs.
Oxygen-glucose deprivation and reoxygenation.
To mimic hypoxic-ischemic conditions in vitro, MG6 cells were subjected to oxygen-glucose deprivation (OGD) for 6 h. In the OGD phase, the media were washed with glucose-free HBSS and then changed to glucose-free HBSS. The cultures were then placed in a hypoxia chamber (Model MCO 18M, Sanyo Biomedical Electrical Co., Ltd.) that contained a gas mixture composed of 1% O2, 5% CO2, and 92% N2. After OGD, the cultures were recovered with fresh DMEM and transferred to a normoxia chamber (20% O2, 5% CO2) for 12, 24, 48, and 72 h (OGD/R).
Isolation of microglia from the mouse brain.
CD11b+ cells were isolated from the mouse brain by the MACS method. Twelve mice in each group were anesthetized and transcardially perfused with PBS at 12, 24, 48, and 72 h after injury. The brains were separated as contralateral and ipsilateral samples, and cut into small pieces. After enzymatic digestion using a Neural Tissue Dissociation Kit (Miltenyi Biotec), the cell suspensions were further mechanically dissociated using a gentle MACS Dissociator (Milteny Biotec). The single-cell suspensions were obtained after being move to a 30 mm cell strainer. After magnetic labeling with CD11b MicroBeads, the cell suspension was loaded onto a magnetic (MACS) column placed in the magnetic separator (Milteny Biotec). After rinsing the MACS column with PBS, the CD11b-positive fraction was collected according to previously described methods (Wu et al., 2013; Zhang et al., 2014).
Immunoblotting analyses.
MG6 microglial cell line was cultured at a density of 5 × 10⁵ cells/ml. After OGD/R, cells were harvested at various time points. The CD11b+ cells were isolated from wild-type and CatB−/− mice by the MACS method at various time points after HI injury. The specimens were quickly frozen and stored until use at −80°C. The immunoblotting analyses were conducted as described previously (Sun et al., 2012; Zhang et al., 2014). In brief, each specimen was electrophoresed using 15%, 12%, or 7.5% SDS-polyacrylamide gels. The proteins on the SDS gels were then electrophoretically transferred to nitrocellulose membranes. Following the blocking, the membranes were incubated at 4°C overnight under gentle agitation with each of the following primary antibodies: goat anti-CatB (1:1000; Santa Cruz Biotechnology); rabbit anti-CatB (1:1000; Abcam); mouse anti-beclin1 (1:1000; BD Biosciences); rabbit anti-IκBα (1:1000; Santa Cruz Biotechnology); rat anti-IL10 (1:1000; Abcam); goat anti-arginase (1:1000; Abcam); rat anti-IL4 (1:500; Abcam); and mouse anti-actin (1:5000; Abcam). After washing, the membranes were incubated with horseradish peroxidase (HRP)-labeled anti-goat (1:2000; GE Healthcare), anti-mouse (1:2000; R&D Systems), anti-rabbit (1:2000; GE Healthcare), or anti-rat (1:2000; GE Healthcare) for 2 h at room temperature. Subsequently, the membrane-bound, HRP-labeled antibodies were detected using an enhanced chemiluminescence detection system (ECK lit, GE Healthcare) with an image analyzer (LAS-1000, Fuji Photo Film).
Immunofluorescent staining.
The brains from P7 wild-type, CatB−/−, and CatE−/− mice were obtained 12, 24, 48, and 72 h after HI. The samples were cryoprotected for 2 d in 30% sucrose in PBS and then were embedded in an optimal cutting temperature compound (Sakura Finetechnical). Serial coronal frozen sections (14 μm) of the samples for immunofluorescent staining were prepared as previously reported (Wu et al., 2013; Zhang et al., 2014). The sections were washed with PBS plus 0.1% Triton X-100 for 10 min at 24°C, and then incubated with NeuroTrace Fluorescent Nissl Stains (1:200; Invitrogen) for 20 min at 24°C. After washing with PBS, the sections were mounted in Vectashield anti-fading medium (Vector Laboratories). Fluorescence images were taken using a confocal laser-scanning microscope (CLSM; 2si Confocal Laser Microscope, Nikon). The brains from P7 wild-type, CatB−/− and CatE−/− mice were obtained at four different time points after HI. The samples were cryoprotected and embedded. Serial coronal frozen sections (14 μm) of the samples were prepared for double-immunofluorescent staining. The sections were then incubated with the following antibodies: goat anti-CatB (1:100; Santa Cruz Biotechnology) with rabbit anti-Iba1 (1:10,000; Wako), rabbit anti-glial fibrillary acidic protein (GFAP; 1:5000; Sigma-Aldrich), or mouse anti-NeuN (1:5000; Millipore); goat anti-CatE (1:500; R&D Systems) with rabbit anti-Iba1 (1:10,000; Wako), rabbit anti-GFAP (1:5000; Sigma-Aldrich), or NeuroTrace Fluorescent Nissl Stains (1:200; Invitrogen); and rabbit anti-Iba1 (1:10,000) with mouse anti-iNOS (1:1000; Abcam), goat anti-cleaved IL-1β (m118; 1:100; Santa Cruz Biotechnology), rat anti-lysosome-associated membrane protein 2 (LAMP2; 1:500; Abcam), or mouse anti-beclin1 (1:1000; BD Biosciences) at 4°C overnight. After washing with PBS, the sections were incubated with anti-goat Alexa Fluor 488 (1:500; Jackson ImmunoResearch), donkey anti-rabbit Cy3 (1:500; Jackson ImmunoResearch), donkey anti-mouse Cy3 (1:500; Jackson ImmunoResearch), donkey anti-rabbit Cy3 (1:500; Jackson ImmunoResearch), donkey anti-goat Alexa Fluor 488 (1:500; Jackson ImmunoResearch), and donkey anti-mouse Alexa Fluor 488 (1:500; Jackson ImmunoResearch) at 4°C for 2 h. The sections were mounted in Vectashield anti-fading medium (Vector Laboratories). The fluorescence images were observed using a CLSM.
The cultured hippocampal neurons were fixed with 4% paraformaldehyde for 48 h after culturing by microglia-conditioned medium. They were then incubated with the mouse anti-microtubule-associated protein 2 (MAP2; Millipore) overnight at 4°C. After washing with PBS, the sections were incubated with donkey anti-mouse Cy3 (1:500; Jackson ImmunoResearch), then incubated with Hoechst stain (1:200) and mounted in Vectashield anti-fading medium (Vector Laboratories). Fluorescence images were taken using a fluorescence microscope (BX-41, Olympus).
CatE knockdown with small interfering RNAs.
The MG6 microglial cell line was seeded on a six-well plate at a density of 2 × 10⁵ cells/well in 2 ml of antibiotic-free DMEM. After 12 h, the cells were transiently transfected with control siRNA-A (sc-37007, Santa Cruz Biotechnology) or CatE siRNA (sc-41474, Santa Cruz Biotechnology), using siRNA Transfection Reagent (sc-29528, Santa Cruz Biotechnology) according to the manufacturer protocol. Twelve hours after transfection, the cells were subjected to OGD/R. The cells and conditioned medium were collected at each of the time points for an RT-PCR and ELISA.
Assay for soluble TRAIL.
The conditioned media were collected from the MG6 microglial cell line, and the amounts of soluble TRAIL were measured using an ELISA kits (RayBiotech) following the manufacturer protocol. The absorbency at 450 nm was measured using a microplate reader.
Monodansylcadaverine staining.
Samples were obtained from the MG6 microglial cell line after 12, 24, 48, and 72 h of reoxygenation. Monodansylcadaverine (MDC) was used to evaluate the abundance of the autophagic vacuoles in cells. Staining was conducted with MDC (Cayman Chemical) in PBS for 10 min, and the subsequent cellular fixation procedure was performed as previously reported (Han et al., 2011). Afterward, the staining of MCD was analyzed using a fluorescence microscope (BX-41, Olympus).
Cell culture.
The c-myc-immortalized mouse microglial cell line MG6 (Riken Cell Bank) was maintained in DMEM containing 10% fetal bovine serum (Invitrogen) supplemented with 100 μm β-mercaptoethanol, 10 μg/ml insulin, 1% penicillin-streptomycin (Invitrogen), and 450 mg/ml glucose (Invitrogen) according to previously described methods (Sun et al., 2012; Wu et al., 2013). They were stimulated by 100 ng/ml Escherichia coli LPS (Sigma-Aldrich) plus 20 ng/ml IFN-γ (R&D Systems) and 20 ng/ml IL-4 (R&D Systems). The conditioned medium was harvested 48 h after stimulation. Hippocampal neurons were isolated from P1 wild-type mice; the hippocampi were dissected, digested by papain (Worthington), and filtered using a 50 μm sterile nylon filter; the cells were maintained in Minimum Essential Medium (Invitrogen) containing 10% horse serum, 450 mg/ml glucose, 1% penicillin-streptomycin, and 100 mm sodium pyruvate (Invitrogen) at 37°C, in 10% CO2; and, after 1 d, the medium were changed to Eagle's MEM (Nissui Pharmaceutical Co., LTD) with 2% B27 supplement (Invitrogen), 450 mg/ml glucose, 1% penicillin-streptomycin (Invitrogen), and 200 mm l-glutamine (Invitrogen) for 2 weeks.
Cell viability assay.
Primary hippocampal neurons were seeded in 96-well plates for 2 weeks (5 × 10³ cells/well) and then cultured by microglia-conditioned medium for 48 h. A cell viability assay was performed using a cell-counting kit (CCK-8; Dojindo). The optical density was read at a wavelength of 450 nm with a microplate reader. Cell viability was calculated using the following formula: optical density of treated group/control group.
In vitro digestion assay.
At 48 h of OGD/R, 3 × 10⁸ MG6 cells were harvested from the treatment and normal groups, and homogenized in a 7 ml Dounce homogenizer (Sigma-Aldrich). The homogenate was centrifuged at various speeds according to the manufacturer instructions (Lysosome Isolation Kit, Sigma-Aldrich). The resulting crude lysosomal fraction, which is a mixture of mitochondria, lysosomes, peroxisomes, and endoplasmic reticulum, was further purified by density gradient centrifugation on a multistep OpiPrep gradient. The high-yield lysosomes were suspended in PBS containing 0.05% Triton-X, and then sonicated to obtain the soluble lysosomal constituents. These lysosomal constituents were incubated with 250 ng of recombinant human IκBα (Enzo Life Sciences) at 37°C for 2, 6, 12, and 24 h. Some digestion experiments were performed in the presence of protease inhibitors including pepstatin A (Peptide Institute Inc.) and CA-074Me (Peptide Institute Inc.). Each mixture was subjected to immunoblotting analyses.
Statistical analysis.
The data are represented as the mean ± SEM. The statistical analyses were performed using a one- or two-way ANOVA with a post hoc Tukey's test using the GraphPad Prism software package. A value of p < 0.05 was considered to indicate statistical significance (GraphPad Software).
Results
The reduction in HI-induced neuronal injury in the hippocampus by CatB deficiency
To investigate the role of CatB in HI-induced neuronal death, the damage in the pyramidal regions of the hippocampus ipsilateral to the ligated side was compared between neonatal wild-type and CatB−/− mice after HI. The percentage of damaged area 3 d after HI was examined by determining the ratio of damaged area to the total area of the pyramidal layer in the hippocampus of the neonatal wild-type and CatB−/− mice using fluorescent Nissl stain. As was reported previously (Koike et al., 2008), considerable damage, ranging from moderately severe to complete loss of the pyramidal cell layer, was observed in neonatal wild-type mice (Fig. 1A,B). In contrast, the variation of the hippocampal damage in the neonatal CatB−/− mice was small, and the mean ratio of the damaged area (percentage) was significantly lower than that in the neonatal wild-type mice (Fig. 1A,B, ***p = 0.0002 by unpaired t test).
Figure 1.

CatB deficiency prevents neuronal damage in the hippocampus of neonatal mice 3 d after HI injury. A, The histological changes in the ipsilateral hippocampus of wild-type (+/+) and CatB−/− mice 3 d after HI injury indicated with fluorescent Nissl staining. B, The quantification of the percentage of damaged areas in the total area of the hippocampal layers of wild-type (+/+; n = 31) and CatB−/− (n = 15) mice 3 d after HI. The asterisks indicate a statistically significant difference from the control value (***p < 0.001, unpaired t tests). C, The time course change of the cell numbers of CatB-positive GFAP+, NeuN+, and Iba1+ cells in the ipsilateral hippocampus (0.1 mm2/area) after HI injury. The columns and bars represent the mean ± SEM (n = 9). D, Immunofluorescent CLSM images of CatB (red) and their merged images of Iba1, GFAP, and NeuN (red) in the ipsilateral hippocampus of wild-type mice 3 d after HI. Scale bar, 50 μm. E, Immunofluorescent CLSM images merged with Iba1 (red) and CatB (green) with a higher magnification. Scale bar, 20 μm. F, Immunofluorescent CLSM images and images merged with LAMP2 (red) and CatB (green) of the ipsilateral hippocampus of wild-type mice 3 d after HI. Scale bar, 25 μm. G, Immunofluorescent CLSM merged images of Iba1 (red) and fluorescent Nissl (green) of the ipsilateral hippocampus of wild-type mice 3 d after HI. Scale bar, 25 μm. con, Contralateral; ipsi, ipsilateral.
Next, the changes in the expression and localization of CatB were examined to further elucidate its role in HI-induced damage in the pyramidal regions of the hippocampus. At 24 h after HI, increased CatB immunoreactivity was observed primarily in microglia, but not in astrocytes or neurons (Fig. 1C, ***p < 0.0001 by one-way ANOVA with post hoc Tukey's test; Fig. 1D,E, higher magnification). At 72 h after HI, intense CatB immunoreactivity was observed in the LAMP2-positive lysosomes (Fig. 1F). Furthermore, most of the Iba1-positive microglia phagocytosed the damaged neurons (Fig. 1G).
Suppression of HI-induced by the polarization of microglia/macrophages to the neurotoxic phenotype by CatB
Our previous observations showed that CatB in the lysosomal/autolysosomal proteolytic system of microglia plays an essential role in the neuroinflammatory responses (Terada et al., 2010; Sun et al., 2012; Wu et al., 2013). We next examined the possible involvement of CatB in the polarization of microglia/macrophages after HI injury. Some of the typical neurotoxic (M1) and neuroprotective (M2) polarization markers that were expressed in microglia/macrophages acutely isolated from the hippocampus of wild-type and CatB−/− mice were measured using a real-time quantitative PCR at four different time periods after HI injury. The mean mRNA levels of M1 markers, including iNOS, TNF-α, and IL-1β, in microglia/macrophages acutely isolated from the hippocampus of wild-type mice were gradually and significantly increased at 24 h after HI injury (Fig. 2A, ***p < 0.0001, **p = 0.003 by one-way ANOVA with post hoc Tukey's tests). A significant increase in the mean levels of the M1 marker genes was observed at up to 72 h, without a decline. In contrast, the mean mRNA levels of these M1 markers in microglia/macrophages acutely isolated from the hippocampus of CatB−/− mice showed no significant change up to 72 h after HI injury (Fig. 2A, F = 14.18, df numerator = 4, df denominator = 20, ***p < 0.0001 by two-way ANOVA with Bonferroni post-test, significant effect of genotype). However, the mean mRNA levels of the M2 markers, including arginase1, IL-4, and IL-10, in microglia/macrophages acutely isolated from the hippocampus of wild-type mice were also gradually and significantly increased from 12 to 24 h after HI injury, reaching a peak at 24–48 h (Fig. 2B: for arginase1, ***p < 0.0001, **p = 0.003, *p = 0.02; for IL-4: ***p = 0.0.0003; for IL-10: **p = 0.007, *p = 0.03 by one-way ANOVA with post hoc Tukey's test). After peaking, the mean mRNA levels of M2 markers began to decline to the control level. In contrast, the mean mRNA levels of the M2 markers in microglia/macrophages acutely isolated from the hippocampus of CatB−/− mice increased rather rapidly to reach a peak at 12 h after HI injury and then returned to the control level (Fig. 2B). These results suggest that CatB deficiency suppresses the polarization of microglia/macrophages to the neurotoxic phenotype and skews them toward the neuroprotective phenotype after HI injury. The M1/M2 terminology is often used to describe phenotypes of microglia/macrophages. However, M1 and M2 phenotypes represent two end points of the full spectrum of microglia/macrophages activation along the M1–M2 phenotypic continuum. It is considered that the description of microglia/macrophages as having either an M1 or M2 phenotype is a simplification of the in vivo reality (Martinez and Gordon, 2014; Murray et al., 2014). Therefore, it is appropriate to use the term “neurotoxic/neuroprotective phenotypes.”
Figure 2.

The time course changes in the expression of M1- and M2-like polarization markers in microglia/macrophages acutely isolated from the ipsilateral hippocampus of wild-type and CatB−/− mice following HI. A, The mRNA expression of M1 markers (iNOS, TNF-α, and IL-1β). Microglia/macrophages were isolated from the ipsilateral hippocampus of wild-type and CatB−/− mice (n = 6, each) at each time point. B, The mRNA expression of M2 markers (arginase1, IL-4, and IL-10). The circles and bars represent the mean ± SEM (n = 3). The asterisks indicate a statistically significant difference from the control value (*p < 0.05, **p < 0.01, ***p < 0.001, one-way ANOVA test). The daggers indicate a statistically significant difference from wild-type mice (+/+; ††p < 0.01, †††p < 0.001, two-way ANOVA). C, The immunoblots show pro-IL-1β, mature IL-1β (mIL-1β), TNF-α, and iNOS produced by microglia/macrophages acutely isolated the ipsilateral hippocampus at 72 h after HI. D, The quantitative analyses of pro-IL-1β, IL-1β, TNF-α, and iNOS in the immunoblots in C. The columns and bars represent the mean ± SEM (n = 3). The asterisks indicate a statistically significant difference between the values (*p < 0.05, **p < 0.01, ***p < 0.001, one-way ANOVA). E, The immunoblots show arginase1, IL-4, and IL-10 produced by microglia/macrophages acutely isolated from the ipsilateral hippocampus at 12 h after HI. F, The quantitative analyses of arginase1, IL-4, and IL-10 in the immunoblots in E. The columns and bars represent the mean ± SEM (n = 3). The asterisks indicate a statistically significant difference between the values (**p < 0.01, ***p < 0.001, one-way ANOVA test). con, Contralateral; ipsi, ipsilateral.
Furthermore, the mean density of the bands corresponding to pro- and mature IL-1β, TNF-α, and iNOS in the soluble fractions of microglia/macrophages acutely isolated from the ipsilateral hippocampus at 72 h after HI was significantly lower in CatB−/− mice than in wild-type mice (Fig. 2C,D: for proIL-1β, ***p = 0.0008; for mIL-1β, ***p = 0.0008; for TNF-α, ***p = 0.0002; for iNOS, ***p = 0.0009, by one-way ANOVA with post hoc Tukey's test). In contrast, the mean density of bands corresponding to arginase1, IL-4, and IL-10 in the soluble fractions of microglia/macrophages acutely isolated from the ipsilateral hippocampus at 12 h after HI were significantly higher in CatB−/− mice than in wild-type mice (Fig. 2E,F: for arginase1, **p = 0.003; for IL-4, **p = 0.004; for IL-4, ***p = 0.0004 by one-way ANOVA with post hoc Tukey's test).
Next, the localization of the typical M1 and M2 markers in the hippocampus of wild-type and CatB−/− mice after HI injury was examined by immunohistochemical staining. CLSM fluorescent images showed that immunoreactivity for iNOS and IL-1β was primarily noted in the Iba1-positive microglia/macrophages in the ipsilateral hippocampus of wild-type mice, but not in that of CatB−/− mice, at 72 h after HI (Fig. 3A–C). The mean numbers of the iNOS-positive and IL-1β-positive cells in the ipsilateral hippocampus of CatB−/− mice were significantly lower than those of wild-type mice (Fig. 3C, ***p < 0.0001 by one-way ANOVA with post hoc Tukey's test). In contrast, immunoreactivity for arginase1 and IL-10 was also observed mainly in the Iba1-positive microglia/macrophages in the ipsilateral hippocampus of both wild-type and CatB−/− mice at 12 h after HI (Fig. 3D,E). The mean number of the arginase1-positive and IL-10-positive cells in the ipsilateral hippocampus of the two types of mice did not differ significantly (Fig. 3F; one-way ANOVA with post hoc Tukey's tests, p = 0.09).
Figure 3.

The immunoreactivities for M1- and M2-like polarization markers in the ipsilateral hippocampus of wild-type (++) and CatB−/− mice following HI. A, B, Immunofluorescent CLSM images of iNOS (A) and IL-1β (B) in Iba1-positive microglia/macrophages in the ipsilateral hippocampus of wild-type and CatB−/− mice 72 h after HI. Scale bar, 50 μm. C, The quantitative analyses of iNOS and IL-1β-positive cells in the contralateral and ipsilateral hippocampi (0.03 μm2/area) of wild-type and CatB−/− mice 72 h after HI. The columns and bars represent the mean ± SEM (n = 3). The asterisks indicate a statistically significant difference between the values (***p < 0.001, one-way ANOVA). D, E, Immunofluorescent CLSM images of arginase1 (D) and IL-10 (E) in Iba1-positive microglia/macrophages in the ipsilateral hippocampi of wild-type and CatB−/− mice 72 h after HI. F, The quantitative analyses of arginase1- and IL-10-positive cells in the contralateral and ipsiolateral hippocampi (0.03 μm2/area) of wild-type and CatB−/− mice 73 h after HI. The columns and bars represent the mean ± SEM (n = 3). con, Contralateral; ipsi, ipsilateral.
The differential effect of conditioned medium prepared from microglia polarized to neurotoxic and neuroprotective phenotypes on the survival of the hippocampal neurons
To further elucidate a direct effect of CatB on the microglia/macrophage phenotype, the effects of CA-074Me, a specific CatB inhibitor, on the phenotypic changes of microglia were examined using microglia acutely isolated from the brains of wild-type mice (Fig. 4). CA-074Me significantly inhibited the mean mRNA levels of the M1 markers (iNOS, TNF-α, and IL-1β) in microglia after treatment with IFN-γ and LPS (Fig. 4A, ***p < 0.0001 by one-way ANOVA with post hoc Tukey's test). In contrast, CA-074Me did not affect the mean mRNA levels of the M2 markers (arginase1, IL-4, and IL-10) in microglia/macrophages after treatment with IL-4 (Fig. 4B; one-way ANOVA with post hoc Tukey's test, p = 0.08). These observations suggest that CatB has a direct effect on microglia/macrophage phenotype. However, increased neuronal damage may further force microglia/macrophages to the neurotoxic phenotype in vivo, especially in the later phase of HI.
Figure 4.
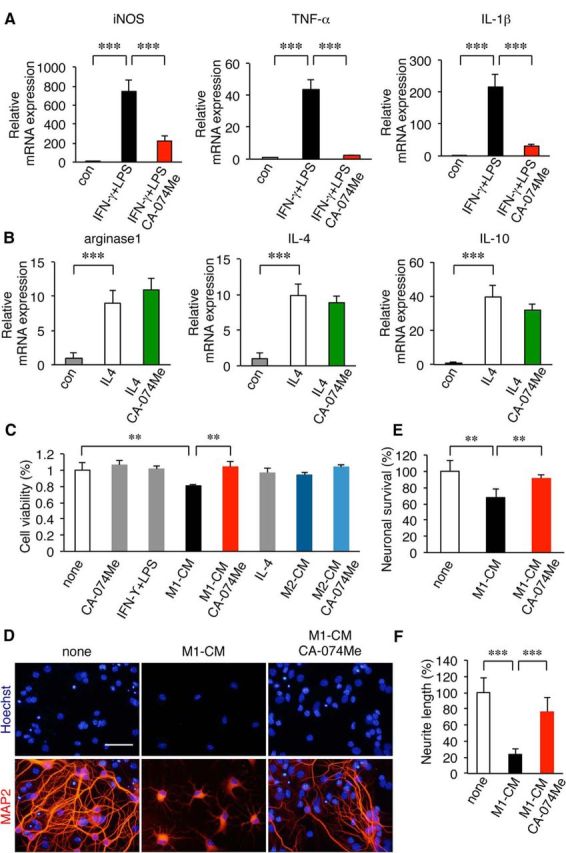
CatB-dependent phenotypic change of microglia and its outcome for neuronal viability. A, B, The effects of CA-074Me, a specific CatB inhibitor, on the polarization of microglia isolated from the brains of wild-type mice to neurotoxic and neuroprotective phenotypes. Microglia were polarized to the neurotoxic and neuroprotective phenotypes by treatment with IFN-γ plus LPS and IL-4, respectively. A, The expression of mRNA for M1 markers (iNOS, TNF-α, and IL-1β) following treatment with IFN-γ (20 ng/ml) and LPS (100 ng/ml) for 48 h in the presence and absence of CA-074Me. The columns and bars represent the mean ± SEM (n = 3). The asterisks indicate a statistically significant difference from the control value (***p < 0.001, one-way ANOVA test). B, The expression of mRNA for M2 markers (arginase1, IL-4, and IL-10) following treatment with IL-4 (20 mg/ml) for 48 h in the presence and absence of CA-074Me. The columns and bars represent the mean ± SEM (n = 3). The asterisks indicate a statistically significant difference from the control value (***p < 0.001, one-way ANOVA). C–F, The effects of the conditioned medium prepared from microglia polarized to neurotoxic and neuroprotective phenotypes on neuronal viability. C, The mean cell viability (percentage) of primary cultured hippocampal neurons 48 h after treatment with the M1-CM or M2-CM measured by WST-8 assay conversion to water-soluble formazan by mitochondria dehydrogenase in the presence and absence of CA-074Me. The columns and bars represent the mean ± SEM (n = 4). The asterisks indicate a statistically significant difference between the values (**p < 0.01, one-way ANOVA). D, Immunofluorescent CLMS images of MAP2 (red) in primary cultured hippocampal neurons with Hoechst-stained nuclei (blue) 48 h after treatment with M1-CM in the presence and absence of CA-074Me. Scale bar, 100 μm. E, The mean cell viability of primary cultured hippocampal neurons 48 h after treatment with M1-CM was measured by the counting of MAP2-positive cells (0.15 mm2/area) in the presence and absence of CA-074Me. The columns and bars represent the mean ± SEM (n = 4). The asterisks indicate a statistically significant difference between the values (**p < 0.01, one-way ANOVA test). F, The mean neurite length of MAP2-stained hippocampal neurons 48 h after treatment with M1-CM in the presence and absence of CA-074Me. The columns and bars represent the mean ± SEM (n = 4). The asterisks indicate a statistically significant difference between the values (***p < 0.001, one-way ANOVA test). con, Contralateral.
Next, the outcomes of microglia polarized to neurotoxic and neuroprotective phenotypes on the neuronal survival were examined using culture mediums prepared from M1 and M2 polarized microglia (M1-CM and M2-CM, respectively). The survival of hippocampal neurons was first measured by WST-8 assay (Dojindo) conversion to water-soluble formazan using mitochondria dehydrogenase. M1-CM was prepared by culturing the MG6 microglial cell line for 48 h in the presence of LPS and IFN-γ. M2-CM was prepared by culturing MG6 cells for 48 h in the presence of IL-4. M1-CM significantly reduced the mean cell viability of the primary cultured hippocampal neurons to ∼20% (Fig. 4C, **p = 0.005 by one-way ANOVA with post hoc Tukey's test). When M1-CM was prepared in the presence of CA-074Me, the M1-CM-induced cell death of primary cultured hippocampal neurons was completely suppressed (Fig. 4C, **p = 0.007 by one-way ANOVA with post hoc Tukey's test). M2-CM differed in that it did not affect the mean cell viability of the hippocampal neurons (Fig. 4C; one-way ANOVA with post hoc Tukey's tests, p = 0.07). The effect of CA-074Me on M1-CM-induced neuronal death was further evaluated by counting the MAP2-positive cells with Hoechst-stained nuclei. M1-CM was found to significantly decrease the mean number of MAP2-positive cells (Fig. 4D,E, **p = 0.06 by one-way ANOVA with post hoc Tukey's test). It was also noted that the mean neurite length of the MAP2-positive cells declined significantly in the presence of M1-CM (Fig. 4D,F, ***p < 0.0001 by one-way ANOVA with post hoc Tukey's test). In contrast, when M1-CM was prepared in the presence of CA-074Me, the reduced mean number of cells or declined neurite length of the MAP2-positive cells were completely suppressed (Fig. 4D–F, **p = 0.006, ***p < 0.0001 by one-way ANOVA with post hoc Tukey's test). These results suggest that microglia polarized to the neurotoxic phenotype, but not the neuroprotective phenotype, induce neuronal death in a CatB-dependent manner.
The involvement of CatB in the activation of the NF-κB pathway through the autophagic pathway after HI injury
Soluble fractions of microglia/macrophages isolated from the hippocampus of wild-type mice after HI injury were subjected to immunoblotting analyses. A significant increase in the mean mRNA level of CatB in microglia/macrophages was noted at 24 h after HI (Fig. 5A, **p = 0.008 by one-way ANOVA with post hoc Tukey's test), while the mean protein level of CatB was significantly increased at 24 h after HI (Fig. 5B,C, *p = 0.04 by one-way ANOVA with post hoc Tukey's test). It was also noted that the increase in CatB after HI injury was associated with an increase in beclin 1, which is involved in the formation of autophagosomes in the early stage of autophagy (Fig. 5B,D: for 24 h, *p = 0.03; for 48 h, **p = 0.008; for 72 h, **p = 0.002 by one-way ANOVA with post hoc Tukey's test). An immunohistochemical staining further showed that the immunoreactivity of beclin 1 corresponded well with that of Iba1 (Fig. 5E), thus suggesting a possible role of CatB in the autophagy of microglia/macrophages after HI injury.
Figure 5.

The increased expression of CatB and beclin1 in microglia/macrophages in the ipslateral hippocampus of wild-type mice after HI injury. A, The time course changes in the mRNA expression of CatB in microglia/macrophages isolated from the ipsilateral and contralateral hippocampi of wild-type mice after HI injury. Microglia/macrophages were isolated from the ipsilateral hippocampi of wild-type and CatB−/− mice (n = 6, each) at each time point. The circles and bars represent the mean ± SEM (n = 3). The asterisks indicate a statistically significant difference from the control value (*p < 0.05, **p < 0.01, ***p < 0.001, one-way ANOVA). B, The immunoblots show CatB and beclin1 in the ipsilateral and contralateral hippocampi of wild-type mice following HI injury. C, D, The quantitative analyses of CatB (C) and beclin1 (D) in the immunoblots shown in B. The columns and bars represent the mean ± SEM (n = 3). The asterisks indicate a statistically significant difference between the values (*p < 0.05, **p < 0.01, one-way ANOVA test). E, Immunofluorescent CLSM images of Iba1 (red) and beclin1 (green) in the ipsilateral hippocampus of wild-type mice 3 d after HI injury. Scale bar, 25 μm. con, Contralateral; ipsi, ipsilateral.
The activation of the NF-κB pathway through the CatB-dependent autophagic degradation of IκBα in microglia after OGD/R
Our observations suggest that CatB is a potential molecular switch that shifts microglia/macrophages toward the neurotoxic phenotype. It is considered that some key transcription factors, including NF-κB, activator protein-1, and interferon regulatory factors, cooperatively upregulate the expression of multiple genes such as proinflammatory mediators, and thus lead to the neurotoxic phenotype of microglia/macrophages (Satoh et al., 2010; Saijo et al., 2013). Therefore, one possible underlying mechanism is that CatB is directly involved in the prolonged activation of the NF-κB pathway, because NF-κB is essential for both M1- and M2-like macrophage differentiation (Porta et al., 2009; Biswas and Lewis, 2010). We therefore used an in vitro model of HI to investigate the possible involvement of CatB in the proteolytic degradation of IκBα after an OGD/R burden. When MG6 cells were subjected to reoxygenation for >12 h, MG6 cells showed the initiation of autophagy, which was demonstrated by the staining of MDC, a specific autophagolysosome marker (Fig. 6A). Furthermore, the nuclear translocation of p65 was observed in MG6 cells from 24 h after reoxygenation (Fig. 6B), suggesting that OGD/R activated the NF-κB pathway in MG6 cells to promote the neurotoxic phenotype. These observations clearly showed that a MG6 microglial cell line subjected to OGD/R can closely resemble the condition of microglia in the hippocampus after HI injury.
Figure 6.
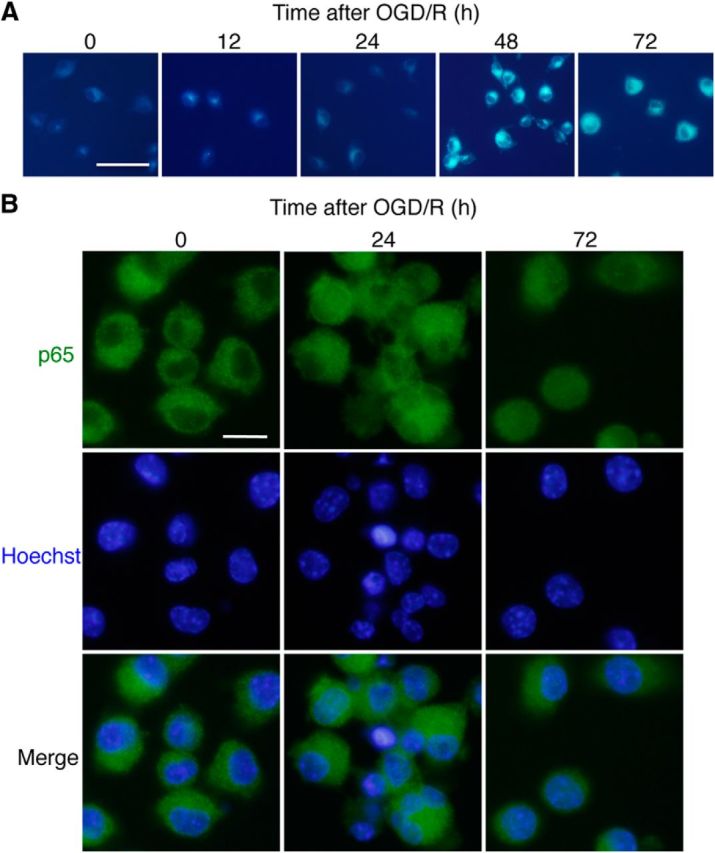
OGD/R-induced autophagy and the subsequent NF-κB nuclear translocation in microglia. A, The incidence of autophagy in MG6 cells following exposure to OGD/R was visualized by the staining of MDC, a specific autophagolysosome marker. Scale bar, 25 μm. B, Immunofluorescent CLMS images indicating the nuclear translocation of p65 (green) in MG6 cells with Hoechst-stained nuclei (blue) at 24 and 72 h after reoxygenation. Scale bar, 2.5 μm.
Next, soluble fractions prepared from a MG6 microglial cell line were subjected to immunoblotting analyses at four different periods after normoxia. At 24 h after reoxygenation, there was a significant increase in the mean level of CatB (Fig. 7A,B: for 24 h, *p = 0.04; for 48 h, ***p = 0.0008; for 72 h, ***p = 0.0002 by one-way ANOVA with post hoc Tukey's test). The mean level of beclin1 was also significantly increased from 12 h after reoxygenation (Fig. 7C: for 12 h, *p = 0.03; for 24 h, **p = 0.007; for 48 h, **p = 0.005; for 72 h, ***p = 0.0006 by one-way ANOVA with post hoc Tukey's test). In the same time course, the mean protein levels of both total IκBα and phosphorylated IκBα were significantly decreased (Fig. 7A,D,E: for IκBα, **p = 0.006, ***p < 0.0001; for phosphorylated IκBα, **p = 0.003, ***p = 0.0007 by one-way ANOVA with post hoc Tukey's test). When OGD/R was applied to MG6 cells in the presence of MG132, a specific proteasome inhibitor, there was no significant change in the mean protein level of either total IκBα or phosphorylated IκBα (Fig. 7F,G, p = 0.09 by one-way ANOVA with post hoc Tukey's test; Fig. 7H, p = 0.08, one-way ANOVA with post hoc Tukey's test). In contrast, CA-074Me significantly inhibited the OGD/R-induced decrease in the mean protein level of total IκBα, but not that of phosphorylated IκBα (Fig. 7F,G, ***p = 0.0007 by one-way ANOVA with post hoc Tukey's test; Fig. 7H, p = 0.09 by one-way ANOVA with post hoc Tukey's test). Although NF-κB is typically associated, through the proteasomal pathway, with increased IκBα phosphorylation and subsequent degradation (Palombella et al., 1994), the present observations suggest the involvement of CatB-mediated autophagy machinery in the OGD/R-induced degradation of IκBα. Finally, a possible proteolytic degradation of IκBα by CatB was further examined using an in vitro digestion assay. The protein band corresponding to IκBα was significantly decreased at 12 h after incubation with soluble lysosomal constituents prepared from MG6 cells at 72 h after reoxygenation (Fig. 7I,J, ***p < 0.0001 by one-way ANOVA with post hoc Tukey's test). The in vitro digestion of recombinant IκBα by soluble lysosomal constituents was significantly blocked by CA-074Me, but only partially blocked by pepstatin A, a specific aspartic protease inhibitor (Fig. 7K,L, *p = 0.04, ***p < 0.0001 by one-way ANOVA with post hoc Tukey's test). These observations suggest that CatB activates the NF-κB pathway through the autophagic degradation of IκBα in microglia/macrophages after HI injury.
Figure 7.

The involvement of microglial CatB-mediated autophagy in the proteolytic degradation of IκBα after OGD/R. A, The immunoblots show CatB, beclin1, total IκBα, and phosphorylated IκBα (p-IκBα) in MG6 cells following OGD/R. B–E, The quantitative analyses of CatB (B), beclin1 (C), IκBα (D), and p-IκBα (E) in the immunoblots shown in A. The columns and bars represent the mean ± SEM (n = 3). The asterisks indicate statistically significant difference from the control value (*p < 0.05, **p < 0.01, ***p < 0.001, one-way ANOVA). F, Effects of MG132, a specific proteasome inhibitor, and CA-074Me, a specific CatB inhibitor, on the OGD/R-induced proteolytic degradation of IκBα and p-IκBα. The immunoblots show IκBα and p-IκBα in MG6 cells 72 h after reoxygenation. G, H, The quantitative analyses of IκBα (G) and p-IκBα (H) in the immunoblots shown in F. I, The immunoblots show proteolytic degradation of IκBα by a lysosomal fraction of MG6 cells. J, The quantitative analyses of IκBα after incubation with lysosomal fraction in the immunoblots shown in I. The columns and bars represent the mean ± SEM (n = 3). The asterisks indicate a statistically significant difference from the control value (***p < 0.001, one-way ANOVA). K, The immunoblots showing proteolytic degradation of IκBα by a lysosomal fraction of MG6 cells in the absence and presence of pepstatin A (pep), a specific aspartic protease inhibitor, or CA-074Me. L, The quantitative analyses of IκBα after incubation with the lysosomal fraction in the absence and presence of pepstatin A or CA-074Me in the immunoblots shown in K. The columns and bars represent the mean ± SEM (n = 3). The asterisks indicate a statistically significant difference from none (**p < 0.01, ***p < 0.001, one-way ANOVA).
A possible functional connection between CatB and CatE in HI-induced hippocampal neuronal damage
In the course of experiments, we unexpectedly found that the variation of the hippocampal damage in neonatal CatE−/− mice was small and that the mean ratio of the damaged area (percentage) was significantly lower in neonatal CatE−/− mice than in neonatal wild-type mice (Fig. 8A,B, ***p = 0.0003 by unpaired t test). HI induced the hippocampal neuronal damage in neonatal CatE−/− and CatB−/−/E−/− mice to a similar extent, suggesting that CatE is placed upstream of CatB expression following HI. It was also noted that, in contrast to CatB, CatE was undetectable in the mouse brain, as previously reported (Amano et al., 1995). At 24 h after HI, immunoreactivity for CatE was exclusively found in microglia, and not in either astrocytes or neurons (Fig. 8C), as previously reported (Nakanishi et al., 1993, 1994; Amano et al., 1995; Sastradipura et al., 1998; Nakanishi, 2003a,b). The similar protective effects against HI-induced hippocampal neuronal damage of CatE deficiency prompted us to examine the effect of CatE deficiency on the HI-induced increase of CatB. In wild-type mice, both pro-CatB and mature forms of CatB were increased at 72 h after HI. Rather surprisingly, there was no significant increase in either the pro-CatB or mature forms of CatB in CatE−/− mice (Fig. 8D,E, ***p < 0.0001 by one-way ANOVA with post hoc Tukey's test). The mean mRNA levels of both CatE and TRAIL were significantly increased in the ipsilateral hemisphere after HI injury (Fig. 8F, ***p < 0.0001 by one-way ANOVA with post hoc Tukey's test; Fig. 8G: for 24 h, ***p = 0.0005; for 48 h, ***p = 0.0002; for 72 h, **p = 0.002 by one-way ANOVA with post hoc Tukey's test). It was also noted that the mean mRNA level of the TRAIL death receptor DR5 in microglia/macrophages was significantly increased after HI injury (Fig. 9A, ***p < 0.0001 by one-way ANOVA with post hoc Tukey's test).
Figure 8.

CatE deficiency prevents neuronal damage in the hippocampus of neonatal mice 3 d after HI injury. A, Histological changes in the ipsilateral hippocampi of wild-type (+/+) and CatE−/− mice 3 d after HI injury stained with fluorescent Nissl. B, The quantification of the percentage of damaged areas to the total area in the hippocampal layers of wild-type (+/+; n = 30), CatE−/− (n = 14), and CatB−/−/E−/− (n = 6) mice 3 d after HI. The asterisks indicate a statistically significant difference from the control value (***p < 0.001, unpaired t test). C, Immunofluorescent CLSM images of CatE (green), and merged images with Iba1, GFAP, and Nissl (red) in the ipsilateral hippocampus of wild-type mice 3 d after HI. Scale bar, 50 μm. D, The immunoblots show CatB in the ipsilateral and contralateral hippocampus of wild-type and CatE−/− mice following HI injury. E, The quantitative analyses of CatB in the immunoblots shown in D. The columns and bars represent the mean ± SEM (n = 3). The asterisks indicate a statistically significant difference between the values (**p < 0.01, one-way ANOVA). F, G, The mRNA expression of CatE (F) and TRAIL (G) in microglia/macrophages isolated from the ipsilateral hippocampus of wild-type mice (n = 6, each) at each time point. The columns and bars represent the mean ± SEM (n = 3). The asterisks indicate a statistically significant difference between the values (**p < 0.01, ***p < 0.001, one-way ANOVA). con, Contralateral; ipsi, ipsilateral.
Figure 9.

The possible involvement of the microglial CatE/TRAIL system in the activation of NF-κB and the subsequent increase of CatB expression. A, Expression of a TRAIL receptor, DR5, on microglia/ macrophages isolated from the hippocampus of wild-type mice following HI injury. B, C, The increased mRNA expression of CatE in MG6 cells (B) and the mean amount of TRAIL secreted from MG6 cells (C) after OGD/R. It was noted that CatE siRNA significantly suppressed the increased expression of CatE and the secretion of TRAIL after OGD/R. The columns and bars represent the mean ± SEM (n = 3). The asterisks indicate a statistically significant difference from the control value (***p < 0.001, one-way ANOVA). The daggers indicate a statistically significant difference from the control siRNA value (†††p < 0.001, one-way ANOVA). D, The immunoblots show IκBα and phosphorylated IκBα (p-IκBα) in MG6 cells after treatment with TRAIL (100 ng/ml). E, F, The quantitative analyses of total IκBα (E) and p-IκBα (F) in the immunoblots shown in D. The columns and bars represent the mean ± SEM (n = 3). The asterisks indicate a statistically significant difference from the control value (***p < 0.001, one-way ANOVA). G, The increased mRNA expression of CatB in MG6 cells after treatment with TRAIL in the absence and presence of MG132 (10 μm), a specific proteasome inhibitor. The columns and bars represent the mean ± SEM (n = 3). The asterisks indicate a statistically significant difference from the control value (***p < 0.001, one-way ANOVA). The daggers indicate a statistically significant difference from TRAIL in the absence of MG132 (†††p < 0.001, one-way ANOVA). H, The immunoblots show CatB in MG6 cells after treatment with TRAIL. I, The quantitative analyses of CatB in the immunoblots shown in H. The columns and bars represent the mean ± SEM (n = 3). The asterisks indicate a statistically significant difference from the control value (***p < 0.001, one-way ANOVA). The daggers indicate statistically a significant difference from TRAIL in the absence of MG132 (†††p < 0.001, one-way ANOVA). con, Contralateral; ipsi, ipsilateral.
The involvement of the microglial CatE/TRAIL system in the activation of NF-κB and the subsequent increase of CatB expression
It is considered likely that the CatE/TRAIL system is responsible for the activation of NF-κB and the increased expression of CatB in microglia/macrophages, because CatE catalyzes the proteolytic release of soluble TRAIL from the cell surface (Kawakubo et al., 2007), which can induce the activation of NF-κB (Hu et al., 1999; Zhang et al., 2015). This possibility was examined using a MG6 microglial cell line subjected to OGD/R.
The mean mRNA level of CatE was significantly increased in MG6 cells from 48 h after reoxygenation (Fig. 9B, ***p < 0.0001 by one-way ANOVA with post hoc Tukey's test). The OGD/R-induced increase in the mean mRNA level of CatE was significantly suppressed by CatE siRNA, but not by control siRNA (Fig. 9B, †††p < 0.0001 by one-way ANOVA with post hoc Tukey's test). Furthermore, the mean protein level of TRAIL secreted from MG6 cells was also significantly increased from 48 h after reoxygenation (Fig. 9C, ***p < 0.0001 by one-way ANOVA with post hoc Tukey's test). The OGD/R-induced secretion of TRAIL from MG6 microglia was significantly suppressed by CatE siRNA (Fig. 9C, ***p < 0.0001 by one-way ANOVA with post hoc Tukey's test), suggesting that CatE is necessary for the secretion of TRAIL from MG6 cells after reoxygenation. Finally, the possible involvement of TRAIL in the activation of NF-κB and the subsequent increase of CatB expression was examined. The mean protein level of total IκBα was significantly decreased, while that of phosphorylated IκBα was significantly increased in MG6 cells from 10 min after treatment with TRAIL (Fig. 9D–F: for 10 and 30 min, ***p < 0.0001; for 60 min, ***p = 0.0007 by one-way ANOVA with post hoc Tukey's test). Moreover, TRAIL significantly increased both the mRNA and protein levels of CatB (Fig. 9G, ***p = 0.0004 by one-way ANOVA with post hoc Tukey's tests; Fig. 9H,I, ***p = 0.0005 by one-way ANOVA with post hoc Tukey's test). Importantly, the TRAIL-induced increase in the protein level of CatB was significantly suppressed by MG132, suggesting the involvement of the proteasomal pathway (Fig. 9G–I, †††p = 0.0007 by one-way ANOVA with post hoc Tukey's test).
Discussion
In the present study, we elucidated the role of CatB in the phenotypic changes of microglia/macrophages and their functional outcomes in a neonatal mouse model of HI-induced brain injury. We first found that HI-induced brain injury in CatB−/− neonatal mice was significantly reduced. At the same time, CatB deficiency suppressed the polarization of microglia/macrophages to the neurotoxic phenotype and transiently promoted their polarization to the neuroprotective phenotype after HI injury. Furthermore, we unexpectedly found a functional proteolytic relay through CatE and CatB. CatE increases the expression of CatB in microglia/macrophages after HI injury through the proteolytic liberation of TRAIL, which in turn induces the activation of NF-κB in a proteasome-dependent manner. The transcription factor PU.1 and its DNA binding, which enhance CatE expression (Cook et al., 2001), are upregulated in microglia after HI injury (Walton et al., 2000). Therefore, it is considered that a proteolytic relay through the early CatE/TRAIL-dependent proteasomal and late CatB-dependent autophagic pathways for NF-κB activation plays an essential role in the neurotoxic polarization of microglia/macrophages following HI injury (Fig. 10).
Figure 10.

A schematic illustration representing the proteolytic relay of NF-κB activation through the early CatE-dependent proteasomal pathway and the late CatB-dependent lysosomal pathway in the neurotoxic polarization of microglia/macrophages following HI injury. Ub, Ubiquitin.
The differentiation of both neurotoxic and neuroprotective microglia/macrophage requires NF-κB activation (Porta et al., 2009; Biswas and Lewis, 2010). NF-κB activity is usually upregulated in neurotoxic microglia/macrophages, whereas neuroprotective microglia/macrophages are considered to have less NF-κB activity (Biswas and Lewis, 2010; Mancino and Lawrence, 2010). NF-κB is therefore considered to be one of the key transcription factors involved in the regulation of the expression of multiple genes that leads to the neurotoxic polarization of microglia/macrophages. NF-κB is activated by the proteolytic degradation of IκBα and the subsequent nuclear translocation of NF-κB. The ubiquitin–proteasome system is generally involved in the signal-induced IκBα degradation (Palombella et al., 1994). However, there is accumulating evidence demonstrating that the autophagy machinery is also involved in the IκBα degradation and in the subsequent NF-κB activation following treatment with TNF-α (Colleran et al., 2011; Criollo et al., 2012). Our in vivo observations demonstrate that the CatB-mediated autophagy machinery promotes IκBα degradation and the subsequent activation of NF-κB in microglia/macrophages following HI injury. Furthermore, our in vitro studies indicate that a specific CatB inhibitor, but not a proteasome inhibitor, significantly inhibited the OGD/R-induced degradation of IκBα and the subsequent activation of NF-κB in a MG6 microglial cell line. These present observations are consistent with those from a previous report (Colleran et al., 2011), which indicated that NF-κB can be maintained in a persistently activated state through the autophagic degradation of IκBα in intestinal epithelial cells. Therefore, CatB-mediated autophagy plays an important role in the OGD/R-induced proteolytic degradation of IκBα in microglia/macrophages. CatB could be involved in neurotoxic microglia/macrophages-induced neuronal death though two differential mechanisms. One mechanism is the direct killing of neurons by CatB secreted from the neurotoxic microglia/macrophages (Kingham and Pocock, 2001). The other is that CatB is directly or indirectly involved in the production and secretion of inflammatory mediators from neurotoxic microglia/macrophages (Wendt et al., 2009). The results of the present study suggest that the latter mechanism is the more likely case because the simultaneous administration of CA-074 and M1-CM failed to block neuronal death. Therefore, neurotoxic molecules, including nitric oxide, TNF-α, and IL-1β, secreted from microglia may be involved in neuronal death after OGD/R and HI injury.
On the other hand, CatE catalyzes the proteolytic release of soluble TRAIL from the cell surface (Kawakubo et al., 2007), which can induce the activation of NF-κB through TRAIL receptors (Hu et al., 1999; Zhang et al., 2015). CatE, an aspartic lysosomal protease, is found in the endosomal structures of microglia (Sastradipura et al., 1998). It is also noted that the precursor form of CatE secreted from microglia can be converted into the mature form in certain extracellular environments (Nakanishi 2003a). In the present study, we found that CatE is necessary for the OGD/R-induced TRAIL secretion from a MG6 microglial cell line. Furthermore, TRAIL significantly increased the mean levels of CatB in both mRNA and protein, in a proteasome-dependent manner. Therefore, it is considered that the CatE/TRAIL system (Kawakubo et al., 2007) is responsible for the HI-induced increase in CatB expression through proteasome-dependent NF-κB activation during the early phase of HI, because CatB genes possess the NF-κB binding site (Bien et al., 2004). After this early activation of NF-κB, autophagy may cause a delayed but long-lasting activation of NF-κB. It is hypothesized that NF-κB may enhance the expression of CatB and beclin 1 to promote autophagy during the late phase of HI, because beclin 1 genes also possess the NF-κB binding site (Copetti et al., 2009).
In this study, we have provided the first evidence for a critical role of the proteolytic relay of NF-κB activation through the early CatE/TRAIL-dependent proteasomal and late CatB-dependent autophagic pathways in the neurotoxic polarization of microglia/macrophages following HI injury (Fig. 10). Therefore, a proteolytic relay through modulator actions of CatE and CatB could work as a phenotypic switch in microglia/macrophages along the M1–M2 phenotypic continuum through the dynamics of NF-κB activity. The pharmacological inhibition of CatE or CatB can protect against brain injury through the phenotypic shift of microglia/macrophages toward the neuroprotective phenotype, which is important in resolving the inflammatory responses associated with neurodegeneration.
Footnotes
This research was supported by the Japan Agency for Medical Research and Development-Core Research for Evolutional Science and Technology, Japan Agency for Medical Research and Development.
The authors declare no competing financial interests.
References
- Amano T, Nakanishi H, Oka M, Yamamoto K. Increased expression of cathepsins E and D in reactive microglial cells associated with spongiform degeneration in the brain stem of senescent-accelerated mouse. Exp Neurol. 1995;136:171–182. doi: 10.1006/exnr.1995.1094. [DOI] [PubMed] [Google Scholar]
- Bien S, Ritter CA, Gratz M, Sperker B, Sonnemann J, Beck JF, Kroemer HK. Nuclear factor-κB mediates up-regulation of cathepsin B by doxorubicin in tumor cells. Mol Pharmacol. 2004;65:1092–1102. doi: 10.1124/mol.65.5.1092. [DOI] [PubMed] [Google Scholar]
- Biswas SK, Lewis CE. NF-κB as a central regulator of macrophage function in tumors. J Leukoc Biol. 2010;88:877–884. doi: 10.1189/jlb.0310153. [DOI] [PubMed] [Google Scholar]
- Canu N, Tufi R, Serafino AL, Amadoro G, Ciotti MT, Calissano P. Role of the autophagic-lysosomal system on low potassium-induced apoptosis in culture cerebellar granule cells. J Neurochem. 2005;92:1228–1242. doi: 10.1111/j.1471-4159.2004.02956.x. [DOI] [PubMed] [Google Scholar]
- Colleran A, Ryan A, O'Gorman A, Mureau C, Liptrot C, Dockery P, Fearnhead H, Egan LJ. Autophagosomal IκBα degradation plays a role in the long term control of tumor necrosis factor-α-induced nuclear factor-κB (NF-κB) activity. J Biol Chem. 2011;286:22886–22893. doi: 10.1074/jbc.M110.199950. [DOI] [PMC free article] [PubMed] [Google Scholar]
- Cook M, Caswell RC, Richards RJ, Kay J, Tatnell PJ. Regulation of human and mouse procathepsin E gene expression. Eur J Biochem. 2001;268:2658–2668. doi: 10.1046/j.1432-1327.2001.02159.x. [DOI] [PubMed] [Google Scholar]
- Copetti T, Demarchi F, Schneider C. p65/RelA binds and activates the beclin 1 promoter. Autophagy. 2009;5:858–859. doi: 10.4161/auto.8822. [DOI] [PubMed] [Google Scholar]
- Criollo A, Chereau F, Malik SA, Niso-Santano M, Mariño G, Galluzzi L, Maiuri MC, Baud V, Kroemer G. Autophagy is required for the activation of NF-κB. Cell Cycle. 2012;11:194–199. doi: 10.4161/cc.11.1.18669. [DOI] [PubMed] [Google Scholar]
- Deussing J, Roth W, Saftig P, Peters C, Ploegh HL, Villadangos JA. Cathepsins B and D are dispensable for major histocompatibility complex II-mediated antigen presentation. Proc Natl Acad Sci U S A. 1998;95:4516–4521. doi: 10.1073/pnas.95.8.4516. [DOI] [PMC free article] [PubMed] [Google Scholar]
- du Plessis AJ, Volpe JJ. Perinatal brain injury in the preterm and term newborn. Curr Opin Neurol. 2002;15:151–157. doi: 10.1097/00019052-200204000-00005. [DOI] [PubMed] [Google Scholar]
- Gan L, Ye S, Chu A, Anton K, Yi S, Vincent VA, von Schack D, Chin D, Murray J, Lohr S, Patthy L, Gonzalez-Zulueta M, Nikolich K, Urfer R. Identification of cathepsin B as a mediator of neuronal death induced by Aβ-activated microglial cells using a functional genomics approach. J Biol Chem. 2004;279:5565–5572. doi: 10.1074/jbc.M306183200. [DOI] [PubMed] [Google Scholar]
- Halle A, Hornung V, Petzold GC, Stewart CR, Monks BG, Reinheckel T, Fitzgerald KA, Latz E, Moore KJ, Golenbock DT. The NALP3 inflammasome is involved in the innate immune response to amyloid-β. Nat Immunol. 2008;9:857–865. doi: 10.1038/ni.1636. [DOI] [PMC free article] [PubMed] [Google Scholar]
- Han F, Chen YX, Lu YM, Huang JY, Zhang GS, Tao RR, Ji YL, Liao MH, Fukunaga K, Qin ZH. Regulation of the ischemia-induced authophagy-lysosome processes by nitrosative stress in endothekial cell. J Pineal Res. 2011;51:124–135. doi: 10.1111/j.1600-079X.2011.00869.x. [DOI] [PubMed] [Google Scholar]
- Hu WH, Johnson H, Shu HB. Tumor necrosis factor-related apoptosis-inducing ligand receptors signal NF-κB and JNK activation and apoptosis through distinct pathways. J Biol Chem. 1999;274:30603–30610. doi: 10.1074/jbc.274.43.30603. [DOI] [PubMed] [Google Scholar]
- Hu X, Li P, Guo Y, Wang H, Leak RK, Chen S, Gao Y, Chen J. Microglia/macrophage polarization dynamics reveal novel mechanism of injury expansion after focal cerebral ischemia. Stroke. 2012;43:3063–3070. doi: 10.1161/STROKEAHA.112.659656. [DOI] [PubMed] [Google Scholar]
- Hyman BT, Yuan J. Apoptotic and non-apoptotic roles of caspases in neuronal physiology and pathphysiology. Nat Rev Neurosci. 2012;13:395–406. doi: 10.1038/nrn3228. [DOI] [PubMed] [Google Scholar]
- Kawakubo T, Okamoto K, Iwata J, Shin M, Okamoto Y, Yasukochi A, Nakayama KI, Kadowaki T, Tsukuba T, Yamamoto K. Cathepsin E prevents tumor growth and metastasis by catalyzing the proteolytic release of soluble TRAIL from tumor cell surface. Cancer Res. 2007;67:10869–10878. doi: 10.1158/0008-5472.CAN-07-2048. [DOI] [PubMed] [Google Scholar]
- Kingham PJ, Pocock JM. Microglial secreted cathepsin B induces neuronal apoptosis. J Neurochem. 2001;76:1475–1484. doi: 10.1046/j.1471-4159.2001.00146.x. [DOI] [PubMed] [Google Scholar]
- Koike M, Shibata M, Tadakoshi M, Gotoh K, Komatsu M, Waguri S, Kawahara N, Kuida K, Nagata S, Kominami E, Tanaka K, Uchiyama Y. Inhibition of autophagy prevents hippocampal pyramidal neuron death after hypoxic-ischemic injury. Am J Pathol. 2008;172:454–469. doi: 10.2353/ajpath.2008.070876. [DOI] [PMC free article] [PubMed] [Google Scholar]
- Mancino A, Lawrence T. Nuclear factor-κB and tumor-associated macrophages. Clin Cancer Res. 2010;16:784–789. doi: 10.1158/1078-0432.CCR-09-1015. [DOI] [PMC free article] [PubMed] [Google Scholar]
- Martinez FO, Gordon S. The M1 and M2 paradigm of macrophage activation: time for reassessment. F1000Prime Rep. 2014;6:13. doi: 10.12703/P6-13. [DOI] [PMC free article] [PubMed] [Google Scholar]
- Murray PJ, Allen JE, Biswas SK, Fisher EA, Gilroy DW, Goerdt S, Gordon S, Hamilton JA, Ivashkiv LB, Lawrence T, Locati M, Mantovani A, Martinez FO, Mege JL, Mosser DM, Natoli G, Saeij JP, Schultze JL, Shirey KA, Sica A, et al. Macrophage activation and polarization: nomenclature and experimental guidelines. Immunity. 2014;41:14–20. doi: 10.1016/j.immuni.2014.06.008. [DOI] [PMC free article] [PubMed] [Google Scholar]
- Nakanishi H. Microglial functions and proteases. Mol Neurobiol. 2003a;27:163–176. doi: 10.1385/MN:27:2:163. [DOI] [PubMed] [Google Scholar]
- Nakanishi H. Neuronal and microglial cathepsins in aging and age-related diseases. Ageing Res Rev. 2003b;2:367–381. doi: 10.1016/S1568-1637(03)00027-8. [DOI] [PubMed] [Google Scholar]
- Nakanishi H, Tsukuba T, Kondou T, Tanaka T, Yamamoto K. Transient forebrain ischemia induces increased expression and specific localization of cathepsins E and D in rat hippocampus and neostriatum. Exp Neurol. 1993;121:215–223. doi: 10.1006/exnr.1993.1088. [DOI] [PubMed] [Google Scholar]
- Nakanishi H, Tominaga K, Amano T, Hirotsu I, Inoue T, Yamamoto K. Age-related changes in activities and localization of cathespins D, E, B and L in the rat brain tissues. Exp Neurol. 1994;126:119–128. doi: 10.1006/exnr.1994.1048. [DOI] [PubMed] [Google Scholar]
- Palombella VJ, Rando OJ, Goldberg AL, Maniatis T. The ubiquitin-proteasome pathway is required for processing the NF-κB1 precursor protein and the activation of NF-κB. Cell. 1994;78:773–785. doi: 10.1016/S0092-8674(94)90482-0. [DOI] [PubMed] [Google Scholar]
- Porta C, Rimoldi M, Raes G, Brys L, Ghezzi P, Di Liberto D, Dieli F, Ghisletti S, Natoli G, De Baetselier P, Mantovani A, Sica A. Tolerance and M2 (alternative) macrophage polarization are related processes orchestrated by p50 nuclear factor kB. Proc Natl Acad Sci U S A. 2009;106:14978–14983. doi: 10.1073/pnas.0809784106. [DOI] [PMC free article] [PubMed] [Google Scholar]
- Saijo K, Crotti A, Glass CK. Regulation of microglia activation and deactivation by nuclear receptors. Glia. 2013;61:104–111. doi: 10.1002/glia.22423. [DOI] [PubMed] [Google Scholar]
- Sastradipura DF, Nakanishi H, Tsukuba T, Nishishita K, Sakai H, Kato Y, Gotow T, Uchiyama Y, Yamamoto K. Identification of cellular compartments involved in processing of cathepsin E in primary cultures of rat microglia. J Neurochem. 1998;70:2045–2056. doi: 10.1046/j.1471-4159.1998.70052045.x. [DOI] [PubMed] [Google Scholar]
- Satoh T, Takeuchi O, Vandenbon A, Yasuda K, Tanaka Y, Kumagai Y, Miyake T, Matsushita K, Okazaki T, Saitoh T, Honma K, Matsuyama T, Yui K, Tsujimura T, Standley DM, Nakanishi K, Nakai K, Akira S. The Jmid3-Irf4 axis regulates M2 macrophage polarization and host responses against helminth infection. Nat Immunol. 2010;11:936–944. doi: 10.1038/ni.1920. [DOI] [PubMed] [Google Scholar]
- Sun L, Wu Z, Baba M, Peters C, Uchiyama Y, Nakanishi H. Cathepsin B-dependent motor neuron death after nerve injury in the adult mouse. Biochem Biophys Res Commun. 2010;3999:391–395. doi: 10.1016/j.bbrc.2010.07.084. [DOI] [PubMed] [Google Scholar]
- Sun L, Wu Z, Hayashi Y, Peters C, Tsuda M, Inoue K, Nakanishi H. Microglial cathepsin B contributes to the initiation of peripheral inflammation-induced chronic pain. J Neurosci. 2012;32:11330–11342. doi: 10.1523/JNEUROSCI.0677-12.2012. [DOI] [PMC free article] [PubMed] [Google Scholar]
- Terada K, Yamada J, Hayashi Y, Wu Z, Uchiyama Y, Peters C, Nakanishi H. Involvement of cathepsin B in the processing and secretion of interleukin-1β in chromogranin A-stimulated microglia. Glia. 2010;58:114–124. doi: 10.1002/glia.20906. [DOI] [PubMed] [Google Scholar]
- Tsuchiya K, Kohda Y, Yoshida M, Zhao L, Ueno T, Yamashita J, Yoshioka T, Kominami E, Yamashima T. Postictal blockade of ischemic hippocampal neuronal death in primates using selective cathepsin inhibitors. Exp Neurol. 1999;155:187–194. doi: 10.1006/exnr.1998.6988. [DOI] [PubMed] [Google Scholar]
- Tsukuba T, Okamoto K, Okamoto Y, Yanagawa M, Kohmura K, Yasuda Y, Uchi H, Nakahara T, Furue M, Nakayama K, Kadowaki T, Yamamoto K, Nakayama KI. J Biochem. 2003;134:893–902. doi: 10.1093/jb/mvg216. [DOI] [PubMed] [Google Scholar]
- Walton MR, Gibbons H, MacGibbon GA, Sirimanne E, Saura J, Gluckman PD, Dragunow M. PU.1 expression in microglia. J Neuroimmunol. 2000;104:109–115. doi: 10.1016/S0165-5728(99)00262-3. [DOI] [PubMed] [Google Scholar]
- Wen YD, Sheng R, Zhang LS, Han R, Zhang X, Zhang XD, Han F, Fukunaga K, Qin ZH. Neuronal injury in rat model of permanent focal cerebral ischemia is associated with activation of autophagic and lysosomal pathways. Autophagy. 2008;4:762–769. doi: 10.4161/auto.6412. [DOI] [PubMed] [Google Scholar]
- Wendt W, Schulten R, Stichel CC, Lübbert H. Intra- versus extracellular effects of microglia-derived cysteine proteases in a conditioned medium transfer model. J Neurochem. 2009;110:1931–1941. doi: 10.1111/j.1471-4159.2009.06283.x. [DOI] [PubMed] [Google Scholar]
- Wu Z, Sun L, Hashioka S, Yu S, Schwab C, Okada R, Hayashi Y, McGeer PL, Nakanishi H. Differential pathways for interleukin-1β production activated by chromogranin A and amyloid β in microglia. Neurobiol Aging. 2013;34:2715–2725. doi: 10.1016/j.neurobiolaging.2013.05.018. [DOI] [PubMed] [Google Scholar]
- Yamagata M, Yamamoto A, Kako E, Kaneko N, Matsubara K, Sakai K, Sawamoto K, Ueda M. Human dental pulp-derived stem cells protect against hypoxic-ischemic brain injury in neonatal mice. Stroke. 2013;44:551–554. doi: 10.1161/STROKEAHA.112.676759. [DOI] [PubMed] [Google Scholar]
- Yamashima T, Kohda Y, Tsuchiya K, Ueno T, Yamashita J, Yoshioka T, Kominami E. Inhibition of ischaemic hippocampal neuronal death in primates with cathepsin B inhibitor CA-074: a novel strategy for neuroprotection based on “calpain-cathepsin hypothesis.”. Eur J Neurosci. 1998;10:1723–1733. doi: 10.1046/j.1460-9568.1998.00184.x. [DOI] [PubMed] [Google Scholar]
- Zhang L, Dittmer MR, Blackwell K, Workman LM, Hostager B, Habelhah H. TRAIL activates JNK and NF-κΒ through RIP1-dependent and -independent pathways. Cell Signal. 2015;27:306–314. doi: 10.1016/j.cellsig.2014.11.014. [DOI] [PMC free article] [PubMed] [Google Scholar]
- Zhang X, Wu Z, Hayashi Y, Okada R, Nakanishi H. Peripheral role of cathepsin S in Th1 cell-dependent transition of nerve injury-induced acute pain to a chronic pain state. J Neurosci. 2014;34:3013–3022. doi: 10.1523/JNEUROSCI.3681-13.2014. [DOI] [PMC free article] [PubMed] [Google Scholar]