

Abstract
Compelling evidence that our sensitivity to facial structure is conserved across the primate order comes from studies of the “Thatcher face illusion”: humans and monkeys notice changes in the orientation of facial features (e.g., the eyes) only when faces are upright, not when faces are upside down. Although it is presumed that face perception in primates depends on face-selective neurons in the inferior temporal (IT) cortex, it is not known whether these neurons respond differentially to upright faces with inverted features. Using microelectrodes guided by functional MRI mapping, we recorded cell responses in three regions of monkey IT cortex. We report an interaction in the middle lateral face patch (ML) between the global orientation of a face and the local orientation of its eyes, a response profile consistent with the perception of the Thatcher illusion. This increased sensitivity to eye orientation in upright faces resisted changes in screen location and was not found among face-selective neurons in other areas of IT cortex, including neurons in another face-selective region, the anterior lateral face patch. We conclude that the Thatcher face illusion is correlated with a pattern of activity in the ML that encodes faces according to a flexible holistic template.
Keywords: electrophysiology, face perception, fMRI, visual illusion
Introduction
In primates, faces activate a network of brain regions (Kanwisher and Yovel, 2009), including interconnected areas in the inferior temporal (IT) cortex (Moeller et al., 2008). Previous studies posited a hierarchical organization of the face-processing system, whereby more posterior IT regions are less tolerant of image transformations than anterior regions. For example, neurons in the macaque middle lateral face patch (ML) are more sensitive to head rotations in depth than the anterior lateral face patch (AL) (Freiwald and Tsao, 2010). ML neurons also respond to isolated and combinations of facial features (Freiwald et al., 2009), and yet their sensitivity to facial features is reversed with inversion, suggesting that ML neurons match stimuli against an upright face template (Freiwald et al., 2009). Whether this template is fixed with respect to the visual field position of the face (Freiwald and Tsao, 2010; Issa and DiCarlo, 2012) or dependent on the relative position of facial features remains unclear. Here we test whether the coding of facial features in ML is contingent on the orientation of the global face shape and whether the responses of the neurons are resistant to changes in the position of features, relative to fixation.
We address these issues using the Thatcher illusion, which, in behavioral studies, has been used to show that it is more difficult to detect the orientation of local features (e.g., the eyes) when a face is upside down (Thompson, 1980). The Thatcher illusion has been demonstrated in both humans (Rhodes et al., 1993; Edmonds and Lewis, 2007) and rhesus monkeys (Dahl et al., 2010) and is thought to occur because inverting a face disrupts the spatial sequence of features that distinguishes faces from other objects (i.e., an orientation-specific face template; Rossion, 2013). Despite its popularity in the behavioral literature and its replication across species, there have been few attempts to localize the neural basis of the Thatcher illusion.
Based on human electrophysiological studies (Milivojevic et al., 2003; Gu et al., 2007; Sadeh and Yovel, 2010), it is widely assumed that the Thatcher illusion emerges at an initial stage of face processing despite source localization issues. Psalta et al. (2014) investigated the neural correlates of the Thatcher illusion using expressive face stimuli with an fMRI-adaptation paradigm. They found that the BOLD signal in the superior temporal sulcus (STS) tracked the behavioral response to Thatcherized stimuli. However, inferring neural selectivity from release of BOLD adaptation is difficult (Sawamura et al., 2006), and direct neural measures of selectivity are necessary to examine the neural basis of the Thatcher illusion.
We compared the responses of face-selective neurons to Thatcherized faces in areas ML and AL to identify the neural basis of the Thatcher illusion. We expected to track a response profile (i.e., reduced response strength when the eyes of an upright face were inverted) in the regions responsible for the Thatcher illusion. To further evaluate the exclusivity of this effect, we also recorded the responses of face-selective neurons found in an expanse of STS outside fMRI-defined face patches.
Materials and Methods
Subjects.
Two male rhesus monkeys (Macaca mulatta) served as subjects. They were implanted with a head post, and, subsequent to the fMRI mapping, a recording chamber was positioned to target the middle lateral and anterior lateral face patches (Taubert et al., 2015). Animal care and experimental procedures complied with national, European, and National Institute of Health guidelines and were approved by the Ethical Committee of the KU Leuven Medical School.
Functional imaging.
Immediately preceding any scan session, a contrast agent (monocrystalline iron oxide nanoparticle, Feraheme, AMAG Pharmaceuticals; 8–11 mg/kg) was injected into each monkey's femoral vein. The monkeys were scanned while fixating on a red target (size, 0.2°) superimposed on the stimuli. During scan sessions, the monkeys were seated in a sphinx position with their heads fixed in a plastic chair. Eye position was continuously monitored (120 Hz; Iscan), and monkeys received a liquid reward when maintaining fixation within a square fixation window (size, 2 × 2°).
In a block design localizer, faces, bodies, hands, fruits, and gadgets were presented in blocks. These images have been used to localize the face patches in previous studies (Tsao et al., 2006). The monkeys were scanned on a 3T Siemens Trio scanner following standard procedures (Vanduffel et al., 2001). Functional MR images were acquired using a custom-made eight-channel coil and a gradient-echo single-shot echo planar imaging sequence (repetition time, 2 s; echo time, 17 ms; flip angle, 75°; 80 × 80 matrix; 40 slices; no gap; isotropic voxel size, 1.25 mm). The functional images were coregistered with a 0.4 mm isotropic anatomical image of each monkey's brain serving as a template.
The functional data were resampled to 1 mm isotropic voxel size. All valid runs (fixation >95%) were combined in a fixed effects model for each monkey separately in native space. They were analyzed using a general linear model with six regressors, one for each of the five stimulus classes and the fixation condition, plus six additional head-motion regressors (translation and rotation in three dimensions) per run. The resulting t maps were thresholded at p < 0.05 (familywise error rate; Fig. 1A–C).
Figure 1.
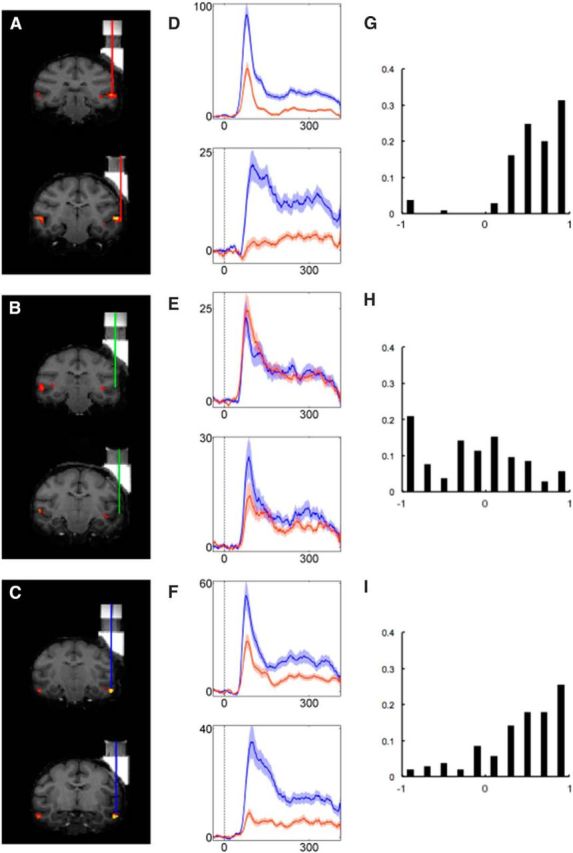
Face selectivity in ML, AL, and OUT. A–C, Recording positions are indicated by red, green, and blue vertical lines, plotted relative to fMRI activations (face vs bodies, hands, fruits, and gadgets) for each monkey (A, ML; B, OUT; C, AL). D–F, The average responses of responsive neurons in each monkey's ML (D), OUT (E), and AL (F) to face (blue traces) and nonface objects (red traces). Average net firing rate peristimulus time histograms were computed with a bin width of 20 ms and step size of 1 ms. Stimulus onset corresponds to 0 ms. Transparent bands indicate ±SEM. G–I, Distribution of FSI values for ML (G), OUT (H), and AL (I). Data of the two monkeys were combined. An FSI value of >0 indicates that a neuron responded more to face stimuli than nonface stimuli.
Single-unit recordings: stimuli and procedure.
The recording grid locations were defined so that the electrode targeted the ML and AL in the right hemisphere of each animal. In addition to the face patch locations (Fig. 2), we recorded using multiple positions (extending 3 and 2 mm in the anterior–posterior dimension in Monkeys D and G, respectively) in between the ML and AL (and at least 2 mm away from both) in the lower bank of STS (herein referred to as OUT).
Figure 2.

Sample sizes and average index values (with SD) broken down by monkey and grid position. Grid references provided reflect the millimeter difference from the most posterior recording position in each monkey (which corresponded approximately with the center of the functionally defined area ML). Global Orientation Index (GOI) = (average net response to upright face conditions − average net response to inverted face conditions)/(|average net response to upright face conditions| + |average net response to inverted face conditions|). LOI (Upright Faces) = [average net response (upright face/upright eyes) − average net response (upright face/inverted eyes)]/[|average net response (upright face/upright eyes)| + |average net response (upright face/inverted eyes)|]. LOI (Inverted Faces) = [average net response (inverted face/upright eyes) − average net response (inverted face/inverted eyes)]/[|average net response (inverted face/upright eyes)| + |average net response (inverted face/inverted eyes)|].
Single-unit recordings were performed with epoxylite-insulated tungsten microelectrodes (FHC; in situ measured impedance between 1.3 and 1.8 MΩ) using techniques described previously (Sawamura et al., 2006). Every electrode was lowered with a Narishige microdrive into the brain using a guide tube that was fixed in a standard Crist grid positioned within the recording chamber. After amplification and filtering between 540 Hz and 6 kHz, spikes of a single unit were isolated online using a custom amplitude- and time-based discriminator.
The position of the right eye was continuously tracked by means of an infrared video-based tracking system (EyeLink, SR Research; sampling rate, 1 kHz). Stimuli were displayed on a CRT display (Brilliance 202 P4, Philips; 1024 × 768 screen resolution; 75 Hz vertical refresh rate) at a distance of 57 cm from the monkey's eyes. The onset and offset of the stimulus were signaled by means of a photodiode detecting luminance changes in a small square in the corner of the display (invisible to the monkey), placed in the same frame as the stimulus events. A digital signal processing computer-based system developed in-house controlled stimulus presentation, event timing, and juice delivery while sampling the photodiode signal, the vertical and horizontal eye positions, and spikes. Time stamps of the recorded spikes, eye positions, and stimulus events were stored for off-line analyses.
Neurons were searched for using the category-search procedure that involved presenting 32 images of the fMRI localizer stimulus set [16 faces and 16 nonface stimuli (4 fruit, 4 bodies, 4 hands, 4 gadgets)] in a pseudorandom order. Stimuli were presented for 300 ms each with an intertrial interval of ∼500 ms during passive fixation (fixation window size, 2 × 2°). Monkeys were trained to maintain fixation on a small (0.5° in height), red fixation point at the center of the screen while the stimuli were being presented behind the fixation point. Fixation was required in a period from 300 ms before stimulus to 300 ms after stimulus. A liquid reward was given if the monkey maintained fixation for the entire length of a trial (900 ms). A trial was immediately aborted if the monkey blinked or looked away from the fixation window after the trial was initiated.
In each recording, session we recorded the first single unit encountered at the predetermined depth with respect to the silence associated with the sulcus, regardless of face selectivity or visual responsiveness. Each unit thereafter was at least 150 μm deeper than the previous one. When a neuron had been isolated, we continued to show the category-search stimuli, repeating each of the 32 stimuli at least twice. The average responses of visually responsive neurons to face and nonface stimuli are presented in Figure 1D–F, and the number of responsive neurons per recording site in Figure 2.
Then we recorded each neuron's response to the conditions of the Thatcher manipulation. Any circularity associated with stimulus use was avoided by using an independent set of faces. Six female faces with neutral expressions were prepared with their external features removed (each face was 10° in height). For each face, the two eyes were removed and replaced with the eyes of another face to create a set of six chimeric identities to serve as stimuli in the “upright face/upright eyes” condition. These stimuli were manipulated in this way to equate all four conditions by introducing a small disturbance around the eyes. Thus, to create the stimuli for the “upright face/inverted eyes” condition, the chimeric identities were simply copied and the eyes were inverted independent of the upright face. Similarly, the “inverted face/inverted eyes” and “inverted face/upright eyes” stimuli were created by first inverting the entire face and then returning the eyes to their canonical orientation. Examples of the experimental stimuli are provided in Figure 3A. After sufficient data were collected to determine a neuron's face selectivity, the monkeys were required to successfully complete all 24 unique conditions (six chimeric faces by four conditions) at least eight times (192 trials in total).
Figure 3.

Stimuli and responses to Thatcherized faces in ML, AL, and OUT. A Stimuli from main Thatcher Illusion experiment with central red fixation point superimposed. From top to bottom, there were four conditions: upright face/upright eyes, upright face/inverted eyes, inverted face/inverted eyes, and inverted face/upright eyes. B–D, Smoothed peristimulus time histograms (bin width, 20 ms; step size, 1 ms) for face-selective neurons (FSI > 0) in area ML (B), OUT (C), and AL (D) for each of the orientation conditions. Before averaging across neurons, the firing rate of each neuron was normalized with respect to its peak firing rate across stimuli. Stimulus onset corresponds to 0 ms. Transparent bands indicate ±SEM. E–G, Responses of example neurons in each monkey and area: ML (E), OUT (F), and AL (G). Neurons of Monkeys D and G are shown on the top and bottom of each panel, respectively. The same conventions as in Fig. 2B apply.
After the collection of these data, we ran an additional experiment on neurons in area ML with the same stimuli and an identical procedure. However, instead of including global orientation and local orientation in the factorial design, we simply repeated the upright face/upright eyes and upright face/inverted eyes conditions in two locations: (1) the same central position as described previously to replicate the original result and (2) with the entire face moved downward, relative to the central fixation point (Fig. 4A). The relocation of each face was determined on a stimulus-by-stimulus basis, ensuring that the location of the eyes on the screen matched the location of the inverted eyes in the first Thatcher experiment.
Figure 4.

Position tolerance test and local orientation indices. A, Top, Stimuli in the main Thatcher experiment with central red fixation point superimposed on top of the faces. Bottom, Stimuli and their positions relative to red fixation point in the position tolerance test. Each of the conditions has been labeled with a letter (a–f). B, The formula used to create the LOI values depicted in C (corresponding color code included). The conditions are labeled according to A. C, Distribution of LOI values for neurons in each recording region (separated by global orientation condition; see color codes in B).
Single-unit recordings: analysis.
For each unit, the firing rate was computed for each unaborted stimulus presentation in two analysis windows: a 300 ms baseline window starting from 250 ms before stimulus onset and a 300 ms response window starting from 50 ms after stimulus onset. To select responsive units, we used a split-plot (mixed design) ANOVA with Baseline as the repeated factor and Response Window and Stimulus as between-trial factors. Only neurons for which either the main effect of the repeated factor or the interaction of the two factors was significant were included in further analyses as responsive units. Since the ANOVA required an equal number of observations per neuron, we equated the numbers of unaborted stimulus presentations for that analysis by removing the last unaborted presentation of the stimulus that was presented by one trial more than the rest. All other analyses included the responses to all unaborted stimulus presentations. All analyses were performed on baseline-subtracted average net firing rate, after the data from each neuron were normalized by dividing the firing rate for a particular stimulus by the maximum firing rate of the neuron (the response to the “best” stimulus).
For each neuron we computed a face-selectivity index (FSI): FSI = R̄face − R̄nonface/|R̄face| + |R̄nonface|, where R̄face is the mean net firing rate to faces, and R̄nonface is the mean net firing rate to nonface objects in the search stimulus set. For the main analysis of the Thatcher experiment, only neurons with an FSI of >0 were included (Fig. 2).
To analyze the Thatcher experiment, we first tested each neuron's response to each of the six chimeric identities using a split-plot ANOVA with two repeat factors (Window and Condition), where Window had two levels and Condition had four levels (upright face/upright eyes vs upright face/inverted eyes vs inverted face/inverted eyes vs inverted face/upright eyes). Based on these tests, we excluded from further analyses of each neuron those identities (any of the six included in the design) that did not elicit a response significantly greater than baseline activity. The average numbers of identities used in areas ML, OUT, and AL were 4.89, 4.41, and 4 respectively. After selecting the effective identities, the data from each neuron were normalized by taking the baseline-subtracted average net firing rate and dividing the firing rate for each particular stimulus (averaging across trials) by the maximum firing rate of the neuron (the response to the “best” identity in its “best” condition, averaging across trials).
Results
The neurons in both the ML (N = 105; Wilcoxon signed-rank test, p < 0.001) and AL (N = 106; Wilcoxon signed-rank test, p < 0.001) responded more to faces than nonface objects, whereas the responsive units in OUT responded, on average, more to nonface objects than faces (N = 105; Wilcoxon signed-rank test, p < 0.005; Fig. 1D–F). For each neuron, we computed the FSI, with an FSI >0 indicating a stronger average response to faces compared to the other objects. The average FSI was greater in the face patches (ML, mean, 0.58; SD, 0.42; AL, mean, 0.42; SD, 0.48) compared to OUT (mean, −0.17; SD, 0.59). For a breakdown across electrode positions, see Figure 2.
In the Thatcher illusion test, we recorded the firing rates of many of the same units while presenting the monkeys six chimeric faces, each under four different conditions: upright face/upright eyes, upright face/inverted eyes, inverted face/inverted eyes, and inverted face/upright eyes (Fig. 3A). Only those neurons that responded to this independent set of stimuli (see Materials and Methods) and from which we could record spiking activity during at least eight presentations per condition were analyzed further (Fig. 2). For neurons recorded in the ML, with an FSI of >0 (Bell et al., 2011), we performed a 2 × 2 ANOVA with Global Orientation (Upright Face vs Inverted Face) and Local Orientation (Upright Eyes vs Inverted Eyes) entered in the design as repeat factors (see Materials and Methods). Pooling across monkeys (N = 71 neurons with FSI > 0), we found main effects of Global Orientation (F(1,70) = 38.43, p < 0.001) and Local Orientation (F(1,70) = 10.82, p < 0.001). Importantly, there was a significant interaction (F(1,70) = 10.08, p = 0.002; Fig. 3B). Two follow-up contrasts (Bonferroni corrected) confirmed that when the face was upright, neurons responded stronger to upright eyes than inverted eyes (Wilcoxon signed-rank test, p < 0.001). In sharp contrast, when the face was upside down, neurons were not sensitive to the local inversion of the eyes (p = 0.94).
Wilcoxon tests performed on the ML data of each individual monkey confirmed a significantly stronger response to the upright eyes condition than to the inverted eye condition, contingent on the canonical (or upright) orientation of the face in Monkey D (N = 29; upright face/upright eyes vs upright face/inverted eyes, p = 0.002; inverted face/inverted eyes vs inverted face/upright eyes, p = 0.187) and Monkey G (N = 42; upright face/upright eyes vs upright face/inverted eyes, p < 0.001; inverted face/inverted eyes vs inverted face/upright eyes, p = 0.915).
None of the main effects or interactions were significant for neurons (FSI > 0) in the AL (N = 59 neurons; Global Orientation, F(1,58) = 0, p = 0.99; Local Orientation, F(1,58) = 3.79, p = 0.06; Global Orientation by Local Orientation, F(1,58) = 0.09, p = 0.77; Fig. 3C) or OUT (N = 33 neurons; Global Orientation, F(1,32) = 2.13, p = 0.15; Local Orientation, F(1,32) = 0.17, p = 0.68; Global Orientation by Local Orientation, F(1,32) = 0.67, p = 0.42; Fig. 3D). Given that these overall effects were not significant, we did not perform follow-up tests. Figure 3 shows the distribution of the eye orientation preference [local eye orientation index (LOI), upright vs inverted eye; Fig. 2] of the face-selective units in each of the three regions, demonstrating that the absence of Thatcher effect in the AL and OUT did not result from a bimodal distribution of extreme eye orientation preferences.
In addition to the main analysis based on face-selective neurons (FSI > 0), we ran the same ANOVA procedures on responsive non-face-selective neurons (FSI < 0). Although the sample sizes were small (ML, N = 6; OUT, N = 46; AL, N = 24), the only region with a significant interaction between Global Orientation and Local Orientation was ML (F(1,5) = 10.77, p = 0.02).
Issa and DiCarlo (2012) reported previously that neurons in the posterior face patches are more sensitive to eye features presented in the upper visual field. Upright but not inverted faces have eyes that are positioned in the upper visual field relative to fixation, and thus neurons may be more sensitive to the changes of the eye features in upright compared to inverted faces because of a receptive field bias for the upper visual field. To test this possibility, we ran a subsequent experiment on an independent sample of ML neurons (N = 14 neurons with FSI > 0; 6 neurons from Monkey D, 8 from Monkey G), where we repositioned upright stimuli so that the eyes were located in the lower visual field (Fig. 4A). Strikingly, our findings were replicated with centrally positioned stimuli and the repositioned counterparts (Fig. 4B). We ran a 2 × 2 ANOVA with two repeat factors, Screen Position (Center vs Low) and Local Orientation (Upright Eyes vs Inverted Eyes) and found that there was a main effect of Local Orientation with a stronger response to the Upright Eye condition than to the Inverted Eye condition (F(1,13) = 32.66, p < 0.001). This was further supported by two significant contrasts (Bonferroni corrected) testing the effect of Local Orientation at each Screen Position (Center, p = 0.013; Low, p = 0.017). There was no main effect of Screen Position (F(1,13) = 0.31, p = 0.59) nor evidence of an interaction between Screen Position and Local Orientation (F(1,13) = 0.90, p = 0.36). These data show that the greater sensitivity for eye inversion in upright compared to inverted faces does not result from an increased sensitivity for changes in face features in the upper compared to lower visual field.
Discussion
Collectively, these data indicate that face-selective neurons in the ML detect the congruency between the local orientation of features and the global orientation of the face, being differentially sensitive to the orientation of the eyes in upright faces but not in inverted faces. This links previous behavioral findings (Thompson 1980; Adachi et al., 2009; Dahl et al., 2010; Weldon et al., 2013) and neural activity. We used the Thatcher illusion because it is an uncontested marker of face processing that has been reliably measured using different behavioral paradigms in both humans and monkeys (Thompson 1980; Dahl et al., 2010). Remarkably, the sensitivity to Thatcherized stimuli in area ML does not appear to be common to all face-selective populations of IT neurons, indicating a clear functional dissociation among the face-selective patches of IT cortex. The Thatcher face illusion is correlated with a pattern of activity in ML that encodes faces, which, however, does not imply that this property emerges in ML.
Area ML is positioned in the posterior reaches of the face-processing system and, for this reason, might be tasked with more rudimentary stages of face processing than more anterior face-selective regions. Neurons in ML are sensitive to the global structural information carried by contrast polarity (Ohayon et al., 2012) and, at times, respond to face-like objects (such as round fruit; Tsao et al., 2006). ML neurons are known to have tuned responses to specific viewpoints (Freiwald and Tsao, 2010). These data build on these previous findings to suggest that ML neurons are also profoundly sensitive to local feature orientation in upright faces. Freiwald et al. (2009) showed that inversion of a cartoon face, where the mouth and the eyes remain physically identical, reverses feature tuning of ML neurons. This indicates that the mere position of the whole face, relative to fixation, drives the neurons' responses (i.e., a rigid upright face template; Freiwald et al., 2009). Furthermore, neurons in ML and the more posterior face-selective patch respond best to eyes when they are presented in the upper visual field (Issa and DiCarlo, 2012). Yet, our findings with centrally positioned stimuli were replicated when the stimuli were repositioned to the lower visual field. This observation implies that ML neurons are sensitive to eye shape if the face is upright and when the eye features are in the correct position on the face, this position being defined relative to other features or the face contour. Hence, any template being used by area ML is, at least to some degree, position tolerant.
Face-selective neurons outside of fMRI-defined face patches responded similarly to all Thatcher conditions, suggesting that they differ in their functional properties from those found inside the functionally defined system. This speaks to the importance of fMRI-based, or at least population-based, functional localization when recording single-cell responses (Bell et al., 2011). Previous evidence suggests that a small proportion of neurons in anterior IT cortex are sensitive to the same Thatcher manipulations we used here (Sugase-Miyamoto et al., 2014). The neurons of that study were recorded in a more anterior region of IT but, especially given the large amount of individual variation in the location of face patches, without fMRI localization, it is impossible to know where these cells were with respect to the fMRI face patches.
Interestingly, the response pattern we found here in the ML was not inherited by neurons in the face-selective region, AL. Indeed, the population of AL neurons behaved similarly to the population of face-selective neurons that were recorded in OUT. This suggests that AL neurons are insensitive to the Thatcher manipulation, which has such a pronounced impact on the perception of face stimuli. One reason may be that AL neurons are more involved in other aspects of face perception. For example, they might be more heavily invested in decoding socially relevant information such as deviation from direct gaze.
In sum, the interaction between the global orientation of a face and the local orientation of its internal features (i.e., its eyes) evident in the average response of face-selective neurons in area ML was not present in the more anterior face-selective region, AL, or in face-selective neurons located between the ML and AL, i.e., outside a face patch. The presence of the response modulations induced by the Thatcher manipulation in the ML provides a potential neural seat for the behavioral Thatcher effect.
Footnotes
This study was supported by the Fonds voor Wetenschappelijk Onderzoek Vlaanderen, Geconcerteerde Onderzoeksactie (GOA/10/019), Interuniversitaire Attractiepool and Programma Financiering (PF 10/008), and Fonds de la Recherche Scientifique (FRSM 3.4601.12). We extend our gratitude to M. Docx, I. Puttemans, C. Ulens, P. Kayenbergh, G. Meulemans, W. Depuydt, S. Verstraeten, and M. De Paep for technical support.
The authors declare no competing financial interests.
References
- Adachi I, Chou DP, Hampton RR. Thatcher effect in monkeys demonstrates conservation of face perception across primates. Curr Biol. 2009;19:1270–1273. doi: 10.1016/j.cub.2009.05.067. [DOI] [PMC free article] [PubMed] [Google Scholar]
- Bell AH, Malecek NJ, Morin EL, Hadj-Bouziane F, Tootell RB, Ungerleider LG. Relationship between functional magnetic resonance imaging-identified regions and neuronal category selectivity. J Neurosci. 2011;31:12229–12240. doi: 10.1523/JNEUROSCI.5865-10.2011. [DOI] [PMC free article] [PubMed] [Google Scholar]
- Dahl CD, Logothetis NK, Bülthoff HH, Wallraven C. The Thatcher illusion in humans and monkeys. Proc Biol Sci. 2010;277:2973–2981. doi: 10.1098/rspb.2010.0438. [DOI] [PMC free article] [PubMed] [Google Scholar]
- Edmonds AJ, Lewis MB. The effect of rotation on configural encoding in a face matching task. Perception. 2007;36:446–460. doi: 10.1068/p5530. [DOI] [PubMed] [Google Scholar]
- Freiwald WA, Tsao DY. Functional compartmentalization and viewpoint generalization within the macaque face-processing system. Science. 2010;330:845–851. doi: 10.1126/science.1194908. [DOI] [PMC free article] [PubMed] [Google Scholar]
- Freiwald WA, Tsao DY, Livingstone MS. A face feature space in macaque temporal lobe. Nat Neurosci. 2009;12:1187–1196. doi: 10.1038/nn.2363. [DOI] [PMC free article] [PubMed] [Google Scholar]
- Gu X, Li Y, Yang X, Zhu Y. Spatial-temporal analysis of face processing using an ERP study of the Thatcher illusion. Conf Proc IEEE Eng Med Biol Soc. 2007;2007:2496–2499. doi: 10.1109/IEMBS.2007.4352835. [DOI] [PubMed] [Google Scholar]
- Issa EB, DiCarlo JJ. Precedence of the eye region in neural processing of faces. J Neurosci. 2012;32:16666–16682. doi: 10.1523/JNEUROSCI.2391-12.2012. [DOI] [PMC free article] [PubMed] [Google Scholar]
- Kanwisher N, Yovel G. Cortical specialization for face perception in humans. In: Cacioppo JT, Berntson GG, editors. Handbook of neuroscience for behavioural sciences. Wiley; 2009. [Google Scholar]
- Milivojevic B, Clapp WC, Johnson BW, Corballis MC. Turn that frown upside down: ERP effects of thatcherization of misorientated faces. Psychophysiology. 2003;40:967–978. doi: 10.1111/1469-8986.00115. [DOI] [PubMed] [Google Scholar]
- Moeller S, Freiwald WA, Tsao DY. Patches with links: a unified system for processing faces in the macaque temporal lobe. Science. 2008;320:1355–1359. doi: 10.1126/science.1157436. [DOI] [PMC free article] [PubMed] [Google Scholar]
- Ohayon S, Freiwald WA, Tsao DY. What makes a cell face selective? The importance of contrast. Neuron. 2012;74:567–581. doi: 10.1016/j.neuron.2012.03.024. [DOI] [PMC free article] [PubMed] [Google Scholar]
- Psalta L, Young AW, Thompson P, Andrews TJ. The Thatcher illusion reveals orientation dependence in brain regions involved in processing facial expressions. Psychol Sci. 2014;25:128–136. doi: 10.1177/0956797613501521. [DOI] [PMC free article] [PubMed] [Google Scholar]
- Rhodes G, Brake S, Atkinson AP. What's lost in inverted faces? Cognition. 1993;47:25–57. doi: 10.1016/0010-0277(93)90061-Y. [DOI] [PubMed] [Google Scholar]
- Rossion B. The composite effect illusion: A whole window into our understanding of holistic face perception. Vis Cog. 2013;21:139–253. doi: 10.1080/13506285.2013.772929. [DOI] [Google Scholar]
- Sadeh B, Yovel G. Why is the N170 enhanced for inverted faces? An ERP competition experiment. Neuroimage. 2010;53:782–789. doi: 10.1016/j.neuroimage.2010.06.029. [DOI] [PubMed] [Google Scholar]
- Sawamura H, Orban GA, Vogels R. Selectivity of neuronal adaptation does not match response selectivity: a single-cell study of the fMRI adaptation paradigm. Neuron. 2006;49:307–318. doi: 10.1016/j.neuron.2005.11.028. [DOI] [PubMed] [Google Scholar]
- Sugase-Miyamoto Y, Matsumoto N, Ohyama K, Kawano K. Face inversion decreased information about facial identity and expression in face-responsive neurons in macaque area TE. J Neurosci. 2014;34(37):12457–12469. doi: 10.1523/JNEUROSCI.0485-14.2014. [DOI] [PMC free article] [PubMed] [Google Scholar]
- Taubert J, Van Belle G, Vanduffel W, Rossion B, Vogels R. The effect of face inversion for neurons inside and outside fMRI-defined face-selective cortical regions. J Neurophysiol. 2015;113(5):1644–1655. doi: 10.1152/jn.00700.2014. [DOI] [PMC free article] [PubMed] [Google Scholar]
- Thompson P. Margaret Thatcher: a new illusion. Perception. 1980;9:483–484. doi: 10.1068/p090483. [DOI] [PubMed] [Google Scholar]
- Tsao DY, Freiwald WA, Tootell RB, Livingstone MS. A cortical region consisting entirely of face-selective cells. Science. 2006;311:670–674. doi: 10.1126/science.1119983. [DOI] [PMC free article] [PubMed] [Google Scholar]
- Vanduffel W, Fize D, Mandeville JB, Nelissen K, Van Hecke P, Rosen BR, Tootell RB, Orban GA. Visual motion processing investigated using contrast agent-enhanced fMRI in awake behaving monkeys. Neuron. 2001;32:565–577. doi: 10.1016/S0896-6273(01)00502-5. [DOI] [PubMed] [Google Scholar]
- Weldon KB, Taubert J, Smith CB, Parr LA. How the Thatcher illusion reveals evolutionary differences in the face processing of primates. Anim Cogn. 2013;16:619–700. doi: 10.1007/s10071-013-0604-4. [DOI] [PubMed] [Google Scholar]