Abstract
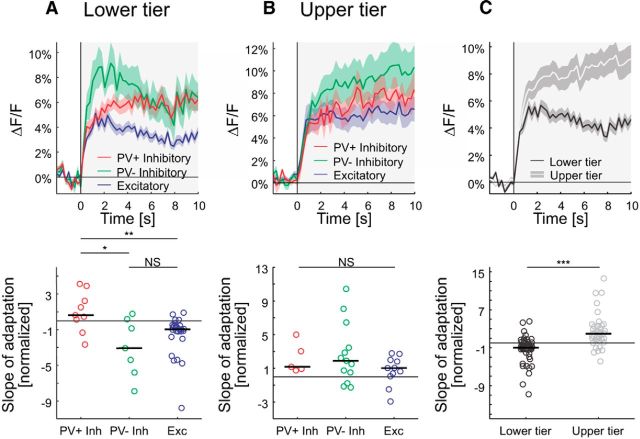
Sensory neurons encode stimulus intensity in their instantaneous spike rate and adjust the set-points of the stimulus–response relationships by adaptation. In the visual cortex, adaptation is crucial because the mechanism of fast gain control (normalization) increases the contrast sensitivity of individual neurons at the cost of encoding a far narrower range of contrasts than is encountered in natural scenes. The mechanism of adaptation, however, is a slow process and has a time constant of seconds. Here we use two-photon calcium imaging of identified excitatory and inhibitory neurons in superficial layers of cat primary visual cortex to answer two questions: for a given set-point, what is range of contrasts represented within a local pool of neurons, and what accounts for the slow time constant of contrast adaptation? We found that a local patch of excitatory neurons has a large diversity of contrast tunings, which effectively extends the range of contrast that can be encoded instantaneously in cortex. Additionally, we identified a pool of parvalbumin-positive GABAergic neurons and neurons in the upper tier of imaging sites that showed a paradoxical slow increase in activity during adaptation, thus implicating them in the slow set-point adaptation of the excitatory population. Our results provide new insights into the circuits and mechanisms underlying cortical adaptation and gain control.
SIGNIFICANCE STATEMENT Neurons in the primary visual cortex (V1) respond near instantaneously over a limited range of contrasts but can also shift their operating range according to the average contrast of the scene. This “contrast adaptation” takes 5–10 s and ensures that a full range of contrasts can be encoded in V1, while remaining sensitive to small changes in local contrast. By optically recording many layer 2 neurons simultaneously, we discovered that networks of neurons collectively code for a much wider range of contrasts. Whereas most neurons responded to sustained increases in contrast by decreasing their spike firing rates, two types of inhibitory neurons in the cat's visual cortex paradoxically increased their firing rates and so could inhibit other neurons to produce contrast adaptation.
Keywords: cat visual cortex, computation of contrast, contrast adaptation, immunostaining of functionally imaged cells, normalization, two-photon calcium imaging in the cat
Introduction
It is well established that neurons in primary visual cortex (V1) increase their rates of spike discharge instantaneously with increasing contrast until they saturate (Albrecht and Hamilton, 1982; Ohzawa et al., 1985; Sclar et al., 1989). Sustained exposure to a visual stimulus, however, leads to a slow adaptation (seconds) of the response to the mean stimulus contrast (Ohzawa et al., 1982, 1985; Albrecht et al., 1984; Bonds, 1991). These two processes seem designed to ensure that individual neurons remain sensitive to small changes in contrast but, nonetheless, can adjust the set-point of their contrast response function (CRF). The set-point of adaptation (or c50 value) of a cell is the contrast required to evoke half of its maximal response. Gain normalization, which is effectively instantaneous, assumes that the output of a large number of excitatory neurons is pooled to provide the drive for a recurrent divisive inhibitory network (Heeger, 1992; Carandini and Heeger, 1994; Clatworthy et al., 2003). Because gain normalization scales the activity of single neurons according to the mean activity of the local population, all neurons of a local population should be similarly normalized since effectively they experience the same scaling factor. Sequential recordings of single neurons suggest, however, that there may be considerable heterogeneity in both the sensitivity and the set-points for V1 neurons (Albrecht and Hamilton, 1982; Contreras and Palmer, 2003; Crowder et al., 2006). Although normalization is a fundamental mechanism that requires the collective behavior of many neurons (Heeger, 1992; Carandini and Heeger, 1994, 2012; Carandini et al., 1997; Tolhurst and Heeger, 1997), there is still little direct evidence as to how it is implemented in the cortical network.
In addition to gain control through normalization, the process of adaptation (Adrian and Zotterman, 1926; Ohzawa et al., 1982; Albrecht et al., 1984) provides a further mechanism of coding contrast. If the mean contrast of the scene increases, neurons respond by rapidly increasing their rate of spiking, but then they slowly decrease their rate if the mean contrast stays constant. Two studies (Carandini and Ferster, 1997; Sanchez-Vives et al., 2000) have reported that the membrane potential hyperpolarizes as the firing rate adapts. What drives this hyperpolarization, however, remains elusive.
Here we investigated two aspects: how gain control acts on a local patch of neurons and how the same neurons adapt to changes in mean contrast. We used two-photon calcium imaging to record simultaneously the activity of a population of neurons during the presentation of moving sinusoidal gratings of different contrasts. This allowed us to observe the activity of a pool of neurons as it adapted to a single contrast level and responded to step changes in contrast. We imaged neurons at different depths in layer 2 and identified subtypes of neurons by post hoc immunostaining of the functionally imaged sites.
We found that local populations of neurons showed more heterogeneity in their individual CRFs than might be expected of the standard normalization model. Part of this heterogeneity is due to individual differences in the set-point and slope of their CRFs, but notable contributions come from differences in cell type and cortical depth. Whereas the majority of neurons decreased their activity during sustained stimulation, a subset of the GABAergic neurons exhibited paradoxical increases in activity.
Our results reveal three possible mechanisms of coding contrast. One is the CRF of individual neurons, which encode a limited range of contrasts. A second is the slow adaptation, which shifts the set-point of the CRFs up or down according to the current mean contrast. Third, the collective tuning of a population covers a wide range of contrasts because of recruitment and heterogeneity in the CRFs of neighboring neurons.
Materials and Methods
Animals and surgical procedures.
All experiments, animal treatment, and surgical protocols were performed with authorization and under a license granted to K.A.C.M. by the Cantonal Veterinary Office of Zurich, Switzerland. Data were collected from three cats (male, ∼1–4 kg, 2–9 months old). The cats were initially anesthetized with subcutaneous injections of xylazine (∼0.8 mg/kg, Rompun 2%; Bayer) and ketamine (∼16 mg/kg, Narketan 10%; Vétoquinol). The femoral vein and artery and the trachea were cannulated while the animal was maintained under general anesthesia with ∼2% halothane (Arovet) in oxygen/nitrous oxide (1:1) and with regular injections of alphaxalone/alphadolone (Saffan; Schering-Plough Animal Health). To maintain general anesthesia during the experiment, alphaxalone/alphadolone (0.25–0.65 ml/h, Saffan; Schering-Plough Animal Health) was continuously delivered intravenously. If needed, additional intravenous injections of alphaxalone/alphadolone (Saffan; Schering-Plough Animal Health) or halothane (0–1.5%; Arovet) could be given. The cat was artificially ventilated with oxygen/nitrous oxide (20%/80%), and the ventilation volume was adjusted to maintain end-tidal CO2 at ∼4.5%. Lidocain (4%; G. Streuli) was applied to ear bars and the rectal thermometer. Topical antibiotics (Voltamicin; OmniVision) and atropine (1%; Ursapharm) were applied to the eyes before they were covered with gas-permeable, neutral-power contact lenses. The nictitating membranes were retracted with phenylephrine (5%; Bausch & Lomb). A thermistor-controlled heating blanket, on which the animal was lying, kept its rectal temperature at 37°C. Electrocardiogram readings and blood pressure (measured via cannula in the femoral artery) were monitored continuously throughout the experiment. A craniotomy was performed above area 17 (Horsley-Clarke coordinates: anteroposterior, −3 to −6 mm; mediolateral, 0–3 mm; foveal vision), and a custom-built chamber was mounted. An electroencephalogram was recorded from cranial electrodes and maintained at spindling state throughout the experiment. The cat was then given an intravenous injection of muscle relaxant (20 or 40 mg, gallamine triethiodide; Sigma-Aldrich), and thereafter gallamine triethiodide (∼7.3 mg · kg−1 · h−1) mixed with (+)-tubocurarine chloride hydrate (∼0.7 mg · kg−1 · h−1; Sigma-Aldrich) was administered intravenously to prevent eye movements. A durotomy was made at the recording site. If necessary, the recording site was locally cleared of arachnoid. After dye loading, ophthalmic lenses were used to focus the eyes onto the screen positioned 57 cm in front of the eyes.
Dye loading and two-photon calcium imaging in vivo.
Oregon Green 488 BAPTA-1 AM (Invitrogen) was dissolved in DMSO (Sigma-Aldrich) and Pluronic F-127 (Sigma-Aldrich). Alexa Fluor 594 (Invitrogen) was added, and the solution was diluted in Normal Rat Ringer's solution (NRR) to a final concentration of 1 mm. The durotomy was covered with a thin layer of agarose (3% in NRR, type III-A; Sigma) to reduce pulsations of the brain. Under continuous visual guidance (water-immersion objective, LUMPlanFl/IR, 40×, 0.8 NA; Olympus), the pipette tip was advanced ∼250 μm below surface, and the solution was pressure-injected (pressure, 15–50 kpa for 3–9 min). After pipette removal, the agar was replaced or supplemented by fresh agarose (1.5% in NRR, type III-A; Sigma), and the chamber was sealed with a round cover glass that was gently clamped down by a threaded ring to further reduce pulsations of the brain. Fluorescence was measured with a custom-built two-photon microscope controlled by HelioScan (Langer et al., 2013). The illumination light source was a Ti:sapphire laser (MaiTai HP; Newport Spectra Physics). Laser power under the objective never exceeded 50 mW (laser pulse width ≤100 fs at a repetition rate of 80 MHz). Functional images were acquired at 4 Hz with 128 × 128 pixel resolution. A volume stack was acquired at every imaging site with 256 × 256 single image pixel resolution.
Visual stimulation.
Drifting sinusoidal gratings (1 Hz, 0.4 cpd, 50% contrast) moving in 8 (followed by 7 directions centered around the preferred direction with intervals of 15°; Fig. 1A–C) or 16 (Fig. 1D–F) different directions were presented on an LCD monitor (Eizo FlexScan S2231W, isoluminant at 23 cd/m2) to determine the preferred direction of the imaging site. Then, 10–20 contrast stimulus sequences were presented that consisted of a 64 s stimulation of sinusoidal gratings of variable contrast moving in a constant direction. For 10 s, contrast was kept at 14%; followed by a test contrast of 3.5, 7, 28, or 56% (also 100% in some experiments) for 3 s; followed by a 4 s presentation of a uniform gray screen (Fig. 1G–L). This was repeated until every one of the pseudo-randomly chosen test contrasts was presented once. Contrast stimulus sequences were interleaved with at least 10 s of blank screen. These stimuli were generated using the open-source MATLAB (MathWorks) toolbox StimServer (Muir and Kampa, 2015).
Figure 1.
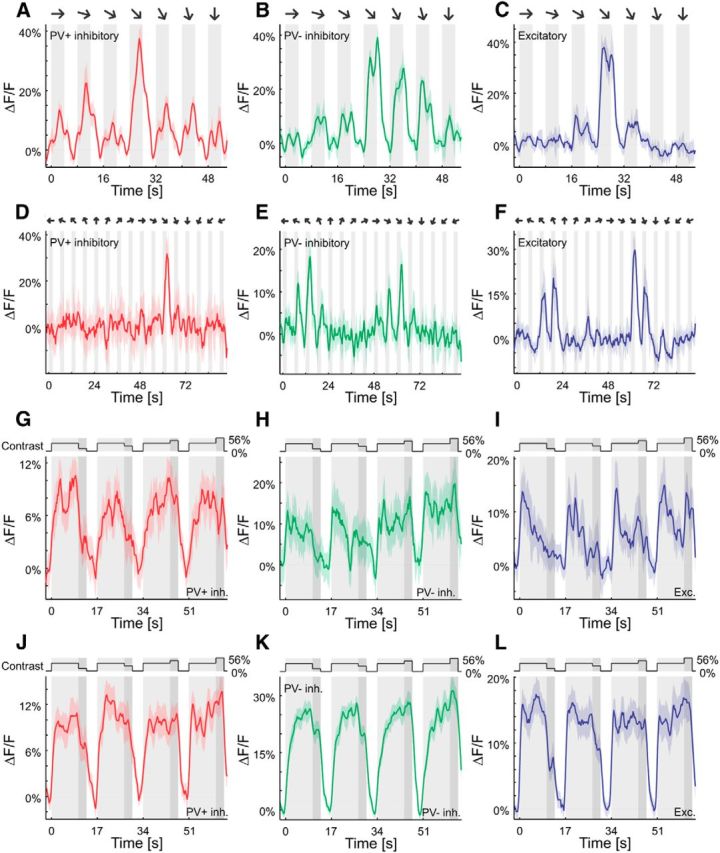
Orientation and contrast responses of sample cells. A–F, Responses of sample cells to sinusoidal gratings moving in 7 (A–C) or 16 (D–F) different directions. Curves are plotted as mean ± SEM (shading). G–L, Light gray, Adaptation to 14% contrast; dark gray, test contrast at 3.5, 7, 28, or 56% (top trace). Responses of sample cells in the lower (G–I) and upper (J–L) tiers of imaging sites to sinusoidal gratings moving in the preferred direction at different contrasts are shown. Curves are plotted as mean ± SEM (shading).
Perfusion and histology.
After the experiment, the animal was given an overdose of anesthetic. It was then perfused transcardially with normal 0.9% NaCl, followed by 4% paraformaldehyde. After fixation, the animal was perfused with 10% sucrose in 0.1 m phosphate buffer (PB), then 20%, and finally 30%. The brain was removed, and a block of cortex containing V1 on one or both sides was cut out for further processing. This block was freeze-thawed twice and cut tangentially into slices of 40 μm, approximately parallel to the imaging planes of the calcium two-photon imaging. Sections were placed in vials and rinsed three times for 10 min, followed by an overnight bath at room temperature in blocking buffer (300 μl per vial) that consisted of 2% Triton X-100 (Sigma-Aldrich), 10% normal goat (Vector Laboratories) or donkey serum (Sigma Aldrich), and 0.04% of 4% NaN3 (Sigma-Aldrich) in 0.1 m PBS. The blocking buffer was then replaced by 300 μl of the primary antibody solution per vial. For the primary antibody solution, each of the primary antibodies, rabbit anti-GABA (Sigma-Aldrich, A 2052) and mouse anti-parvalbumin (PV; PV 235, Swant), were diluted in blocking buffer to reach a final concentration of 1:1000 (each). Sections were left in the primary antibody bath for 12 h at room temperature, followed by 2.5 d at 6°C. After rinsing extensively with PB (three times for 1 min and three times for 30 min), sections were transferred to the secondary antibody (300 μl per vial). For the secondary antibody solution, each of the secondary antibodies, donkey anti-rabbit [DyLight 488 (711-485-152) or DyLight 649 (711-495-152); Jackson ImmunoResearch] and goat anti-mouse (Rhodamine Red-X (115-295-003); Jackson ImmunoResearch), were diluted in blocking buffer to reach a final concentration of 1:200 (each). Sections were left in the secondary antibody bath for 1 d at room temperature. Again, sections were rinsed extensively with PB (three times for 1 min and three times for 30 min) and finally mounted with fluorescent mount containing DAPI (Vectashield; Vector Laboratories). The regions of interest of the mounted sections were imaged with a confocal microscope (Fluoview 1000D; Olympus) using ultraviolet, green, and red excitation and emission filters to detect DAPI-, GABA-, and PV-positive cells, respectively. In a subset of cells of one imaging site, we could not determine whether the cells were GABAergic. Analyzing the dataset without these cells did not change any of the conclusions presented here. The layer 1–layer 2 border was determined with the DAPI staining using Imaris (Bitplane) and was 147 ± 2 μm (mean ± SEM) below surface (measured in vivo). The cell density was determined for each imaging site. The depth of focus was estimated as 20 μm. Layer 1 can be identified by its extremely low cell density compared with deeper layers (Beaulieu and Colonnier, 1983). Virtually all layer 1 neurons are GABAergic (Gabbot and Somogyi, 1986). The imaging sites were divided into an upper and a lower tier according to cell density and fraction of inhibitory neurons. Neurons in the upper tier of imaging sites were typically within the first 50 μm (measured in vivo) below the layer 1–layer 2 border. The tangential sectioning makes identification of laminar boundaries extremely difficult, so we are unable to offer a histological correspondence of the two tiers identified by the two-photon imaging. From depth considerations, both tiers lie within histological layer 2.
Data analysis.
In vivo imaged areas were located using the blood vessel pattern recorded with a CCD camera (TELI CS3960DCL; Toshiba) and the blood vessel pattern in the two-photon volume stack. Confocal images of the histological sections were processed using TrakEM2 (Cardona et al., 2012). In a first step, the confocal and two-photon images were aligned coarsely, based on the blood vessel patterns (Fig. 2A–C). This was the most difficult step. The relative depth and geometry of the relationships of neighboring cells or cells in relation to blood capillaries were used for the fine alignment. The confocal and two-photon images were scaled, stretched, and rotated for the fine alignment. The plane of vibratome sectioning was close, but not identical to the imaging plane, so the alignment was made between the DAPI-stained confocal image and the two-photon stack, which included the imaging site (Figs. 2D–H, 3A,B). The fidelity of the matches was checked by overlaying the DAPI images with the OGB-stained images. We were able to realign 95 ± 2% (mean ± SEM, n = 7 imaging sites in three cats) of the cells.
Figure 2.
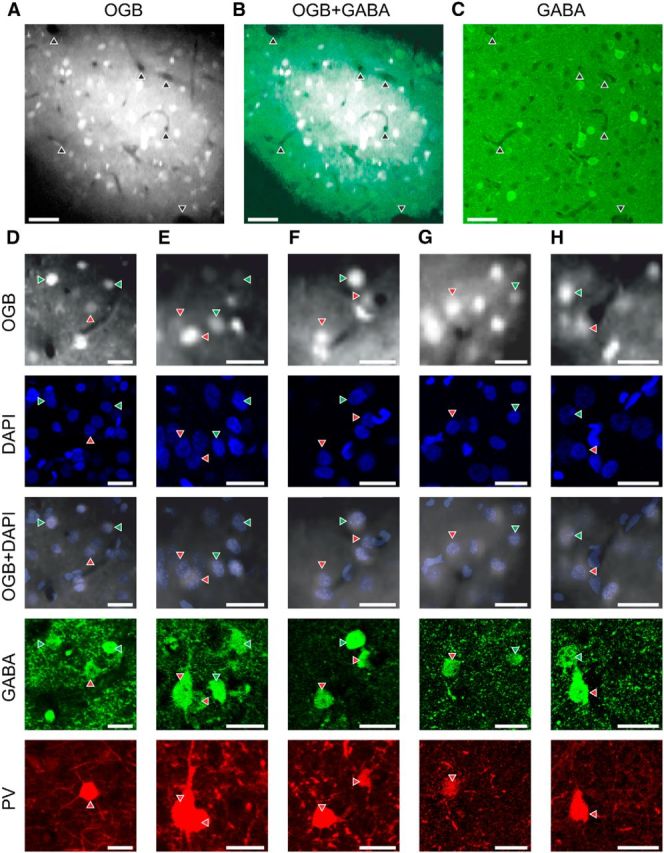
Alignment of in vivo two-photon and ex vivo confocal stacks. A, Average projection of cells stained with OGB. Arrowheads indicate prominent blood vessels. Scale bar, 50 μm. B, Overlay of A and C. Arrowheads indicate the same blood vessels as in A. Scale bar, 50 μm. C, Projection of a confocal stack of the green channel (GABA). Arrowheads indicate the same blood vessels as in A. Scale bar, 50 μm. D–H, From top to bottom: average projection of cells stained with OGB in vivo, DAPI immunostaining of the same cells ex vivo, overlay of OGB and DAPI immunostaining, anti-GABA immunostaining, and anti-PV immunostaining. Red arrowheads indicate PV+/GABA+ cells, and green arrowheads indicate PV−/GABA+ cells. Scale bars, 25 μm.
Figure 3.
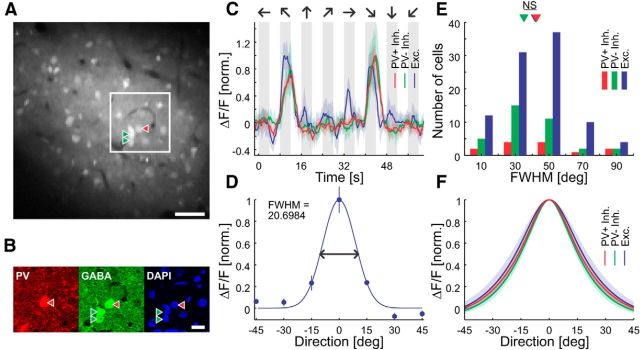
Cell type identification and orientation tuning. A, Average projection of cells stained with OGB over 48 s of data taken during presentation of sinusoidal gratings in vivo. Also shown is immunostaining ex vivo of the framed region shown in B. Scale bar, 50 μm. B, Anti-PV, anti-GABA, and DAPI immunostaining of a sample region, which is marked in A. Scale bar, 20 μm. C, Responses of sample PV+ (1≙14.2% ΔF/F), PV− inhibitory (1≙25.9% ΔF/F), and excitatory (1≙19.7% ΔF/F) cells to sinusoidal gratings moving in eight different directions. These three sample cells were in the same orientation column. Curves are plotted as mean ± SEM (shading). D, Gaussian fit to normalized orientation responses of a sample putative excitatory cell (1≙33.1% ΔF/F). Error bars show the SEM. E, Histogram of tuning width (bin size, 20°), full width at half-maximum (PV+ inhibitory, n = 13; PV− inhibitory, n = 35; excitatory, n = 94). Arrowheads show medians (not binned) of the cell populations (PV+/Exc., p = 0.74; PV+/PV−, p = 0.46; PV−/Exc., p = 0.45; Wilcoxon rank-sum test). F, Gaussian fits to normalized orientation responses of PV+, PV− inhibitory, and excitatory cells. Curves are plotted as population mean ± SEM (shading). FWHM, Full width at half-maximum; NS, not significant.
Two-photon calcium images were processed using MATLAB (MathWorks) using the open-source toolbox FocusStack (Muir and Kampa, 2015). Cells were manually selected using ImageJ (National Institute of Mental Health, NIH). Fluorescence changes (ΔF/F) were calculated using a 2.5 s baseline before stimulus. To determine orientation tuning and contrast response functions, we calculated the responses as average fluorescence change during the entire stimulus presentation. Cells were classified as responsive if in at least 50% of the trials the responses were significantly above baseline (Z score >1.96 corresponding to p > 0.95). Imaging sites were used for further analysis if at least 10 cells were responsive to any of the test contrasts (see above, Visual stimulation).
Orientation selectivity index (OSI) and direction selectivity index (DSI) were calculated as follows:
 |
 |
where Rbest is the response to the best responding direction, Rortho is the rectified (set to zero if negative) average of the responses orthogonal to the best responding direction, and Rnull is the rectified (set to zero if negative) response to the opposite direction of the best responding direction.
Tuning widths (full width at half-maximum) were determined by fitting a Gaussian or a sum-of-Gaussians to single-cell tuning curves. The Gaussians were forced to peak 180° apart and to have the same tuning width. Orientation responses were only taken into account if acquired with intervals of 15 or 22.5°, but not 45°. To exclude poor fits, we introduced a threshold for R2, which can be calculated as follows:
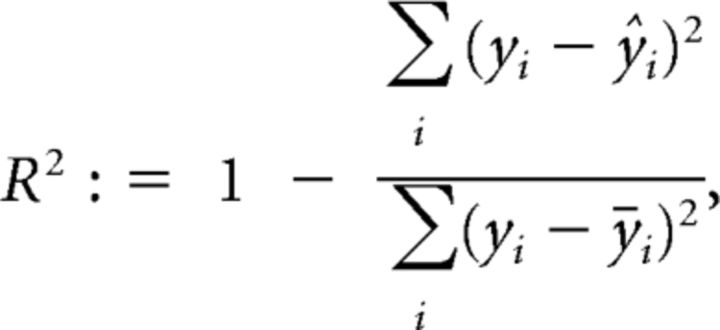 |
where yi is the response to the different orientations and ŷi is the estimated response based on the Gaussian or sum-of-Gaussians fit and ȳ. Cells were excluded (128 of 270) from analysis if R2 = 0.5. Changing this arbitrary threshold to 0.3 or 0.7 did not change the results.
Contrast responses were determined by taking the average response to the test contrasts (see above, Visual stimulation). The contrast response function during rapid changes in contrast is best described by a general hyperbolic ratio relationship or the Naka-Rushton relationship (Naka and Rushton, 1966; Albrecht and Hamilton, 1982):
 |
where Rmin and Rmax are minimal and maximal responses to contrast, respectively. The essential fitting parameters of this relationship are the exponent N and the set-point c50, which determine steepness of the curve and the contrast that evokes (Rmax − Rmin)/2 response, respectively. To estimate the goodness of fit for the contrast responses, we determined the norm of the residuals as previously done for contrast response functions (Albrecht and Hamilton, 1982):
 |
where yi is the response to the different contrasts and ŷi is the estimated response based on the Naka-Rushton fit. To avoid biases to small responses, we normalized the contrast responses by the maximal response of each cell and then performed the Naka-Rushton fit. Cells were excluded (36 of 159) if Res >0.45. Changing this arbitrary threshold to 0.25 or 0.65 did not change depth-specific results nor cell-type-specific results comparing PV+ cells with excitatory cells. The difference in the exponent N of PV− inhibitory cells and PV+ cells in the lower tier of imaging sites (p = 0.020; Wilcoxon rank-sum test) was more prone to change with changes in threshold, presumably because of the smaller number of recorded PV− inhibitory cells compared with excitatory cells.
To estimate the adaptation behavior of individual cells, we averaged all responses to 10 s of 14% contrast independent of the preceding test contrast and performed a linear regression over the interval 1–10 s (to exclude the initial rise in fluorescence change approximated by the first second of stimulation). Only cells that were significantly above baseline (p > 0.95) for any 3 s window during the 10 s stimulus presentation were used for analysis.
Results
We recorded neural activity in layer 2 of the primary visual cortex (V1) in anesthetized cats using two-photon imaging of neurons labeled with a synthetic calcium indicator (Oregon Green 488 BAPTA-1 AM; Fig. 3A). We presented sinusoidal gratings of different orientations and at different contrasts. We recorded from seven imaging sites in three cats and imaged the network at different depths of the superficial layers ranging from 176 to 228 μm below the pial surface (measured in vivo). Imaging sites were divided into an upper tier, which was close to the layer 1–layer 2 border, and a lower tier (see Materials and Methods) on the basis of differences in cell density and proportion of GABA+ cells. The cell density (estimated from in vivo imaging sites) in the upper tier of imaging sites was less than in the lower tier of imaging sites, 33,050 ± 2600 cells/mm3 and 46,700 ± 3350 cells/mm3 (mean ± SEM, n = 7 imaging sites in three cats), respectively. After the imaging experiments, we immunostained sections for GABA and PV to identify putative excitatory and inhibitory cells and subtypes of GABAergic cells (Fig. 3B). A DAPI staining was used for the reconstruction of the imaging site. PV+/GABA+, PV−/GABA+, and PV−/GABA− cells will be referred to as PV+, PV− inhibitory, and excitatory cells, respectively. We found that the percentage of inhibitory cells was substantially higher in the upper tier of imaging sites (49 ± 5% and 17 ± 1% (mean ± SEM, n = 7 imaging sites in three cats) for the upper and lower tiers of imaging sites, respectively).
Orientation and direction tuning
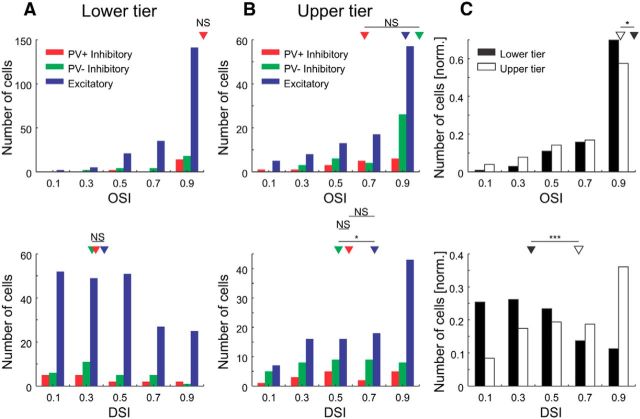
We first measured calcium signals evoked by sinusoidal gratings moving in different directions [74 ± 8% active cells (mean ± SEM, n = 7 imaging sites in three cats); Fig. 3C; see Materials and Methods]. We then aimed for imaging sites within iso-orientation domains. We computed orientation tuning widths, OSI, and DSI for all cells (Fig. 3D–F, 4). The distributions of tuning widths were not significantly different across cell types and depths (Fig. 3E,F). For neurons in the upper and lower tiers of imaging sites, we found few differences in OSI and DSI of PV+, PV− inhibitory, and excitatory cells (Fig. 4). Cells in the upper tier of imaging sites, however, were significantly more direction selective than cells in the lower tier of imaging sites, but less orientation selective (p = 3.2 × 10⁻¹¹ and p = 0.042, respectively; Wilcoxon rank-sum test; Fig. 4C). Finally, we found larger responses for inhibitory neurons compared with excitatory cells at the optimal orientation (data not shown). By pooling over all cell types and depths, the distributions of OSI, DSI, and tuning width confirm previous results (Leventhal and Hirsch, 1978; Berman et al., 1987). However, the depth specificity of these tuning parameters already indicates a functional segregation between the upper and lower tiers of imaging sites. Moreover, we show that PV+ and PV− inhibitory cells have similar tuning widths as those of excitatory cells.
Figure 4.
Orientation and direction selectivity indices. A, Top, Histogram of OSIs for cells in the lower tier of imaging sites (bin size, 0.2; PV+ inhibitory, n = 16; PV− inhibitory, n = 28; excitatory, n = 204). Arrowheads show medians (not binned) of the cell populations (PV+/Exc., p = 0.44; PV+/PV−, p = 0.33; PV−/Exc., p = 0.50; Wilcoxon rank-sum test). Bottom, Histogram of DSIs (same cells as at the top). Arrowheads show medians (not binned) of the cell populations (PV+/Exc., p = 0.97; PV+/PV−, p = 0.57; PV−/Exc., p = 0.32; Wilcoxon rank-sum test). B, Same as A, but for cells in the upper tier of imaging sites (PV+ inhibitory, n = 16; PV− inhibitory, n = 39; excitatory, n = 100). Arrowheads show medians (not binned) of the cell populations (top: PV+/Exc., p = 0.14; PV+/PV−, p = 0.051; PV−/Exc., p = 0.24; bottom: PV+/Exc., p = 0.41; PV+/PV−, p = 0.64; PV−/Exc., p = 0.047; Wilcoxon rank-sum test). C, Same as A, but for cells in the lower and upper tiers of imaging sites pooled over all cell types (lower tier of imaging sites, n = 248; upper tier of imaging sites, n = 155). Arrowheads show medians (not binned) of the cell populations (top, p = 0.042; bottom, p = 3.2 × 10⁻¹¹; Wilcoxon rank-sum test). NS, Not significant; *p < 0.05; ***p < 0.0005.
Contrast responses
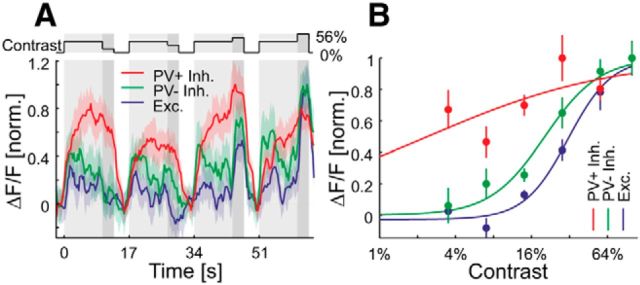
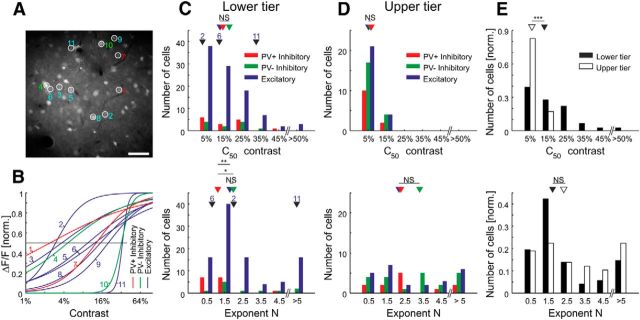
At each imaging site, CRFs were measured after adaptation to a 14% contrast grating presented at the optimal orientation (Fig. 5A). The average calcium responses to the different contrast steps were fit with a Naka-Rushton function (Fig. 5B; see Materials and Methods). The essential fitting parameters of Naka-Rushton functions are the exponent N, which represents the steepness of the curve, and the c50 value (equivalent to the set-point), which is the contrast required to produce half of the maximal response of a given cell. Surprisingly, the CRFs within local populations of cells in the lower tier of imaging sites (Fig. 6A,B) together covered a far larger range of contrasts that any single neuron's CRF. Even a sample subset of neurons of the local population effectively covers contrast space (Fig. 6B). Nevertheless, their median c50 value (12.9%) was close to the adaptation contrast (14%). The CRFs of PV+ cells in the lower tier of imaging sites were significantly less steep compared with PV− inhibitory or excitatory cells (p = 0.020 and p = 0.0037, respectively; Wilcoxon rank-sum test), indicating that PV+ cells are less sensitive to changes in contrast (Fig. 6C). We found no significant difference of the c50 distributions with respect to the different cell types, yet we observed a significant difference between the distributions of c50 values in the upper and lower tiers of imaging sites (Fig. 6C–E), with neurons in the upper tier of imaging sites showing significantly lower c50 values (p = 10−10; Wilcoxon rank-sum test) than the neurons lying beneath them. A shift of the contrast response function and its c50 value to lower contrasts is typically associated with an increase in sensitivity of the neuron (Albrecht and Hamilton, 1982). The medians of the exponent N for the upper and lower tiers of imaging sites were not significantly different (p = 0.14; Wilcoxon rank-sum test). Overall, these results show that neurons in the upper tier of imaging sites and PV+ in the lower tier of imaging sites are more active over a larger span of contrast space. This raised the question of whether the neurons in the upper tier of imaging sites or even PV+ cells had a distinct adaptation behavior leading them to be more responsive at lower contrasts.
Figure 5.
Contrast response functions of sample cells. A, Light gray, Adaptation to 14% contrast; dark gray, test contrast at 3.5, 7, 28, or 56% (top trace). Responses of sample PV+ (1≙13.8% ΔF/F), PV− inhibitory (1≙28.9% ΔF/F), and excitatory (1≙21.5% ΔF/F) cells to sinusoidal gratings moving in the preferred direction at different contrasts. Curves are plotted as mean ± SEM (shading). B, Naka-Rushton fit to contrast responses of the same cells as in A. Error bars show the SEM.
Figure 6.
Contrast responses in the local population. A, Sample imaging site with a selection of neurons of which the contrast responses are shown in B. Scale bar, 50 μm. B, Naka-Rushton fits to the contrast responses of sample cells ordered by their c50 values. C, Top, Histogram of c50 values for cells in the lower tier of imaging sites given by Naka-Rushton fit (bin size, 10%; PV+ inhibitory, n = 15; PV− inhibitory, n = 11; excitatory, n = 97). Arrowheads show medians (not binned) of the cell populations (PV+/Exc., p = 0.88; PV+/PV−, p = 0.92; PV−/Exc., p = 0.67; Wilcoxon rank-sum test); and 2, 6, and 11 show values for three sample cells shown in B. Bottom, Histogram of exponent N values given by Naka-Rushton fit (bin size, 1; same cells as at the top). Arrowheads show medians (not binned) of the cell populations (PV+/Exc., p = 0.0037; PV+/PV−, p = 0.020; PV−/Exc., p = 0.67; Wilcoxon rank-sum test). D, Same as C, but for cells in the upper tier of imaging sites (PV+ inhibitory, n = 12; PV− inhibitory, n = 21; excitatory, n = 25). Arrowheads show medians (not binned) of the cell populations (top: PV+/Exc., p = 0.24; PV+/PV−, p = 0.64; PV−/Exc., 0.72; bottom: PV+/Exc., p = 1; PV+/PV−, p = 0.61; PV−/Exc., p = 0.93; Wilcoxon rank-sum test). E, Top, Histogram of c50 values for cells in the lower and upper tiers of imaging sites pooled over all cell types (bin size, 10%; lower tier of imaging sites, n = 123; upper tier of imaging sites, n = 58). Arrowheads show medians (not binned) of the cell populations (p = 10−10; Wilcoxon rank-sum test). Bottom, Histogram of exponent N (bin size, 1; same cells as at the top). Arrowheads show medians (not binned) of the cell populations (p = 0.14; Wilcoxon rank-sum test). NS, Not significant; *p < 0.05; **p < 0.005; ***p < 0.0005.
Adaptation
It is well established that neuronal activity increases when contrast is briefly increased, yet a sustained increase in contrast leads to a decrease in activity with a relatively long time constant of several seconds, which indicates the neuron is adapting (Adrian and Zotterman, 1926). We studied the cell subtype when increasing contrast from 0 to 14%. We found that in the lower tier of imaging sites, excitatory and PV− inhibitory cells adapted, whereas PV+ cells showed a paradoxical increase in their calcium signal during the sustained stimulus presentation (Fig. 7A, top). To compare the cell-type-specific adaptation, we quantified the adaptation of single cells. We performed a linear fit to the average response of individual cells in a time window 1–10 s after stimulus onset. In the lower tier of imaging sites, the slopes of these linear fits are significantly larger for the PV+ inhibitory cells compared with the PV− inhibitory or excitatory cells (p = 0.023 and p = 0.0078, respectively; Wilcoxon rank-sum test; Fig. 7A, bottom). Moreover, in the upper tier of imaging sites, we found positive slopes for all subtypes (Fig. 7B). Neurons in the upper tier of imaging sites followed the trend of PV+ cells in the lower tier by increasing their activity during stimulation, significantly different from other cell types in the lower tier of imaging sites (p = 3.8 × 10⁻⁷; Wilcoxon rank-sum test; Fig. 7C). Overall, we see two subpopulations of cells that show no typical adaptation behavior in response to sustained visual stimulation.
Figure 7.
Contrast adaptation. A, Top, Averaged responses of cells in the lower tier of imaging sites to a moving sinusoidal grating at 14% contrast presented for 10 s (PV+ inhibitory, n = 9; PV− inhibitory, n = 7; excitatory, n = 26). Curves are plotted as mean ± SEM (shading). Bottom, Slope of adaptation (normalized by the absolute value of the median slope of putative excitatory cells) for single cells (same cells as at the top). The initial rise was excluded in the estimation of the slope (see Materials and Methods for details). Horizontal bars show medians (PV+/Exc., p = 0.0078; PV+/PV−, p = 0.023; PV−/Exc., 0.47; Wilcoxon rank-sum test). B, Same as A, but for neurons in the upper tier of imaging sites (PV+ inhibitory, n = 5; PV− inhibitory, n = 13; excitatory, n = 11; PV+/Exc., p = 0.22; PV+/PV−, p = 0.92; PV−/Exc., 0.20; Wilcoxon rank-sum test). C, Top, Same as A, but for cells in the upper and lower tier of imaging sites pooled over all cell types (lower tier of imaging sites, n = 42; upper tier of imaging sites, n = 39; p = 3.8 × 10⁻⁷; Wilcoxon rank-sum test). NS, Not significant; *p < 0.05; **p < 0.005; ***p < 0.0005.
Discussion
To observe the processes of contrast adaptation in a local cluster of neurons, we exploited the advantages of two-photon calcium imaging. Our data demonstrate that within a local cluster of layer 2 neurons, the CRFs vary widely (from 0.5% at the lowest threshold to 55% at the highest; Figs. 5, 6). These CRF differences allow a local network of neurons collectively to cover a much wider contrast range than any individual neuron without the delay entailed in the slower mechanism of adaptation to the mean contrast.
One particular feature that has gone largely unremarked in electrophysiological studies is our observation that as the stimulus contrast increased, members of the network do not just increase their firing in unison but also new players are recruited to join the active pool of neurons (Fig. 6). Similar recruitment has been observed in other systems, such as, for example, the recruitment of motor neurons in the cat knee extensor by increasing muscle contraction (Liddell and Sherrington, 1925) and the recruitment of integrator neurons in the goldfish brainstem with changes of the eye position (Seung et al., 2000). It has not been shown, however, that this strategy is also a feature of cortex. Instead, it has been proposed that sensory input can be decomposed into basis functions represented by individual neurons (Pouget and Sejnowski, 1997). In our study, the increase in the size of the pool by recruitment may have two functions: (1) to increase the number of active excitatory synapses locally, so increasing the recurrent excitation of neighboring cells; and (2) to increase the number of neurons influencing a downstream site through convergent excitation.
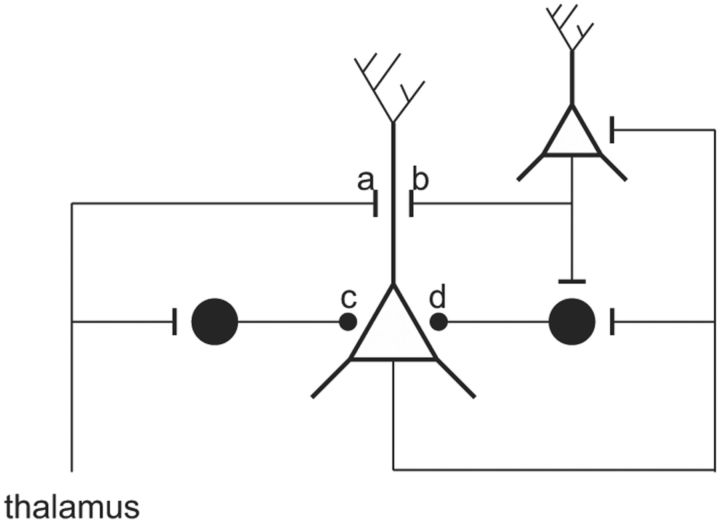
In addition to the instantaneous gain control evident in the CRF, and in recruitment, the process of adaptation (Adrian and Zotterman, 1926; Ohzawa et al., 1982; Albrecht et al., 1984) provides a third mechanism of coding contrast by generating a time-and-space-averaged, contrast-dependent signal that can be used to adjust the set-point of the CRF independently from the slope of the CRF. The mechanism underlying this slow shift is poorly understood. Two studies of cat V1 (Carandini and Ferster, 1997; Sanchez-Vives et al., 2000) reported that after strong excitation by high-contrast gratings, the membrane is relatively hyperpolarized for some seconds. They proposed that this excitation-dependent hyperpolarization is the mechanism by which the set-point shifts and offered several hypotheses to account for the hyperpolarization seen during contrast adaptation. One view was that the hyperpolarization is produced by a slow time-constant, sodium-dependent potassium conductance that hyperpolarizes the membrane potential during strong spiking activity (Sanchez-Vives et al., 2000). An alternative view was that this hyperpolarization is caused by a reduction of excitation arriving at a cell, perhaps because of synaptic depression as a result of tonic excitation (Carandini and Ferster, 1997). As their authors acknowledge, neither of these explanations fully account for the data. Our observations of the time course of GABAergic activity (Fig. 7) supports another possibility: that there is a tonic feedforward inhibition driven by the thalamus that is shaped by a strongly recurrent circuit of inhibitory and excitatory neurons (Fig. 8; Douglas et al., 1989, 1995; Ahmed et al., 1997).
Figure 8.
Schematic of proposed model of adaptation. Excitatory pyramidal cells (open symbols) and inhibitory cells (filled symbols) receive feedforward excitation from thalamus (a) and recurrent excitation from neighboring pyramidal cells (b). The feedforward inhibition (c) sets the threshold of the pyramidal cells and thus controls the degree of contrast adaptation. Increasing stimulus contrast activates thalamic afferents more strongly and generates more feedforward inhibition, and this moves the contrast response function rightward along the contrast axis. The gain, or slope, of the contrast response function is determined by the recurrent inhibition (d), which is proportional to the net excitatory activity in the local network. In practice, both adaptation and gain control could be achieved via the same population of inhibitory neurons. Here we show them separately to emphasize the distinct roles of the two different modes of inhibition [see Douglas et al. (1995) for more details]. The arrangement of the cells in this schematic does not correspond to their location in cortex.
Single units (28% of the population) that increase their firing rate over the first 7.5 ± 0.7 s (mean ± SEM) of stimulation have been described previously (Albrecht et al., 1984), but the depth or cell-type specificity of the neurons was not established. Our results now reveal that a class of neurons in the upper tier of imaging sites and PV+ neurons in the lower tier of imaging sites show an increase in activity or maintain their activity during prolonged stimulus presentation, and this raises the $64 question: where does this nonadapting input come from? The prime candidate is the subcortical input from the lateral geniculate nucleus (LGN), since LGN relay cells only show little contrast adaptation (Ahmed et al., 1997; Sanchez-Vives et al., 2000) and thus are the only inputs to V1 that have anything approaching an absolute measure of the local contrast. The thalamocortical pathway targets all layers of cortex and both the spiny and the smooth neurons that form the recurrent cortical circuits. Thus, both feedforward and feedback inhibitory and excitatory mechanisms are likely to play a role in contrast gain control at a cortical level. A model of this interaction was developed by Ahmed et al. (1997) whereby the average contrast signal provided by the thalamus is approximately linear in log contrast, and in the model, this signal provides feedforward excitatory and inhibitory synaptic currents that are amplified by recurrent circuits. Because of this amplification, the model accounts for the slope of the CRF, whereas the feedforward inhibitory current generates a 2–3 mV change in membrane potential, which is sufficient to drive the adaptive shift in the CRFs. Although, for technical reasons, our recordings were restricted to layer 2, the model indicates that a circuit for adaptation could, in principle, be formed at any depth, so long as the neurons have direct access to the contrast signal provided by the thalamus.
The model (Fig. 8) was agnostic as to the different time constants involved and thus did not identify the component(s) responsible for the slow time constant seen in adaptation. Here, we may have identified a missing link in this chain through the discovery of GABAergic neurons, whose activity increases during sustained stimulation (Fig. 7). The upper tier of the imaging sites contained proportionately more GABAergic cells than the lower tier, and these GABAergic cells had significantly lower set-points of adaptation and were, therefore, more active at lower contrasts. Unexpectedly, these neurons did not show adaptation but responded with a steady-state firing or even an increase during the several seconds of visual stimulation. These cells consisted mostly of PV− GABAergic cells (34 ± 3%), which are likely to target the distal dendrites of pyramidal cells (Douglas and Martin, 2004). This makes them a prime candidate to provide strong inhibition to neurons in the lower tier of imaging sites. Gidon and Segev (2012) have shown that such distal inhibition is theoretically more powerful than on-path inhibition, i.e., between the excitatory synapse and the action potential initiation site. Excitatory cells in the upper tier of the imaging sites also showed an increase in activity during adaptation. These neurons might provide a further source of excitatory drive for the inhibitory cells in the upper tier of the imaging site.
The final link in the causal chain is to identify the mechanism by which the LGN contrast signal is translated into an increased excitation for the subpopulations of neurons in the upper tier of imaging sites and PV+ neurons in the lower tier of imaging sites. Since the thalamic input does not adapt, and since the majority of pyramidal cells decrease their activity during adaptation, the source of the increased excitation may well arise from a mechanism of disinhibition. Our observations thus point to the existence of a subtype of inhibitory neuron that adapts and effectively disinhibits the PV+ neurons with the slow time constant we observed. If such neurons were found, we would have identified all the circuit components needed for the contrast adaptation we observed in layer 2 neurons of cat V1. The components we have indicated in the model (Fig. 8) may well be present in other cortical layers and provide the means of a more distributed (and heterogeneous) elaboration of contrast normalization and contrast adaptation.
Footnotes
This work was supported by EU SECO Grant EU216593 and ETH Grant 2-73246-8 to K.A.C.M. We thank Nuno M. da Costa for inestimable contribution to the success of these experiments. We thank Fritjof Helmchen and Björn M. Kampa for providing the two-photon imaging facility and materials and for helpful discussions. We thank Georg B. Keller for encouragement and critical comments on this manuscript, Dylan R. Muir for abstract comments, and Morgane M. F. Roth for kind and generous comments on this manuscript and fruitful discussions with A.J.K.
The authors declare no competing financial interests.
References
- Adrian ED, Zotterman Y. The impulses produced by sensory nerve endings. Part 2. The response of a single end-organ. J Physiol. 1926;61:151–171. doi: 10.1113/jphysiol.1926.sp002281. [DOI] [PMC free article] [PubMed] [Google Scholar]
- Ahmed B, Allison JD, Douglas RJ, Martin KAC. An intracellular study of the contrast-dependence of neuronal activity in cat visual cortex. Cereb Cortex. 1997;7:559–570. doi: 10.1093/cercor/7.6.559. [DOI] [PubMed] [Google Scholar]
- Albrecht DG, Hamilton DB. Striate cortex of monkey and cat: contrast response function. J Neurophysiol. 1982;48:217–237. doi: 10.1152/jn.1982.48.1.217. [DOI] [PubMed] [Google Scholar]
- Albrecht DG, Farrar SB, Hamilton DB. Spatial contrast adaptation characteristics of neurones recorded in the cat's visual cortex. J Physiol. 1984;347:713–739. doi: 10.1113/jphysiol.1984.sp015092. [DOI] [PMC free article] [PubMed] [Google Scholar]
- Beaulieu C, Colonnier M. The number of neurons in the different laminae of the binocular and monocular regions of area 17 in the cat. J Comp Neurol. 1983;217:337–344. doi: 10.1002/cne.902170308. [DOI] [PubMed] [Google Scholar]
- Berman NEJ, Wilkes ME, Payne BR. Organization of orientation and direction selectivity in areas 17 and 18 of cat cerebral cortex. J Neurophysiol. 1987;58:676–699. doi: 10.1152/jn.1987.58.4.676. [DOI] [PubMed] [Google Scholar]
- Bonds AB. Temporal dynamics of contrast gain in single cells of the cat striate cortex. Vis Neurosci. 1991;6:239–255. doi: 10.1017/S0952523800006258. [DOI] [PubMed] [Google Scholar]
- Carandini M, Ferster D. A tonic hyperpolarization underlying contrast adaptation in cat visual cortex. Science. 1997;276:949–952. doi: 10.1126/science.276.5314.949. [DOI] [PubMed] [Google Scholar]
- Carandini M, Heeger DJ. Summation and division by neurons in primate visual cortex. Science. 1994;264:1333–1336. doi: 10.1126/science.8191289. [DOI] [PubMed] [Google Scholar]
- Carandini M, Heeger DJ. Normalization as a canonical neural computation. Nat Rev Neurosci. 2012;13:51–62. doi: 10.1038/nrc3398. [DOI] [PMC free article] [PubMed] [Google Scholar]
- Carandini M, Heeger DJ, Movshon JA. Linearity and normalization in simple cells of the macaque primary visual cortex. J Neurosci. 1997;17:8621–8644. doi: 10.1523/JNEUROSCI.17-21-08621.1997. [DOI] [PMC free article] [PubMed] [Google Scholar]
- Cardona A, Saalfeld S, Schindelin J, Arganda-Carreras I, Preibisch S, Longair M, Tomancak P, Hartenstein V, Douglas RJ. TrakEM2 software for neural circuit reconstruction. PLoS One. 2012;7:e38011. doi: 10.1371/journal.pone.0038011. [DOI] [PMC free article] [PubMed] [Google Scholar]
- Clatworthy PL, Chirimuuta M, Lauritzen JS, Tolhurst DJ. Coding of the contrasts in natural images by populations of neurons in primary visual cortex (V1) Vision Res. 2003;43:1983–2001. doi: 10.1016/S0042-6989(03)00277-3. [DOI] [PubMed] [Google Scholar]
- Contreras D, Palmer L. Response to contrast of electrophysiologically defined cell classes in primary visual cortex. J Neurosci. 2003;23:6936–6945. doi: 10.1523/JNEUROSCI.23-17-06936.2003. [DOI] [PMC free article] [PubMed] [Google Scholar]
- Crowder NA, Price NSC, Hietanen MA, Dreher B, Clifford CWG, Ibbotson MR. Relationship between contrast adaptation and orientation tuning in V1 and V2 of cat visual cortex. J Neurophysiol. 2006;95:271–283. doi: 10.1152/jn.00871.2005. [DOI] [PubMed] [Google Scholar]
- Douglas RJ, Martin KAC. Neuronal circuits of the neocortex. Annu Rev Neurosci. 2004;27:419–451. doi: 10.1146/annurev.neuro.27.070203.144152. [DOI] [PubMed] [Google Scholar]
- Douglas RJ, Martin KAC, Whitteridge D. A canonical microcircuit for neocortex. Neural Comput. 1989;1:480–488. doi: 10.1162/neco.1989.1.4.480. [DOI] [Google Scholar]
- Douglas RJ, Koch C, Mahowald M, Martin KAC, Suarez HH. Recurrent excitation in neocortical circuits. Science. 1995;269:981–985. doi: 10.1126/science.7638624. [DOI] [PubMed] [Google Scholar]
- Gabbot PLA, Somogyi P. Quantitative distribution of GABA-immunoreactive neurons in the visual cortex (area 17) of the cat. Exp Brain Res. 1986;61:323–331. doi: 10.1007/BF00239522. [DOI] [PubMed] [Google Scholar]
- Gidon A, Segev I. Principles governing the operation of synaptic inhibition in dendrites. Neuron. 2012;75:330–341. doi: 10.1016/j.neuron.2012.05.015. [DOI] [PubMed] [Google Scholar]
- Heeger DJ. Normalization of cell responses in cat striate cortex. Vis Neurosci. 1992;9:181–197. doi: 10.1017/S0952523800009640. [DOI] [PubMed] [Google Scholar]
- Langer D, van 't Hoff M, Keller AJ, Nagaraja C, Pfäffli OA, Göldi M, Kasper H, Helmchen F. HelioScan: a software framework for controlling in vivo microscopy setups with high hardware flexibility, functional diversity and extendibility. J Neurosci Methods. 2013;215:38–52. doi: 10.1016/j.jneumeth.2013.02.006. [DOI] [PubMed] [Google Scholar]
- Leventhal AG, Hirsch HVB. Receptive-field properties of neurons in different laminae of visual cortex of the cat. J Neurophysiol. 1978;41:948–962. doi: 10.1152/jn.1978.41.4.948. [DOI] [PubMed] [Google Scholar]
- Liddell EGT, Sherrington CS. Recruitment and some other features of reflex inhibition. Proc R Soc Lond B Biol Sci. 1925;97:488–518. doi: 10.1098/rspb.1925.0016. [DOI] [Google Scholar]
- Muir DR, Kampa BM. FocusStack and StimServer: a new open source MATLAB toolchain for visual stimulation and analysis of two-photon calcium neuronal imaging data. Front Neuroinform. 2015;8:85. doi: 10.3389/fninf.2014.00085. [DOI] [PMC free article] [PubMed] [Google Scholar]
- Naka KI, Rushton WAH. S-potentials from colour units in the retina of fish (Cyprinidae) J Physiol. 1966;185:536–555. doi: 10.1113/jphysiol.1966.sp008001. [DOI] [PMC free article] [PubMed] [Google Scholar]
- Ohzawa I, Sclar G, Freeman RD. Contrast gain control in the cat visual cortex. Nature. 1982;298:266–268. doi: 10.1038/298266a0. [DOI] [PubMed] [Google Scholar]
- Ohzawa I, Sclar G, Freeman RD. Contrast gain control in the cat's visual system. J Neurophysiol. 1985;54:651–667. doi: 10.1152/jn.1985.54.3.651. [DOI] [PubMed] [Google Scholar]
- Pouget A, Sejnowski TJ. Spatial transformations in the parietal cortex using basis functions. J Cogn Neurosci. 1997;9:222–237. doi: 10.1162/jocn.1997.9.2.222. [DOI] [PubMed] [Google Scholar]
- Sanchez-Vives MV, Nowak LG, McCormick DA. Membrane mechanisms underlying contrast adaptation in cat area 17 in vivo. J Neurosci. 2000;20:4267–4285. doi: 10.1523/JNEUROSCI.20-11-04267.2000. [DOI] [PMC free article] [PubMed] [Google Scholar]
- Sclar G, Lennie P, DePriest DD. Contrast adaptation in striate cortex of macaque. Vision Res. 1989;29:747–755. doi: 10.1016/0042-6989(89)90087-4. [DOI] [PubMed] [Google Scholar]
- Seung HS, Lee DD, Reis BY, Tank DW. Stability of the memory of eye position in a recurrent network of conductance-based model neurons. Neuron. 2000;26:259–271. doi: 10.1016/S0896-6273(00)81155-1. [DOI] [PubMed] [Google Scholar]
- Tolhurst DJ, Heeger DJ. Comparison of contrast-normalization and threshold models of the responses of simple cells in cat striate cortex. Vis Neurosci. 1997;14:293–309. doi: 10.1017/S0952523800011433. [DOI] [PubMed] [Google Scholar]


