

Abstract
The human subcortex contains multiple nuclei that govern the transmission of information to and among cortical areas. In the visual domain, these nuclei are organized into retinotopic maps. Because of their small size, these maps have been difficult to precisely measure using phase-encoded functional magnetic resonance imaging, particularly in the eccentricity dimension. Using instead the population receptive field model to estimate the response properties of individual voxels, we were able to resolve two previously unreported retinotopic maps in the thalamic reticular nucleus and the substantia nigra. We measured both the polar angle and eccentricity components, receptive field size and hemodynamic response function delay, in the these nuclei and in the lateral geniculate nucleus, the superior colliculus, and the lateral and intergeniculate pulvinars. The anatomical boundaries of these nuclei were delineated using multiple averaged proton density-weighted images and were used to constrain and confirm the functional activations. Deriving the retinotopic organization of these small, subcortical nuclei is the first step in exploring their response properties and their roles in neural dynamics.
Keywords: lateral geniculate nucleus, population receptive field, pulvinar, substantia nigra, superior colliculus, thalamic reticular nucleus
Introduction
The subcortex of the brain contains multiple nuclei that play critical roles in brokering the exchange of information among cortical areas (Sherman, 2007). For example, the subcortical visual system, including the lateral geniculate nucleus (LGN) and pulvinar nuclei in the thalamus and the superior colliculus (SC) in the brainstem, contains important hubs that regulate the flow of visual information from the retina to cortex and are implicated in visual attention (O'Connor et al., 2002; Kastner et al., 2004; Schneider and Kastner, 2009; Schneider, 2011; Arcaro et al., 2015). However, the human subcortical visual system remains poorly understood.
Using the phase-encoding retinotopic mapping approach, functional magnetic resonance imaging (fMRI) experiments have corroborated the existence of detailed maps in the human LGN (Schneider et al., 2004; Schneider and Kastner, 2009; Schneider, 2011), SC (Schneider and Kastner, 2005, 2009; Katyal et al., 2010; Schneider, 2011), and pulvinar (Cotton and Smith, 2007; Smith et al., 2009; Schneider, 2011). In these cases, the polar angle maps were most easily detected while the eccentricity measures were weak and the maps incomplete with respect to the electrophysiological results. In recent years, the population receptive field (pRF) model has been offered as a powerful alternative to the phase-encoding method for obtaining expressive and detailed maps of multiple visual areas throughout cortex (Dumoulin and Wandell, 2008; Amano et al., 2009). The pRF model is a voxelwise forward-encoding approach that uses a spatially and temporally dynamic stimulus to derive RF properties from the blood oxygen level-dependent (BOLD) signal of a population of neurons contained within a single voxel. The pRF model is able to provide retinotopic maps containing information about both the location and dispersion of an RF with a single dataset, whereas the phase-encoding approach requires separate datasets for the polar angle and eccentricity measures and cannot provide information about the RF size of each voxel.
Here we used the pRF model to precisely measure the retinotopic organization, spatial tuning, and hemodynamic response function (HRF) delay parameters of known subcortical visual nuclei and to seek additional unreported maps.
Materials and Methods
Subjects.
Three subjects participated in the study (26–32 years of age; two males, one female). One subject was left-handed. The subjects were in good health with no history of psychiatric or neurological disorders, had normal or corrected-to-normal visual acuity, gave their informed written consent, and were compensated for their participation. The study was approved by the York University Human Participants Review Committee. All of the subjects participated in four scanning sessions, including one anatomical and three functional.
Display and response hardware.
The stimuli were generated on an iMac Intel i7 computer (Apple) using MATLAB software (The MathWorks) and Psychophysics Toolbox 3 functions (Brainard, 1997; Pelli, 1997). Stimuli were projected with a frame rate of 60 Hz from an SV-6011 projector (Avotec) inside the scanner room onto a translucent screen located at the end of the scanner bore. Subjects viewed the screen at a total viewing distance of 38 cm through a mirror attached to the head coil. The screen subtended 36° of visual angle horizontally and 28° vertically. A fiber optic response box (Current Designs) was used to collect subject responses. A trigger pulse from the scanner, which was translated into a key press by the response box, was used to synchronize the start of the stimulus presentation to the beginning of the image acquisition.
Visual stimuli and procedure.
Visual stimuli consisted of a checkerboard-patterned bar whose elements reversed contrast with a full-cycle frequency of 4 Hz. The bars subtended 13° of visual angle across their width and extended beyond the boundaries of the screen along their length. During a single run, the bar appeared at four orientations (0, 45, 90, and 135°) and transited across 26° of the visual field along a trajectory perpendicular to the bar orientation, passing through the fixation point at the center of the display. Thus, each run was comprised of eight 30 s bar sweeps with 30 s mean-luminance blank periods at the beginning and end of each run. Throughout each 5 min run, subjects engaged in an attention task at fixation. Subjects were instructed to respond via button press whenever the fixation dot changed color between red and green.
Data acquisition.
Data were acquired in the York University Neuroimaging Laboratory with a 3 T Siemens Trio MRI scanner using a 32-channel head coil. Thirty functional series of 200 volumes each were acquired with 14 coronal slices (1.5 mm isotropic voxels with 0.5 mm gap between slices) and a gradient echo, echo planar sequence with a 128 square matrix, leading to an in-plane resolution of 1.5 × 1.5 mm2 (TR = 1.5 s, TE = 42 ms, flip angle = 90°). A partial Fourier factor of 7/8 was used to acquire an asymmetric fraction of k-space to reduce acquisition time. The posterior edge of the acquisition volume was aligned in the mid-sagittal plane with the posterior edge of the SC. The subjects' heads were surrounded by foam padding to reduce head movements.
In addition to the functional scanning sessions, each subject submitted to an anatomical scanning session. During the anatomical session, a high-resolution T1-weighted MPRAGE (spin-echo, TR = 685 ms, TE = 8.6 ms, flip angle = 75°, 256 square matrix) and 40 coronal proton density (PD) volumes (TR = 3 ms, TE = 26 ms, flip angle = 120°, 19–48 slices, 1–2 mm thick, 256 square matrix, 192 mm field view, 0.75 × 0.75 mm2 in-plane resolution) were acquired. Each PD image was registered to a single PD image, from which a mean PD image was computed and upsampled by a factor of 2. These images were aligned to the MPRAGE and used for drawing regions of interest (ROIs).
pRF estimation.
The first four volumes of each run were discarded. To compensate for subject head movement, the remaining volumes were registered to the eighth volume obtained during the session. In addition to motion correcting the functional imaging data, we also used a volume-censoring procedure (Power et al., 2012). The frame-wise displacement is an aggregate measure of the translational and rotational head movement gleaned from the motion-correction transformation for each volume in the functional series. Volumes with a frame-wise displacement >0.35 mm were flagged for censoring and so were not included in the mean functional series.
We modeled the response of each voxel in terms of a Gaussian pRF (Dumoulin and Wandell, 2008). The model yields two-dimensional Gaussians that vary in visuotopic location and extent from voxel to voxel. In addition to the three parameters of the Gaussian, we also included model parameters for capturing the delay of the HRF and the baseline of the BOLD signal. The delay parameter captures the time to peak and time to undershoot of the HRF. The HRF delay can be estimated simultaneously with the three spatial tuning parameters since each bar sweep was paired with a bar sweep in the opposite direction. The baseline model parameter ensures that both the modeled and the measured BOLD signal vary about the same global mean. The goodness of fit between the model prediction and the measured BOLD signal was assessed via the residual sum of squared error (RSS). The time series of each voxel was fitted in a two-phase procedure. The first phase of the parameter estimation was a sparse and coarse global grid search that adaptively constrained the search boundaries. The effective stimulus was downsampled to a resolution of 5% of the original, using a two-dimensional bilinear interpolation. An adaptive brute force search strategy was used to sparsely sample the model parameter space and the best fit of this was used as the seed point for a fine-tuned gradient-descent error minimization using the non-resampled stimulus. The gradient-descent procedure used was a downhill simplex algorithm (Fletcher and Powell, 1963) to fine-tune the parameter estimates. A linear regression between the predicted and actual fMRI signal was used to determine the activation threshold. To ensure the reliability of our model estimation results, we also performed a split-half analysis. Two mean time series were computed from 15 randomly assigned and mutually exclusive runs from the 30 total runs collected from each subject. Model fits were estimated for each of these independent mean time series.
Neural RF simulation.
Each voxel in fMRI data may contain over a million individual neurons, each with its own visual RF. The pRF model is meant to approximate the aggregate population response of the underlying neural RFs contained within a voxel. Thus, a pRF size estimate emanates from both the sizes of the neural RFs within a voxel and the distribution of RF centers along the local visuotopic gradient. If a voxel contained an impossibly homogenous population of neurons with RFs all of the same size and centered on the same visuotopic location, then the pRF would be equivalent to neural RF. In reality, a voxel contains a population of neurons whose RFs vary in terms of extent and location. We sought to measure the influence of the local visuotopic gradient on the pRF size. The distribution of RF centers and sizes within a pRF has been discussed previously (Smith et al., 2001; Jancke et al., 2004; Dumoulin and Wandell, 2008; Haak et al., 2012), but no one has attempted to infer the relative contributions of the intrinsic RF size and the visuotopic scatter to the pRF size. Here we use the local visuotopic gradient to estimate the distribution of RF centers within a voxel and, through simulation, to estimate the RF size that best accounts for the observed pRF size. Such an approach effectively deconvolves the local visuotopic gradient from the pRF size estimate. The local visuotopic gradient was estimated to be one-half of the mean visuotopic distance between the pRF center of a given voxel and the centers of its six nearest neighbors in brain volume space. The simulated neural RF size was estimated by iteratively minimizing the RSS between the measured pRF and the sum of each set of simulated neural RFs. At each iteration, 1000 neural RFs were sampled from a uniform distribution spanning the measured local visuotopic gradient. Subject eye and head movements may also contribute to the pRF size estimates (Dumoulin and Wandell, 2008), but we do not consider these two factors beyond the volume-censoring procedure described in a previous section.
ROI drawing.
ROIs were hand-drawn for each subject using a combination of anatomical and functional data and with the guidance of a histological human brain atlas (Mai et al., 2007). ROIs for the LGN, SC, and the thalamic reticular nucleus (TRN) were drawn using only the PD anatomical data (Devlin et al., 2006). ROI for the intergeniculate pulvinar (IP) and lateral pulvinar (LP) were drawn using a combination of anatomical landmarks and functional topography. The ROIs for the SN were drawn using the functional data thresholded at r ≥ 0.25 and guided by anatomical landmarks.
Results
pRF estimate in the LGN and SC
Table 1 shows the mean volumes for the ROI among our subjects, divided by hemisphere. Anatomically guided tracings of the LGN, SC, and TRN are shown in the second columns of Figures 1 and 2 for two different subjects overlaid on the PD image. The use of PD images to guide the drawing of the LGN ROI was critical, as the T1-weighted anatomical images did not offer sufficient contrast to identify the boundaries of the LGN.
Table 1.
The mean volume ± subject-wise SEM of the six subcortical ROIs are shown for each hemisphere
| Left hemisphere | Right hemisphere | |
|---|---|---|
| LGN | 214 ± 1 | 229 ± 30 |
| IP | 174 ± 17 | 272 ± 45 |
| LP | 460 ± 39 | 636 ± 109 |
| SC | 342 ± 50 | 335 ± 47 |
| SN | 166 ± 89 | 78 ± 35 |
| TRN | 505 ± 134 | 531 ± 132 |
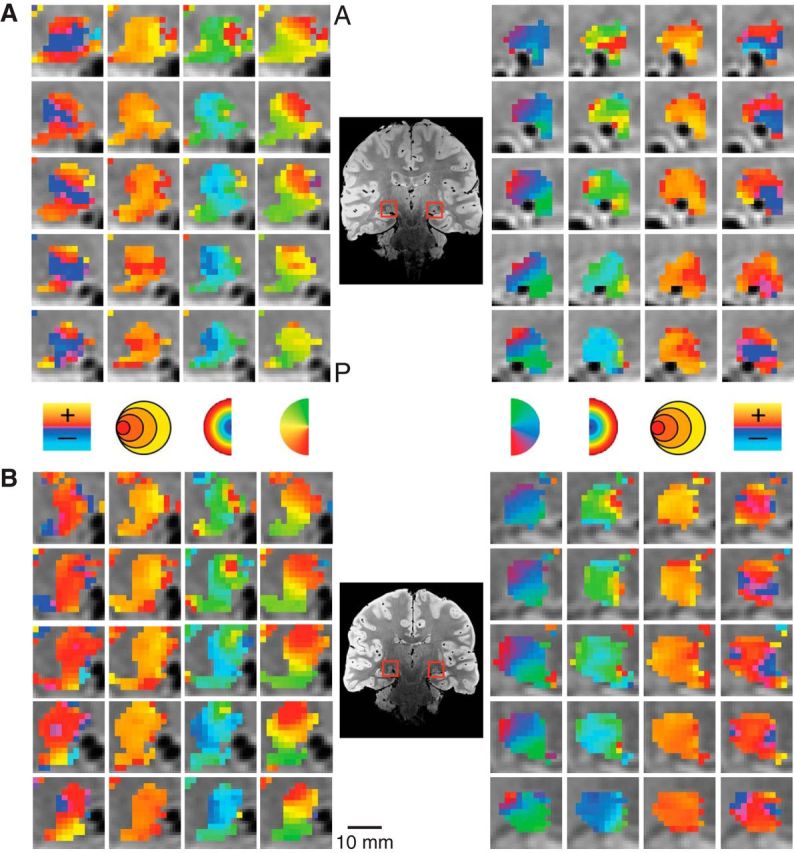
Figure 1.

Maps of the pRF estimates in a single subject across multiple subcortical nuclei. The unlabeled PD image is shown in the first column. The second column depicts the ROIs. The third through sixth columns show the polar angle, eccentricity, pRF size, and HRF delay estimates, respectively. Rows represent separate slices, arranged anterior (A) to posterior (P). L, left; R, right.
Figure 2.

Maps of the pRF estimates in a second subject. Conventions as in Figure 1.
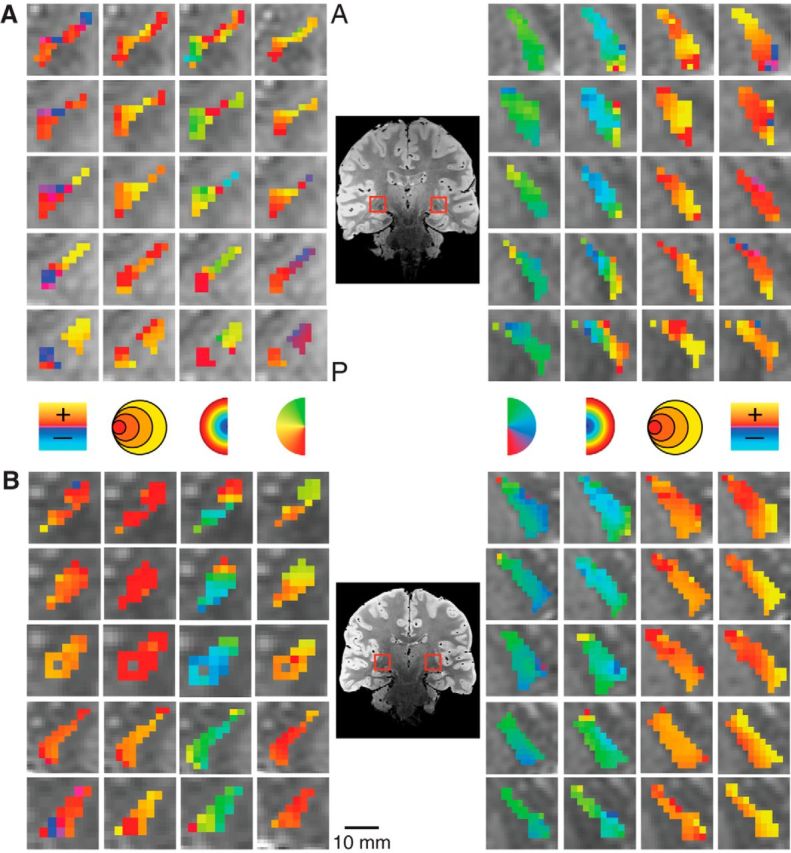
We found clear, bilateral retinotopic maps in the LGN of all our subjects using the pRF estimation method. Figure 3 shows the activation maps for two subjects. Activated voxels whose fMRI time series correlated with the modeled time series, r ≥ 0.25, are shown. The zoomed activation maps are overlaid on PD scans, with the LGN highlighted with a red square. The top and bottom show four coronal slices from each hemisphere arranged anterior to posterior. The columns in Figure 3 show the sliced-wise maps for each of the pRF model parameters (polar angle, eccentricity, pRF size, and HRF delay). The polar angle and eccentricity measures were calculated using the pRF location estimates initially derived in Cartesian coordinates. In both subjects shown, the polar angle maps had the same anatomical orientation—representations of the upper vertical meridian were represented in the inferior and lateral portions of the LGN, the lower vertical meridian was represented in the superior and medial portion of the LGN—and the horizontal meridian was oriented at a ∼45° angle, dividing the upper and lower visual field representations. The eccentricity maps among our subjects showed a similar consistency in the pattern of activation. Here, we found an anteroposterior gradient where foveal representations were found near the posterior end of the LGN and more peripheral representations were found near the anterior end. Likewise, the pRF size maps showed a similar anteroposterior gradient with small pRF sizes near the posterior end of the LGN and large pRF sizes near the anterior end.
Figure 3.
Detailed maps of the pRF estimates in the LGN. The model estimates are overlaid on the PD image for the left and right LGN. Separate subjects are shown in A and B. Columns illustrate the polar angle, eccentricity, pRF size, and HRF delay estimates. A, anterior; P, posterior.
We also found robust, retinotopically organized activations maps in the SC. Figure 4 shows the zoomed activation maps for each of the pRF model parameters in successive coronal slices of the brainstem of two representative subjects. Again, we found orthogonal representations of polar angle and eccentricity along the SC of each of our subjects, which were best viewed in the coronal plane. There was a consistent medial representation of the upper vertical meridian and a lateral representation of the lower vertical meridian, with a representation of horizontal meridian oriented at ∼45°, dividing the upper and lower contralateral hemifield representations. We found a foveal-to-periphery representation gradient for eccentricity along the anteroposterior anatomical direction. Again, the pRF size approximately followed the same representation orientation as the eccentricity; that is, smaller pRF sizes were found toward the superolateral portion of the SC while larger pRF sizes were found toward the inferomedial portion.
Figure 4.
Detailed maps of the pRF estimates in the SC in two subjects. Conventions as in Figure 3.
pRF estimates in other subcortical nuclei
In addition to the LGN and SC, we found a number of other subcortical nuclei whose functional time series was driven by the moving bar stimulus and from which we could compute reliable pRF estimates across subjects. Figures 1 and 2 show the activation maps of each of the four pRF model estimates from two representative subjects, with the displayed maps spanning a series of nonconsecutive coronal slices and overlaid on a broader anatomical window. The two leftmost columns show, respectively, the unlabeled anatomical images and the overlaid ROIs.
The IP and LP shared a foveal eccentricity representation running along an inferolateral to superomedial direction oriented at ∼45° to the mid-sagittal plane. In addition, these two pulvinar nuclei showed an anteroposterior eccentricity representation gradient where foveal representations were found more anterior and peripheral representation more posterior. The polar angle maps in the IP and LP were found to be orthogonal to the corresponding eccentricity maps. For both the IP and LP, the upper vertical meridian was represented inferior and lateral while the lower vertical meridian was represented superior and medial. The topography of the eccentricity and polar angle maps was found bilaterally among our three subjects.
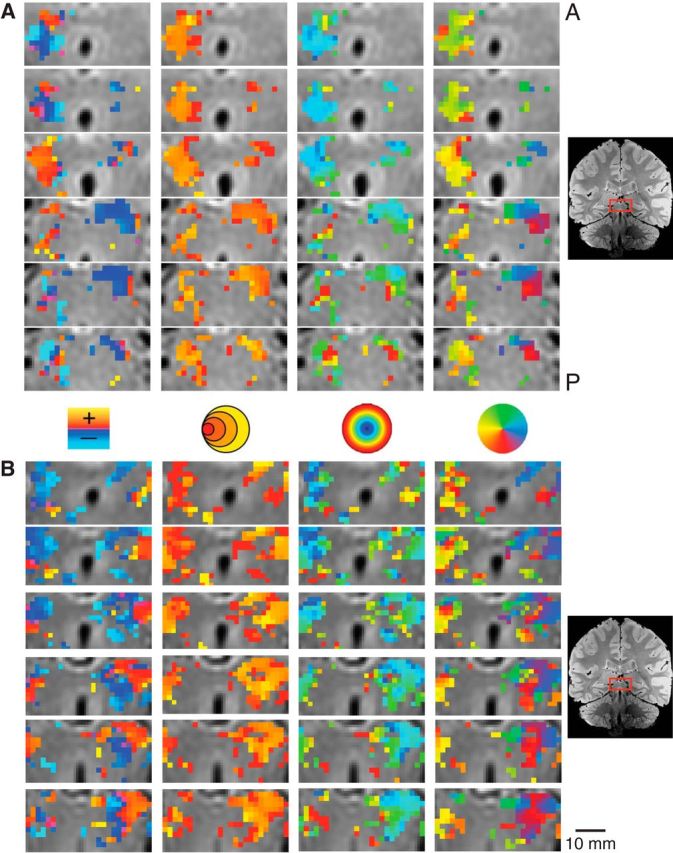
We also found retinotopic maps in the TRN among our subjects, as shown magnified in two subjects in Figure 5. The TRN runs along the transverse length of the thalamus and wraps around the lateral surface of a number of thalamic structures including the pulvinar and the LGN. The structure of the TRN was identified anatomically on the PD images. The TRN showed an anteroposterior and mediolateral gradient of polar angle representation, with the upper vertical meridian represented anterior and medial and the lower vertical meridian represented posterior and lateral. The eccentricity map of the TRN was oriented along an inferosuperior axis with a foveal representation near the inferior end of the TRN and a peripheral representation near the superior end. Only a small subset of voxels in the anatomically defined TRN ROI showed a retinotopic organization. The portions of the TRN that did show retinotopic maps were clustered around the other visually evoked nuclei of the thalamus including the LGN and the pulvinar.
Figure 5.
Detailed maps of the pRF estimates in the TRN in two subjects. Conventions as in Figure 3.
We also found bilateral retinotopically organized maps, shown magnified for two subjects in Figure 6, which we determined to be part of the SN by comparison of our PD images with a histological atlas (Mai et al., 2007). The SN polar angle representations were organized mediolaterally with the upper vertical meridian represented medial and the lower vertical meridian represented lateral. The eccentricity maps were organized anteroposteriorly with foveal representations in the anterior SN and peripheral representations in the posterior SN. The retinotopic map we found in the SN is most likely the pars reticulata of the SN (Hikosaka and Wurtz, 1983a).
Figure 6.
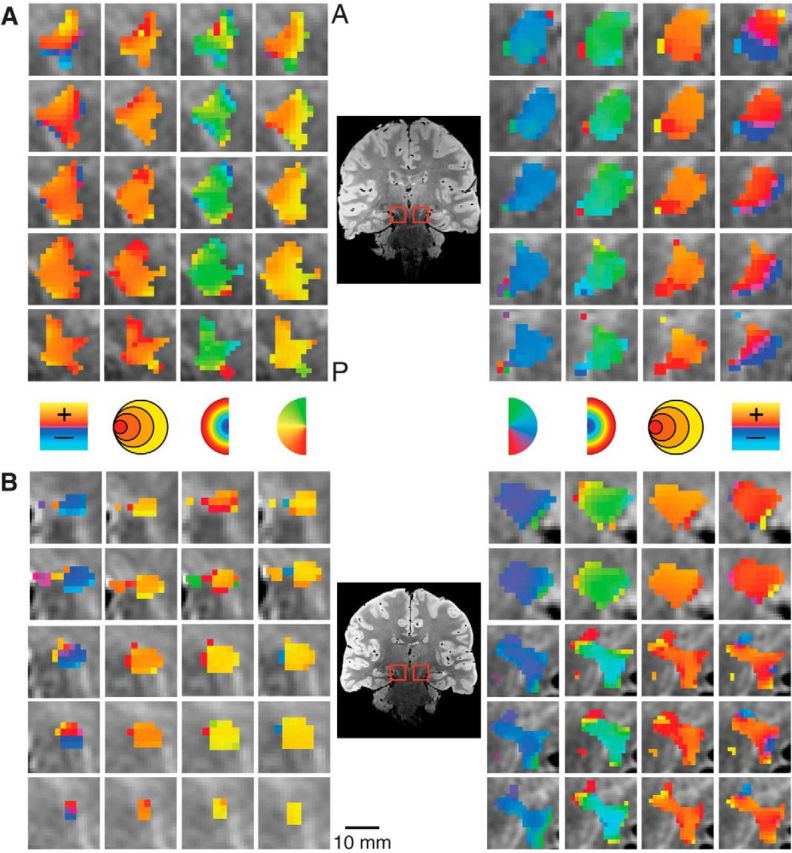
Detailed maps of the pRF estimates in the SN in two subjects. Conventions as in Figure 3.
Figure 7 shows a comparison of the pRF model parameter estimates pooled across the three subjects for each of the six subcortical nuclei. Figure 7A shows the polar angle representations among the various subcortical visual nuclei. Here, we plot the fractional volume as a function of polar angle for each hemisphere separately, using 16 22.5° radial segments. All subcortical nuclei activated bilaterally and showed a strong contralateral representation of the visual space. Additionally, all areas showed a representational bias such that the horizontal meridians were over-represented and the vertical meridians were under-represented. The TRN showed the most ipsilateral representation of polar angle among the six subcortical nuclei sampled. Figure 7B illustrates the fractional volume of each ROI as a function of eccentricity. The LGN, SC, SN, and TRN all have ∼50% of their volumes representing the central 5° of the visual field, with the remaining ROI volume representing the next 10° of eccentricity. The IP and LP showed slightly steeper curves where ∼50% of their volumes represented the central 2–3° of the visual field.
Figure 7.
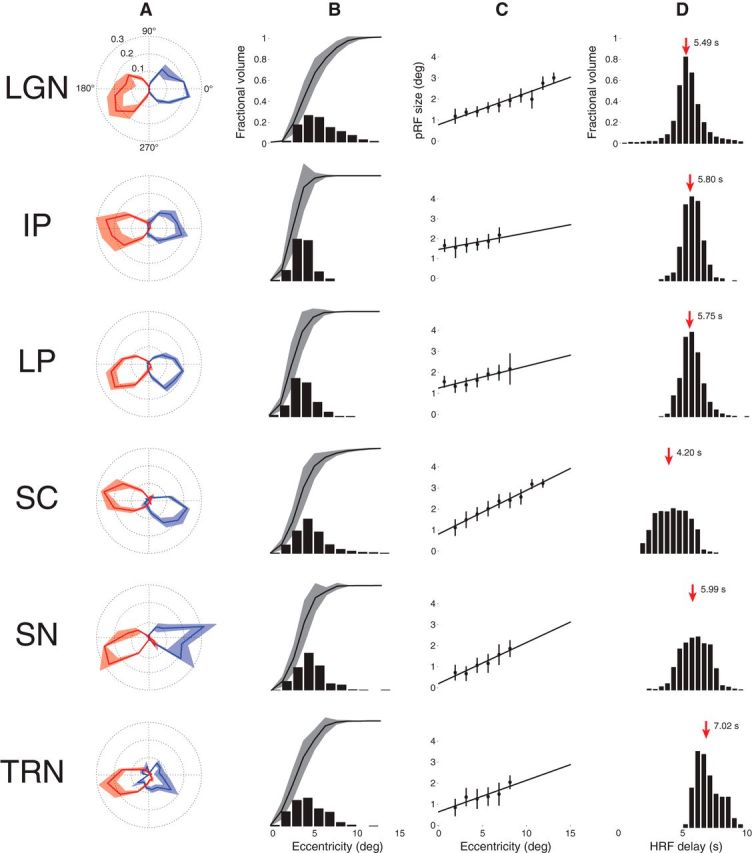
Model parameters for each of the six subcortical nuclei across three subjects. A, Polar angle. The left (blue) and right (red) hemispheres are plotted separately. The solid line shows the mean fractional volume representing each polar angle. The shaded region shows the SEM. B, Eccentricity. The black bars represent the fractional volume representing each eccentricity and the black lines represent the cumulative sum. C, pRF sizes versus eccentricity. The mean and SEM pRF sizes are shown at each 1° eccentricity bin. The black lines are linear fits. Eccentricities with <5 data points are not shown. D, HRF delay. The black bars represent the fractional volume exhibiting each HRF delay. The red arrows and the adjacent numbers indicate the mean of each distribution.
The structure of the retinotopic maps among the six subcortical nuclei is further illustrated in Figure 7C. Here, the pRF sizes among the voxels of each ROI are plotted as a function of eccentricity. Each filled black circle represents the mean (black bars show the SEM) pRF size binned at 1° annuli of eccentricity. Eccentricities with fewer than five pRF measures were excluded. The linear fits among all data points are shown with solid black lines. In all ROIs, we found a positive relationship between pRF size and eccentricity, with pRF size increasing with eccentricity as has been demonstrated in the cortex (Dumoulin and Wandell, 2008; Amano et al., 2009).
The HRF delay estimates are shown for each of the six subcortical nuclei in Figure 7D. For each voxel, the HRF delay parameter was computed as the time to peak (and time to undershoot; data not shown) of the canonical double-gamma HRF (Friston et al., 1998; Glover, 1999; Worsley et al., 2002). The SC was found to have a mean HRF delay of 4.20 s, while the means of the other ROIs were all >5 s. Notably, the TRN exhibited a mean HRF delay of 7.02 s.
Figure 8 shows the results of the split-half model estimation. Two mean time series were computed from 15 randomly assigned, mutually exclusive runs drawn from the 30 total runs collected from each subject. Model fits were estimated for each of these independent mean time series and compared withFigure 7. The results of the model estimation for first (black) and second (red) halves of the data are very similar across ROI and metrics. The most notable difference between these results from each 15 run half of the dataset and the results for all 30 runs in Figure 7 is the TRN polar angle plot. Reducing the number of runs to one-half the total data collected resulted in a loss of the TRN representation in the left visual field. This suggests that the signal-to-noise ratio in the TRN is lower than in the other five ROIs.
Figure 8.
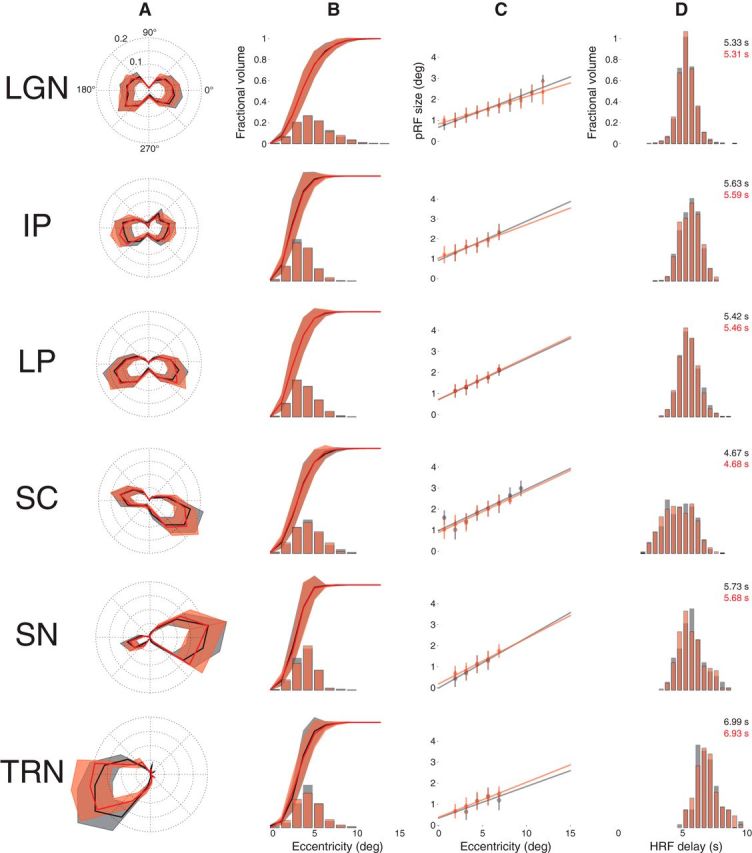
Reliability assessment. Model parameter estimates are shown for two independent halves of the data (red and black). Conventions as in Figure 7.
Neural RF simulation
The results of the neural RF simulation are shown in Figure 9. Here, we plot the estimated pRF size versus simulated RF size for each voxel across the six subcortical nuclei. Points falling below the line of identity (red) have neural RF sizes that are smaller than the pRF size, which indicates a significant effect of the local visuotopic gradient in inflating the pRF size. Voxels with pRF sizes <5° exhibited the largest effects.
Figure 9.

RF versus pRF size among the six subcortical nuclei. The simulated neural RF size is plotted as a function of the measured pRF size for each voxel, across subjects. The red line indicates identity.
Discussion
Here, we have demonstrated that the pRF model can be used to estimate the spatial tuning properties of multiple subcortical nuclei. We were able to verify the retinotopic organization of the LGN and SC as described previously both with electrophysiology in nonhuman primates (Cynader and Berman, 1972; Goldberg and Wurtz, 1972; Kaas et al., 1972; Malpeli and Baker, 1975; Wurtz and Albano, 1980; Sparks, 1986, 2002; Moschovakis et al., 1996) and in humans with fMRI (Schneider et al., 2004; Schneider and Kastner, 2005, 2009; Katyal et al., 2010; Schneider, 2011). The pRF sizes we measured in the LGN were approximately equivalent to the neural RF sizes in the macaque for parafoveal locations; however, at eccentricities of 10° and greater, our measured pRF sizes were approximately double that of previous reports using neurophysiological techniques in the monkey (Xu et al., 2001, 2002). The pRF sizes we found in the SC were in agreement with the neural RF sizes measured in the cat (Berman and Cynader, 1972).
None of the previous subcortical retinotopic mapping studies in humans made use of the PD images for defining the anatomical boundaries of the LGN or of other subcortical nuclei. Defining the LGN based on functional activation (Schneider et al., 2004) resulted in volumes approximately double those reported in the postmortem human (Andrews et al., 1997). This overestimation of the anatomical boundaries of the LGN most likely emanated from the inclusion of similarly entrained voxels sampling from nearby blood vessels and subcortical structures such as the triangular area, pulvinar nuclei, and the TRN. Such an approach will lead to inaccuracies in determining the properties of the LGN, especially when attempting to measure variations throughout the structure of the LGN as might be expected from its anatomical subdivisions (Schneider et al., 2004; Denison et al., 2014; Zhang et al., 2015).
In addition to the LGN and SC, we discovered a number of subcortical nuclei, across all three subjects, that displayed an orderly retinotopic organization. Surprisingly, we found contralateral hemifield representations in the pars reticulata of the SN. In the macaque, the pars reticulata of the SN receives direct projections from the striatum and possibly indirect projections through the caudate nucleus from the frontal eye fields and the thalamus (Hikosaka and Wurtz, 1983a). Neurons of the pars reticulata in turn project onto the intermediate and deep layers of the SC (Hikosaka and Wurtz, 1983a,d) and are retinotopically organized and discharge in response to the presentation of visual stimuli (Hikosaka and Wurtz, 1983b,d) and during visually and memory guided saccades (Hikosaka and Wurtz, 1983a,c). Furthermore, antidromic activation from the SC showed that the RFs of neurons in the pars reticulata of the SN and the movement fields of neurons in the intermediate layers of the SC were visuotopically aligned (Hikosaka and Wurtz, 1983a). These response characteristics, along with evidence for the interconnectivity of the pars reticulata with the striatum and the SC, suggest that the pars reticulata is critical for representing the spatial location of a saccadic target and may even play a role in the initiation of the saccade itself (Hikosaka and Wurtz, 1983a). While the encoding stimulus in the present study included an attention task at fixation, it is possible that the sweeping bar stimulus constituted a highly salient visual stimulus that the SN represented as a potential target for a saccade. The signal in the pars reticulata signal could, in turn, project to the SC for the purpose of orienting attention and behavior. Degeneration of the pars reticulata of the SN has been associated with Parkinson's disease (Tseng et al., 2000) and epilepsy (Deransart et al., 2003). The pRF model as described here may offer an avenue for determining the functional viability of the SN and should be considered by researchers investigating these pathologies.
We also found a retinotopic map in the TRN. The TRN is a thin layer of GABA-releasing cells abutting the dorsolateral and anterior segments of the thalamus (Jones, 1975). The TRN receives topographic inputs, and drives inhibitory feedback, to thalamic relay cells via GABA receptors (Kim et al., 1997), and is known to contain visually responsive regions (Montero et al., 1977; Pinault et al., 1995; Wang et al., 2001). The TRN has topographically preserved reciprocal connections with both the LGN (Harting et al., 1991) and visual cortex (Sherman and Guillery, 1996). It is thought to play a role in visuospatial attention through the coordination of activity in the LGN and pulvinar, and has been described as a candidate for the seat of the “attentional spotlight” in the early visual system (Crick, 1984). This suggests that adding a spatial attention component to the encoding stimulus may aid in retinotopically mapping the TRN and other thalamic nuclei with which the TRN has an antagonistic relationship. The encoding stimulus in this study included an attention task at fixation, which may have resulted in a nonspatially specific amplification of the BOLD signal in the TRN. A recent functional imaging study of the human TRN showed that the bilateral TRN activation can be measured by modulating visual flicker (Viviano and Schneider, 2015). Likewise, we found the polar angle representation of the TRN to be more ipsilateral than in any of the other subcortical nuclei. The TRN also differed from the other nuclei in that the distribution of HRF delays across the TRN was relatively uniform whereas other structures followed a more Gaussian distribution. The pRF sizes in the TRN were found to be approximately equivalent to those reported in the macaque at the eccentricities we stimulated (McAlonan et al., 2006).
The retinotopic organization of the pulvinar in nonhuman primates has been measured using electrophysiology (Bender, 1981; Li et al., 2013), demonstrating two separate retinotopic representations of the visual field. Using the pRF model, we identified two separate retinotopic maps in the human pulvinar, which we have determined to be the LP and IP based on an anatomic atlas (Mai et al., 2007). The LP and IP have a similar polar angle representation where the upper vertical meridian is represented inferior and lateral while the lower vertical meridian is represented more superior and medial. The orientations of our pRF maps correspond well with previous imaging experiments in the human pulvinar (Cotton and Smith, 2007; Smith et al., 2009; Schneider, 2011; Arcaro et al., 2015). We also found that the IP shares a foveal representation with the LP and a positive relationship between pRF size and eccentricity in both nuclei.
Among all the subcortical nuclei, we found a consistent under-representation of the vertical meridians and an over-representation of the horizontal meridians. This bias has been previously reported in the LGN, SC, IP, and LP (Schneider et al., 2004; Schneider and Kastner, 2005, 2009; Schneider, 2011). This is unlikely to be caused by partial volume effects, as previous work in our lab has shown that the vertical meridians, located at the edges of the LGN, could not be recovered by dilating the LGN mask to also include a one-voxel shell around the functionally defined ROI (Schneider et al., 2004). Furthermore, we are confident that we sampled the entire LGN volume in the present study since the ROIs were defined anatomically using PD images.
In addition to deriving the spatial tuning of each voxel, we also estimated the voxelwise HRF delay. We estimated the delay of the peak and undershoot per voxel concomitantly with the spatial tuning parameters. Other approaches have estimated the voxelwise HRF using an independent dataset (Dumoulin and Wandell, 2008) or an iterative fitting procedure where the spatial tuning is first derived using the canonical double-gamma HRF (Friston et al., 1998; Glover, 1999; Worsley et al., 2002), after which the HRF is modeled from a fixed spatial tuning estimate (Harvey and Dumoulin, 2011). The advantages of estimating the HRF delay are twofold. First, it may help offset inter-regional and intersubject variability in hemodynamics that could obfuscate the spatial tuning among voxels in various subcortical nuclei (Handwerker et al., 2004). Second, it may offer insight into the network dynamics in the visual system. For instance, we measured the HRF delay in the SC to be ∼1.5 s shorter than in the other five subcortical nuclei. High-field imaging in the rat during brief visual presentation has also shown that the time to peak in the SC is earlier than in the LGN (Lau et al., 2011). Accounting for differences in the HRF among subcortical nuclei may be critical for estimating their other functional properties, such as spatial tuning or the flow of information through the visual system. Neurons in the macaque SC have been shown to discriminate stimulus features before the initiation of a saccade and with very short latencies (Horwitz and Newsome, 1999), suggesting that the SC maintains an early representation for visual stimuli. Our HRF delay estimates in the SC lend further support to the dual pathway model of visual processing, where information flows from retina to cortex both through a geniculostriate and an early collicular-pulvinar route (Berman and Wurtz, 2010, 2011).
The relationship between eccentricity and pRF size in the subcortex closely resembles that found in cortex (Dumoulin and Wandell, 2008); however, the pRF sizes measured in the LGN are somewhat larger than those measured in the monkey with electrophysiology techniques (Xu et al., 2001, 2002). There are at least three possible sources of pRF size misestimation that may be particular to subcortex. First, due to the deep anatomical location of the subcortical nuclei, the BOLD signal in these brain areas has a relatively low signal-to-noise ratio. To maximize the signal strength, the duty cycle of the sweeping bar stimulus was set to one-half. This ensures that any given location in the visual field is stimulated for approximately half the duration of a given bar sweep and of a scanning run. While this has the effect of making the most of scanner time, it may also have the effect of diminishing the precision of the pRF model in estimating the pRF size. Ideally, the stimulation run should vary the width of the sweeping bar to optimize the relationship between BOLD signal saturation and duty cycle for better estimation of the pRF size. Second, since these subcortical nuclei are small compared with their cortical counterparts, the entirety of the contralateral hemifield is represented in a relatively small amount of tissue, resulting in a steep local visuotopic gradient per MRI voxel. We estimated the local retinotopic gradient and deconvolved it from the pRF size, finding that the measured pRF size approximates the simulated neural RF size well, and that the local visuotopic gradient plays a small role in inflating the pRF size. Third, the point spread function of the BOLD signal at 3 T has been estimated to be 3–4 mm FWHM (Parkes et al., 2005). In cortex this approximates the voxel size, but in subcortex where smaller voxels are used it introduces a sizeable and implicit spatial smoothing factor that could inflate the pRF size.
Footnotes
Funding was provided by a Discovery Grant to K.A.S. from the Natural Sciences and Engineering Research Council of Canada.
The authors declare no competing financial interests.
References
- Amano K, Wandell BA, Dumoulin SO. Visual field maps, population receptive field sizes, and visual field coverage in the human MT+ complex. J Neurophysiol. 2009;102:2704–2718. doi: 10.1152/jn.00102.2009. [DOI] [PMC free article] [PubMed] [Google Scholar]
- Andrews TJ, Halpern SD, Purves D. Correlated size variations in human visual cortex, lateral geniculate nucleus, and optic tract. J Neurosci. 1997;17:2859–2868. doi: 10.1523/JNEUROSCI.17-08-02859.1997. [DOI] [PMC free article] [PubMed] [Google Scholar]
- Arcaro MJ, Pinsk MA, Kastner S. The anatomical and functional organization of the human visual pulvinar. J Neurosci. 2015;35:9848–9871. doi: 10.1523/JNEUROSCI.1575-14.2015. [DOI] [PMC free article] [PubMed] [Google Scholar]
- Bender DB. Retinotopic organization of macaque pulvinar. J Neurophysiol. 1981;46:672–693. doi: 10.1152/jn.1981.46.3.672. [DOI] [PubMed] [Google Scholar]
- Berman N, Cynader M. Comparison of receptive-field organization of the superior colliculus in Siamese and normal cats. J Physiol. 1972;224:363–389. doi: 10.1113/jphysiol.1972.sp009900. [DOI] [PMC free article] [PubMed] [Google Scholar]
- Berman RA, Wurtz RH. Functional identification of a pulvinar path from superior colliculus to cortical area MT. J Neurosci. 2010;30:6342–6354. doi: 10.1523/JNEUROSCI.6176-09.2010. [DOI] [PMC free article] [PubMed] [Google Scholar]
- Berman RA, Wurtz RH. Signals conveyed in the pulvinar pathway from superior colliculus to cortical area MT. J Neurosci. 2011;31:373–384. doi: 10.1523/JNEUROSCI.4738-10.2011. [DOI] [PMC free article] [PubMed] [Google Scholar]
- Brainard DH. The Psychophysics Toolbox. Spat Vis. 1997;10:433–436. doi: 10.1163/156856897X00357. [DOI] [PubMed] [Google Scholar]
- Cotton PL, Smith AT. Contralateral visual hemifield representations in the human pulvinar nucleus. J Neurophysiol. 2007;98:1600–1609. doi: 10.1152/jn.00419.2007. [DOI] [PubMed] [Google Scholar]
- Crick F. Function of the thalamic reticular complex: the searchlight hypothesis. Proc Natl Acad Sci U S A. 1984;81:4586–4590. doi: 10.1073/pnas.81.14.4586. [DOI] [PMC free article] [PubMed] [Google Scholar]
- Cynader M, Berman N. Receptive-field organization of monkey superior colliculus. J Neurophysiol. 1972;35:187–201. doi: 10.1152/jn.1972.35.2.187. [DOI] [PubMed] [Google Scholar]
- Denison RN, Vu AT, Yacoub E, Feinberg DA, Silver MA. Functional mapping of the magnocellular and parvocellular subdivisions of human LGN. Neuroimage. 2014;102:358–369. doi: 10.1016/j.neuroimage.2014.07.019. [DOI] [PMC free article] [PubMed] [Google Scholar]
- Deransart C, Hellwig B, Heupel-Reuter M, Léger JF, Heck D, Lücking CH. Single-unit analysis of substantia nigra pars reticulata neurons in freely behaving rats with genetic absence epilepsy. Epilepsia. 2003;44:1513–1520. doi: 10.1111/j.0013-9580.2003.26603.x. [DOI] [PubMed] [Google Scholar]
- Devlin JT, Sillery EL, Hall DA, Hobden P, Behrens TE, Nunes RG, Clare S, Matthews PM, Moore DR, Johansen-Berg H. Reliable identification of the auditory thalamus using multi-modal structural analyses. Neuroimage. 2006;30:1112–1120. doi: 10.1016/j.neuroimage.2005.11.025. [DOI] [PMC free article] [PubMed] [Google Scholar]
- Dumoulin SO, Wandell BA. Population receptive field estimates in human visual cortex. Neuroimage. 2008;39:647–660. doi: 10.1016/j.neuroimage.2007.09.034. [DOI] [PMC free article] [PubMed] [Google Scholar]
- Fletcher R, Powell MJD. A rapidly convergent descent method for minimization. Comput J. 1963;6:163–168. doi: 10.1093/comjnl/6.2.163. [DOI] [Google Scholar]
- Friston KJ, Fletcher P, Josephs O, Holmes A, Rugg MD, Turner R. Event-related fMRI: characterizing differential responses. Neuroimage. 1998;7:30–40. doi: 10.1006/nimg.1997.0306. [DOI] [PubMed] [Google Scholar]
- Glover GH. Deconvolution of impulse response in event-related BOLD fMRI. Neuroimage. 1999;9:416–429. doi: 10.1006/nimg.1998.0419. [DOI] [PubMed] [Google Scholar]
- Goldberg ME, Wurtz RH. Activity of superior colliculus in behaving monkey. I. Visual receptive fields of single neurons. J Neurophysiol. 1972;35:542–559. doi: 10.1152/jn.1972.35.4.542. [DOI] [PubMed] [Google Scholar]
- Haak KV, Cornelissen FW, Morland AB. Population receptive field dynamics in human visual cortex. PLoS One. 2012;7:e37686. doi: 10.1371/journal.pone.0037686. [DOI] [PMC free article] [PubMed] [Google Scholar]
- Handwerker DA, Ollinger JM, D'Esposito M. Variation of BOLD hemodynamic responses across subjects and brain regions and their effects on statistical analyses. Neuroimage. 2004;21:1639–1651. doi: 10.1016/j.neuroimage.2003.11.029. [DOI] [PubMed] [Google Scholar]
- Harting JK, Van Lieshout DP, Feig S. Connectional studies of the primate lateral geniculate nucleus: distribution of axons arising from the thalamic reticular nucleus of Galago crassicaudatus. J Comp Neurol. 1991;310:411–427. doi: 10.1002/cne.903100310. [DOI] [PubMed] [Google Scholar]
- Harvey BM, Dumoulin SO. The relationship between cortical magnification factor and population receptive field size in human visual cortex: constancies in cortical architecture. J Neurosci. 2011;31:13604–13612. doi: 10.1523/JNEUROSCI.2572-11.2011. [DOI] [PMC free article] [PubMed] [Google Scholar]
- Hikosaka O, Wurtz RH. Visual and oculomotor functions of monkey substantia nigra pars reticulata. I. Relation of visual and auditory responses to saccades. J Neurophysiol. 1983a;49:1230–1253. doi: 10.1152/jn.1983.49.5.1230. [DOI] [PubMed] [Google Scholar]
- Hikosaka O, Wurtz RH. Visual and oculomotor functions of monkey substantia nigra pars reticulata. II. Visual responses related to fixation of gaze. J Neurophysiol. 1983b;49:1254–1267. doi: 10.1152/jn.1983.49.5.1254. [DOI] [PubMed] [Google Scholar]
- Hikosaka O, Wurtz RH. Visual and oculomotor functions of monkey substantia nigra pars reticulata. III. Memory-contingent visual and saccade responses. J Neurophysiol. 1983c;49:1268–1284. doi: 10.1152/jn.1983.49.5.1268. [DOI] [PubMed] [Google Scholar]
- Hikosaka O, Wurtz RH. Visual and oculomotor functions of monkey substantia nigra pars reticulata. IV. Relation of substantia nigra to superior colliculus. J Neurophysiol. 1983d;49:1285–1301. doi: 10.1152/jn.1983.49.5.1285. [DOI] [PubMed] [Google Scholar]
- Horwitz GD, Newsome WT. Separate signals for target selection and movement specification in the superior colliculus. Science. 1999;284:1158–1161. doi: 10.1126/science.284.5417.1158. [DOI] [PubMed] [Google Scholar]
- Jancke D, Erlhagen W, Schöner G, Dinse HR. Shorter latencies for motion trajectories than for flashes in population responses of cat primary visual cortex. J Physiol. 2004;556:971–982. doi: 10.1113/jphysiol.2003.058941. [DOI] [PMC free article] [PubMed] [Google Scholar]
- Jones EG. Some aspects of the organization of the thalamic reticular complex. J Comp Neurol. 1975;162:285–308. doi: 10.1002/cne.901620302. [DOI] [PubMed] [Google Scholar]
- Kaas JH, Guillery RW, Allman JM. Some principles of organization in the dorsal lateral geniculate nucleus. Brain Behav Evol. 1972;6:253–299. doi: 10.1159/000123713. [DOI] [PubMed] [Google Scholar]
- Kastner S, O'Connor DH, Fukui MM, Fehd HM, Herwig U, Pinsk MA. Functional imaging of the human lateral geniculate nucleus and pulvinar. J Neurophysiol. 2004;91:438–448. doi: 10.1152/jn.00553.2003. [DOI] [PubMed] [Google Scholar]
- Katyal S, Zughni S, Greene C, Ress D. Topography of covert visual attention in human superior colliculus. J Neurophysiol. 2010;104:3074–3083. doi: 10.1152/jn.00283.2010. [DOI] [PubMed] [Google Scholar]
- Kim U, Sanchez-Vives MV, McCormick DA. Functional dynamics of GABAergic inhibition in the thalamus. Science. 1997;278:130–134. doi: 10.1126/science.278.5335.130. [DOI] [PubMed] [Google Scholar]
- Lau C, Zhou IY, Cheung MM, Chan KC, Wu EX. BOLD temporal dynamics of rat superior colliculus and lateral geniculate nucleus following short duration visual stimulation. PLoS One. 2011;6:e18914. doi: 10.1371/journal.pone.0018914. [DOI] [PMC free article] [PubMed] [Google Scholar]
- Li K, Patel J, Purushothaman G, Marion RT, Casagrande VA. Retinotopic maps in the pulvinar of bush baby (Otolemur garnettii) J Comp Neurol. 2013;521:3432–3450. doi: 10.1002/cne.23358. [DOI] [PMC free article] [PubMed] [Google Scholar]
- Mai JK, Paxinos G, Voss T. Atlas of the human brain. ed 3. San Diego, CA: Academic; 2007. [Google Scholar]
- Malpeli JG, Baker FH. The representation of the visual field in the lateral geniculate nucleus of Macaca mulatta. J Comp Neurol. 1975;161:569–594. doi: 10.1002/cne.901610407. [DOI] [PubMed] [Google Scholar]
- McAlonan K, Cavanaugh J, Wurtz RH. Attentional modulation of thalamic reticular neurons. J Neurosci. 2006;26:4444–4450. doi: 10.1523/JNEUROSCI.5602-05.2006. [DOI] [PMC free article] [PubMed] [Google Scholar]
- Montero VM, Guillery RW, Woolsey CN. Retinotopic organization within the thalamic reticular nucleus demonstrated by a double label autoradiographic technique. Brain Res. 1977;138:407–421. doi: 10.1016/0006-8993(77)90681-3. [DOI] [PubMed] [Google Scholar]
- Moschovakis AK, Scudder CA, Highstein SM. The microscopic anatomy and physiology of the mammalian saccadic system. Prog Neurobiol. 1996;50:133–254. doi: 10.1016/S0301-0082(96)00034-2. [DOI] [PubMed] [Google Scholar]
- O'Connor DH, Fukui MM, Pinsk MA, Kastner S. Attention modulates responses in the human lateral geniculate nucleus. Nat Neurosci. 2002;5:1203–1209. doi: 10.1038/nn957. [DOI] [PubMed] [Google Scholar]
- Parkes LM, Schwarzbach JV, Bouts AA, Deckers RH, Pullens P, Kerskens CM, Norris DG. Quantifying the spatial resolution of the gradient echo and spin echo BOLD response at 3 Tesla. Magn Reson Med. 2005;54:1465–1472. doi: 10.1002/mrm.20712. [DOI] [PubMed] [Google Scholar]
- Pelli DG. The VideoToolbox software for visual psychophysics: transforming numbers into movies. Spat Vis. 1997;10:437–442. doi: 10.1163/156856897X00366. [DOI] [PubMed] [Google Scholar]
- Pinault D, Bourassa J, Desch∧enes M. Thalamic reticular input to the rat visual thalamus: a single fiber study using biocytin as an anterograde tracer. Brain Res. 1995;670:147–152. doi: 10.1016/0006-8993(94)01303-Y. [DOI] [PubMed] [Google Scholar]
- Power JD, Barnes KA, Snyder AZ, Schlaggar BL, Petersen SE. Spurious but systematic correlations in functional connectivity MRI networks arise from subject motion. Neuroimage. 2012;59:2142–2154. doi: 10.1016/j.neuroimage.2011.10.018. [DOI] [PMC free article] [PubMed] [Google Scholar]
- Schneider KA. Subcortical mechanisms of feature-based attention. J Neurosci. 2011;31:8643–8653. doi: 10.1523/JNEUROSCI.6274-10.2011. [DOI] [PMC free article] [PubMed] [Google Scholar]
- Schneider KA, Kastner S. Visual responses of the human superior colliculus: a high-resolution functional magnetic resonance imaging study. J Neurophysiol. 2005;94:2491–2503. doi: 10.1152/jn.00288.2005. [DOI] [PubMed] [Google Scholar]
- Schneider KA, Kastner S. Effects of sustained spatial attention in the human lateral geniculate nucleus and superior colliculus. J Neurosci. 2009;29:1784–1795. doi: 10.1523/JNEUROSCI.4452-08.2009. [DOI] [PMC free article] [PubMed] [Google Scholar]
- Schneider KA, Richter MC, Kastner S. Retinotopic organization and functional subdivisions of the human lateral geniculate nucleus: a high-resolution functional magnetic resonance imaging study. J Neurosci. 2004;24:8975–8985. doi: 10.1523/JNEUROSCI.2413-04.2004. [DOI] [PMC free article] [PubMed] [Google Scholar]
- Sherman SM. The thalamus is more than just a relay. Curr Opin Neurobiol. 2007;17:417–422. doi: 10.1016/j.conb.2007.07.003. [DOI] [PMC free article] [PubMed] [Google Scholar]
- Sherman SM, Guillery RW. Functional organization of thalamocortical relays. J Neurophysiol. 1996;76:1367–1395. doi: 10.1152/jn.1996.76.3.1367. [DOI] [PubMed] [Google Scholar]
- Smith AT, Singh KD, Williams AL, Greenlee MW. Estimating receptive field size from fMRI data in human striate and extrastriate visual cortex. Cereb Cortex. 2001;11:1182–1190. doi: 10.1093/cercor/11.12.1182. [DOI] [PubMed] [Google Scholar]
- Smith AT, Cotton PL, Bruno A, Moutsiana C. Dissociating vision and visual attention in the human pulvinar. J Neurophysiol. 2009;101:917–925. doi: 10.1152/jn.90963.2008. [DOI] [PMC free article] [PubMed] [Google Scholar]
- Sparks DL. Translation of sensory signals into commands for control of saccadic eye movements: role of primate superior colliculus. Physiol Rev. 1986;66:118–171. doi: 10.1152/physrev.1986.66.1.118. [DOI] [PubMed] [Google Scholar]
- Sparks DL. The brainstem control of saccadic eye movements. Nat Rev Neurosci. 2002;3:952–964. doi: 10.1038/nrn986. [DOI] [PubMed] [Google Scholar]
- Tseng KY, Riquelme LA, Belforte JE, Pazo JH, Murer MG. Substantia nigra pars reticulata units in 6-hydroxydopamine-lesioned rats: responses to striatal D2 dopamine receptor stimulation and subthalamic lesions. Eur J Neurosci. 2000;12:247–256. doi: 10.1046/j.1460-9568.2000.00910.x. [DOI] [PubMed] [Google Scholar]
- Viviano JD, Schneider KA. Interhemispheric interactions of the human thalamic reticular nucleus. J Neurosci. 2015;35:2026–2032. doi: 10.1523/JNEUROSCI.2623-14.2015. [DOI] [PMC free article] [PubMed] [Google Scholar]
- Wang S, Bickford ME, Van Horn SC, Erisir A, Godwin DW, Sherman SM. Synaptic targets of thalamic reticular nucleus terminals in the visual thalamus of the cat. J Comp Neurol. 2001;440:321–341. doi: 10.1002/cne.1389. [DOI] [PubMed] [Google Scholar]
- Worsley KJ, Liao CH, Aston J, Petre V, Duncan GH, Morales F, Evans AC. A general statistical analysis for fMRI data. Neuroimage. 2002;15:1–15. doi: 10.1006/nimg.2001.0933. [DOI] [PubMed] [Google Scholar]
- Wurtz RH, Albano JE. Visual-motor function of the primate superior colliculus. Annu Rev Neurosci. 1980;3:189–226. doi: 10.1146/annurev.ne.03.030180.001201. [DOI] [PubMed] [Google Scholar]
- Xu X, Ichida JM, Allison JD, Boyd JD, Bonds AB, Casagrande VA. A comparison of koniocellular, magnocellular and parvocellular receptive field properties in the lateral geniculate nucleus of the owl monkey (Aotus trivirgatus) J Physiol. 2001;531:203–218. doi: 10.1111/j.1469-7793.2001.0203j.x. [DOI] [PMC free article] [PubMed] [Google Scholar]
- Xu X, Bonds AB, Casagrande VA. Modeling receptive-field structure of koniocellular, magnocellular, and parvocellular LGN cells in the owl monkey (Aotus trivirgatus) Vis Neurosci. 2002;19:703–711. doi: 10.1017/S0952523802196027. [DOI] [PubMed] [Google Scholar]
- Zhang P, Zhou H, Wen W, He S. Layer-specific response properties of the human lateral geniculate nucleus and superior colliculus. Neuroimage. 2015;111:159–166. doi: 10.1016/j.neuroimage.2015.02.025. [DOI] [PubMed] [Google Scholar]