

Abstract
The anterior cingulate cortex (ACC) and prefrontal cortex (PFC) are believed to coactivate during goal-directed behavior to identify, select, and monitor relevant sensory information. Here, we tested whether coactivation of neurons across macaque ACC and PFC would be evident at the level of pairwise neuronal correlations during stimulus selection in a spatial attention task. We found that firing correlations emerged shortly after an attention cue, were evident for 50–200 ms time windows, were strongest for neuron pairs in area 24 (ACC) and areas 8 and 9 (dorsal PFC), and were independent of overall firing rate modulations. For a subset of cell pairs from ACC and dorsal PFC, the observed functional spike-train connectivity carried information about the direction of the attention shift. Reliable firing correlations were evident across area boundaries for neurons with broad spike waveforms (putative excitatory neurons) as well as for pairs of putative excitatory neurons and neurons with narrow spike waveforms (putative interneurons). These findings reveal that stimulus selection is accompanied by slow time scale firing correlations across those ACC/PFC subfields implicated to control and monitor attention. This functional coupling was informative about which stimulus was selected and thus indexed possibly the exchange of task-relevant information. We speculate that interareal, transient firing correlations reflect the transient coordination of larger, reciprocally interacting brain networks at a characteristic 50–200 ms time scale.
SIGNIFICANCE STATEMENT Our manuscript identifies interareal spike-train correlations between primate anterior cingulate and dorsal prefrontal cortex during a period where attentional stimulus selection is likely controlled by these very same circuits. Interareal correlations emerged during the covert attention shift to one of two peripheral stimuli, proceeded on a slow 50–200 ms time scale, and occurred between putative pyramidal and putative interneurons. Spike-train correlations emerged particularly for cell pairs tuned to similar contralateral target locations, thus indexing the interareal coordination of attention-relevant information. These findings characterize a possible way by which prefrontal and anterior cingulate cortex circuits implement their control functions through coordinated firing when macaque monkeys select and monitor relevant stimuli for goal-directed behaviors.
Keywords: anterior cingulate, attention, brain networks, correlation, prefrontal cortex, synchronization
Introduction
Multiple anatomically segregated brain areas play a role in the flexible allocation of attention during goal-directed behavior. Among those areas are the anterior cingulate cortex (ACC) and the prefrontal cortex (PFC; Buckley et al., 2009; Miller and Buschman, 2012; Passingham and Wise, 2012; Genovesio et al., 2014). The ACC is suggested to monitor and guide attentional selection, whereas lateral and dorsal prefrontal areas are involved in the actual implementation of attentional control, and ventromedial prefrontal areas contribute relevant value estimates of possible attentional targets (Alexander and Brown, 2011; Kaping et al., 2011; Kennerley et al., 2011; Shenhav et al., 2013). To this point, it is unclear how attention information is integrated across these distributed brain areas, and studies investigating direct, interareal correlations between these areas have been sparse. One possible mechanism is that neurons across these brain areas synchronize their firing to delegate information. The communication between the PFC subareas and the ACC has been tested by a few studies that used electroencephalography (Cavanagh et al., 2009) or local field potential (LFP) measures (Tsujimoto et al., 2006; Rothé et al., 2011; Womelsdorf et al., 2014a). For instance, increased theta band phase coherence between ACC and lateral PFC (lPFC) electrodes was found previously in humans and macaques performing different tasks that probed cognitive control and task-switching abilities (Cavanagh et al., 2009; Phillips et al., 2014). Previous findings in the macaque suggest that the interaction between lateral PFC areas and ACC can be traced back to the burst firing events of cells in ACC, with bursts in the ACC synchronizing to the LFP in PFC during attentional states (Womelsdorf et al., 2014a). These findings provide compelling evidence for the existence of direct communication between the ACC and PFC during attentional control. This interaction may also be evident in functional firing correlations between single cells in both brain areas given their largely dendrite mediated interconnectivity (Medalla and Barbas, 2009).
Multiple methods exist for analyzing spike-train correlations between single cells, one being the joint peristimulus time histogram (JPSTH) analysis (Aertsen et al., 1989; Vaadia et al., 1995b; Paz et al., 2007; Joshua et al., 2009; Schultz et al., 2009; Cohen et al., 2010, Zhuang et al., 2014), which we used in this work. The JPSTH allows a time-resolved analysis of the dynamic correlation of the spikes of one neuron with those of a second neuron while controlling for an influence of overall firing rate modulations. Here, we used JPSTH analysis to test whether neuron pairs across areas of the ACC/PFC transiently coordinated by correlating their firing when attention shifted to one of two possible target stimuli. We found that cells, on average, increased their spike-train correlations ∼280 ms after an attention cue that triggered the covert selection of one peripheral stimulus. Spike-train correlations occurred on a slow 50–200 ms time scale and between distant neurons, and are therefore unlikely to be caused by direct monosynaptic connections. These correlations observed are therefore qualitatively different from short (<5 ms) time lag cross-correlations of neurons recorded within close (<∼0.4 mm) proximity (Kohn and Smith, 2005; Zhou et al., 2014). The emergence of attention-specific spike-train correlations was not dependent on overall firing rate modulations, emerged with anatomical specificity, and was found between neurons in ACC and dorsal PFC (dPFC), where spike-train correlations carried attention information about the location of the relevant target stimulus. Furthermore, spike-train correlations could be identified in pairs of isolated single neurons with broad as well as narrow waveforms (putative pyramidal neurons and interneurons, respectively), providing a direct window into how individual neurons contribute to larger recurrent network activations at slow, 50–200 ms time scales.
Materials and Methods
Procedures.
Data were collected from two male rhesus macaques (Macaca mulatta). All animal care and experimental protocols were approved by the University of Western Ontario Council on Animal Care and were in accordance with the Canadian Council on Animal Care guidelines. Details regarding the experimental setup, recording procedures, and reconstruction of recording sites have been described previously (Kaping et al., 2011). Briefly, extracellular recordings were made with one to six tungsten electrodes (impedance, 1.2–2.2 MΩ; FHC) through standard recording chambers (19 mm inner diameter) implanted over the left hemispheres in both monkeys. Electrodes were lowered daily through guide tubes and a recording grid with 1 mm interhole spacing using software-controlled precision microdrives (NAN Instruments). Data amplification, filtering, and acquisition were done with a multichannel acquisition processor (Map System; Plexon). Spiking activity was obtained following a 100–8000 Hz passband filter and further amplification and digitization at a 40 kHz sampling rate. Eye positions were monitored using a video-based eye-tracking system (ISCAN; sampling rate, 120 Hz) calibrated before each experiment to a five-point fixation pattern (one central fixation point and the remaining four points offset by 8.8° vertical and 6° horizontal toward the four corners of the monitor). Eye fixation was controlled within a 1.4–2.0° radius window. Sorting and isolation of single-unit activity (SUA) was performed off-line with Offline Sorter (Plexon), based on principal component analysis (PCA) of the spike waveforms.
During the experiments, stimulus presentation, monitored eye positions, and reward delivery were controlled via MonkeyLogic (open-source software, http://www.brown.edu/Research/monkeylogic/).
Behavioral paradigm.
Monkeys performed a selective attention task requiring a two-alternative forced-choice discrimination (Fig. 1A). The behavioral task was described previously in detail (Kaping et al., 2011). Briefly, each trial started with the appearance of a gray central fixation point, which monkeys had to fixate. After 0.3 s, two black/white drifting gratings appeared to the left and right of the central fixation point. Following another 0.4 s, the two stimulus gratings changed color to black/green and black/red. After 0.05–0.75 s, the central fixation point turned either green or red, instructing the monkey to covertly shift attention to the matching stimulus grating. Another 0.05–4 s later, both stimulus gratings rotated with a temporal gap either clockwise or counterclockwise. The monkey had to discriminate the clockwise or counterclockwise rotation of the cued stimulus grating and respond with an upward or downward saccade, respectively, to one of two target dots. In 50% of the trials, the noncued stimulus grating rotated first, which had to be ignored by the monkey. A correct saccadic response had to occur within 0.05 and 0.6 s following rotation onset to a target dot vertically above or below the fixation point. The response target dot had to be fixated for a minimum of 50 ms, which then resulted in a liquid reward. Reward size varied between 0.76 and 0.4 ml for different colors across blocks of 30 trials. Reward associations changed across blocks and were equally balanced, and are therefore expected to not systematically affect any analysis we report and conclusions we draw.
Figure 1.
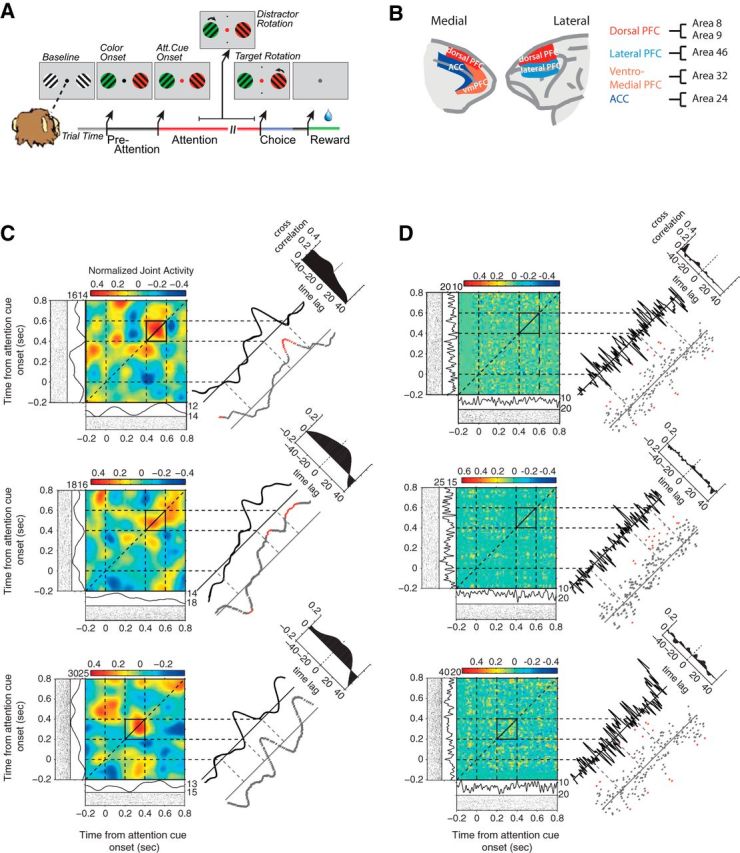
Task, recording locations, and example JPSTHs. A, The selective attention task required monkeys to fixate a central point while presented with two peripheral grating stimuli. First, both grating stimuli changed their color to either green or red. Then, the fixation point changed its color to match one of the two gratings, and the monkeys had to use this cue instruction to covertly attend to the relevant stimulus. Monkeys then sustained focused attention until the relevant stimulus rotated, filtering out a potential rotation of the distractor stimulus, and finally reported it with a saccadic response to one of two target locations (top vs bottom) in association to a clockwise versus counterclockwise rotation. Monkeys received reward when correctly indicating the rotation direction of the cued stimulus. See Material and Methods for more details. B, The medial (left) and lateral (right) prefrontal cortex of the macaques. The colors label the four cortical fields from which neuronal activity was recorded. The cortical subdivision follows anatomical parcellation results by Saleem et al. (2014). C, Three examples of normalized and shift-predictor-corrected JPSTHs (Aertsen et al., 1989) that were computed with spike density functions with a Gaussian kernel width of 50 ms. The line to the immediate right of each JPSTH represents the coincidence line of the JPSTH, averaged over ±25 ms around the main diagonal. The top right corner depicts the cross-correlogram of the sector of the JPSTH defined by the black square. It was computed by collapsing over the time axis. Below the coincidence line are the Pearson correlation coefficients computed in 5 ms windows. Red dots indicate significant correlation (t test, p ≤ 0.05). Below and to the left of each JPSTH is the PSTH and raster plot of the two neurons from which the JPSTH was computed. D, Same examples and conventions as in C, but computed with a Gaussian kernel width of 5 ms.
Anatomical reconstruction.
We recorded from neurons in prefrontal and anterior cingulate cortex across subfields that we identified following anatomical reconstruction as outlined before (Kaping et al. 2011). In summary, we projected each electrode trajectory onto the two-dimensional brain slices obtained from 7T anatomical MRI images, using the open-source OsiriX imaging software (Rosset et al., 2004) and custom-written MATLAB programs (MathWorks), using the iodine-visualized electrode trajectory within the electrode grid placed within the recording chamber during MR scanning. We drew the coronal outline of the cortical folding of the MR gray-scale image to ease the comparison of the individual monkey brain slices to standard anatomical atlases, before projecting the electrode tip position into the standardized macaque brain template (F99), available in Caret (http://www.nitrc.org/projects/caret). Note that we initially reproduced the individual monkey brains within the Caret software to validate similarity and derive the scaling factors to match the lower-resolution monkey MR images to the higher-resolution standard F99 brain. We then manually projected, under visual guidance, the electrode position to the matched location in the standard brain in Caret (Van Essen, 2002). In an independent procedure, we visualized major anatomical subdivision schemes of the frontocingulate cortex, using the scheme from the Price Lab (Saleem et al., 2008, 2014) as a reference. Similar results are obtained when using other prefrontal/cingulate cortex subdivision schemes from Barbas and Zikopoulos (2007), Petrides and Pandya (1994, 1999), and Sallet et al. (2013). Neurons were recorded in the anterior cingulate cortex (area 24), the dorsal prefrontal cortex (areas 8, 9), the lateral prefrontal cortex (area 46), and the ventromedial prefrontal cortex (vmPFC; area 32; Fig. 1B).
Data analysis.
Analysis was performed with custom MATLAB code (MathWorks), using functionality from the open-source fieldtrip toolbox (http://www.ru.nl/fcdonders/fieldtrip/). The analysis of spiking activity was limited to neurons with a minimum average firing rate of 1 Hz and a minimum of 30 spikes. Spike trains were aligned to either the onset of the attention cue (cue aligned) or the onset of stimulus color (color aligned), depending on the analysis. For cue-aligned data, trials in which color onset occurred within 200 ms before attention cue onset and rotation onset occurred within 1000 ms after attention cue onset were discarded. For color-aligned data, trials in which attention cue onset occurred within 200 ms after color cue onset were discarded. Unless specified otherwise, spike density functions were convolved using a Gaussian kernel with an SD of 50 ms. We define this kernel width as a time window of 100 ms. The following analysis is therefore based on smoothed spike trains and cannot be directly compared to spike cross-correlation analyses using unsmoothed data (Kohn and Smith, 2005; Zhou et al., 2014).
Joint peristimulus time histograms.
Spike-timing relations between neuron pairs were measured using JPSTHs (Aertsen et al., 1989). The normalized JPSTH of neurons i and j was defined as follows:
 |
where Sjr(t) represents the activity of neuron j for the rth trial at time t, t1 and t2 are time points within the trial, angle brackets represent averaging over r trials, N is the number of trials, and S̄i(t1) represents the average activity of neuron i at time t1 over all trials. To remove stimulus-induced covariations in firing (de la Rocha et al., 2007), we computed a normalized shift-predictor in consecutive trials in a symmetric way, with the same conventions as above:
 |
Picking consecutive trials and computing the shift predictor in a symmetric way ensures that slow changes in the temporal structure do not affect the shift predictor (as opposed to shuffling the order of all trials for one of two channels). The shift predictor does not correct for excitability fluctuations that are independent of stimulus-induced covariations. The normalized shift predictor was subtracted from the normalized JPSTH to produce the final shift-predictor-corrected JPSTH (Fig. 1C,D). Spike density functions used to compute JPSTHs were smoothed with Gaussian kernels with an SD of 50 ms (Figs. 1C, 2A). For visualization purposes, JPSTHs were also computed using spike density functions smoothed with a Gaussian kernel with an SD of 5 ms (Figs. 1D, 2E). The JPSTH analysis, compared to a simpler Pearson correlation analysis (see below, Pearson correlation analysis), allows an estimate of firing-rate-corrected spike train–to–spike train correlations that is not restricted to only coincident firing, but also allows insight into the timing relations of these interactions. The diagonal of the JPSTH corresponds to coincident firing and measures the average spike-timing correlation over time, and will, in the following, be referred to as the coincidence line and as an indicator for the absence or presence of what we refer to as “spike-train correlations.” The coincidence line was computed by averaging the JPSTH's main diagonal ± 25 ms (Fig. 1C,D). Coincidence lines were then baseline corrected by subtracting the average correlated spiking activity within 200 ms before the attention cue onset. Significance along the diagonals, averaged over all cell pairs or over cell pairs of a given area combination, was assessed using a t test (p ≤ 0.05). Task modulation of cell pairs was defined as a significant change (t test, p ≤ 0.05) in average firing rate in both cells over the 800 ms after the attention cue presentation compared to the 200 ms before the attention cue. When computing the average JPSTH, to prevent the arbitrary positioning of each cell on either the x- or y-axis from confounding the overall JPSTH, we randomly placed each cell in a pair on either the x- or y-axis 200 times and averaged across randomizations. This procedure led to a symmetric average JPSTH (Fig. 2A). When computing the average percentage change of correlation before and after the attention cue, for each cell pair, the average correlation in the 200 ms before cue onset was compared to the 300–600 ms time window after cue onset.
Figure 2.
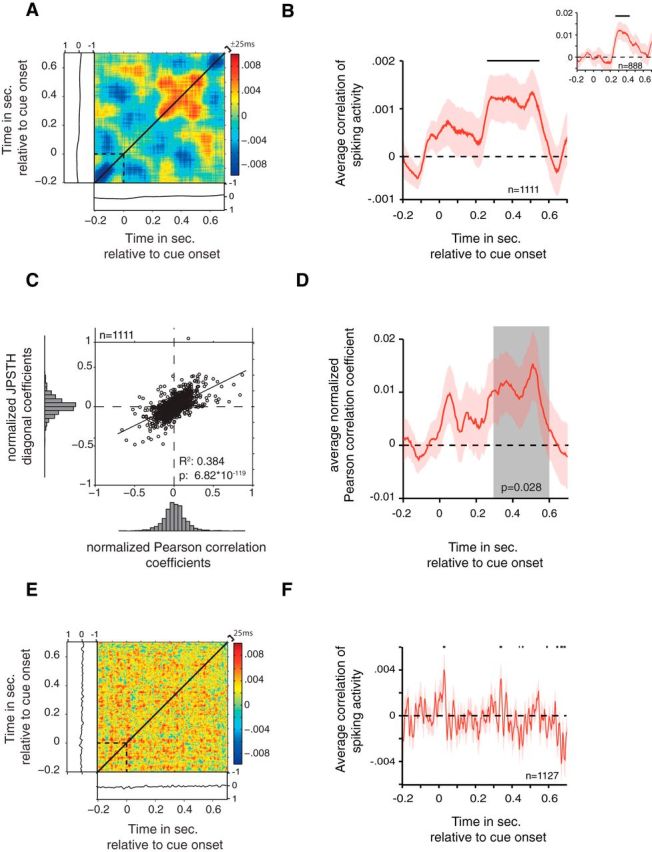
Average firing correlations with JPSTH and Pearson correlation. A, Average normalized JPSTH computed over all task-modulated cell pairs. Average normalized PSTHs are shown to the left and below the JPSTH. The JPSTH is symmetric due to a randomization procedure, which eliminates a positioning bias of cells on either the x- or y-axis. The JPSTH diagonal (black line) was computed by averaging, ±25 ms, around the main diagonal. B, The average main JPSTH diagonal, ±SEM, of all task-modulated cell pairs. The black horizontal bar indicates significance (t test, p < 0.05). Inset, Average main JPSTH diagonal after removal of the outer 20% of cell pairs determined by the average strength of correlated firing. C, Correlation of JPSTH diagonal coefficients and Pearson correlation coefficients. The correlation was computed for the average coefficients in the 300–600 ms after attention cue onset. Histograms represent the distribution of values. The R2 and p values result from the regression analysis. D, Average Pearson correlation coefficient, ±SEM, over all task-modulated cell pairs. The p value represents the outcome of a t test comparing the average coefficient values in the 300–600 ms after attention cue onset (gray zone) against zero. E, The same conventions as in A are used, but the JPSTH was created with a 10 ms smoothing window. F, The same conventions as in B are used, but created using a 10 ms smoothing window.
For analyzing the firing rate dependence of synchronized firing, we normalized the PSTHs of each cell by subtracting the baseline period in the 200 ms before cue onset. We then averaged the normalized firing rate of both cells in a given pair for the time window 0–800 ms after the attention cue onset and used a regression analysis (p ≤ 0.05) to determine whether a significant correlation existed between the average firing rate and the strength of synchronous firing in each cell pair. When analyzing the distance dependence of synchronous firing, we measured the distance between two cells in two different ways. First, we measured the physical distance between cells based on the x–y–z 3D coordinates of the electrode tip they were recorded from, and second, we measured cortical gray-matter distance between electrode tips based on the 2D coordinates on a flattened representation of the cortical sheet (Kaping et al., 2011). For both measures, correlation between cell distance and firing correlations in the time window 0–800 ms after cue onset was evaluated using a regression analysis (p ≤ 0.05).
When analyzing the temporal characteristics of neuronal firing correlation, we adjusted the Gaussian kernel widths with which the PSTHs were computed to 12.5, 25, 50 (default), 100 and 200 ms and repeated the analysis. These kernel widths were defined as time windows of 25, 50, 100, 200, and 400 ms, and will be referred to as such from now on. Based on the temporal evolution of the basic firing correlations, we compared the strength of the effect at different smoothing windows in the first (0–300 ms) and second 300 ms windows (300–600 ms) after attention cue onset using varying Gaussian kernel widths. Differences were assessed using a t test and one-way ANOVA (p ≤ 0.05).
Anatomical specificity.
To test for anatomical specificity of firing correlations, we separated cell pairs into four within-area groups (ACC–ACC, lPFC–lPFC, dPFC–dPFC, vmPFC–vmPFC) and six between-area groups (ACC–dPFC, ACC–lPFC, ACC–vmPFC, dPFC–lPFC, dPFC–vmPFC, lPFC–vmPFC) based on the subnetwork area division scheme recently proposed by Saleem et al. (2014) (Fig. 1B). To determine significant firing correlations exceeding zero correlations between specific area combinations, all JPSTH coincidence lines from cell pairs within a specific area combination were averaged. Based on the temporal development of the increased synchronous firing across area combinations, comparisons were made within the 300–600 ms time window after attention cue onset. Significant differences from zero were determined with a t test (p ≤ 0.05).
Asymmetry of spike-train correlations.
We calculated an asymmetry index (AI; Paz et al., 2007) to test for systematic time lags underlying the firing correlations of the spiking activity of two neurons in separate areas (see Fig. 4A). This was done by separately adding all bins above (a) and below (b) the coincidence line of the JPSTH for the time window 0–800 ms after cue onset and computing a normalized difference [(a − b)/(a + b)] for each JPSTH. A significant difference from zero of the average asymmetry index for each area combination was tested using a Wilcoxon signed rank test (p ≤ 0.05) and implied that spikes from one area were systematically leading/lagging spiking activities in another areas.
Figure 4.
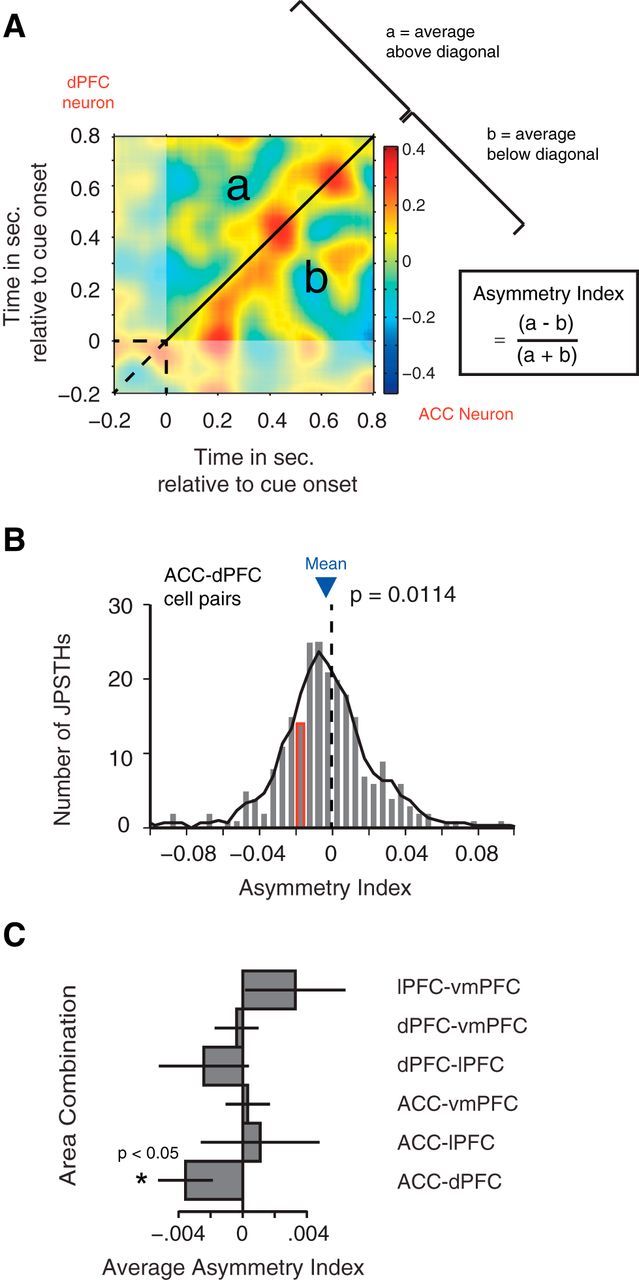
Asymmetry of correlated firing. A, Example JPSTH of a cell pair with one cell in the ACC (x-axis) and the other in the dorsal PFC (y-axis), illustrating the calculation of the AI. The AI was computed over the time window 0–800 ms after attention cue onset with a 100 ms smoothing window for all task-modulated cell pairs. Average values above the diagonal and below the diagonal are computed, and the AI is obtained using the formula to the right of the JPSTH. B, Histogram of the distribution of AIs across all ACC–dPFC cell pairs. The mean AI (−0.0187) is indicated by the blue triangle. The example pair from A falls into the bar highlighted with a red border. The p value indicates that the distribution of asymmetry indices indices falls significantly below zero (Wilcoxon rank sum test). C, Average asymmetry indices indices for every area combination. Error bars represent SEM. The asterisk indicates significance (Wilcoxon rank sum test, p < 0.05).
Spatial attention analysis.
We determined the contralateral and ipsilateral preference of each cell using their relative firing rate modulation after attention cue onset. If a cell showed, on average, a higher firing rate within the 800 ms after the attention cue onset when attention was shifted to the contralateral as opposed to the ipsilateral side, this cell was labeled as a contralateral-preferring cell and vice versa. Accordingly, cell pairs were then labeled as either contra–contra, ipsi–ipsi, or contra–ipsi preferring pairs. Average spike-train correlations between these three groups were compared by averaging the JPSTH coincidence lines of all cell pairs within a group and comparing these across the three groups using an ANOVA and post hoc comparisons (one-way ANOVA, p ≤ 0.05; Tukey–Kramer test, p ≤ 0.05).
We determined for every cell pair whether their spike-train correlations contained spatial attention information using a randomization analysis. For every cell pair, trials were randomly labeled as attend right or attend left, and the resulting average JPSTH was created 300 times. The average randomized JPSTH coincidence line was then compared against the original coincidence line. A cell pair was considered to show significant spatial attention effects when, within 0–800 ms after the attention cue onset, firing correlations were, for a minimum of 150 ms, significantly different from the randomized average coincidence line (|average diagonal| > 1.96 * SD of the randomization statistic). We then computed the fractions of significant cell pairs for each area combination separately and compared them for within-area combinations and for between-area combinations using a χ2 statistic (p ≤ 0.05). We additionally tested whether each fraction individually was significantly different from what would be expected by chance (binomial statistics, p ≤ 0.05).
Classification of cell types according to action potential waveform characteristics.
For the set of highly isolated neurons (n = 404) in our sample, we aligned, normalized, and averaged all action potentials (APs; for details of these procedures, see the freely available online repository and MATLAB documentation at http://attentionlab.ca/doku.php?id=ap-waveform-analysis; Ardid et al. 2015). Each neuronal waveform was fitted with cubic interpolation from an original precision of 25 to 2.5 μs. On the resultant waveform, we analyzed two measures (see Fig. 6B): the peak-to-trough duration and the time for repolarization. The time for repolarization was defined as the time at which the waveform amplitude decayed 25% from its peak value. These two measures were highly correlated (r = 0.68, p < 0.001, Pearson correlation). We computed the principal component analysis and used the first component (explaining 84.5% of the total variance) because it allowed for better discrimination between narrow- (NS) and broad-spiking (BS) neurons, compared to any of the two measures alone. Results from the calibrated Hartigan dip test discarded unimodality for the first PCA component (p < 0.01) and for the peak to trough duration (p < 0.05), but not for the duration of 25% repolarization (p > 0.05). In addition, we applied Akaike's and Bayesian information criteria for the two- versus one-Gaussian model to determine whether using extra parameters in the two-Gaussian model is justified. In both cases, the information criteria decreased (from −669.6 to −808.9 and from −661.7 to −788.9, respectively), confirming that the two-Gaussian model is better. We then used the two-Gaussian model and defined two cutoffs that divided neurons into three groups. The first cutoff was defined as the point at which the likelihood of a narrow-spiking cell was 10 times larger than the likelihood of a broad-spiking cell. Similarly, the second cutoff was defined as the point at which the likelihood of broad-spiking cell was 10 times larger than the likelihood of a narrow-spiking cell. Thus, 95% of neurons (n = 384) were reliably classified: neurons at the left side of the first cutoff were reliably classified as narrow-spiking neurons (20%; n = 79), and neurons at the right side of the second cutoff were reliably classified as broad-spiking neurons (75%; n = 305). The remaining neurons were labeled as “fuzzy” neurons because they fell in between the two cutoffs and were not reliably classified (5%; n = 20; see Fig. 6). All isolated waveforms that were not separable from the noise in a clean way were defined as multiunit activity (MUA) and were likely composed of narrow- as well as broad-spiking cells.
Figure 6.

Cell-type specificity of firing correlations in the ACC/PFC. A, Normalized AP waveforms of single cells. Red and blue colors highlight NS and BS cells, respectively. Black waveforms mark cells that were not classified (fuzzy category). B, Illustration of the two features used to characterize cells' APs. C, Bimodal distribution of cells according to the combination of the two action potential features, showing clean separation of NS and BS cells (see Materials and Methods). D, Illustration of combinations of BS, NS, and multiunit recordings tested for consistent spike-train correlations. E, Normalized cross-correlation, indexed as the average JPSTH diagonal (±25 ms, x-axis) for three different types of cell combinations. The blue mark denotes spike-train correlations between BS cells and multiunits. The red mark shows (anti)correlation of NS cell spike trains with multiunits. The black mark denotes spike-train correlations of NS with BS cell activity. The p values indicate difference from zero correlation. Black asterisks indicate significant difference from zero correlation (Wilcoxon rank sum test, p ≤ 0.05). F, Same format as E but restricting the averaging of spike-train correlation to pairs of neuron activity from different brain areas. Error bars in E and F denote SEM. Firing correlations were indexed as the average coincidence line (±25 ms) of the JPSTH during 0.3–0.6 s after attention cue onset.
Pearson correlation analysis.
To verify our main results with a somewhat simpler approach, we computed the Pearson correlation coefficients on the spike density functions of all our cell pairs. The Pearson correlation coefficient is defined as follows:
 |
where Si(t) represents the activity of neuron i at time t, and S̄i(t) represents the average activity of neuron i at time t over all trials. Coefficients were computed in 5 ms bins for the time window −0.2–0.8 ms following attention cue onset. For averaging, Pearson correlation coefficients were first normalized by Fisher z-transformation and then, in line with the JPSTH analysis, baseline corrected by subtracting the average activity in the 200 ms before attention cue onset. Significant difference from zero for the average normalized Pearson correlation coefficient was determined in the time window 300–600 ms after attention cue onset with a t test (p ≤ 0.05; Fig. 2D). To qualitatively compare the JPSTH with the Pearson correlation method, we computed the average Pearson correlation coefficient over the 300–600 ms time window of interest for each cell pair and compared it against the JPSTH diagonal averaged over the same time window. Significant correlation between the two was determined with a regression analysis (p ≤ 0.05; Fig. 2C). Additionally, we computed the Spearman correlation coefficients and analyzed them in an equivalent way to the Pearson correlation coefficients. Results were qualitatively similar (data not shown).
Analysis of reward outcome expectation on spike-train correlations.
Cued target stimuli were associated with a high or low reward outcome, which allowed testing for possible influences of reward outcome expectation on spike-train correlations (for details, see Kaping et al., 2011). For this analysis, trials were split into those with high and low reward outcome associated with the target stimulus for each cell pair before computing the JPSTHs. We then compared the average diagonals across cell pairs for low and high reward outcome trials within the 300–600 ms after the attention cue onset (t test, p ≤ 0.05). This was done for the task-modulated cell selection as well as over all cell pairs.
Testing the relation of spike-train correlations and burst firing.
To investigate the relationship between spike-train correlations and the occurrence of burst firing, which was reported previously to be correlated with LFP activity (Womelsdorf et al., 2014a), we extracted all neuron pairs in which either both neurons or one neuron were recorded as single units (SUA). Burst events were defined as two or more spikes occurring within 5 ms (for details, see Womelsdorf et al., 2014a). The proportion of burst to nonburst events was calculated for the 300–600 ms after attention cue onset for neurons identified as SUA only. If both neurons in a pair were SUA, the proportion of burst to nonburst events was averaged over the two neurons. We then compared the proportion of burst to nonburst events for each neuron pair with the strength of spike-train correlations (regression analysis, p ≤ 0.05).
Comparison of spike-train correlations and phase-amplitude LFP–LFP correlations.
To compare the spike-train correlations with cross-frequency correlations of LFP activity reported previously on the same data set (Voloh et al., 2015), we first extracted LFP pairs for those recording pairs that also contained neuronal firing activity and were thus used in the spike-train correlation analysis. We then followed procedures identical to those outlined by Voloh et al. (2015). In brief, we bandpass filtered the raw LFP signals with a fourth-order, two-pass Butterworth filter and then Hilbert transformed them. We restricted this analysis to those frequencies that were shown to be related to attention in the previous report, extracting the (theta) phase of 7 ± 2.3 Hz as [4.7 9.3] Hz and the (gamma) amplitude envelopes of 40 ± 13.3 Hz as [26.7 53.3] Hz frequency bands for all correctly performed trials in the [−0.5 0] s and [0 0.5] s time windows before and after attention cue onset, respectively. We quantified cross-frequency correlation between the theta phase and the gamma amplitude using Tort's modulation index (Tort et al., 2010). Phase–amplitude correlation was analyzed exclusively for LFP pairs recorded from different electrodes, which also provided neuronal firing signals used in the main analysis of spike-train correlations. Theta–gamma correlations and spike-train correlations were compared for matching electrode pairs using Pearson correlation coefficients after removal of outliers, which were defined as values >5 SDs from the z-transformed data.
Results
We recorded from 1151 neurons in macaque anterior cingulate and prefrontal cortex while animals performed a cued spatial attention task (Fig. 1A), described in detail previously (Kaping et al., 2011). Results from qualitatively different analyses of this data set have been reported previously (Kaping et al., 2011; Shen et al., 2015; Womelsdorf et al., 2014a, Voloh et al., 2015). During task performance, we collected recordings from 2131 pairs of cells recorded simultaneously from different electrodes. We did not include same-electrode pairs in this analysis, and restricted the analysis to correctly performed trials with equal sensory stimulation conditions during the entire analysis time windows (see Materials and Methods).
Behavioral performance
The two animals exhibited similar performance, with 71% (Monkey M) and 63% (Monkey R) correctly completed trials, respectively. Error responses were also distributed similarly across the two monkeys and consisted of fixation breaks occurring before the rotation of the target stimulus (Monkey M, 25%; Monkey R, 20%), incorrect responses defined as saccadic responses to the wrong response target (Monkey M, 1%; Monkey R, 3%), late responses initiated only after the response time window (Monkey M, 0%; Monkey R, 1%), no response (Monkey M, 7%; Monkey R, 1%), and hold fixation on target errors (Monkey M, 2%; Monkey R, 6%).
Spike-train correlations increase when selective attention is deployed
To investigate potential neural interactions between cells across the prefrontal and cingulate cortices, we analyzed coincident firing (henceforth, “correlated firing”) by computing JPSTHs (Fig. 1C,D) that allow measurements of dynamic cross-correlations of spike trains of distant neurons (Aertsen et al., 1989). JPSTHs were computed using 100 ms smoothing time windows (see Materials and Methods), and increases and decreases of firing correlations between cells were assessed via the coincidence line of each JPSTH and validated by calculating Pearson correlations of the spike trains in the same analysis window (Fig. 1C; see Materials and Methods). To test whether neurons dynamically synchronize their firing when attention is shifted, JPSTHs were aligned to the onset of the attention cue (Fig. 1A). When we averaged the coincidence lines of all cell pairs that showed significant task modulation (see Materials and Methods), we found that cell pairs across the prefrontal and anterior cingulate cortices showed a transient increase in firing correlations during the 280–550 ms after the attention cue onset (Fig. 2A,B; t test, p ≤ 0.05). This effect remained evident when considering all cell pairs, regardless of the cells' task modulation (data not shown). Additionally, this effect disappeared when considering only non-task-modulated neuron pairs (n = 120; t test, p = 0.194; data not shown). The increase in firing correlations following the attention cue was not due to transient increases in average firing rates, as can be seen in the average PSTHs (Figs. 1C,D, example JPSTHs, 2A). Previous studies using the JPSTH controlled for the influence of overall firing rate magnitudes to affect correlations by computing surrogate data with the same average firing rates, but where specific spike-timing information was random (Cohen et al., 2010). To exclude the possibility that our main effects are due to spurious JPSTH correlations driven purely by mean firing rate, we correlated the average firing rate of neurons in a given pair with the average JPSTH diagonal and found that overall firing rates did not explain significant spike-train correlations (Fig. 3A). To test whether the main effect depended on cell pairs with particularly high or low correlation values, we calculated the effect after removing cell pairs with the strongest 20% correlate values. As shown in Figure 2B (inset), the main effect persisted for this reduced population of cell pairs. As a control analysis, we computed the Pearson correlation coefficients for each cell pair. The average Pearson correlation coefficient for all task-modulated cell pairs was significantly increased in the 300–600 ms after attention cue onset (Fig. 2D; t test, p = 0.028). This effect also remained when considering all cell pairs independent of task modulation (data not shown; t test, p = 0.015). Normalized Pearson correlation coefficients were highly correlated with the normalized JPSTH diagonal averaged over the time window 300–600 ms after attention cue onset (Fig. 2C; regression analysis, p = 6.82 * 10−119). Spearman correlation coefficients were similarly correlated with the JPSTH diagonal values (data not shown; regression analysis, p = 3.89 * 10−80). We next tested whether firing correlations varied systematically as a function of the physical (3D) anatomical distance between cell pairs. We found that firing correlations tended to decrease with distance (regression analysis, p = 0.084), but that this trend was driven by neuron pairs recorded from nearby electrodes ∼500 μm apart (Fig. 3B). These nearby recordings were made with 125-μm-thick tungsten electrodes glued to each other with a 500 μm tip-to-tip distance and lowered within the same guide tube. Beyond the immediate ∼500 μm distance, there were no simple distance dependencies of firing correlations evident (p = 0.86).
Figure 3.

Firing correlations and their temporal and spatial specificity. A, Correlation of the average normalized firing rate (y-axis) plotted against the average normalized firing correlation of cell pairs within 800 ms after the attention cue onset. The average firing correlation corresponds to the coincident firing, ±25 ms, in Figure 2. The R2 and p values indicate the result of the regression analysis. B, Correlation of the physical 3D distance between cells and the strength of their correlated firing. Every data point represents one task-modulated cell pair plotted as the distance between the two cells against their firing correlation strength. Green dots indicate the average strength of synchronous firing for every 2 mm distance bin. The vertical rectangle on the left highlights the data points from cell pairs recorded from electrode tips that were ∼500 μm apart from each other (see Materials and Methods). The R2 and p values indicate regression analysis results. The inset shows a larger view of the average effect. The blue dotted line represents the mean distance across all task-modulated cell pairs. Please note that quantitatively similar results were obtained when 2D distances (based on a flattened map of the cortical sheet; for details, see Kaping et al., 2011) were used as distance estimates. C, The effect of the JPSTH smoothing kernel width on the average firing correlation strength. The window after the attention cue onset was split into two representative time windows: 0–300 ms after cue onset and 300–600 ms after cue onset, shown by the gray and black lines, respectively. The significantly increased firing correlation (Fig. 2A) in the late 300 ms after cue onset was evident for smoothing kernel widths ranging from 50 to 200 ms, but absent when smaller or larger smoothing was applied (*t test, p < 0.05). D, Adjacency matrices showing the firing correlations within 300–600 ms after the attention cue onset for all area combinations. Numbers within squares indicate the number of cell pairs for that respective area combination. Asterisks indicate firing correlations significantly different from zero. The top row shows alignment to attention cue onset, and the bottom row shows alignment to color cue onset. The left column shows results for all cell pairs, and the right column shows results for task-modulated cell pairs.
To provide an understanding of the overall effect size and distribution, single correlation coefficients in the JPSTHs of all cell pairs fell within a value range of −3.82 and 4.44, whereby 90% of the data points lay between −0.22 and 0.23. The average spike-train correlation coefficients ranged from −0.01 to 0.02 during the postcue period (Fig. 2B), with the average percentage change from before attention cue onset to the 300–600 ms after attention cue onset reaching 106%.
Temporal specificity of spike-train correlations
We next tested whether firing correlations in the ACC and PFC were specific to a time scale of 100 ms, or whether firing correlations were evident also with shorter or longer time windows. To test for this temporal specificity of functional correlations, we calculated for each neuron pair the coincidence line of the JPSTH computed over time windows of 25, 50, 100, 200, and 400 ms. To assess the influence of the smoothing, we extracted the average spike-train correlations within the first 300 and second 300 ms after attention cue onset (Fig. 3C). Within the second 300 ms, spike-train correlations calculated with smoothing kernels of 50, 100, and 200 ms were significantly larger than zero (t test, p ≤ 0.05), whereas the effect disappeared at 25 and 400 ms smoothing widths. A one-way ANOVA confirmed that spike-train correlations within the first and second 300 ms after attention cue onset were significantly different from each other (ANOVA, p ≤ 0.05).
To show nearly unsmoothed JPSTHs and to further demonstrate the temporal aspect of the spike-train correlations, we also computed JPSTHs with 10 ms time windows (5 ms Gaussian kernel; see Material and Methods). The single JPSTHs (Fig. 1D) and the average JPSTH and diagonal (Fig. 2E,F) show that spike-train correlations with this smoothing factor are highly variable and do not show the same consistency as when larger smoothing factors are applied.
Anatomical specificity of spike-train correlations
To quantify whether functional spike-train correlations were specific to neuron pairs from particular cortical subfields in the ACC/PFC, we localized their anatomical location to one of four subfields as delineated by Saleem et al. (2014) (Fig. 1B) and compared spike-train correlations for each area combination separately (see Materials and Methods). We sampled sufficient pairs between four subfields, with neurons located in any of three prefrontal cortex areas or in anterior cingulate cortex: lateral prefrontal cortex (area 46), dorsal prefrontal cortex (areas 8, 9), ventromedial prefrontal cortex (area 32), and the anterior cingulate cortex (area 24). Significant spike-train correlations were found for subsets of area combinations only. Significant spike-train correlations were evident for between-area cell pairs in ACC and dPFC (t test, p = 0.0405) and between-area cell pairs in vmPFC and dPFC (t test, p = 0.0395; Fig. 3D). These two between-area effects were found only in cell pairs in which both cells showed significant task modulation (see Materials and Methods). Increased spike-train correlations 300–600 ms after attention cue were also found within areas, for cell pairs in which both cells were located within dPFC (t test, p = 0.0036; Fig. 3D) and for cell pairs in which both cells were located within vmPFC (t test, p = 0.0012; Fig. 3D). These effects were not dependent on task modulation and became more pronounced when averaging over all cell pairs in the case of within-area dPFC cell pairs. These results show that spike-train correlations were largely restricted to specific cortical subfields at specific time windows in the ACC/PFC.
Correlated firing is maximal during the attention shift
We next were interested in whether spike-train correlations within the ACC and PFC are functionally tied to covert stimulus selection during the attention shift or whether they may characterize spike-train interactions even before the attention cue onset. We thus tested whether spike-train correlations were evident with all data aligned to the color onset (Fig. 1A). The only difference visually between the color onset and attention cue onset is the color of the attention cue, which instructs the attention shift. When we performed this analysis for task-modulated cell pairs, none of the area combinations tested showed significant firing correlations in the 200–500 ms after the color cue onset (Fig. 3D; t test, p > 0.05). When all cell pairs were considered, neurons within the ACC showed significant anticorrelation, an effect that was not observed within the attention cue period. Similar results were obtained when the analysis window for the color cue period contained the 0–300 ms period after color cue onset or the 300 ms immediately before attention cue onset. This suggests that the increase in correlated firing between cells in the ACC/PFC is specific to processes of stimulus selection and attention shifts. The transient nature of this effect is further confirmed by analyses that show no increase in spike-train correlations before the response event (data not shown).
Asymmetry of spike-train correlations
To investigate whether the firing of one neuron systematically leads or lags the spiking activity of another neuron, we computed an asymmetry index of the JPSTH (Paz et al., 2007). The AI quantifies whether spiking coincidences above versus below the coincidence line of the JPSTHs systematically differ (Fig. 4A). In the time window encompassing 800 ms following the attention cue, the AI was significantly different from zero for neuron pairs from the ACC–dPFC, indicating that spikes from neurons in the dPFC tended to precede spiking activity from neurons in the ACC (Fig. 4B,C; Wilcoxon signed rank test, p = 0.0114). This effect was reliably observed for smoothing time windows 25, 50, 100, and 200 ms in task-modulated cell pairs (Wilcoxon rank sum test, p = 0.0018, p = 0.0036, p = 0.0114, p = 0.0227, respectively) and for all smoothing time windows when all cell pairs were taken into account (Wilcoxon rank sum test, p = 0.0004, p = 0.0003, p = 0.0017, p = 0.0048, p = 0.0070, respectively). When considering only the fraction of the JPSTH within the time window 300–600 ms, this prior reliably significant effect was observed only for the 400 ms smoothing window (p = 0.0128) and as a trend for the 200 ms (p = 0.0803) smoothing window in task-modulated cell pairs, and for 200 ms (p = 0.0475) and 400 ms (p = 0.0049) smoothing when all cell pairs were taken into account.
Spike-train correlation of cell pairs with similar spatial attention preferences
To investigate whether synchronous firing contains relevant information for the attention shift, we asked whether spike-train correlations depended on the relative tuning preferences of individual neurons to increase their firing for contralateral or ipsilateral attention shifts. To this end, we classified neurons into those with firing increases for contralateral or ipsilateral attention shifts during the attentional shift epoch and compared the sign and strength of spike-train correlations among pairs with similar and dissimilar spatial attention preferences. Overall, we obtained three groups with 399 ipsilateral-preferring cell pairs, 598 contralateral-preferring cell pairs, and 918 mixed-preference cell pairs. We found that, on average, cell pairs in which both cells preferred an attention shift to the contralateral side were significantly more likely to show spike-train correlations within 0–800 ms following the attention cue than pairs in which both cells preferred an attention shift to the ipsilateral side (one-way ANOVA, p < 0.05; Tukey–Kramer test, p < 0.05; Fig. 5A). Ipsilateral-preferring cell pairs showed a trend for anticorrelated firing.
Figure 5.
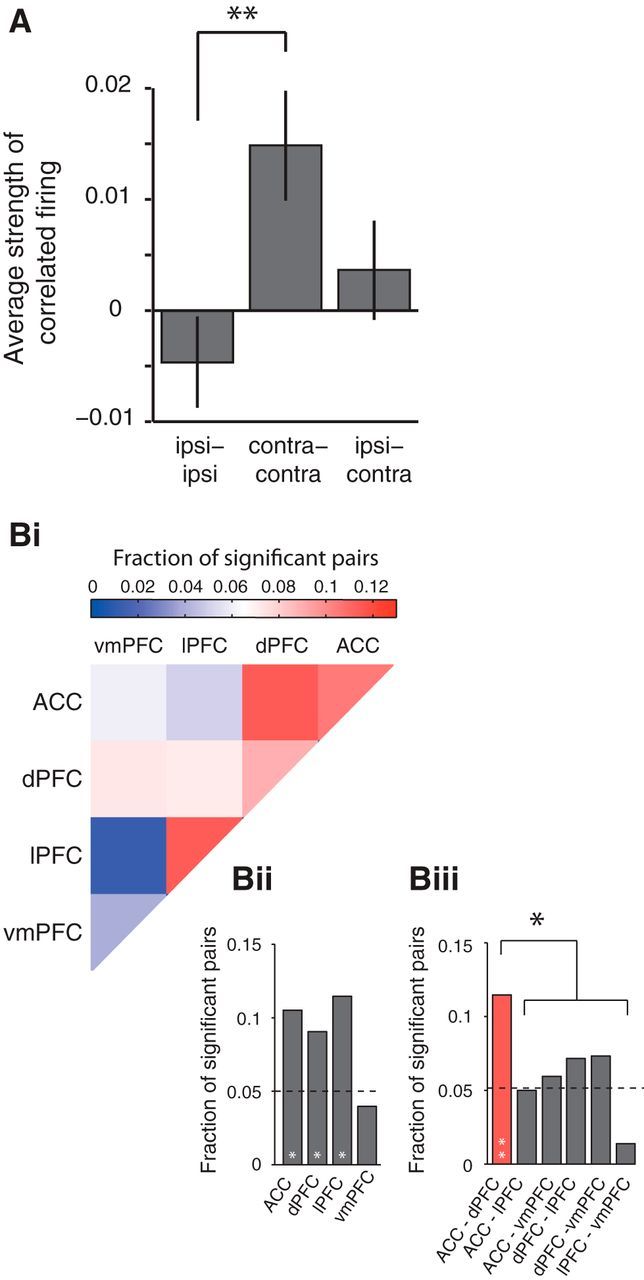
Firing correlations carry spatial attention information. A, Average correlation for cell pairs in which either both cells preferred ipsilateral attention shifts, both cells preferred contralateral attention shifts, or cells preferred opposite attention shifts (ipsi–contra). Error bars represent SEM. The asterisk indicates significant post hoc comparison with a Tukey–Kramer test (p ≤ 0.01). Bi–Biii, Fractions of cell pairs that have significantly differing firing correlations for ipsilateral versus contralateral attention shifts in the 800 ms following the attention cue onset, separated by area combination. Bi, Adjacency matrix highlighting the fraction of significant (p < 0.05, randomization statistic) cell pairs for each area combination. Bii and Biii show, for visualization purposes, the same data as Bi, separated for within- and between-area combinations. The black asterisk indicates significant difference from all other between-area combinations (χ2 test). White asterisks inside bars indicate significant difference from what would be expected by chance: *p < 0.05; **p < 0.001 (Binomial test).
The previous findings suggest that spike-train correlations carry information about the direction of the attention shift and may be functionally instrumental for attention. To test further whether this functionally meaningful correlation can be identified at the level of single cell pairs, we determined for every cell pair whether its firing correlation was significantly stronger for either contralateral or ipsilateral attention shifts as tested for significance using a randomized distribution (±2 SD). We then computed the fraction of significant cell pairs for each area combination separately (Fig. 5Bi–Biii). We found that cell pairs between the ACC and dPFC as well as within the ACC, dPFC, and lPFC had a significantly larger fraction of significant pairs than would be expected by chance (Binomial test, ACC-dPFC, p = 1.2 * 10−6; ACC, p = 0.003; dPFC, p = 0.001; lPFC, p = 0.023). We additionally found that ACC and dPFC pairs contained a significantly larger fraction of significant cell pairs compared to the average of all other between-area pairs (Fig. 5Biii; χ2, p < 0.05). In other words, cell pairs in the ACC and dPFC showed an increased selectivity for attention shifts to one of two possible spatial targets, compared to neurons from other between-area combinations.
Cell-type specificity of spike-train correlations
We next asked whether positive or negative spike-train correlations operating on the 100 ms time scale are differentially subserved by excitatory and inhibitory cell classes, respectively. Typically, the influence of excitation and inhibition on postsynaptic target cells is measured at shorter millisecond time scales (Reid and Alonso, 1995). In contrast to such effective connectivity measures, our analysis attempts to identify whether firing correlations can be traced back to slower (100 ms) interactions among excitatory neurons, and whether anticorrelated firing can be traced back to the influence of putative interneurons that may actively suppress their target neurons. To answer this question, we selected from the total population of recorded neurons those 404 neurons that were unambiguously recorded as single isolated neurons (see Materials and Methods; Shen et al., 2015). Figure 6A illustrates that the neuron population separated into NS cells and BS cells that corresponded to predominantly inhibitory interneurons (NS cells) and predominantly pyramidal cells (BS cells). Using the duration and time to repolarization of the action potential waveforms revealed a significantly bimodal distribution (p < 0.001, calibrated Hartigan's dip test for unimodality), with 21.6% (n = 86) NS cells and 74.4% (n = 296) BS cells (Fig. 6B,C; see Materials and Methods; Ardid et al., 2015). These proportions are similar to the 13–25% NS cells reported previously for the lateral prefrontal cortex (Constantinidis and Goldman-Rakic, 2002; Diester and Nieder, 2008; Johnston et al., 2009). The split into two cell classes allowed us to quantify the sign and strength of spike-train correlations separately for NS and BS cells and allowed us to test how isolated BS and NS cell firing related to the multiunit activity that is composed of mixtures of BS and NS cells (Fig. 6D). Figure 6E illustrates that significant spike-train correlations are evident across all pairs of BS cells and MUAs (p = 0.0002, Wilcoxon rank sum test, over all 631 pairs with at least one BS cell). In contrast, neuron pairs with one identified NS cell and MUA showed no significant correlation, but rather showed a trend for anticorrelated firing (Wilcoxon rank sum test, p = 0.066, n = 162 pairs; Fig. 6E). Neuron pairs with an identified BS cell and NS cells did not show significant spike-train correlations (Wilcoxon rank sum test, p = 0.68, n = 62 pairs; Fig. 6E).
The previous analysis suggests that functional firing rate correlations in the ACC/PFC can be traced back to single, isolated BS cells showing positive correlations with MUA activity. To test whether the sensitivity of our measure is sufficient to resolve correlations of single neurons located in different cortical fields, we performed the analysis only on between-area pairs. Intriguingly, we found that the spike trains of BS cells remained significantly correlated with MUA activity even when BS cells and MUA were recorded from different cortical fields (Fig. 6F; Wilcoxon rank sum test, p < 0.05, n = 342 BS–multiunit pairs). In addition, we found that the firing of isolated BS cells in one cortical field and the activity of NS cells in another cortical field were, on average, positively correlated (Fig. 6F; Wilcoxon rank sum test, p < 0.05, n = 34 BS–NS pairs). We did not find evidence for NS cells engaging significantly in anticorrelated firing with BS cells, MUA, or NS cells within or between specific cortical fields (data not shown).
Spike-train correlations are not related to expected reward magnitude
To assess whether the magnitude of the reward outcome associated with the target stimulus affected spike-train correlations, we compared trials with targets of high versus low reward outcome. We found no difference in the average main diagonal within the 300–600 ms after attention cue onset between the high and low outcome conditions for either task-modulated (t test, p = 0.481) or all cell combinations (t test, p = 0.274; data not shown). This suggests that reward outcome expectation was not a driving factor for the spike-train correlations following the attention cue onset.
Spike-train correlations show no apparent relation to the occurrence of burst firing
We showed previously that burst firing synchronized with distant local field potentials at narrow frequency bands (for details, see Womelsdorf et al., 2014a), raising the possibility that burst firing events may contribute to the correlation of firing rates between areas. We therefore tested whether the spike-train correlations observed here were related to the occurrence of burst firing. To this end, we extracted neuron pairs where either both or one of the neurons were recorded as SUA and extracted for each pair the proportion of burst to nonburst events. Larger proportions of burst firing would be expected to positively correlate with the strength of JPSTH correlations if burst firing played a prominent role underlying spike-train correlations. However, we found that the proportion of burst firing and the strength of spike-train correlations were not correlated for either neuron pairs in which both cells were recorded as SUA (n = 72; regression analysis, R2 = 0.009, p = 0.426) or neuron pairs in which only one cell was recorded as SUA (n = 893; regression analysis, R2 = 0.0004, p = 0.541). This finding suggests that the spike-train correlations were not apparently linked to mechanisms underlying burst firing.
Spike-train correlations show no apparent relation to LFP theta–gamma phase–amplitude correlations
A previous study using the local field potentials of the same data set used here found interareal interactions between the ACC and the lateral PFC in local field potential activity (Voloh et al., 2015). The study reported that attention cues are followed by (5–10 Hz) theta frequency phase modulations of the LFPs correlated with (35–55 Hz) gamma frequency amplitude modulations of LFPs between the ACC and prefrontal cortical areas (Voloh et al., 2015). We were thus interested in whether this attention-related phase–amplitude correlation of LFP activity is related to the interareal spike-train correlations. To test this, we extracted the LFPs of those electrode pairs that contributed neurons to the spike-train correlation analysis. We then calculated for each LFP pair the 5–10 Hz (theta) phase to 35–55 Hz (gamma) amplitude variation in the post–attention cue interval that was shown previously to have significant attention effects at the overall population level and across a large fraction of single LFP pairs (see Materials and Methods; Voloh et al., 2015). We then calculated correlation coefficients of the spike-train correlations in the 300–600 ms time window after cue onset and the strength of theta–gamma correlation in the postcue period, calculated as the modulation index (Tort et al., 2010), across all recording pairs. We found no correlations between these measures, either across the whole population of matched spike–spike and LFP–LFP pairs (p = 0.444, r = −0.019, n = 1597) or when restricting the analysis to LFP–LFP pairs that showed significant theta–gamma correlation at the single pair level (p = 0.506, r = −0.059, n = 128). In a second analysis, we correlated the normalized spike-train correlations with the change in theta–gamma LFP correlation from before to after the attention cue. Similar to the previous analysis, spike-train correlation and LFP cross-frequency pairs were not correlated across the whole population (p = 0.554, r = −0.015, n = 1597) or for the subset of LFP pairs with a significantly increased theta–gamma correlation (p = 0.860, r = 0.016, n = 128). These results quantify that spike-train correlations of neurons and LFP theta–gamma phase–amplitude correlations are largely independent phenomena, although interrelationships could be explored in more detail in future studies.
Discussion
We found that neurons in anterior cingulate and prefrontal cortices show functionally correlated spiking activity during covert stimulus selection. Using smoothed JPSTH analysis, we showed that task-modulated cell pairs showed correlated firing when spike trains were smoothed by 50–200 ms. Dynamic cross-correlations in this time window showed five major characteristics: First, they emerged independently of the absolute firing rate of neurons. Second, spike-train correlations were evident across cell classes. Putative pyramidal cells showed positive correlations with multiunit activity as well as with putative interneurons across area boundaries. Third, spike-train correlations were anatomically specific, becoming evident for only a subset of area combinations. The strongest correlations were found between cells in the ACC and dorsal PFC (areas 8 and 9). Fourth, spike-train correlations carried attention information as evident in cell pairs engaging in correlations when both cells preferred contralateral over ipsilateral attention shifts. Last, we found that firing events in dPFC tended to precede firing events in ACC, as shown in an average asymmetry of coincident firing. Together, these findings provide direct evidence for spike-train correlations between two main top-down control structures that bias and implement the selection of relevant target stimuli during goal-directed behavior.
Connectivity in frontocingulate cortex
The prefrontal and cingulate cortices are interconnected anatomically (Medalla and Barbas, 2009, 2010) as well as functionally (Tsujimoto et al., 2006, 2010; Cavanagh et al., 2009; Rothé et al., 2011; Voloh et al., 2015). However, most reports are not directly linked to attention shifts. Previously, we showed that, specifically in the time window of active deployment of attention, burst spiking in the ACC phase locked to LFPs in the PFC at beta- and gamma-band frequencies (Womelsdorf et al., 2014a). These data suggest substantial functional interactions between the ACC and PFC; with our study, we add to this by showing that single neurons correlate their firing in the ACC and PFC at a relatively slow 50–200 ms time scale during covert shifts of attention. This potentially identifies the neural basis of integrating relevant attention information in the frontocingulate network.
In our study, the dPFC emerged as a functional hub for cross-area communication during the attentional shift period. Neurons between the ACC and dPFC as well as between the vmPFC and dPFC synchronized their firing when attention was shifted. In addition, neurons within the dPFC strongly synchronized during this time (Fig. 3D). All these areas have been implicated previously in unique functional contributions during attentional control (Rowe and Passingham, 2001; Lebedev et al., 2004; Hayden et al., 2011; Kaping et al., 2011; Shenhav et al., 2013). An increased communication between the ACC and dPFC may reflect the integration of spatial information of the current target as well as the distracter. This is supported by our finding that many ACC–dPFC cell pairs show spatial selectivity in their firing (Fig. 5B). dPFC also showed spike-train correlations with vmPFC, which is likely relevant for the integration of value (here, “relevance”) information and target location, potentially allowing a successful shift of attention to the target independent of its value (Kaping et al., 2011; Rudorf and Hare, 2014). Generally, spatial information was prominently encoded in these cell–cell correlations, since neurons that encoded a contralateral attention shift were significantly more likely to engage in functional synchronization (Fig. 5A). Importantly, these cell–cell communications are specifically associated with the process of covertly shifting attention, as increases in correlated firing were not apparent after the color cue onset (Fig. 3D).
Time course of neuronal correlations in PFC/ACC
We observed the increase in spike-train correlations between cells across the PFC/ACC only when JPSTHs were smoothed with 50–200 ms windows, but not with smaller or larger windows (Figs. 1C,D, 3C). Functional correlations on faster time scales would suggest direct monosynaptic connections. However, the probability of those decreased significantly once neurons were separated by >200 μm (Fujisawa et al., 2008). The larger timescale that is necessary for our effect to be observed suggests that neuron pairs were not monosynaptically connected.
Furthermore, firing correlations between cells emerged ∼250–300 ms after the animal was cued to shift attention. This time course of interaction fits well with our and other reports showing that spatial attention information in PFC/ACC emerges at ∼300 ms after the appearance of the attention cue across the whole medial to lateral extent of the PFC (Rainer et al., 1998; Kaping et al., 2011; Suzuki and Gottlieb, 2013). This temporal coincidence suggests that attention information in the firing of ACC/PFC neurons translates into correlations for subsets of cells in the ACC and dPFC.
Asymmetry of firing correlations may indicate information flow from dPFC to ACC
The asymmetry index analysis revealed that firing events in the dPFC significantly preceded firing events in the ACC after attention cue onset (Fig. 4B,C). This suggests that when attention is covertly shifted, information that is shared or transferred between the ACC and dPFC appears earlier in the dPFC. This could reflect the transfer of cue-to-target mapping rule information from the dPFC to ACC. The attention shift is cued by the fixation point color, corresponding to two different rules. Previous studies showed that rule-specific information is encoded in the PFC (Wallis et al., 2001; Bongard and Nieder, 2010; Buschman et al., 2012) and also the ACC, where it lags behind the PFC for overlearned tasks and precedes the PFC during rapid adaption of task rules (Johnston et al., 2007; Womelsdorf et al., 2010). The precedence of spiking in the dPFC over the ACC in our study is consistent with these previous findings. We thus speculate that transfer of rule information from the PFC to ACC could enhance target selection and sustaining attentional focus in light of distracters (Kaping et al., 2011; Shenhav et al., 2013).
Interareal spike-train correlations are subserved by putative pyramidal cells and interneurons
We focused our analysis on functional correlations of neuronal spike trains at slow time scales. In this window, spike-train correlations may indicate polysynaptic (possibly dendritic) interactions of single cells with the local population of cells that can be indexed as multiunit responses. Consistent with this prediction, we could trace back significant spike-train correlation to mixed multiunit signals with a population of broad-spiking, putative pyramidal cells. Notably, this single cell-to-multiunit correlation was robust for interareal comparisons, providing quantitative evidence that the correlation of cells with net excitatory influence supports attention shifts (Fig. 6E). Horizontal connections between distant pyramidal cells may be the source of this net correlation (Pucak et al., 1996; González-Burgos et al., 2000). Potentially supporting recurrent activation, such connections have been proposed to play an important role during working memory delay activity (González-Burgos et al., 2000) and are particularly extensive in primate PFC (Elston, 2003; Elston et al., 2005). Together, these findings provide further insights into functional recruitments of cell classes during selective attentional processes (Ardid et al., 2015).
Processes underlying spike-train correlations
The correlations observed between cells across the PFC/ACC can conceptually result from different scenarios (Fig. 7). Correlated firing could be caused by recurrent activity in the network, whereby one area influences another, allowing communication of relevant attention information (Fig. 7A). Alternatively, spike-train correlations could be caused by a common third-party influence on two subareas in the PFC/ACC concurrently (Fig. 7B). These two scenarios are difficult to distinguish. In addition, several factors can contribute to increased dynamic cross-correlations. Excitability covariations, such as independent increases in the excitability of both cells as well as latency covariations, which are trial-to-trial covariations of spike timing, can also contribute to a peak in the JPSTH (Brody, 1999a, 1999b). Additionally, the covariation of stereotyped neuronal transients to external events can also induce a peak in the JPSTH (Friston, 1995; but see Vaadia et al., 1995a). Considering the slow time scale of the correlations we observe and the distance between neurons, monosynaptic connections can be ruled out as a major source (Fujisawa et al., 2008). Further supporting this reasoning, analysis of cross-correlations on a fast time scale (5 ms resolution) showed no apparent correlation linked to attention shifts (data not shown). In line with this, the observed spike-train correlations between ACC/PFC neurons may best be understood as excitability covariations of distant neurons. These could be caused by either direct recurrent activity (Fig. 7A) or by common input from a third area (Fig. 7B). Third-party input to both the ACC and PFC could be realized by several candidate mechanisms, including dopaminergic, cholinergic, and noradrenergic neuromodulation (Lapiz and Morilak, 2006; Fujisawa and Buzsáki, 2011; Hasselmo and Sarter, 2011; Sara and Bouret, 2012).
Figure 7.

Sources of correlated firing of cells pairs from different cortical fields in ACC and dorsal PFC. A, Correlated firing could be caused by recurrent activity in the network that communicates relevant attention information. B, Correlated firing could be caused by a third-party area that concurrently influences the ACC and PFC.
Conclusions
We found direct evidence that correlated activity between neurons across subfields of the frontocingulate cortex can carry relevant attention information. This effect is evident for neurons that encode similar spatial attention information in their firing rate modulations, whereby neurons encoding contralateral shifts engage in increased synchronization, whereas neurons encoding ipsilateral shifts engage in decreased synchronization. These correlations occurred on a slow, characteristic 50–200 ms time scale, suggesting that the transient single cell coupling is not driven by monosynaptic connections. Consistent with this, we traced back spike-train correlations to the population of broad-spiking, putative pyramidal cells. Together, these findings reveal that functional correlations of firing between neurons in the ACC and PFC support the interchange of goal-relevant information during attentional stimulus selection.
Footnotes
This work was supported by grants from the Canadian Institutes of Health Research, the Natural Sciences and Engineering Research Council of Canada, and the Ontario Ministry of Economic Development and Innovation (T.W.). The funders had no role in study design, data collection and analysis, the decision to publish, or the preparation of this manuscript. We thank Daniel Kaping, Johanna Stucke, Iman Janemi, and Michelle Bale for help with the electrophysiological recordings and reconstruction of recording sites.
References
- Aertsen AM, Gerstein GL, Habib MK, Palm G. Dynamics of neuronal firing correlation: modulation of “ effective connectivity.”. J Neurophysiol. 1989;61:900–917. doi: 10.1152/jn.1989.61.5.900. [DOI] [PubMed] [Google Scholar]
- Alexander WH, Brown JW. Medial prefrontal cortex as an action-outcome predictor. Nat Neurosci. 2011;14:1338–1344. doi: 10.1038/nn.2921. [DOI] [PMC free article] [PubMed] [Google Scholar]
- Ardid S, Vinck M, Kaping D, Marquez S, Everling S, Womelsdorf T. Mapping of functionally characterized cell classes onto canonical circuit operations in primate prefrontal cortex. J Neurosci. 2015;35:2975–2991. doi: 10.1523/JNEUROSCI.2700-14.2015. [DOI] [PMC free article] [PubMed] [Google Scholar]
- Barbas H, Zikopoulos B. The prefrontal cortex and flexible behavior. Neuroscientist. 2007;13:532–545. doi: 10.1177/1073858407301369. [DOI] [PMC free article] [PubMed] [Google Scholar]
- Bongard S, Nieder A. Basic mathematical rules are encoded by primate prefrontal cortex neurons. Proc Natl Acad Sci U S A. 2010;107:2277–2282. doi: 10.1073/pnas.0909180107. [DOI] [PMC free article] [PubMed] [Google Scholar]
- Brody CD. Correlations without synchrony. Neural Comput. 1999a;11:1537–1551. doi: 10.1162/089976699300016133. [DOI] [PubMed] [Google Scholar]
- Brody CD. Disambiguating different covariation types. Neural Comput. 1999b;11:1527–1535. doi: 10.1162/089976699300016124. [DOI] [PubMed] [Google Scholar]
- Buckley MJ, Mansouri FA, Hoda H, Mahboubi M, Browning PG, Kwok SC, Phillips A, Tanaka K. Dissociable components of rule-guided behavior depend on distinct medial and prefrontal regions. Science. 2009;325:52–58. doi: 10.1126/science.1172377. [DOI] [PubMed] [Google Scholar]
- Buschman TJ, Denovellis EL, Diogo C, Bullock D, Miller EK. Synchronous oscillatory neural ensembles for rules in the prefrontal cortex. Neuron. 2012;76:838–846. doi: 10.1016/j.neuron.2012.09.029. [DOI] [PMC free article] [PubMed] [Google Scholar]
- Cavanagh JF, Cohen MX, Allen JJ. Prelude to and resolution of an error: EEG phase synchrony reveals cognitive control dynamics during action monitoring. J Neurosci. 2009;29:98–105. doi: 10.1523/JNEUROSCI.4137-08.2009. [DOI] [PMC free article] [PubMed] [Google Scholar]
- Cohen JY, Crowder EA, Heitz RP, Subraveti CR, Thompson KG, Woodman GF, Schall JD. Cooperation and competition among frontal eye field neurons during visual target selection. J Neurosci. 2010;30:3227–3238. doi: 10.1523/JNEUROSCI.4600-09.2010. [DOI] [PMC free article] [PubMed] [Google Scholar]
- Constantinidis C, Goldman-Rakic PS. Correlated discharges among putative pyramidal neurons and interneurons in the primate prefrontal cortex. J Neurophysiol. 2002;88:3487–3497. doi: 10.1152/jn.00188.2002. [DOI] [PubMed] [Google Scholar]
- de la Rocha J, Doiron B, Shea-Brown E, Josić K, Reyes A. Correlation between neural spike trains increases with firing rate. Nature. 2007;448:802–806. doi: 10.1038/nature06028. [DOI] [PubMed] [Google Scholar]
- Diester I, Nieder A. Complementary contributions of prefrontal neuron classes in abstract numerical categorization. J Neurosci. 2008;28:7737–7747. doi: 10.1523/JNEUROSCI.1347-08.2008. [DOI] [PMC free article] [PubMed] [Google Scholar]
- Elston GN. The pyramidal neuron in occipital, temporal and prefrontal cortex of the owl monkey (Aotus trivirgatus): Regional specialization in cell structure. Eur J Neurosci. 2003;17:1313–1318. doi: 10.1046/j.1460-9568.2003.02552.x. [DOI] [PubMed] [Google Scholar]
- Elston GN, Benavides-Piccione R, Defelipe J. A study of pyramidal cell structure in the cingulate cortex of the macaque monkey with comparative notes on inferotemporal and primary visual cortex. Cereb Cortex. 2005;15:64–73. doi: 10.1093/cercor/bhh109. [DOI] [PubMed] [Google Scholar]
- Friston KJ. Neuronal transients. Proc Biol Sci. 1995;261:401–405. doi: 10.1098/rspb.1995.0166. [DOI] [PubMed] [Google Scholar]
- Fujisawa S, Buzsáki G. A 4 Hz oscillation adaptively synchronizes prefrontal, VTA, and hippocampal activities. Neuron. 2011;72:153–165. doi: 10.1016/j.neuron.2011.08.018. [DOI] [PMC free article] [PubMed] [Google Scholar]
- Fujisawa S, Amarasingham A, Harrison MT, Buzsáki G. Behavior-dependent short-term assembly dynamics in the medial prefrontal cortex. Nat Neurosci. 2008;11:823–833. doi: 10.1038/nn.2134. [DOI] [PMC free article] [PubMed] [Google Scholar]
- Genovesio A, Wise SP, Passingham RE. Prefrontal–parietal function: from foraging to foresight. Trends Cogn Sci. 2014;18:72–81. doi: 10.1016/j.tics.2013.11.007. [DOI] [PubMed] [Google Scholar]
- González-Burgos G, Barrionuevo G, Lewis DA. Horizontal synaptic connections in monkey prefrontal cortex: an in vitro electrophysiological study. Cereb Cortex. 2000;10:82–92. doi: 10.1093/cercor/10.1.82. [DOI] [PubMed] [Google Scholar]
- Hasselmo ME, Sarter M. Modes and models of forebrain cholinergic neuromodulation of cognition. Neuropsychopharmacology. 2011;36:52–73. doi: 10.1038/npp.2010.104. [DOI] [PMC free article] [PubMed] [Google Scholar]
- Hayden BY, Heilbronner SR, Pearson JM, Platt ML. Surprise signals in anterior cingulate cortex: neuronal encoding of unsigned reward prediction errors driving adjustment in behavior. J Neurosci. 2011;31:4178–4187. doi: 10.1523/JNEUROSCI.4652-10.2011. [DOI] [PMC free article] [PubMed] [Google Scholar]
- Johnston K, Levin HM, Koval MJ, Everling S. Top-down control-signal dynamics in anterior cingulate and prefrontal cortex neurons following task switching. Neuron. 2007;53:453–462. doi: 10.1016/j.neuron.2006.12.023. [DOI] [PubMed] [Google Scholar]
- Johnston K, DeSouza JF, Everling S. Monkey prefrontal cortical pyramidal and putative interneurons exhibit differential patterns of activity between prosaccade and antisaccade tasks. J Neurosci. 2009;29:5516–5524. doi: 10.1523/JNEUROSCI.5953-08.2009. [DOI] [PMC free article] [PubMed] [Google Scholar]
- Joshua M, Adler A, Prut Y, Vaadia E, Wickens JR, Bergman H. Synchronization of midbrain dopaminergic neurons is enhanced by rewarding events. Neuron. 2009;62:695–704. doi: 10.1016/j.neuron.2009.04.026. [DOI] [PubMed] [Google Scholar]
- Kaping D, Vinck M, Hutchison RM, Everling S, Womelsdorf T. Specific contributions of ventromedial, anterior cingulate, and lateral prefrontal cortex for attentional selection and stimulus valuation. PLoS Biol. 2011;9:e1001224. doi: 10.1371/journal.pbio.1001224. [DOI] [PMC free article] [PubMed] [Google Scholar]
- Kennerley SW, Behrens TE, Wallis JD. Double dissociation of value computations in orbitofrontal and anterior cingulate neurons. Nat Neurosci. 2011;14:1581–1589. doi: 10.1038/nn.2961. [DOI] [PMC free article] [PubMed] [Google Scholar]
- Kohn A, Smith MA. Stimulus dependence of neuronal correlation in primary visual cortex of the macaque. J Neurosci. 2005;25:3661–3673. doi: 10.1523/JNEUROSCI.5106-04.2005. [DOI] [PMC free article] [PubMed] [Google Scholar]
- Lapiz MD, Morilak DA. Noradrenergic modulation of cognitive function in rat medial prefrontal cortex as measured by attentional set shifting capability. Neuroscience. 2006;137:1039–1049. doi: 10.1016/j.neuroscience.2005.09.031. [DOI] [PubMed] [Google Scholar]
- Lebedev MA, Messinger A, Kralik JD, Wise SP. Representation of attended versus remembered locations in prefrontal cortex. PLoS Biol. 2004;2:e365. doi: 10.1371/journal.pbio.0020365. [DOI] [PMC free article] [PubMed] [Google Scholar]
- Medalla M, Barbas H. Synapses with inhibitory neurons differentiate anterior cingulate from dorsolateral prefrontal pathways associated with cognitive control. Neuron. 2009;61:609–620. doi: 10.1016/j.neuron.2009.01.006. [DOI] [PMC free article] [PubMed] [Google Scholar]
- Medalla M, Barbas H. Anterior cingulate synapses in prefrontal areas 10 and 46 suggest differential influence in cognitive control. J Neurosci. 2010;30:16068–16081. doi: 10.1523/JNEUROSCI.1773-10.2010. [DOI] [PMC free article] [PubMed] [Google Scholar]
- Miller EK, Buschman TJ. Cortical circuits for the control of attention. Curr Opin Neurobiol. 2012;23:216–222. doi: 10.1016/j.conb.2012.11.011. [DOI] [PMC free article] [PubMed] [Google Scholar]
- Passingham R, Wise SP. The neurobiology of the prefrontal cortex: anatomy, evolution, and the origin of insight. Oxford, UK: Oxford UP; 2012. [Google Scholar]
- Paz R, Bauer EP, Paré D. Learning-related facilitation of rhinal interactions by medial prefrontal inputs. J Neurosci. 2007;27:6542–6551. doi: 10.1523/JNEUROSCI.1077-07.2007. [DOI] [PMC free article] [PubMed] [Google Scholar]
- Petrides M, Pandya DN. Handbook of neuropsychology. Vol IX. Amsterdam: Elsevier; 1994. Dorsolateral prefrontal cortex: comparative cytoarchitectonic analysis in the human and macaque frontal cortex; pp. 17–58. [Google Scholar]
- Petrides M, Pandya DN. Dorsolateral prefrontal cortex: comparative cytoarchitectonic analysis in the human and the macaque brain and corticocortical connection patterns. Eur J Neurosci. 1999;11:1011–1036. doi: 10.1046/j.1460-9568.1999.00518.x. [DOI] [PubMed] [Google Scholar]
- Phillips JM, Vinck M, Everling S, Womelsdorf T. A long-range fronto-parietal 5- to 10-Hz network predicts “top-down” controlled guidance in a task-switch paradigm. Cereb Cortex. 2014;24:1996–2008. doi: 10.1093/cercor/bht050. [DOI] [PMC free article] [PubMed] [Google Scholar]
- Pucak ML, Levitt JB, Lund JS, Lewis DA. Patterns of intrinsic and associational circuitry in monkey prefrontal cortex. J Comp Neurol. 1996;376:614–630. doi: 10.1002/(SICI)1096-9861(19961223)376:4<614::AID-CNE9>3.0.CO;2-4. [DOI] [PubMed] [Google Scholar]
- Rainer G, Asaad WF, Miller EK. Selective representation of relevant information by neurons in the primate prefrontal cortex. Nature. 1998;393:577–579. doi: 10.1038/31235. [DOI] [PubMed] [Google Scholar]
- Reid RC, Alonso JM. Specificity of monosynaptic connections from thalamus to visual cortex. Nature. 1995;378:281–284. doi: 10.1038/378281a0. [DOI] [PubMed] [Google Scholar]
- Rosset A, Spadola L, Ratib O. OsiriX: an open-source software for navigating in multidimensional DICOM images. J Digit Imaging. 2004;17:205–216. doi: 10.1007/s10278-004-1014-6. [DOI] [PMC free article] [PubMed] [Google Scholar]
- Rothé M, Quilodran R, Sallet J, Procyk E. Coordination of high gamma activity in anterior cingulate and lateral prefrontal cortical areas during adaptation. J Neurosci. 2011;31:11110–11117. doi: 10.1523/JNEUROSCI.1016-11.2011. [DOI] [PMC free article] [PubMed] [Google Scholar]
- Rowe JB, Passingham RE. Working memory for location and time: activity in prefrontal area 46 relates to selection rather than maintenance in memory. Neuroimage. 2001;14:77–86. doi: 10.1006/nimg.2001.0784. [DOI] [PubMed] [Google Scholar]
- Rudorf S, Hare TA. Interactions between dorsolateral and ventromedial prefrontal cortex underlie context-dependent stimulus valuation in goal-directed choice. J Neurosci. 2014;34:15988–15996. doi: 10.1523/JNEUROSCI.3192-14.2014. [DOI] [PMC free article] [PubMed] [Google Scholar]
- Saleem KS, Kondo H, Price JL. Complementary circuits connecting the orbital and medial prefrontal networks with the temporal, insular, and opercular cortex in the macaque monkey. J Comp Neurol. 2008;506:659–693. doi: 10.1002/cne.21577. [DOI] [PubMed] [Google Scholar]
- Saleem KS, Miller B, Price JL. Subdivisions and connectional networks of the lateral prefrontal cortex in the macaque monkey. J Comp Neurol. 2014;522:1641–1690. doi: 10.1002/cne.23498. [DOI] [PubMed] [Google Scholar]
- Sallet J, Mars RB, Noonan MP, Neubert FX, Jbabdi S, O'Reilly JX, Filippini N, Thomas AG, Rushworth MF. The organization of dorsal frontal cortex in humans and macaques. J Neurosci. 2013;33:12255–12274. doi: 10.1523/JNEUROSCI.5108-12.2013. [DOI] [PMC free article] [PubMed] [Google Scholar]
- Sara SJ, Bouret S. Orienting and reorienting: the locus coeruleus mediates cognition through arousal. Neuron. 2012;76:130–141. doi: 10.1016/j.neuron.2012.09.011. [DOI] [PubMed] [Google Scholar]
- Schultz SR, Kitamura K, Post-Uiterweer A, Krupic J, Häusser M. Spatial pattern coding of sensory information by climbing fiber-evoked calcium signals in networks of neighboring cerebellar Purkinje cells. J Neurosci. 2009;29:8005–8015. doi: 10.1523/JNEUROSCI.4919-08.2009. [DOI] [PMC free article] [PubMed] [Google Scholar]
- Shen C, Ardid S, Kaping D, Westendorff S, Everling S, Womelsdorf T. Anterior cingulate cortex cells identify process-specific errors of attentional control prior to transient prefrontal-cingulate inhibition. Cereb Cortex. 2015;25:2213–2228. doi: 10.1093/cercor/bhu028. [DOI] [PMC free article] [PubMed] [Google Scholar]
- Shenhav A, Botvinick MM, Cohen JD. The expected value of control: an integrative theory of anterior cingulate cortex function. Neuron. 2013;79:217–240. doi: 10.1016/j.neuron.2013.07.007. [DOI] [PMC free article] [PubMed] [Google Scholar]
- Suzuki M, Gottlieb J. Distinct neural mechanisms of distractor suppression in the frontal and parietal lobe. Nat Neurosci. 2013;16:98–104. doi: 10.1038/nn.3282. [DOI] [PMC free article] [PubMed] [Google Scholar]
- Tort AB, Komorowski R, Eichenbaum H, Kopell N. Measuring phase-amplitude coupling between neuronal oscillations of different frequencies. J Neurophysiol. 2010;10:1195–1210. doi: 10.1152/jn.00106.2010. [DOI] [PMC free article] [PubMed] [Google Scholar]
- Tsujimoto T, Shimazu H, Isomura Y. Direct recording of theta oscillations in primate prefrontal and anterior cingulate cortices. J Neurophysiol. 2006;95:2987–3000. doi: 10.1152/jn.00730.2005. [DOI] [PubMed] [Google Scholar]
- Tsujimoto T, Shimazu H, Isomura Y, Sasaki K. Theta oscillations in primate prefrontal and anterior cingulate cortices in forewarned reaction time tasks. J Neurophysiol. 2010;103:827–843. doi: 10.1152/jn.00358.2009. [DOI] [PubMed] [Google Scholar]
- Vaadia E, Aertsen AM, Nelken I. “Dynamics of neuronal interactions” cannot be explained by “neuronal transients.”. Proc Biol Sci. 1995a;261:407–410. doi: 10.1098/rspb.1995.0167. [DOI] [PubMed] [Google Scholar]
- Vaadia E, Haalman I, Abeles M, Bergman H, Prut Y, Slovin H, Aertsen A. Dynamics of neuronal interactions in monkey cortex in relation to behavioural events. Nature. 1995b;373:515–518. doi: 10.1038/373515a0. [DOI] [PubMed] [Google Scholar]
- Van Essen DC. Windows on the brain: the emerging role of atlases and databases in neuroscience. Curr Opin Neurobiol. 2002;12:574–579. doi: 10.1016/s0959-4388(02)00361-6. [DOI] [PubMed] [Google Scholar]
- Voloh B, Valiante TA, Everling S, Womelsdorf T. Theta-gamma coordination between anterior cingulate and prefrontal cortex indexes correct attention shifts. Proc Natl Acad Sci U S A. 2015;112:8457–8462. doi: 10.1073/pnas.1500438112. [DOI] [PMC free article] [PubMed] [Google Scholar]
- Wallis JD, Anderson KC, Miller EK. Single neurons in prefrontal cortex encode abstract rules. Nature. 2001;411:953–956. doi: 10.1038/35082081. [DOI] [PubMed] [Google Scholar]
- Womelsdorf T, Vinck M, Leung LS, Everling S. Selective theta-synchronization of choice-relevant information subserves goal-directed behavior. Front Hum Neurosci. 2010;4:210. doi: 10.3389/fnhum.2010.00210. [DOI] [PMC free article] [PubMed] [Google Scholar]
- Womelsdorf T, Ardid S, Everling S, Valiante TA. Burst firing synchronizes prefrontal and anterior cingulate cortex during attentional control. Curr Biol. 2014a;24:2613–2621. doi: 10.1016/j.cub.2014.09.046. [DOI] [PubMed] [Google Scholar]
- Zhou X, Zhu D, Katsuki F, Qi XL, Lees CJ, Bennett AJ, Salinas E, Stanford TR, C, Constantinidis C. Age-dependent changes in prefrontal intrinsic connectivity. Proc Natl Acad Sci U S A. 2014;111:3853–3858. doi: 10.1073/pnas.1316594111. [DOI] [PMC free article] [PubMed] [Google Scholar]
- Zhuang KZ, Lebedev MA, Nicolelis MA. Joint cross-correlation analysis reveals complex, time-dependent functional relationship between cortical neurons and arm electromyograms. J Neurophysiol. 2014;112:2865–2887. doi: 10.1152/jn.00031.2013. [DOI] [PMC free article] [PubMed] [Google Scholar]