

Abstract
The endoplasmic reticulum (ER) plays crucial roles in intracellular Ca2+ signaling, serving as both a source and sink of Ca2+, and regulating a variety of physiological and pathophysiological events in neurons in the brain. However, spatiotemporal Ca2+ dynamics within the ER in central neurons remain to be characterized. In this study, we visualized synaptic activity-dependent ER Ca2+ dynamics in mouse cerebellar Purkinje cells (PCs) using an ER-targeted genetically encoded Ca2+ indicator, G-CEPIA1er. We used brief parallel fiber stimulation to induce a local decrease in the ER luminal Ca2+ concentration ([Ca2+]ER) in dendrites and spines. In this experimental system, the recovery of [Ca2+]ER takes several seconds, and recovery half-time depends on the extent of ER Ca2+ depletion. By combining imaging analysis and numerical simulation, we show that the intraluminal diffusion of Ca2+, rather than Ca2+ reuptake, is the dominant mechanism for the replenishment of the local [Ca2+]ER depletion immediately following the stimulation. In spines, the ER filled almost simultaneously with parent dendrites, suggesting that the ER within the spine neck does not represent a significant barrier to Ca2+ diffusion. Furthermore, we found that repetitive climbing fiber stimulation, which induces cytosolic Ca2+ spikes in PCs, cumulatively increased [Ca2+]ER. These results indicate that the neuronal ER functions both as an intracellular tunnel to redistribute stored Ca2+ within the neurons, and as a leaky integrator of Ca2+ spike-inducing synaptic inputs.
SIGNIFICANCE STATEMENT Ca2+ is a key messenger that regulates neuronal functions in the brain. Although the endoplasmic reticulum (ER) plays indispensable roles as a source and sink of Ca2+, technical difficulties have impeded the analysis of Ca2+ dynamics within the ER. In this study, we have used a genetically encoded ER Ca2+ indicator to visualize Ca2+ dynamics within the neuronal ER. We found that Ca2+-mobilizing synaptic inputs locally decreased the ER Ca2+ concentration, followed by Ca2+ replenishment by intraluminal Ca2+ diffusion throughout the ER of dendrites and spines. Furthermore, Ca2+ spike-inducing synaptic inputs cumulatively increased the Ca2+ content of the ER. Thus, our study indicates that the ER functions both as a tunnel to redistribute stored Ca2+ and as a leaky integrator of synaptic inputs.
Keywords: calcium; endoplasmic reticulum; inositol 1,4,5-trisphosphate; metabotropic glutamate receptor; Purkinje cell
Introduction
Understanding the dynamics and regulatory mechanisms of the endoplasmic reticulum (ER) luminal free Ca2+ concentration ([Ca2+]ER) is critical for understanding the function of the ER in neurons. In various types of cells, the ER is a major intracellular Ca2+ store and plays a crucial role in intracellular Ca2+ signaling, serving as both a source and a sink of Ca2+. In central neurons, synaptic inputs may evoke Ca2+ release from the ER through two types of Ca2+ release channels, inositol trisphosphate (IP3) receptors and ryanodine receptors, thereby regulating a variety of physiological and pathophysiological events (Berridge, 1998; Verkhratsky, 2005). As the driving force for Ca2+ mobilization, [Ca2+]ER is a critical factor for ER-mediated Ca2+ signaling. Although cell-wide depletion and replenishment of Ca2+ in the neuronal ER have been visualized previously (Fujiwara et al., 2001; Solovyova et al., 2002; Rodriguez-Garcia et al., 2014), the relationship between synaptic inputs and Ca2+ dynamics within the ER remains poorly understood. Previous studies (Brorson et al., 1991; Garaschuk et al., 1997; Finch and Augustine, 1998; Fiorillo and Williams, 1998; Stutzmann et al., 2003; Power and Sah, 2005; Hong and Ross, 2007; Hartmann et al., 2014) have shown that, in neurons, voltage-gated Ca2+ channels induce an influx of Ca2+ that subsequently enhances Ca2+ release. Although this priming effect is thought to increase the ER Ca2+ content by activating the sarcoplasmic/endoplasmic reticulum Ca2+-ATPase (SERCA), the actual Ca2+ concentration of the ER has not been directly examined, due in part to the lack of appropriate technologies for monitoring ER Ca2+ dynamics. This limitation represents a major obstacle in studying the function of the neuronal ER.
In earlier studies (Garaschuk et al., 1997), Ca2+ concentration within the ER could be estimated only by indirect measurement of changes in cytoplasmic Ca2+ concentration in response to activation of Ca2+ release from the ER. However, interpretation of such results has been inevitably complicated by changes in the Ca2+ mobilization mechanisms themselves, and has therefore prompted the development of technologies to directly measure Ca2+ dynamics in the ER. One such method is the use of small molecular Ca2+ indicators; however, difficulty in targeting them to the lumen of the ER has limited their application in intact neurons (Fujiwara et al., 2001; Solovyova et al., 2002). In contrast, genetically encoded Ca2+ indicators (GECIs) can be targeted to the ER by tagging with appropriate ER retention signals. This capability has been exploited to develop a variety of GECIs for the visualization of ER Ca2+ dynamics (Miyawaki et al., 1997; Palmer et al., 2004; Ishii et al., 2006; Tang et al., 2011; Bonora et al., 2013; Rodriguez-Garcia et al., 2014; Wu et al., 2014). To improve the spatiotemporal resolution of GECIs, we recently developed a series of calcium-measuring organelle-entrapped protein indicators (CEPIAs), which are GECIs that can provide high-resolution visualization of ER Ca2+ dynamics in various types of cells, including neurons (Suzuki et al., 2014).
In this study, we expressed the ER-targeted genetically encoded Ca2+ indicator G-CEPIA1er in mouse cerebellar Purkinje cells (PCs), which possess a well developed ER with a high density of IP3 receptors (Martone et al., 1993; Sharp et al., 1993). We then evoked synaptic inputs from parallel fibers (PFs) and climbing fibers (CFs), and observed how the ER network within the PCs responded to those inputs. Collectively, these ER Ca2+ visualization studies provide important new insights into synaptically evoked [Ca2+]ER dynamics.
Materials and Methods
Gene construction.
For PC-specific expression of G-CEPIA1er, we produced a Sindbis virus (Okubo et al., 2001, 2004; Suzuki et al., 2014). The pSinRep5 subcloning version of G-CEPIA1er was used as the template for in vitro transcription using SP6 RNA polymerase (Ambion). The RNA transcript and the helper RNA from DH(26S) cDNA template (Invitrogen) were cotransfected into BHK cells by electroporation. Twenty-four hours after transfection, the culture medium containing the infectious particles was harvested. Sindbis virus encoding G-GECO1.1 (Zhao et al., 2011) for the cytoplasmic Ca2+ measurement was also produced by the same procedure.
Infection of PCs and preparation of cerebellar slices.
All animal experiments were performed in accordance with the regulations and guidelines of the Institutional Animal Care and Use Committee at The University of Tokyo and were approved by the institutional review committees of the Graduate School of Medicine, University of Tokyo. Male C57BL/6 mice (postnatal day 21–27) were deeply anesthetized with pentobarbital, and the surface of cerebellar lobule 6 adjacent to the midline was exposed by removing the cranium and dura. The tip of a glass pipette was backfilled with the viral solution. The glass pipette was then inserted into the cerebellum, and 1 μl of viral solution was delivered at a rate of 200 nl/min using a micropump (Legato 130, KD Scientific). Twenty-three to 26 h after virus injection, parasagittal cerebellar slices (250 μm thickness) were prepared as described previously (Edwards et al., 1989). Slices were incubated in a holding chamber containing artificial CSF (ACSF) bubbled with 95% O2 and 5% CO2 at 35°C for 1 h and then returned to 23°C. ACSF for slicing and incubation contained the following (in mm): 125 NaCl, 2.5 KCl, 2 CaCl2, 1 MgSO4, 1.25 NaH2PO4, 26 NaHCO3, and 20 glucose.
Imaging.
Imaging was performed with a two-photon microscope (TSC MP5, Leica) that was equipped with a water-immersion objective (25×, numerical aperture, 0.95; HCS IR APO, Leica) and a Ti:sapphire laser (MaiTai DeepSee, Spectra Physics). Slices were transferred to a recording chamber under microscope, continuously perfused with ACSF bubbled with 95% O2 and 5% CO2, and supplemented with 10 μm bicuculline (Tocris Bioscience) to block spontaneous IPSCs. The excitation wavelength was 900–920 nm. Emitted fluorescence was filtered using an infrared-ray cutting filter, separated by a 560 nm dichroic mirror and detected with photomultiplier tubes. A 500–550 nm barrier filter and a 600 nm long-pass filter were used for the green and red channels, respectively. Data were acquired with time-lapse XY-scan mode (8–10 Hz for PF-induced responses and 1–2 Hz for CF-induced responses). For higher-frequency sampling, line-scan mode (200–400 Hz) was applied. For the focal stimulation of PFs, five square pulses (0.1 ms duration) were applied at 100 Hz through stimulation pipettes (3–6 μm tip diameter) filled with ACSF and placed just above the imaging field. The stimulation intensity was adjusted within 2–5 V to induce G-CEPIA1er responses confined within narrow dendritic segments (∼5–10 μm in diameter of detectable signals). During PF simulation with 2× intensity (i.e., 4–10 V), 2,3-dihydroxy-6-nitro-7-sulfonyl-benzo[f]quinoxaline (NBQX) was included in ACSF to avoid the excessive AMPAR-dependent Ca2+ influx and its possible effect on ER Ca2+ dynamics. For CF stimulation, square pulses (0.1 ms, 0–20 V) were applied at 1 Hz through stimulation pipettes placed on the granule cell layer adjacent to the soma of the PC of interest. For the local application of 3,5-dihydroxyphenylglycine (DHPG), DHPG was pressure ejected (1 mm, 50 ms, 10–30 psi) using a fine pipette (<1 μm tip diameter) placed 5–15 μm above the dendrite of G-GECO1.1-expressing PCs. Bicuculline, (S)-(+)-α-amino-4-carboxy-2-methylbenzeneacetic acid (LY367385), NBQX, cyclopiazonic acid (CPA), and DHPG were obtained from Tocris Bioscience. Drugs other than DHPG were dissolved in ACSF and administered through the perfusion system of the recording chamber. Experiments were performed at room temperature (RT; 22–24°C), unless otherwise stated.
Data analysis.
Data were analyzed using ImageJ software. Fluorescence intensities were corrected for background fluorescence by measuring a nonfluorescent area. When necessary, photobleaching was corrected using a linear fit to the fluorescence intensity change in nonstimulated area. The fractional change in fluorescence intensity from the basal level (ΔF/F0) was analyzed. The amplitude of PF-induced G-CEPIA1er responses was defined as the maximum decrease in ΔF/F0 after PF stimulation. The amplitude of CF-induced G-CEPIA1er responses was defined as the maximum increase in ΔF/F0 during 20 pulses of CF stimulation. The amplitude of DHPG-induced G-GECO1.1 responses was defined as the maximum increase in ΔF/F0. For the measurement of amplitude, time courses of ΔF/F0 were smoothed by a moving average with a five-frame window. The amplitude shown in Figure 2E is defined as the average of ΔF/F0 within the 1 s (for X-rhod-1) or 5 s (for G-CEPIA1er) time windows, starting from the end of PF stimulation. For the measurement of half recovery time (t1/2), the decay phase of PF-induced G-CEPIA1er response was fitted with the exponential function, including a linear component. The time point (with t = 0 set at the end of PF stimulation) at which ΔF/F0 recovered by half was calculated using the fitted function and measured amplitude. Time to peak was defined as the time between the end of PF stimulation and the point of maximum decrease in ΔF/F0, the location of which was determined after data smoothing using 5 data point moving average. To avoid overestimation of the time to peak, we discarded data if the ΔF/F0 trace had no recognizable trough at distal locations. To analyze the diffusional dynamics in PF-induced G-CEPIA1er responses, we manually determined the central point of the response by carefully inspecting the spatial distribution of ΔF/F0 1–2 s after PF stimulation. If responses covered more than one dendritic branch, the central points were set in each dendrite. Distance was measured along the skeletonized dendrites that consist of the manually delineated centerlines of dendrites.
Figure 2.
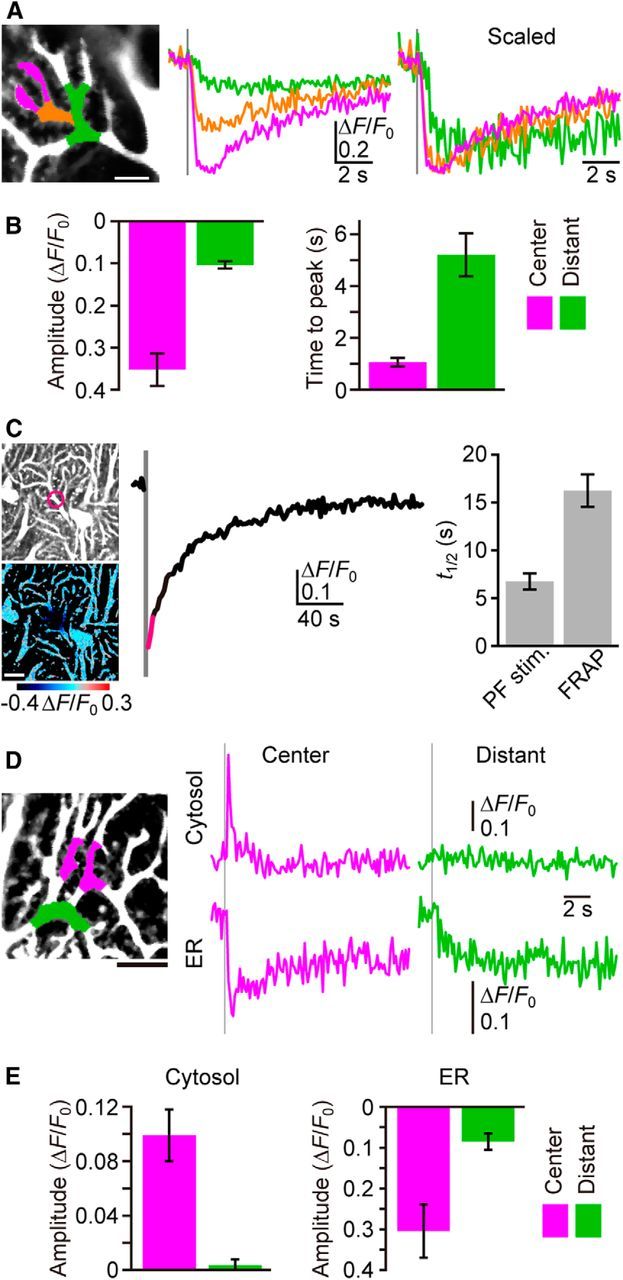
Lateral diffusion of Ca2+ within ER. A, Lateral diffusion of luminal Ca2+, as suggested by the wave-like propagation of the G-CEPIA1er response. Dendritic segments and corresponding ΔF/F0 traces upon PF inputs (five stimuli at 100 Hz, gray vertical line) were color coded (magenta, orange, and green). Scale bar, 5 μm. B, Summary of differences between the central and distant segment of PF-induced responses. Center (magenta) was defined as dendritic segments within 5 μm from the central point, and distant (green) was defined as segments >7 μm distal to the central point (for details, see Materials and Methods). n = 8 (mean ± SEM). C, Time course of ΔF/F0 within the dendritic segment (indicated by the circle in the left image) indicates the decrease in fluorescence upon photobleaching (gray vertical line) and the subsequent recovery (FRAP). The pseudo-color image that is the average of three consecutive frames (indicated as magenta in the time course of ΔF/F0) shows local fluorescence decrease. t1/2 upon PF inputs is indicated for comparison in the right bar graph. n = 10 (mean ± SEM). Scale bar, 10 μm. D, Cytosolic and ER Ca2+ dynamics visualized by introducing X-rhod-1 to the cytosol of G-CEPIA1er-expressing PCs. Time courses of ΔF/F0 for X-rhod-1 (cytosol) and G-CEPIA1er (ER) within the central segment (magenta) or the distant segment (green) upon PF inputs (five stimuli at 100 Hz, gray vertical line) are shown. NBQX (10 μm) was applied to isolate mGluR1-dependent responses. Scale bar, 10 μm. E, Summary of differences between the central and distant segments of PF-induced cytosolic and ER Ca2+ responses. Amplitude is defined as the average of ΔF/F0 within the 1 s (for cytosol) or 5 s (for ER) time window starting from the end of PF stimulation. n = 5 (mean ± SEM).
Fluorescence recovery after photobleaching (FRAP) experiments.
G-CEPIA1er was bleached by the illumination of an excitation laser (900–920 nm) within a 5-μm-diameter circle. Amplitude was defined as ΔF/F0 just after the end of photobleaching. For the measurement of t1/2, the recovery phase of G-CEPIA1er fluorescence was fitted with the exponential function, including a linear component. The time point (with t = 0 set at the end of photobleaching) at which ΔF/F0 recovered by half was calculated using the fitted function and measured amplitude.
Patch-clamp experiments.
Whole-cell patch-clamp experiments were performed for the simultaneous visualization of cytoplasmic Ca2+ concentration ([Ca2+]cyt) and [Ca2+]ER dynamics, and the recording of CF-induced EPSPs. The resistances of patch pipettes were 4–7 MΩ when filled with the intracellular solution containing the following (in mm): 130 K-gluconate, 4 MgCl2, 4 Na2ATP, 0.4 Na2GTP, 10 sodium phosphocreatine, 3 sodium l-ascorbate, and 10 HEPES, pH 7.3, adjusted with KOH. The intracellular solution also contained 0.1 mm X-rhod-1 (Anaspec) or 0.2 mm EGTA. For the simultaneous visualization of [Ca2+]cyt and [Ca2+]ER dynamics, X-rhod-1 was introduced to the cytoplasm of G-CEPIA1er-expressing PCs via patch pipettes. PCs were held at −60 to −70 mV with an EPC-9 patch-clamp amplifier (HEKA) using the voltage-clamp mode. NBQX was included in ACSF to isolate ER-mediated [Ca2+]cyt responses by inhibiting AMPAR-dependent Ca2+ influx. CF-induced EPSPs were recorded with an EPC-9 patch-clamp amplifier using the current-clamp mode. The intensity of CF stimulation pulses was set just above the threshold to induce CF-induced EPSPs, and the intensity just below the threshold was applied for nonspiking controls. The on-line data acquisition and off-line analysis of data were performed using PULSE software (HEKA).
Modeling of ER Ca2+ dynamics.
The time evolution of ER Ca2+ concentration after PF-induced local depletion was modeled by the following one-dimensional reaction–diffusion equation:
 |
The equation describes lateral diffusion of ER Ca2+ and SERCA-dependent Ca2+ uptake, and u (in μm), u0 (in μm), D (in μm2/s), and k (in s) denote ER Ca2+ concentration, basal ER Ca2+ concentration, the diffusion coefficient of Ca2+, and SERCA activity, respectively. The term k(u − u0) shows the contribution of ER Ca2+ leak channels and SERCA Ca2+ pumps. Since [Ca2+]cyt is nearly constant during the ER Ca2+ recovery phase (see Fig. 2D), SERCA activity, which depends on [Ca2+]cyt, was set to be constant in the model. Boundary conditions at the end of dendrites were chosen to be either Dirichlet (equal to basal concentration) or Neumann (zero flux) according to the actual dendrite geometry. Diffusion in a tube of abruptly changing diameter can be described by a one-dimensional diffusion equation with a constant diffusion coefficient (Berezhkovskii et al., 2009; Makhnovskii et al., 2010). Borrowing from this theory, we reduced the diffusion through the dendritic branching (see Fig. 3A) to one-dimensional diffusion with alternating diameter as follows. We aligned and merged branches along the distance from the central point of response, and let the merged segments possess the pump/leak coefficient (k) multiplied by the number of merged branches. The Ca2+ diffusion coefficient (D) was assumed to be constant throughout the one-dimensional structure. The simulated ER Ca2+ concentration u was converted to G-CEPIA1er fluorescence F using the following equation, which was described previously (Suzuki et al., 2014):
and was compared with experimental data. The following values from Suzuki et al. (2014) were used: The maximum fractional change in the fluorescence intensity (Fmax/Fmin) = 4.7, Kd = 672 μm, n = 1.95. For Figure 3A, the following values were selected to fit the model to the data: D = 8.4070, k = 0.0146, u0 = 995.6. These values were determined using an automated trial-and-error, parameter-optimizing program written in MATLAB version 8.3. The basal ER Ca2+ concentration (u0 = 995.6 μm) that we obtained was comparable to the resting [Ca2+]ER measured in other cell types in our recent study (Suzuki et al., 2014).
Figure 3.
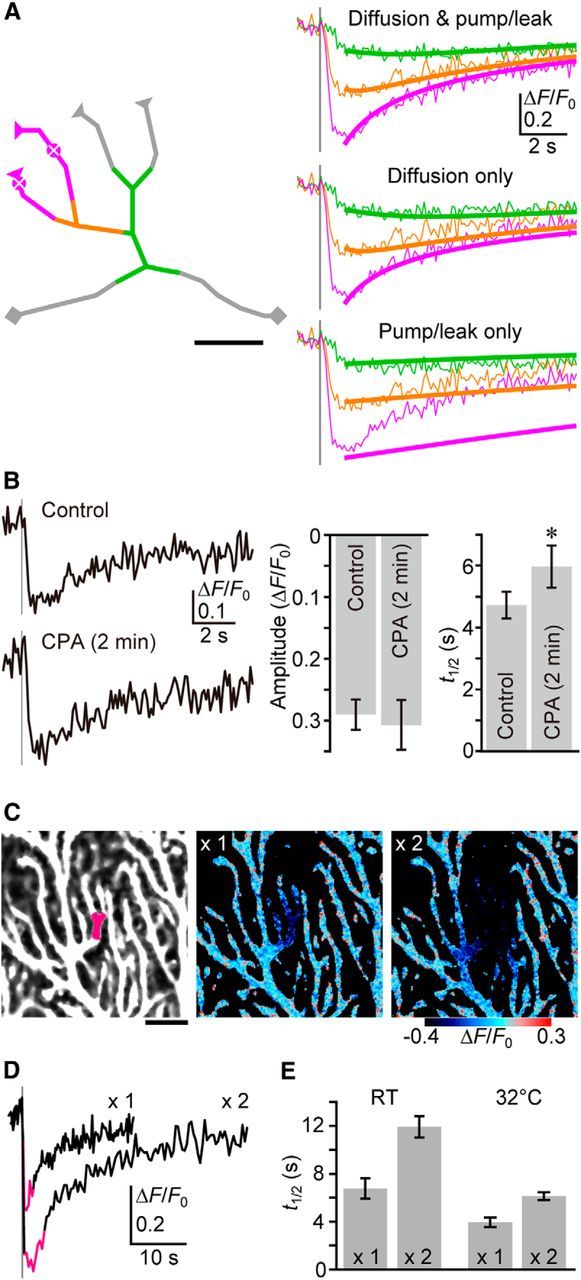
Contribution of intraluminal Ca2+ diffusion to ER refilling after PF inputs. A, Numerical simulation of ER Ca2+ dynamics during the refilling period. Left, The actual dendritic structure shown in Figure 2A was manually skeletonized, and reaction-diffusion modeling performed. The triangles on the terminals indicate the dead-end boundary, while the squares indicate the open-end boundary. Dendritic segments for the calculation of ΔF/F0 were indicated by colors, as in Figure 2A. The central points of response (the bottom points of the initial distribution of [Ca2+]ER) were marked. Scale bar, 5 μm. Right, The recovery phase of G-CEPIA1er response was fitted to the model. ΔF/F0 traces (thin lines) are color coded as for those shown in Figure 2A. The reaction-diffusion model faithfully reproduced the recovery time course in each dendritic segment (thick lines). The calculated effective diffusion coefficient of Ca2+ in ER lumen was 8.4 μm2/s. Simulated results for no diffusion and no pump/leak were produced by resetting the each coefficient to 0 after data fitting. For details, see Materials and Methods. B, The effect of short-term treatment with CPA (50 μm, 2 min) on the replenishment rate. Representative time courses of ΔF/F0 upon PF inputs (five stimuli at 100 Hz, gray vertical line), and the summarized bar graph for ΔF/F0 amplitude and t1/2 are shown. t1/2 is the time point at which ΔF/F0 recovered by half. n = 7 (mean ± SEM). *p = 0.00581, t test. C, The area of PF-induced [Ca2+]ER decrease was enlarged by a twofold increase of stimulation intensity (indicated as ×2). The pseudo-color images are the averages of 10 consecutive frames (indicated as magenta in ΔF/F0 traces in D). Scale bar, 10 μm. D, Representative time courses of ΔF/F0 within the dendritic segment (indicated by magenta in the top left image in C) upon PF inputs (five stimuli at 100 Hz, gray vertical line). E, The summarized bar graph for t1/2 under RT or 32°C. (n = 8 each, mean ± SEM).
Results
Visualizing synaptically evoked ER Ca2+ dynamics with G-CEPIA1er
We used Sindbis virus to express G-CEPIA1er in PCs and a two-photon microscope to image its expression in acute cerebellar slices, first focusing on dendrites (Fig. 1; see Fig. 4, data for spines). We observed G-CEPIA1er expression throughout dendrites and spines (Fig. 1A), which was consistent with earlier reports on the distribution pattern of the ER in PCs (Martone et al., 1993; Sharp et al., 1993). It has been well documented that PF inputs induce metabotropic glutamate receptor 1 (mGluR1)-IP3-mediated local Ca2+ release from the ER, which increases the [Ca2+]cyt in PC dendrites and spines (Finch and Augustine, 1998; Takechi et al., 1998; Okubo et al., 2004). Indeed, in response to focal PF stimulation with a physiologically relevant stimulation pattern (five pulses at 100 Hz), we observed a transient decrease in G-CEPIA1er fluorescence intensity in dendrites and spines confined within a narrow segment [Fig. 1B; preliminary observations were shown in our recent report (Suzuki et al., 2014)].
Figure 1.
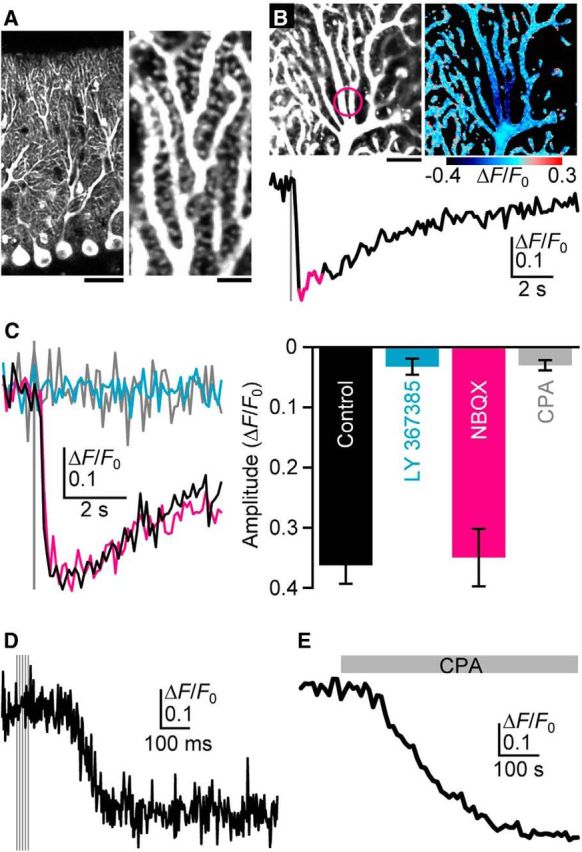
Visualization of PF-induced ER Ca2+ dynamics. A, G-CEPIA1er-expressing PCs in the cerebellar slice. Scale bars: left, 40 μm; right, 4 μm. B, Representative time course of mean ΔF/F0 values within the dendritic segment (indicated by the circle in the top left image) upon PF inputs (five stimuli at 100 Hz, gray vertical line) indicates PF-induced ER Ca2+ dynamics in PCs. The pseudo-color image represents the average of 10 consecutive frames (indicated as magenta in the time course of ΔF/F0). Scale bar, 10 μm. C, Pharmacological characterization of PF-induced ER Ca2+ dynamics. G-CEPIA1er responses upon PF inputs (five stimuli at 100 Hz, gray vertical line) in the control condition (black); in the presence of LY367385 (100 μm, cyan) or NBQX (10 μm, magenta); or after the depletion of ER with CPA (50 μm, gray) are shown. Amplitude is defined as the maximum decrease in ΔF/F0 within the 3 s time window after PF stimulation. n = 7–12 (mean ± SEM). D, High-frequency measurement of PF-induced G-CEPIA1er response. Time course of ΔF/F0 upon PF inputs (five stimuli at 100 Hz, gray vertical line) was measured by the line-scan imaging of the dendrite. E, CPA-induced ER depletion. The application of CPA (50 μm, gray) decreased G-CEPIA1er fluorescence with the ΔF/F0 amplitude of 0.43 ± 0.021 (mean ± SEM, n = 6).
Figure 4.

Simultaneous replenishment of Ca2+ in the ER of spines and parent dendrites. A, Kinetics of PF-induced responses compared between spines and their parent dendrites. Representative time courses of ΔF/F0 within the spine (indicated by the arrow in the left image) and its parent dendrite upon PF inputs (five stimuli at 100 Hz, gray vertical line) are shown. Scale bar, 2 μm. B, Summary of the ΔF/F0 amplitude, time to peak, and t1/2 in spines and their parent dendrites (n = 13 pairs, mean ± SEM).
We next pharmacologically manipulated the intracellular signaling mechanism involved in PF-induced ER Ca2+ dynamics. First, we showed that, as expected, the application of LY367385 (Fig. 1C, cyan), an mGluR1 antagonist, blocked the PF-induced G-CEPIA1er response that results from mGluR1-IP3-mediated Ca2+ mobilization at PF–PC synapses (Finch and Augustine, 1998; Takechi et al., 1998; Okubo et al., 2004). Furthermore, using highly resolved temporal measurements of the PF-induced G-CEPIA1er response, we demonstrated that immediately following PF stimulation, there was a ∼200 ms period of latency, which is consistent with previous observations of mGluR1-IP3-mediated cytoplasmic Ca2+ transients (Finch and Augustine, 1998; Takechi et al., 1998; Okubo et al., 2004; Fig. 1D). This result indicates that the Ca2+ dissociation kinetics of G-CEPIA1er is fast enough to follow the synaptically evoked [Ca2+]ER dynamics. In contrast, the application of NBQX (Fig. 1C, magenta), an AMPAR antagonist, had no effect on ER Ca2+ dynamics. On the other hand, the application of CPA, a SERCA inhibitor, induced slow depletion of ER Ca2+ (Fig. 1E), followed by abolishment of the G-CEPIA1er response to PF stimulation (Fig. 1C, gray). In conclusion, G-CEPIA1er enabled the visualization of ER Ca2+ dynamics confined to the vicinity of PF inputs in PCs, which allowed us to analyze the molecular mechanisms for refilling the ER with Ca2+, following synaptically evoked Ca2+ mobilization in neurons.
Lateral diffusion of Ca2+ within the ER
After Ca2+ is depleted cell wide throughout the ER, SERCA-dependent Ca2+ uptake is likely a crucial mechanism for refilling. However, as shown in Figure 1B, local decreases in [Ca2+]ER induced by PF inputs recovered far faster than recovery in cell-wide ER depletion experiments conducted on neurons (∼1 min; Garaschuk et al., 1997; Solovyova et al., 2002; Hartmann et al., 2014). Therefore, it is possible that the rapid refilling of ER Ca2+ following a PF input occurs through the diffusion of intraluminal Ca2+ from unstimulated segments to depleted segments of the ER, as suggested by studies in other cell types (Mogami et al., 1997; Choi et al., 2006; Petersen and Verkhratsky, 2007).
Using our newly developed ER Ca2+ imaging technology, we were able to directly examine the role of intraluminal Ca2+ diffusion in recovery. We divided dendrites into segments according to their distance from the PF stimulation input site, and compared the PF-induced [Ca2+]ER responses of each segment. The analysis showed that the responses became smaller in magnitude and slower in onset according to the distance of the segment from the input site, which is consistent with a diffusional mechanism (Fig. 2A,B). The observed [Ca2+]ER dynamics did not appear to be the result of the diffusion of G-CEPIA1er itself, because FRAP of G-CEPIA1er within narrow dendritic segments resulted in much slower t1/2 of fluorescence intensity than that of the Ca2+ signal after PF inputs (Fig. 2C).
Alternatively, the smaller and slower [Ca2+]ER dynamics in the distant dendritic segments can be explained if IP3 generated at the input site reaches the ER in the distant segments by diffusion through the cytosol to induce delayed release of Ca2+. To examine this possibility, we performed simultaneous cytosolic and ER Ca2+ imaging by introducing X-rhod-1, a red color Ca2+ indicator, to the cytosol of G-CEPIA1er-expressing PCs, using a patch pipette (Fig. 2D). We observed that immediately beneath the PF stimulation electrode, where [Ca2+]ER decreased rapidly, there was a transient increase in cytosolic Ca2+ (Fig. 2D,E). In the distant segments, however, the delayed decrease in [Ca2+]ER was not accompanied by a detectable increase in cytosolic Ca2+ (Fig. 2D,E). These results indicate that Ca2+ is not released from the ER in the distant segments, and argue against the alternative possibility that the diffusion of IP3 caused delayed [Ca2+]ER dynamics in the distant dendritic segments.
Diffusion-dependent ER refilling of Ca2+after PF-induced Ca2+ mobilization
To estimate the extent to which intraluminal Ca2+ diffusion contributes to the replenishment of Ca2+within the ER following local decreases in [Ca2+]ER, we performed numerical simulations of ER Ca2+ dynamics. Specifically, we modeled and solved a one-dimensional reaction-diffusion equation describing lateral diffusion of Ca2+ within the modeled dendritic structure, as well as Ca2+ pump-dependent Ca2+ uptake and leak from the ER to the cytosol (Fig. 3A). Data fitting using the equation faithfully reproduced the recovery dynamics of G-CEPIA1er fluorescence and indicated the effective diffusion coefficient of Ca2+ within the ER lumen to be 8.4 μm2/s (see Materials and Methods). We confirmed that lateral diffusion is critical by observing a significant slowing of [Ca2+]ER recovery at the central segment when no diffusion was allowed in the simulation (Fig. 3A, bottom). In contrast, we showed that Ca2+ uptake provides a relatively minor contribution by a simulation where Ca2+ pump and leak activity was not allowed (Fig. 3A, middle).
We next used CPA to experimentally validate the numerical simulations. After the application of CPA to G-CEPIA1er-expressing PCs, we observed a decrease in [Ca2+]ER after a short lag time (Fig. 1E), indicating that CPA acts by immediately inhibiting SERCA. Treating PCs with CPA for 2 min induced a small but significant decrease in G-CEPIA1er fluorescence [mean (±SEM) fractional decrease = 0.087 ± 0.019; n = 7], indicating that SERCA was inhibited by CPA within 2 min of application. We then measured the t1/2 of PF-induced G-CEPIA1er responses before and 2 min after CPA treatment. CPA treatment resulted in only a slight increase in t1/2 (Fig. 3B). These results are consistent with the prediction of our numerical simulation that there is a limited contribution of SERCA to Ca2+ replenishment of the ER following PF stimulation-induced Ca2+ release.
The numerical simulation also predicted that if luminal Ca2+ diffusion is the main source of Ca2+ replenishment, the refilling rate will depend on the spatial distribution of areas of decreased [Ca2+]ER, such that the larger the area of [Ca2+]ER decrease, the slower the rate of Ca2+ replenishment. In contrast, if the refilling mechanism is dominated by the activity of SERCA, the recovery rate will not depend on the amplitude and the spatial distribution of the areas of [Ca2+]ER decrease. To distinguish between these possibilities, we analyzed the relationship between the spatial distribution of areas of [Ca2+]ER decrease and the time course of recovery. We found that increasing the stimulation intensity by twofold resulted in increases in both the PF-induced Ca2+ depletion area and t1/2 (Fig. 3C–E). We also observed that under conditions of elevated temperature, which enhance the activity of SERCA, there was a delay in the recovery of [Ca2+]ER within the enlarged area of decreased [Ca2+]ER (Fig. 3E). These results are consistent with the importance of luminal Ca2+ diffusion in Ca2+ replenishment.
Simultaneous replenishment of ER Ca2+ in dendrites and spines
In neurons, spine necks represent major barriers for cytoplasmic Ca2+ diffusion (Svoboda et al., 1996; Majewska et al., 2000; Sabatini et al., 2002; Hernjak et al., 2005; Noguchi et al., 2005), which raises the possibility that diffusion-dependent refilling of ER is impaired in spines. To address this question, we compared ER Ca2+ dynamics between spines and their parent dendrites. We found that PF-induced G-CEPIA1er responses within the spines and their parent dendrites exhibited overlapping time courses (Fig. 4A). Moreover, following PF inputs, the dynamics of [Ca2+]ER decrease (amplitude and time to peak) did not differ between these two cellular compartments (Fig. 4B), which is consistent with previous observations that, upon PF inputs, there are similarities in [Ca2+]cyt transients in spines and dendrites (Finch and Augustine, 1998; Takechi et al., 1998). Furthermore, we observed no difference in the recovery rate (t1/2) between spines and their parent dendrites (Fig. 4B). It has been shown that SERCA does not accumulate within spines (Takei et al., 1992); thus, the simultaneous recovery we observed supports the notion that spine necks do not represent rate-limiting barriers for diffusion-dependent Ca2+ replenishment in the ER. Earlier studies (Harris and Stevens, 1988; Martone et al., 1993) have suggested that, instead, the critical rate-limiting structure for intraluminal diffusion dynamics is a narrow cross section of the ER tubule found throughout the dendrites and spines.
CF inputs load the ER with Ca2+
Previous studies have indicated that, in neurons, depolarization-induced Ca2+ influx can load the ER with Ca2+, thereby potentiating subsequent Ca2+ mobilization (Brorson et al., 1991; Garaschuk et al., 1997; Finch and Augustine, 1998; Fiorillo and Williams, 1998; Stutzmann et al., 2003; Power and Sah, 2005; Hong and Ross, 2007; Hartmann et al., 2014). However, these studies did not directly measure [Ca2+]ER. Furthermore, whether physiologically relevant Ca2+ influx can increase [Ca2+]ER is as yet unclear. CFs form strong synapses on PC dendrites in a one-to-one manner and induce large EPSPs followed by dendrite-wide Ca2+ spikes (Kitamura and Häusser, 2011). We found that repetitive CF stimulation using a physiologically relevant frequency (1 Hz) induced an accumulating increase in [Ca2+]ER throughout the dendrite (Fig. 5A, magenta), but not in the adjacent nonstimulated PC (Fig. 5A, green). We observed no significant difference in the CF-induced [Ca2+]ER elevation at different dendritic segments despite variations in CF-induced [Ca2+]cyt transients that have been observed along PC dendrites (Otsu et al., 2014). We further confirmed the involvement of CFs by observing that there was a strict correlation between [Ca2+]ER response and CF-EPSPs, in an all-or-none manner (Fig. 5B). CF-induced responses reached a plateau after 10–20 pulses of stimulation, likely because [Ca2+]ER reached a new equilibrium during the repetitive Ca2+ spikes (Fig. 5A). Elevated [Ca2+]ER levels returned to the basal level within a few minutes of the cessation of CF inputs, which is consistent with previous observations that the potentiating effect by the preceding depolarization lasted a few minutes (Brorson et al., 1991; Garaschuk et al., 1997; Stutzmann et al., 2003; Hong and Ross, 2007). Using cytoplasmic Ca2+ measurements, we confirmed that CF input trains, comprising 30 pulses at 1 Hz, enhanced subsequent mGluR1-mediated Ca2+ mobilization immediately after CF stimulation, but not 3 min after CF stimulation (Fig. 5C). This result is consistent with earlier studies showing that in PCs, depolarization potentiates the subsequent Ca2+ mobilization (Finch and Augustine, 1998; Hartmann et al., 2014). In this study, we observed both decreasing and increasing changes in the G-CEPIA1er fluorescence upon PF and CF inputs, suggesting that the basal [Ca2+]ER is comparable with the dissociation constant of G-CEPIA1er (672 μm; Suzuki et al., 2014).
Figure 5.
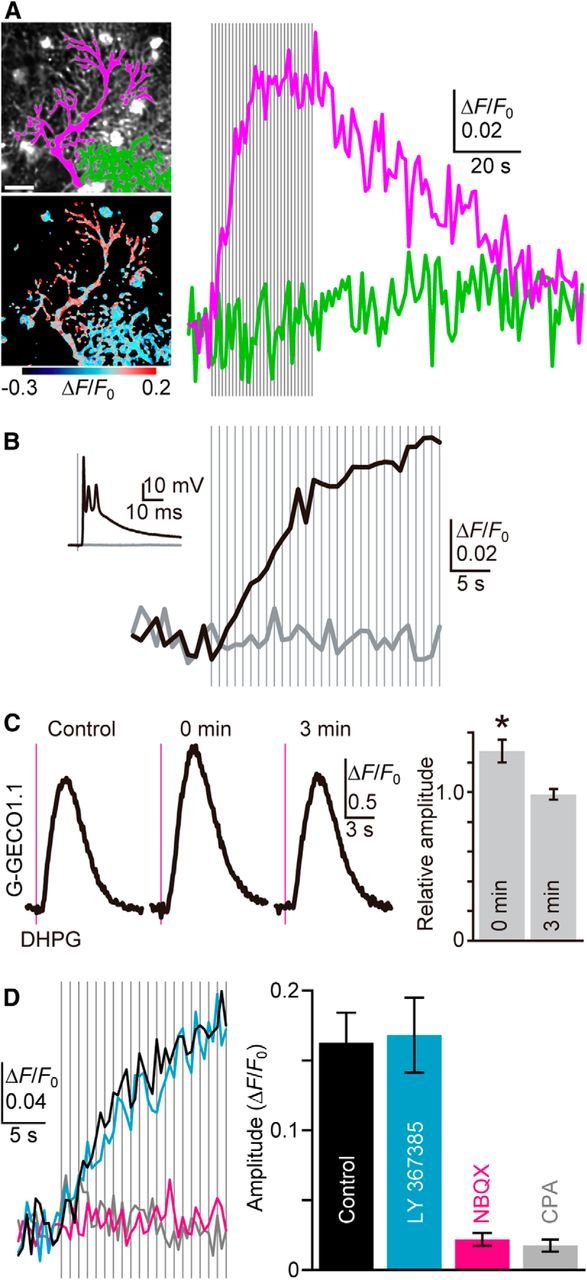
CF activity-induced ER Ca2+ overloading. A, Representative time courses of mean ΔF/F0 throughout the dendrite of a stimulated PC (magenta in the top image, magenta trace) and a nonstimulated neighboring PC (green in the top image, green trace) upon repetitive CF inputs (30 stimuli at 1 Hz, gray vertical lines) indicate CF-induced ER Ca2+ dynamics in PCs. The pseudo-color image shows the average of 20 consecutive frames during CF stimulation. Scale bar, 20 μm. B, CF stimulation (1 Hz, gray vertical lines) just above the threshold induced EPSP (black inset trace) and G-CEPIA1er response (black trace). In contrast, no EPSP (gray inset trace) and G-CEPIA1er responses (gray trace) were observed in the same PC upon stimulation just below the threshold. C, Cytoplasmic Ca2+ measurement with G-GECO1.1. Ca2+ mobilization was induced by pressure ejection of DHPG (1 mm, 50 ms, 10–30 psi, magenta vertical line), either 5–10 s (0 min) or 3 min after CF stimulation (30 pulses at 1 Hz). Representative time courses of ΔF/F0 indicate the transient enhancement of mGluR1-induced Ca2+ mobilization after CF stimulation. The summarized bar graph for the amplitude of the responses normalized by the amplitude of the control is shown. n = 7 (mean ± SEM). *p = 0.00559, t test. D, Pharmacological characterization of CF-induced ER Ca2+ dynamics. G-CEPIA1er responses upon CF inputs (1 Hz, gray vertical lines) in the control condition (black), or in the presence of LY367385 (100 μm, cyan), NBQX (10 μm, magenta), or CPA (50 μm, gray) are shown. Amplitude is defined as the maximum increase in ΔF/F0 during 20 pulses of CF stimulation. n = 6–13 (mean ± SEM).
Next, we used pharmacological agents to determine which intracellular components are involved in CF-induced ER Ca2+ dynamics. NBQX blocks AMPA receptors, which are the major charge carriers at the CF–PC synapses. Thus, as expected, we found that NBQX blocked the CF-induced G-CEPIA1er response (Fig. 5D, magenta). In contrast, LY367385, which is an inhibitor of mGluR1, had no effect (Fig. 5D, cyan). The inhibition of SERCA by CPA abolished the G-CEPIA1er response, indicating that CF-induced Ca2+ influx was followed by SERCA-dependent uptake of Ca2+ into the ER (Fig. 5D, gray). In conclusion, we successfully visualized CF-induced ER filling and found evidence strongly suggesting that one function of the ER is as a leaky integrator of CF inputs.
Discussion
In this study, we successfully used G-CEPIA1er to visualize synaptic activity-evoked ER Ca2+ dynamics in central neurons, and detected the crucial contribution of intraluminal Ca2+ diffusion to replenishment of ER Ca2+ after PF-induced local decreases in [Ca2+]ER. We also demonstrated the involvement of CF-evoked Ca2+ spikes in the loading of Ca2+ into the ER. These results indicate that the neuronal ER functions as an intracellular Ca2+ tunnel that redistributes stored Ca2+ throughout dendritic arborizations, and as a leaky integrator of synaptic input trains. Thus, the G-CEPIA1er-based visualization method that we developed has allowed us to obtain a comprehensive understanding of synaptically evoked Ca2+ flux within the ER lumen and across the ER membrane of PCs (Fig. 6).
Figure 6.

Schema of synaptically evoked Ca2+ flow in PCs. Schematic diagram showing Ca2+ flow in PCs upon PF and CF inputs. Ca2+ flow is mediated by channels, pumps, and diffusion. PF inputs induce local depletion of ER via mGluR1-IP3 signaling, which is followed by the replenishment by intraluminal Ca2+ diffusion. CF inputs induce AMPAR-dependent Ca2+ spikes, which are followed by SERCA-dependent uptake of Ca2+ into the ER. Ca2+ in the ER lumen is exchanged between regions of relatively low and high [Ca2+]ER. PMCA, Plasma membrane Ca2+ ATPase; NCX, Na+/Ca2+ exchanger; VGCC, voltage-gated Ca2+ channel.
ER functions as a Ca2+ tunnel
Spatially confined local cytosolic Ca2+ signals have been observed within dendritic arborizations in response to synaptic inputs. Such localized cytosolic Ca2+ transients are realized due to the high Ca2+ buffering power of the cytoplasm, which restricts the diffusion of Ca2+. In contrast, the ER comprises a Ca2+-containing intracellular network that has been proposed to function as a “Ca2+ tunnel” for the transport of intracellular Ca2+. The Ca2+ tunnel hypothesis has been previously tested under reduced experimental conditions, such as acutely isolated pancreatic acinar cells, cardiac myocytes, retinal photoreceptor cells, and dopamine neurons, in which [Ca2+]cyt or [Ca2+]ER is imaged after local application of either Ca2+ or Ca2+-releasing reagents using fine pipettes or caged Ca2+ compounds (Mogami et al., 1997; Park et al., 2000; Choi et al., 2006; Wu and Bers, 2006; Swietach et al., 2008; Picht et al., 2011; Chen et al., 2015). In the current study, we provide strong support for the Ca2+ tunnel hypothesis based on the imaging of PCs under physiologically relevant conditions. Our data indicate that in PCs, the ER functions as a continuous Ca2+ reservoir in which Ca2+ is exchanged between Ca2+-depleted and replete segments in response to repetitive PF inputs (Fig. 6).
Interestingly, we estimated that the effective Ca2+ diffusion coefficient within the ER along the dendrites (8.4 μm2/s) was two orders of magnitude lower than the value for free diffusion of Ca2+ in water (∼800 μm2/s). This disparity is probably due to conditions in the ER such as a high concentration of Ca2+-binding proteins (Pozzan et al., 1994), molecular crowding (Dayel et al., 1999), and the tortuosity of ER tubules (Harris and Stevens, 1988; Martone et al., 1993). It is noteworthy that the ER Ca2+ diffusion coefficient estimated in this study matches well with the value previously measured within the sarcoplasmic reticulum in cardiac myocytes (Swietach et al., 2008), although different values were reported by another group (Wu and Bers, 2006; Picht et al., 2011). According to our numerical simulation, despite the low Ca2+ diffusion coefficient within the ER, it still functions as an effective Ca2+ tunnel, due to the low Ca2+ pump and leak activities of the ER membrane. The ER Ca2+ diffusion coefficient that we estimated is comparable to or slightly lower than the value previously measured in the cytoplasmic extract (13 μm2/s; Allbritton et al., 1992). However, PF-induced cytosolic Ca2+ transients are more spatially confined than the corresponding decreases in [Ca2+]ER (Fig. 2D). The likely reason for the spatial restriction of the diffusion of cytosolic Ca2+ transients is that cytosolic Ca2+ is efficiently extruded through the plasma membrane. In line with this notion, studies have shown that, in terms of cytoplasmic Ca2+ clearance in central neurons, Ca2+ extrusion across the plasma membrane has a greater contribution than Ca2+ sequestration by SERCA (Fierro et al., 1998; Sabatini et al., 2002; Fig. 6).
ER as a memory of synaptic activity
The influx of Ca2+ across the plasma membrane is known to transiently potentiate subsequent Ca2+ release from stores within neurons (Brorson et al., 1991; Garaschuk et al., 1997; Stutzmann et al., 2003; Hong and Ross, 2007). Berridge (1998) hypothesized that this phenomenon is mediated by Ca2+ influx-dependent elevation of [Ca2+]ER, such that the ER functions as an integrator or “memory” of recent neuronal activities accompanying Ca2+ influx. In support of this hypothesis, we showed that 1 Hz CF inputs induce an accumulating increase in [Ca2+]ER, even though the decay of each CF stimulation-induced [Ca2+]cyt transient had a fast time course relative to the 1 s interval (Kitamura and Häusser, 2011). Furthermore, the elevated [Ca2+]ER lasted a few minutes after the cessation of CF inputs. Therefore, our data support the hypothesis that the ER of PCs can function as a leaky integrator, and the levels of [Ca2+]ER reflect the recent history of CF inputs. Because CFs spontaneously and persistently fire at ∼1 Hz in the cerebellum in vivo, the ER of PCs should be able to integrate CF-evoked Ca2+ spikes to persistently enhance SERCA-dependent filling mechanisms, even under basal conditions. Furthermore, since sensory inputs are known to evoke CF inputs, experience-dependent modulation of [Ca2+]ER may be possible.
Footnotes
This work was supported by grants from the Ministry of Education, Culture, Sports, Science and Technology, Japan; Takeda Science Foundation; and The Tokyo Society of Medical Sciences. We thank Y. Kawashima for technical assistance.
The authors declare no competing financial interests.
References
- Allbritton NL, Meyer T, Stryer L. Range of messenger action of calcium ion and inositol 1,4,5-trisphosphate. Science. 1992;258:1812–1815. doi: 10.1126/science.1465619. [DOI] [PubMed] [Google Scholar]
- Berezhkovskii AM, Barzykin AV, Zitserman VY. One-dimensional description of diffusion in a tube of abruptly changing diameter: boundary homogenization based approach. J Chem Phys. 2009;131:224110. doi: 10.1063/1.3271998. [DOI] [PMC free article] [PubMed] [Google Scholar]
- Berridge MJ. Neuronal calcium signaling. Neuron. 1998;21:13–26. doi: 10.1016/S0896-6273(00)80510-3. [DOI] [PubMed] [Google Scholar]
- Bonora M, Giorgi C, Bononi A, Marchi S, Patergnani S, Rimessi A, Rizzuto R, Pinton P. Subcellular calcium measurements in mammalian cells using jellyfish photoprotein aequorin-based probes. Nat Protoc. 2013;8:2105–2118. doi: 10.1038/nprot.2013.127. [DOI] [PubMed] [Google Scholar]
- Brorson JR, Bleakman D, Gibbons SJ, Miller RJ. The properties of intracellular calcium stores in cultured rat cerebellar neurons. J Neurosci. 1991;11:4024–4043. doi: 10.1523/JNEUROSCI.11-12-04024.1991. [DOI] [PMC free article] [PubMed] [Google Scholar]
- Chen M, Van Hook MJ, Thoreson WB. Ca2+ diffusion through endoplasmic reticulum supports elevated intraterminal Ca2+ levels needed to sustain synaptic release from rods in darkness. J Neurosci. 2015;35:11364–11373. doi: 10.1523/JNEUROSCI.0754-15.2015. [DOI] [PMC free article] [PubMed] [Google Scholar]
- Choi YM, Kim SH, Chung S, Uhm DY, Park MK. Regional interaction of endoplasmic reticulum Ca2+ signals between soma and dendrites through rapid luminal Ca2+ diffusion. J Neurosci. 2006;26:12127–12136. doi: 10.1523/JNEUROSCI.3158-06.2006. [DOI] [PMC free article] [PubMed] [Google Scholar]
- Dayel MJ, Hom EF, Verkman AS. Diffusion of green fluorescent protein in the aqueous-phase lumen of endoplasmic reticulum. Biophys J. 1999;76:2843–2851. doi: 10.1016/S0006-3495(99)77438-2. [DOI] [PMC free article] [PubMed] [Google Scholar]
- Edwards FA, Konnerth A, Sakmann B, Takahashi T. A thin slice preparation for patch clamp recordings from neurones of the mammalian central nervous system. Pflugers Arch. 1989;414:600–612. doi: 10.1007/BF00580998. [DOI] [PubMed] [Google Scholar]
- Fierro L, DiPolo R, Llano I. Intracellular calcium clearance in Purkinje cell somata from rat cerebellar slices. J Physiol. 1998;510:499–512. doi: 10.1111/j.1469-7793.1998.499bk.x. [DOI] [PMC free article] [PubMed] [Google Scholar]
- Finch EA, Augustine GJ. Local calcium signalling by inositol-1,4,5-trisphosphate in Purkinje cell dendrites. Nature. 1998;396:753–756. doi: 10.1038/25541. [DOI] [PubMed] [Google Scholar]
- Fiorillo CD, Williams JT. Glutamate mediates an inhibitory postsynaptic potential in dopamine neurons. Nature. 1998;394:78–82. doi: 10.1038/27919. [DOI] [PubMed] [Google Scholar]
- Fujiwara A, Hirose K, Yamazawa T, Iino M. Reduced IP3 sensitivity of IP3 receptor in Purkinje neurons. Neuroreport. 2001;12:2647–2651. doi: 10.1097/00001756-200108280-00012. [DOI] [PubMed] [Google Scholar]
- Garaschuk O, Yaari Y, Konnerth A. Release and sequestration of calcium by ryanodine-sensitive stores in rat hippocampal neurones. J Physiol. 1997;502:13–30. doi: 10.1111/j.1469-7793.1997.013bl.x. [DOI] [PMC free article] [PubMed] [Google Scholar]
- Harris KM, Stevens JK. Dendritic spines of rat cerebellar Purkinje cells: serial electron microscopy with reference to their biophysical characteristics. J Neurosci. 1988;8:4455–4469. doi: 10.1523/JNEUROSCI.08-12-04455.1988. [DOI] [PMC free article] [PubMed] [Google Scholar]
- Hartmann J, Karl RM, Alexander RP, Adelsberger H, Brill MS, Rühlmann C, Ansel A, Sakimura K, Baba Y, Kurosaki T, Misgeld T, Konnerth A. STIM1 controls neuronal Ca2+ signaling, mGluR1-dependent synaptic transmission, and cerebellar motor behavior. Neuron. 2014;82:635–644. doi: 10.1016/j.neuron.2014.03.027. [DOI] [PubMed] [Google Scholar]
- Hernjak N, Slepchenko BM, Fernald K, Fink CC, Fortin D, Moraru II, Watras J, Loew LM. Modeling and analysis of calcium signaling events leading to long-term depression in cerebellar Purkinje cells. Biophys J. 2005;89:3790–3806. doi: 10.1529/biophysj.105.065771. [DOI] [PMC free article] [PubMed] [Google Scholar]
- Hong M, Ross WN. Priming of intracellular calcium stores in rat CA1 pyramidal neurons. J Physiol. 2007;584:75–87. doi: 10.1113/jphysiol.2007.137661. [DOI] [PMC free article] [PubMed] [Google Scholar]
- Ishii K, Hirose K, Iino M. Ca2+ shuttling between endoplasmic reticulum and mitochondria underlying Ca2+ oscillations. EMBO Rep. 2006;7:390–396. doi: 10.1038/sj.embor.7400620. [DOI] [PMC free article] [PubMed] [Google Scholar]
- Kitamura K, Häusser M. Dendritic calcium signaling triggered by spontaneous and sensory-evoked climbing fiber input to cerebellar Purkinje cells in vivo. J Neurosci. 2011;31:10847–10858. doi: 10.1523/JNEUROSCI.2525-10.2011. [DOI] [PMC free article] [PubMed] [Google Scholar]
- Majewska A, Brown E, Ross J, Yuste R. Mechanisms of calcium decay kinetics in hippocampal spines: role of spine calcium pumps and calcium diffusion through the spine neck in biochemical compartmentalization. J Neurosci. 2000;20:1722–1734. doi: 10.1523/JNEUROSCI.20-05-01722.2000. [DOI] [PMC free article] [PubMed] [Google Scholar]
- Makhnovskii YA, Berezhkovskii AM, Zitserman VY. Diffusion in a tube of alternating diameter. Chem Phys. 2010;367:110–114. doi: 10.1016/j.chemphys.2009.11.005. [DOI] [PMC free article] [PubMed] [Google Scholar]
- Martone ME, Zhang Y, Simpliciano VM, Carragher BO, Ellisman MH. Three-dimensional visualization of the smooth endoplasmic reticulum in Purkinje cell dendrites. J Neurosci. 1993;13:4636–4646. doi: 10.1523/JNEUROSCI.13-11-04636.1993. [DOI] [PMC free article] [PubMed] [Google Scholar]
- Miyawaki A, Llopis J, Heim R, McCaffery JM, Adams JA, Ikura M, Tsien RY. Fluorescent indicators for Ca2+ based on green fluorescent proteins and calmodulin. Nature. 1997;388:882–887. doi: 10.1038/42264. [DOI] [PubMed] [Google Scholar]
- Mogami H, Nakano K, Tepikin AV, Petersen OH. Ca2+ flow via tunnels in polarized cells: recharging of apical Ca2+ stores by focal Ca2+ entry through basal membrane patch. Cell. 1997;88:49–55. doi: 10.1016/S0092-8674(00)81857-7. [DOI] [PubMed] [Google Scholar]
- Noguchi J, Matsuzaki M, Ellis-Davies GC, Kasai H. Spine-neck geometry determines NMDA receptor-dependent Ca2+ signaling in dendrites. Neuron. 2005;46:609–622. doi: 10.1016/j.neuron.2005.03.015. [DOI] [PMC free article] [PubMed] [Google Scholar]
- Okubo Y, Kakizawa S, Hirose K, Iino M. Visualization of IP3 dynamics reveals a novel AMPA receptor-triggered IP3 production pathway mediated by voltage-dependent Ca2+ influx in Purkinje cells. Neuron. 2001;32:113–122. doi: 10.1016/S0896-6273(01)00464-0. [DOI] [PubMed] [Google Scholar]
- Okubo Y, Kakizawa S, Hirose K, Iino M. Cross talk between metabotropic and ionotropic glutamate receptor-mediated signaling in parallel fiber-induced inositol 1,4,5-trisphosphate production in cerebellar Purkinje cells. J Neurosci. 2004;24:9513–9520. doi: 10.1523/JNEUROSCI.1829-04.2004. [DOI] [PMC free article] [PubMed] [Google Scholar]
- Otsu Y, Marcaggi P, Feltz A, Isope P, Kollo M, Nusser Z, Mathieu B, Kano M, Tsujita M, Sakimura K, Dieudonné S. Activity-dependent gating of calcium spikes by A-type K+ channels controls climbing fiber signaling in Purkinje cell dendrites. Neuron. 2014;84:137–151. doi: 10.1016/j.neuron.2014.08.035. [DOI] [PMC free article] [PubMed] [Google Scholar]
- Palmer AE, Jin C, Reed JC, Tsien RY. Bcl-2-mediated alterations in endoplasmic reticulum Ca2+ analyzed with an improved genetically encoded fluorescent sensor. Proc Natl Acad Sci U S A. 2004;101:17404–17409. doi: 10.1073/pnas.0408030101. [DOI] [PMC free article] [PubMed] [Google Scholar]
- Park MK, Petersen OH, Tepikin AV. The endoplasmic reticulum as one continuous Ca2+ pool: visualization of rapid Ca2+ movements and equilibration. EMBO J. 2000;19:5729–5739. doi: 10.1093/emboj/19.21.5729. [DOI] [PMC free article] [PubMed] [Google Scholar]
- Petersen OH, Verkhratsky A. Endoplasmic reticulum calcium tunnels integrate signalling in polarised cells. Cell Calcium. 2007;42:373–378. doi: 10.1016/j.ceca.2007.05.012. [DOI] [PubMed] [Google Scholar]
- Picht E, Zima AV, Shannon TR, Duncan AM, Blatter LA, Bers DM. Dynamic calcium movement inside cardiac sarcoplasmic reticulum during release. Circ Res. 2011;108:847–856. doi: 10.1161/CIRCRESAHA.111.240234. [DOI] [PMC free article] [PubMed] [Google Scholar]
- Power JM, Sah P. Intracellular calcium store filling by an L-type calcium current in the basolateral amygdala at subthreshold membrane potentials. J Physiol. 2005;562:439–453. doi: 10.1113/jphysiol.2004.076711. [DOI] [PMC free article] [PubMed] [Google Scholar]
- Pozzan T, Rizzuto R, Volpe P, Meldolesi J. Molecular and cellular physiology of intracellular calcium stores. Physiol Rev. 1994;74:595–636. doi: 10.1152/physrev.1994.74.3.595. [DOI] [PubMed] [Google Scholar]
- Rodriguez-Garcia A, Rojo-Ruiz J, Navas-Navarro P, Aulestia FJ, Gallego-Sandin S, Garcia-Sancho J, Alonso MT. GAP, an aequorin-based fluorescent indicator for imaging Ca2+ in organelles. Proc Natl Acad Sci U S A. 2014;111:2584–2589. doi: 10.1073/pnas.1316539111. [DOI] [PMC free article] [PubMed] [Google Scholar]
- Sabatini BL, Oertner TG, Svoboda K. The life cycle of Ca2+ ions in dendritic spines. Neuron. 2002;33:439–452. doi: 10.1016/S0896-6273(02)00573-1. [DOI] [PubMed] [Google Scholar]
- Sharp AH, McPherson PS, Dawson TM, Aoki C, Campbell KP, Snyder SH. Differential immunohistochemical localization of inositol 1,4,5-trisphosphate- and ryanodine-sensitive Ca2+ release channels in rat brain. J Neurosci. 1993;13:3051–3063. doi: 10.1523/JNEUROSCI.13-07-03051.1993. [DOI] [PMC free article] [PubMed] [Google Scholar]
- Solovyova N, Veselovsky N, Toescu EC, Verkhratsky A. Ca2+ dynamics in the lumen of the endoplasmic reticulum in sensory neurons: direct visualization of Ca2+-induced Ca2+ release triggered by physiological Ca2+ entry. EMBO J. 2002;21:622–630. doi: 10.1093/emboj/21.4.622. [DOI] [PMC free article] [PubMed] [Google Scholar]
- Stutzmann GE, LaFerla FM, Parker I. Ca2+ signaling in mouse cortical neurons studied by two-photon imaging and photoreleased inositol triphosphate. J Neurosci. 2003;23:758–765. doi: 10.1523/JNEUROSCI.23-03-00758.2003. [DOI] [PMC free article] [PubMed] [Google Scholar]
- Suzuki J, Kanemaru K, Ishii K, Ohkura M, Okubo Y, Iino M. Imaging intraorganellar Ca2+ at subcellular resolution using CEPIA. Nat Commun. 2014;5:4153. doi: 10.1038/ncomms5153. [DOI] [PMC free article] [PubMed] [Google Scholar]
- Svoboda K, Tank DW, Denk W. Direct measurement of coupling between dendritic spines and shafts. Science. 1996;272:716–719. doi: 10.1126/science.272.5262.716. [DOI] [PubMed] [Google Scholar]
- Swietach P, Spitzer KW, Vaughan-Jones RD. Ca2+-mobility in the sarcoplasmic reticulum of ventricular myocytes is low. Biophys J. 2008;95:1412–1427. doi: 10.1529/biophysj.108.130385. [DOI] [PMC free article] [PubMed] [Google Scholar]
- Takechi H, Eilers J, Konnerth A. A new class of synaptic response involving calcium release in dendritic spines. Nature. 1998;396:757–760. doi: 10.1038/25547. [DOI] [PubMed] [Google Scholar]
- Takei K, Stukenbrok H, Metcalf A, Mignery GA, Südhof TC, Volpe P, De Camilli P. Ca2+ stores in Purkinje neurons: endoplasmic reticulum subcompartments demonstrated by the heterogeneous distribution of the InsP3 receptor, Ca2+-ATPase, and calsequestrin. J Neurosci. 1992;12:489–505. doi: 10.1523/JNEUROSCI.12-02-00489.1992. [DOI] [PMC free article] [PubMed] [Google Scholar]
- Tang S, Wong HC, Wang ZM, Huang Y, Zou J, Zhuo Y, Pennati A, Gadda G, Delbono O, Yang JJ. Design and application of a class of sensors to monitor Ca2+ dynamics in high Ca2+ concentration cellular compartments. Proc Natl Acad Sci U S A. 2011;108:16265–16270. doi: 10.1073/pnas.1103015108. [DOI] [PMC free article] [PubMed] [Google Scholar]
- Verkhratsky A. Physiology and pathophysiology of the calcium store in the endoplasmic reticulum of neurons. Physiol Rev. 2005;85:201–279. doi: 10.1152/physrev.00004.2004. [DOI] [PubMed] [Google Scholar]
- Wu J, Prole DL, Shen Y, Lin Z, Gnanasekaran A, Liu Y, Chen L, Zhou H, Chen SR, Usachev YM, Taylor CW, Campbell RE. Red fluorescent genetically encoded Ca2+ indicators for use in mitochondria and endoplasmic reticulum. Biochem J. 2014;464:13–22. doi: 10.1042/BJ20140931. [DOI] [PMC free article] [PubMed] [Google Scholar]
- Wu X, Bers DM. Sarcoplasmic reticulum and nuclear envelope are one highly interconnected Ca2+ store throughout cardiac myocyte. Circ Res. 2006;99:283–291. doi: 10.1161/01.RES.0000233386.02708.72. [DOI] [PubMed] [Google Scholar]
- Zhao Y, Araki S, Wu J, Teramoto T, Chang YF, Nakano M, Abdelfattah AS, Fujiwara M, Ishihara T, Nagai T, Campbell RE. An expanded palette of genetically encoded Ca2+ indicators. Science. 2011;333:1888–1891. doi: 10.1126/science.1208592. [DOI] [PMC free article] [PubMed] [Google Scholar]