Abstract
The corticospinal (CS) tract is essential for voluntary movement, but what we know about the organization and development of the CS tract remains limited. To determine the total cortical area innervating the seventh cervical spinal cord segment (C7), which controls forelimb movement, we injected a retrograde tracer (fluorescent microspheres) into C7 such that it would spread widely within the unilateral gray matter (to >80%), but not to the CS tract. Subsequent detection of the tracer showed that, in both juvenile and adult mice, neurons distributed over an unexpectedly broad portion of the rostral two-thirds of the cerebral cortex converge to C7. This even included cortical areas controlling the hindlimbs (the fourth lumbar segment, L4). With aging, cell densities greatly declined, mainly due to axon branch elimination. Whole-cell recordings from spinal cord cells upon selective optogenetic stimulation of CS axons, and labeling of axons (DsRed) and presynaptic structures (synaptophysin) through cotransfection using exo utero electroporation, showed that overgrowing CS axons make synaptic connections with spinal cells in juveniles. This suggests that neuronal circuits involved in the CS tract to C7 are largely reorganized during development. By contrast, the cortical areas innervating L4 are limited to the conventional hindlimb area, and the cell distribution and density do not change during development. These findings call for an update of the traditional notion of somatotopic CS projection and imply that there are substantial developmental differences in the cortical control of forelimb and hindlimb movements, at least in rodents.
Keywords: channelrhodopsin2, corticospinal projection, development, synapse elimination, topography, transient synapse
Introduction
When considering the neural basis of voluntary movement, it is of fundamental importance to characterize the development and organization of the corticospinal (CS) tract (Kuypers, 1981; Porter and Lemon, 1993; Dum and Strick, 2004; Martin et al., 2009). But despite numerous studies, what we know about CS tract organization and development remains limited.
During development, overgrowth of axons from cell bodies distributed broadly in the cortex enter the CS tract (Stanfield et al., 1982; Bates and Killackey, 1984). As development progresses, however, many of these axons are eliminated (Stanfield et al., 1982; Bates and Killackey, 1984), and it is not yet clear whether those outgrowing axons enter the spinal gray matter and make synaptic contacts with spinal neurons (Stanfield, 1992). Several studies have shown that almost none of the ectopic axons enters the spinal gray matter (Joosten et al., 1987; Oudega et al., 1994). On the other hand, in the previous studies of the development of CS projections in rodents, we found that CS axons initially form synapses throughout the spinal gray matter (Ohno et al., 2004; Kamiyama et al., 2006; Maeda et al., 2007; Yoshioka et al., 2009), but those on the ventral side are largely eliminated in an NMDA- and GluN2B-dependent manner (Ohno et al., 2010). Many of these observations were made in vitro, however. Therefore, to confirm and further investigate the in vivo counterparts of these regressive events, we endeavored to map the total cortical area innervating the seventh cervical cord segment (C7), which is where our study has focused. For that purpose, we used a retrograde tracer taken up solely by nerve terminals (Katz et al., 1984; Katz and Iarovici, 1990) to determine the distribution of cerebral cortical neurons innervating C7 in mice.
CS projections are thought to be distributed somatotopically along the length of the spinal cord, although the representation may be coarse or fine. C7 is one of 34 segments of the mouse spinal cord and is a center of the cervical enlargement controlling the forelimbs. We therefore anticipated that the extent of the cortical area innervating C7 would be more or less limited in both juveniles and adults, reflecting the somatotopic organization of the motor cortex. However, our findings indicate that C7 is innervated by an unexpectedly large area of the cortex that even includes the conventional hindlimb area. Using optogenetic methods with channelrhodopsin-2 (ChR2) to selectively activate CS axons and a cotransfection–expression system that enabled us to label axons and presynaptic structures, we confirmed that CS axons make synaptic connections with spinal cells in juveniles, but the cell densities decline greatly as development progresses. By contrast, the area innervating the fourth lumbar cord segment (L4), a center of the lumbar enlargement controlling hindlimb movement, shows the expected limitation and was little changed during development. These findings indicate that there is substantial reorganization of cortical control of C7 spinal circuits during development and that there are marked developmental differences in the cortical control of forelimb and hindlimb movement.
Materials and Methods
All animal experiments were performed in accordance with the Ethics Committee Guidelines for Animal Experimentation, Teikyo University School of Medicine (No. 07-049), and the National Institutes of Health Guide for the Care and Use of Laboratory Animals (eighth edition of National Institutes of Health). All efforts were made to minimize animal suffering and the number of animals used.
Microsphere injection, fixation, and construction of distribution maps.
Juvenile [postnatal day 7 (P7), n = 54] and adult (P56, n = 60) ICR mice of both sexes were anesthetized with isoflurane and fixed on a stereotaxic apparatus (Narishige). Laminectomy was performed, and the dura was incised to expose the spinal cord. Microspheres (Retrobeads, Lumafluor) were injected into the spinal cord using a 10 μl Hamilton syringe fitted with a glass micropipette, the tip of which was beveled obliquely to a diameter of 50–80 μm. The injections were made in each segment, 300 and 500 μm lateral from the midline in juveniles, and 400 and 600 μm lateral in adults. The tip of the pipette was set 800 μm deep from the dorsal surface in juveniles and 900 μm deep in adults. At each site, 0.2 μl of microsphere solution was injected, after which the pipette tip was held at the injection site for 3 min before withdrawal. The wound was then closed with cyanoacrylate adhesive, and the pups were returned to their cage after waking up.
Two or 9 weeks after the injections, the microsphere-injected mice were deeply anesthetized with pentobarbital sodium (80 mg/kg body weight) and transcardially perfused with 20 ml of 10 mm PBS, pH 7.4, followed by the same volume of 4% PFA in 0.1 m sodium phosphate buffer, pH 7.4. The brains and spinal cords were then removed and immersed in the same fixative for 20 h at 4°C. After three washes with PBS, the brains and spinal cords were respectively cut into 100-μm-thick coronal and transverse serial sections using a Super Microslicer Zero 1 (Dosaka).
The spinal cord sections were examined under an ECLIPSE E800 fluorescence microscope (Nikon) using appropriate filter sets (EX 450–490, DM 505, BA 520 for green microspheres; EX 510–560, DM 575, BA 590 for red microspheres), and digital images were captured with a digital camera (DP72, Olympus) and saved in a TIFF format. Images of serial cortical sections were analyzed using a wide-field fluorescence microscope (DMI 6000B; Leica) equipped with a computer-operated and monitored stage. Z-stacks of fluorescent images were acquired and saved in a TIFF format using MetaMorph software (Molecular Devices). The locations of the fluorescently labeled cells in the sections were identified using ImageJ software (National Institutes of Health; http://rsb.info.nih.gov/ij/), after which the cell numbers were counted per 10,000 μm2 and mapped to the whole brain using Graph-R software.
Exo utero electroporation.
We used exo utero electroporation for introducing gene expression systems to a relatively wide target area of the cerebral cortex. Synaptophysin-EGFP (pBS-synaptophysin-EGFP) and DsRed expression vectors (pCAGGS-DsRed2) were cotransfected into embryonic day 12.5 (E12.5) ICR mouse embryos. The vectors were targeted into cortical areas that projected to C7 (rostral two-thirds) or L4 (caudomedial part) of the ipsilateral cortex by applying 4 rectangular pulses with a duration of 50 ms and an amplitude of 30 V at 150 ms intervals. The pups were then collected by caesarean section on E19.5 and were brought up by foster mothers. P0 animals were chosen for the experiment only if they showed DsRed expression that extended to areas that nearly entirely covered the C7 (see Fig. 2C) or L4 (see Fig. 7C) projection area, as judged from the intensity of fluorescence observed through the cranium using an epifluorescence microscope. Seven days (P7) or 14 d (P14) after caesarean section, the pups were transcardially perfused as described above, and the spinal cords were postfixed for 20 h at 4°C in the same fixative. After three washes with PBS, the spinal cords were cut into 50-μm-thick transverse sections using a Microslicer.
Figure 2.
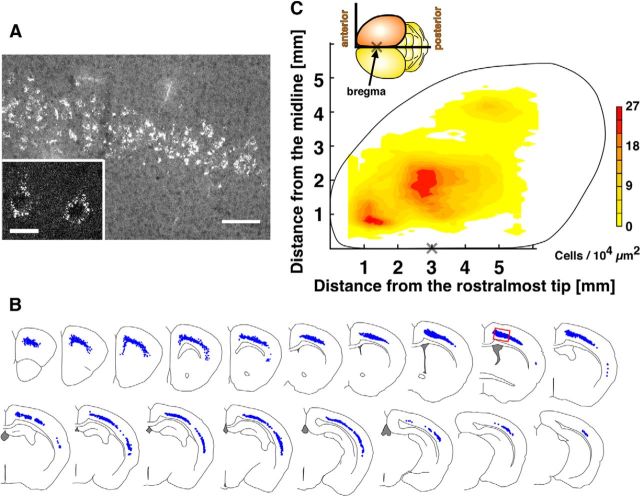
Retrograde labeling of CS neurons innervating C7 in the juvenile spinal cord. A, Cell bodies labeled with microspheres in the primary motor cortex. This image was captured from the area indicated in B (red rectangle). A, Inset, Magnified view of microsphere-labeled cortical neurons. Microspheres were mainly located in the cytoplasm of the cell bodies. B, Distribution of CS neurons in serial coronal sections from a mouse. C, Distribution map of CS neurons in the cerebral cortex generated using pooled data from 10 mice. “X” indicates the bregma point (3.0 ± 0.2 mm from the rostralmost tip, n = 4). The pseudocolor gradient indicates the cell density: abscissa indicate distance from the rostralmost tip of the brain; ordinate indicates distance from the midline (both in millimeters). Scale bars: A, 100 μm; A, inset, 20 μm.
Figure 7.
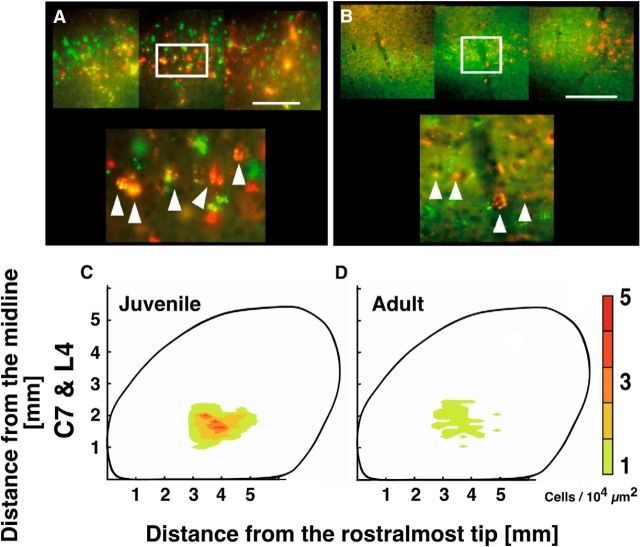
Neurons in layer 5 projecting to both the cervical and lumbar cord in juvenile and adult mice. A, B, Representative coronal images of C7-projecting (green) and L4-projecting (red) neurons in layer 5 in the juvenile (A) and adult (B) primary motor cortex. Double-labeled neurons (yellow; arrowheads) were observed in both groups. C, D, Distribution of C7- and L4-double-projecting neurons in the juvenile (C) and adult (D) brain. Each distribution map was made using data pooled from 5 mice. Scale bars: A, B, 200 μm.
Immunohistochemistry.
The sections were first incubated overnight with a mixture of chicken anti-GFP antibody (1:2500 dilution; Aves Laboratories) and rabbit anti-DsRed antibody (1:500 dilution; Clontech), and then overnight with a mixture of 8 μg/ml AlexaFluor-488-conjugated anti-chicken IgG (Invitrogen) and 8 μg/ml AlexaFluor-594-conjugated anti-rabbit IgG (Invitrogen). All incubations were performed at room temperature in PBS containing 0.3% Triton X-100 and 1% donkey serum (PBS-XD), followed by a rinse with PBS containing 0.3% Triton X-100 (PBS-X).
The labeled samples were examined under a confocal laser-scanning microscope (TCS-SP5; Leica) equipped with a laser providing 488 and 543 nm lines and with 515–560 nm and 615–700 nm emission prism windows. The confocal images were collected through a 40× dry objective (Olympus LUMPlan FL, NA = 1.0) with a zoom factor of 3.
To immunostain Fezf2-positive cells, 50-μm-thick brain sections obtained from 12 mice on P14, P21, P56, and P70 (three mice at each age) were incubated overnight with anti-Fezf2 antibody (1:50 dilution; Immuno-Biological Laboratories) in PBS-XD. After several washes in PBS-X, the sections were incubated for 2 h with biotin-conjugated donkey anti-rabbit IgG (Jackson ImmunoResearch Laboratories) in PBS-XD, followed by a rinse with PBS-X. The sections were then incubated for 2 h with avidin-biotinylated peroxidase complex (1:100 dilution; ABC-Elite; Vector Laboratories) in PBS-X. After another rinse with PBS, bound peroxidase was visualized by incubating the sections with 0.02% (w/v) DAB (Dojindo) and 0.0002% (v/v) hydrogen peroxide in 50 mm Tris-HCl, pH 7.6, for 40–60 min. The sections were then thoroughly washed in PBS, mounted on APS coated glass slides, air dried, dehydrated in an ethanol series, cleared in xylene, and coverslipped. All the incubations were performed at room temperature. Digital images were taken using an Olympus DP72 digital camera and saved in a TIFF format.
Virus production, injection, and visualization of YFP-positive axons.
A plasmid vector encoding hChR2 fused to EYFP [pAAV-CaMKIIa-hChR2(H134R)-EYFP] was a kind gift from Dr. Deisseroth (Stanford University, Stanford, CA). Replication-incompetent adeno-associated virus (AAV) serotype 1 vectors were produced in an adenovirus-free system using the three-plasmid cotransfection method and then purified using two sequential continuous CsCl gradients. The final particle titers were 4.8 × 10⁹ vector genomes (vg)/ml. The virus solution (0.3 μl) was stereotaxically injected into the motor area of the left cortex on P0 using the following coordinates: 1.0 mm lateral, 2.0 mm anterior to λ and 0.5 mm below the skin surface.
To confirm ChR2-EYFP expression in the cerebral cortex and spinal cord, AAV-injected mice (P7) were transcardially perfused as described above, and the spinal cords were postfixed for 20 h at 4°C in the same fixative. After three washes with PBS, the cortices and spinal cords were cut into 50-μm-thick transverse sections using a Microslicer. Several of the spinal sections were incubated overnight first with chicken anti-GFP antibody (1:2500 dilution) and then with a mixture of 8 μg/ml AlexaFluor-488-conjugated anti-chicken IgG (Invitrogen).
Photoactivation and whole-cell recording.
Transverse slices (400 μm thick) of spinal cord at C7 from P7-P10 mice or at L4 from P14-P16 mice were prepared at 4°C using chilled cutting solution (in mm as follows: 234.0 sucrose, 2.5 KCl, 1.25 NaH2PO4, 10 MgSO4, 0.5 CaCl2, 26.0 NaHCO3, and 11.0 glucose) and then incubated in artificial CSF (in mm as follows: 119.0 NaCl, 2.5 KCl, 2.5 CaCl2, 1.3 MgCl2, 20.0 glucose) for at least 45 min at room temperature. The solutions were continuously bubbled with a mixture of 95% O2 and 5% CO2. To photoactivate ChR2-expressing CS axons, light from a blue LED (465 nm, LEX2-B, Brainvision) controlled by a stimulator (SEN-7203, Nihon Kohden) was guided into a 0.5 mm optical fiber (Edmund Optics Japan) positioned with a micromanipulator such that the power density of the LED light was 8.9 mW/mm2 at the slice surface. Stimulus frequencies were 0.1 or 0.05 Hz. Whole-cell patch recordings were made from spinal neurons at room temperature. Patch electrodes were filled with internal solution (in mm as follows: 140.0 CsCl, 10.0 HEPES, 10.0 EGTA, 2.0 MgCl2, 2.0 Na2ATP, pH 7.2) and had resistances of 6–12 mΩ. The membrane potential was clamped at −90 mV for recording EPSCs. Cells with series resistances >40 mΩ were excluded from our analysis. In addition, at the end of the recordings in the current-clamp mode, we confirmed that action potentials were generated upon injection of depolarizing current.
For pharmacological experiments, an AMPA receptor antagonist (5 μm NBQX; Sigma), a glycine receptor antagonist (2 μm strychnine; Acros Organics), and/or a GABAA receptor antagonist (10 μm bicuculline; Wako) were bath-applied.
Results
To investigate the distribution of cerebral cortical neurons projecting to a single cervical spinal segment in P7 mice, we injected the C7 gray matter of juvenile mice with fluorescent latex microspheres (Fig. 1), which show clearly delineated injection sites and are taken up solely by nerve terminals and transported retrogradely (Katz et al., 1984; Katz and Iarovici, 1990). Two weeks after injection (P21), the mice were perfusion fixed and serial spinal cord and cortical sections were prepared. For this analysis, we carefully selected animals in which the rostrocaudal spread of injected microspheres was restricted to C7 (Fig. 1B), and the transverse spread was to >80% of the gray matter, but not to the ventralmost dorsal column, where the CS tract is located in rodents (Fig. 1D).
Figure 1.
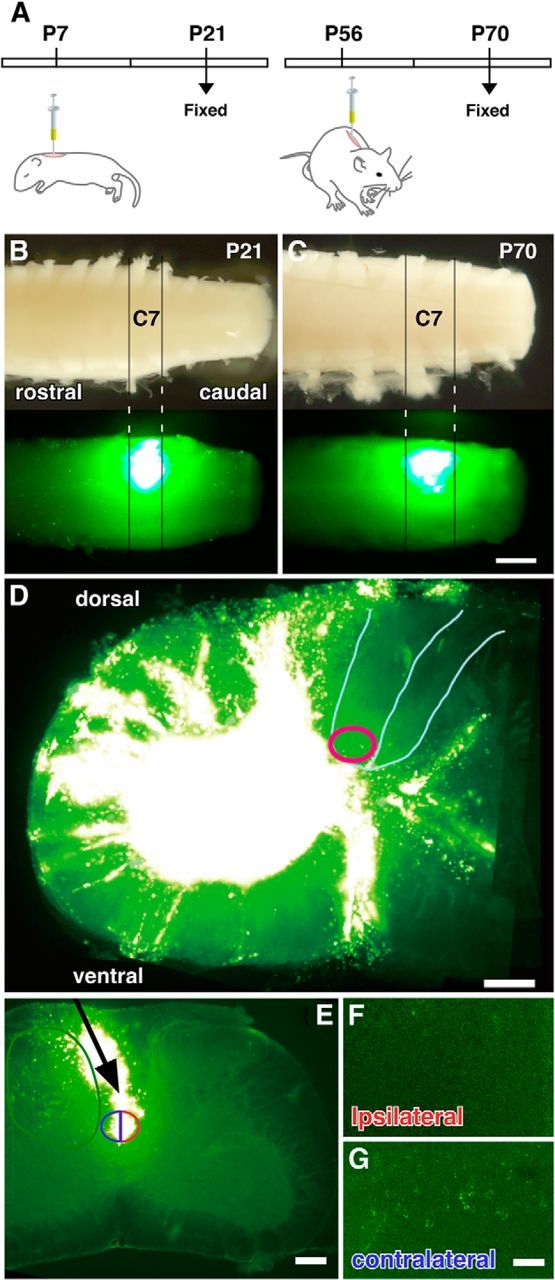
Accuracy of labeling of neurons making synaptic contacts within the spinal gray matter. A, Schematic diagram of a single-injection experiment with juvenile (P7) and adult (P56) mice. Both animals were fixed 2 weeks after injection. B, C, Representative longitudinal images of juvenile (P21, B) and adult spinal cords (P70, C) showing the region where the fluorescent microspheres were injected. The spread of the microspheres was restricted to the area between the C7 and C8 nerve roots in both juveniles and adults. D, Representative transverse image of C7 at the location the microspheres were injected. Microspheres spread widely in the gray matter, but not into the ventral-most part of the dorsal column (red circle). E, F, Microsphere injection adjacent to the dorsal column in C7. A glass pipette was inserted into the vicinity of the dorsal column (E, arrow), and microspheres were spread into both sides of dorsal column (E, blue and red semicircles). No labeled cells were observed in the cortex ipsilateral to the pipette insertion (F). A small number of cells were labeled in the cerebral cortex contralateral to the side of micropipette-tip position (G), probably because microspheres were taken up by terminals distributed in the gray matter near the dorsal column, where the beads were injected (E, green circle). Scale bars: C, 500 μm; D, E, 200 μm; G, 100 μm.
We next plotted the positions of the labeled cell bodies, which were all present in layer 5B of the cortex (Fig. 2A) (Anderson et al., 2010), on the corresponding serial coronal cortical sections (Fig. 2B), counted their numbers, and generated a cortical distribution map (Fig. 2C) from the group data (n = 10). The labeled cells were distributed in an unexpectedly wide area, extending from the frontal tip over the rostral two-thirds of the cerebral cortex, and were particularly dense in three areas: (1) medial frontal, a putative homolog of the primate premotor and supplementary motor cortices (M2); (2) frontoparietal, the sensorimotor cortex (M1/S1); and (3) lateral temporal, the secondary somatosensory cortex (S2) (Fig. 2C). We did not find labeled cells in the occipital cortex (Fig. 2C).
To verify that the microspheres were not taken up by passing fibers, we injected them into the C7 dorsal column by placing an injection micropipette near but not within the left dorsal column (Fig. 1E, arrow), which prevented the tip of the pipette from damaging the dorsal column fibers. Two weeks later, despite massive invasion of the microspheres into the bilateral dorsal column (Fig. 1E), no labeled cells were found in the left cerebral cortex (Fig. 1F; n = 4), indicating microspheres were not taken up by passing CS fibers in the dorsal column. By contrast, a small number of labeled cells were found in the right cortex, contralateral to the injection site (Fig. 1G), probably because microspheres were taken up by terminals distributed in the left gray matter, near the dorsal column, where the beads were distributed (Fig. 1E, green circle).
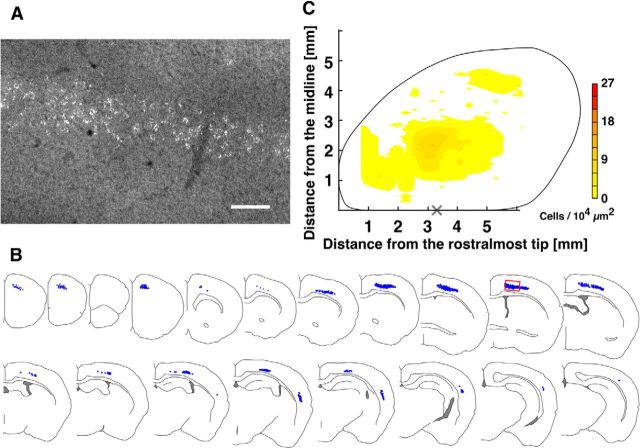
The large-scale convergence of CS neurons at the C7 spinal segment in the juveniles prompted us to examine adult mice. Microspheres were injected into the C7 gray matter in adult (P56) mice, and the animals were killed 2 weeks later (P70). We again carefully selected animals in which the rostrocaudal spread of injected microspheres was restricted to C7 (Fig. 1C) and generated a distribution map (Fig. 3; n = 10) analogous to the one in Figure 2. An extensive distribution of labeled cells projecting to C7 was also observed in adult mice (Fig. 3A,B), with the same three densely labeled areas (Fig. 3C), but the cell density was substantially reduced.
Figure 3.
Retrograde labeling of CS neurons innervating C7 in the adult spinal cord (P70). A–C, Same as in Figure 2. C, The distribution map was made using group data from 10 mice. “X” indicates the bregma point (3.3 ± 0.3 mm from the rostralmost tip, n = 4). Scale bar: A, 100 μm.
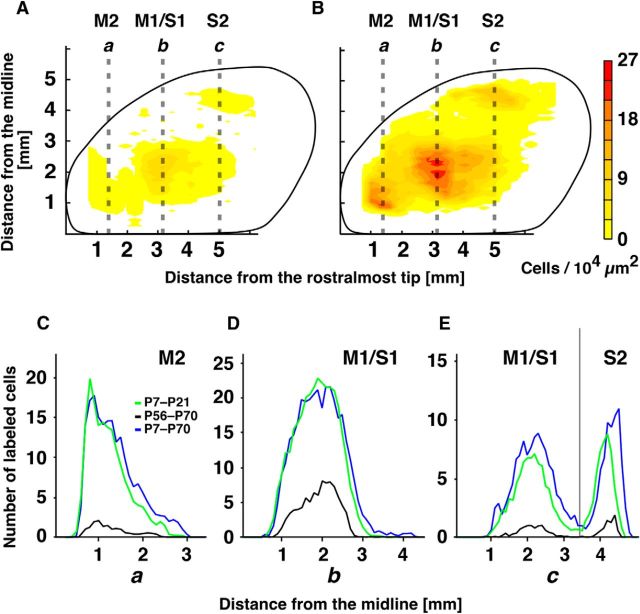
To discriminate between two possible explanations for the decrement of retrogradely labeled cells during development, cell death, or axon branch elimination, we injected microspheres into the C7 gray matter on P7, after which the mice were allowed to survive to adulthood (P70) (Fig. 4B; n = 5). In these animals, neither the density nor the distribution of labeled neurons significantly differed from the juvenile group (Fig. 4C–E), which indicates that cells innervating C7 in juveniles mostly remained alive in the adults, and the reduction in labeling was due mainly to axon branch elimination.
Figure 4.
Reduction of C7-innervating CS neuron density during development. A, B, Distribution maps of CS neurons in mice. Injections were made on P56 (A, n = 10) or P7 (B, n = 5), after which both groups of mice were perfusion fixed on P70. The map in A is the same as in Figure 3C, whereas the map in B was made from experiments different from Figure 2C using data pooled from 5 mice. C–E, Cell densities along the three dotted lines passing through M2 (C), M1/S1 (D), and S2 (right side of the gray line in E): the numbers of labeled cells were plotted against the distances from the midline. Green line indicates the numbers of the labeled cells observed in the juvenile (P7–P21), black in the adult (P56–P70), and blue in the juvenile-to-adult (P7–P70) mouse groups.
To compare the extension and distribution pattern of C7-projecting neurons between juveniles (P7) and adults (P56), we used P70 brains obtained in the experiments described above (Fig. 4A,B) as a standard. First, the lengths of their extensions along three mediolateral lines were compared (Fig. 4C–E). The adult/juvenile ratio was 0.76 along line b in the M1/S1 (2.9 mm in adults/3.8 mm in juveniles), 0.77 along line a in the M2 (2.0 mm/2.6 mm), and 0.71 along line c in the S2 (2.9 mm/4.1 mm). To assess the distribution pattern, the half peak value of the three distribution curves (half-width) was compared; the adult/juvenile ratio was 0.80 along the M1/S1 line (1.29 mm/1.61 mm), 0.55 along the M2 line (0.56 mm/1.02 mm), and 0.55 along the S2 line (0.36 mm/0.65 mm). We also compared the distribution of C7-projecting cells in P21 brains labeled with the retrograde tracer on P7 (Fig. 4C–E, green curves) with the distribution in P70 brains labeled on P56 (Fig. 4C–E, blue curves). The distribution curves in P21 brains (Fig. 4C–E, green curves) and P70 brains (Fig. 4C–E, blue curves) show good correspondence, which is indicative of the reproducibility of the retrograde tracing experiments and indicates that brain size did not differ substantially between the two ages. In addition, essentially the same adult/juvenile ratios were obtained: length ratio, 0.94 in M1/S1, 0.74 in M2, and 0.74 in S2; half-width, 0.84 in M1/S1, 0.69 in M2, and 0.65 in S2. These results indicate that, although the numbers of C7-projecting cells greatly declined during development, the extension and wide projection pattern seen in juveniles was largely preserved in the adult cortex.
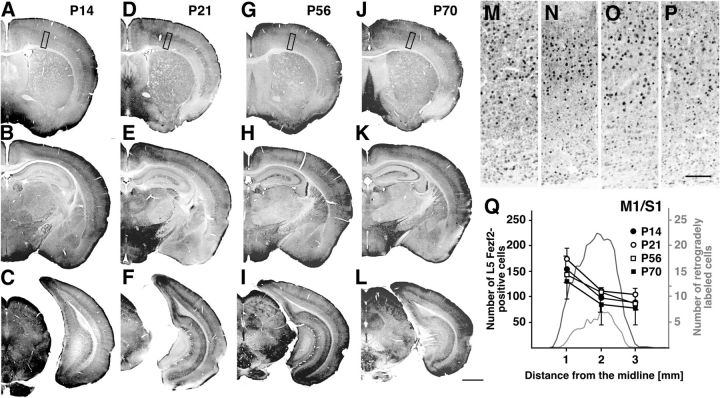
It has been reported that Fezf2 is required for specification of CS neurons and CS tract formation (Chen et al., 2005; Molyneaux et al., 2005). To test whether loss of Fezf2 expression underlies the observed decline in the numbers of C7-projecting neurons as mice age from juveniles to adults, we assessed the pattern of Fezf2 expression. Fezf2 immunoreactivity was broadly observed in deep layers throughout the cerebral cortex at all ages studied (Fig. 5A–L). The majority of Fezf2-positive cells were located in layer 5, but a considerable number were also present in layer 6, regardless of the animal's age (Fig. 5M–P). The distribution also showed a mediolateral gradient in mice of all ages, which was quite different from the distribution pattern of CS (C7) projecting neurons (Fig. 5Q; n = 3). Although the density of Fezf2-positive cells declined with aging from juvenile (P14, P21) to adult (P56, P70) (Fig. 5Q), the scale of the reduction was much smaller than among C7-projecting neurons. In addition, there was no obvious relationship between the reduction patterns of Fezf2-positive cells and C7-projecting neurons (Fig. 5Q). It is true that Fezf2 may be essential for subcortical projection of cortical neurons, including to the spinal cord (Leone et al., 2008); nonetheless, the observed loss of C7-projecting cells could not be explained by a change in Fezf2 expression.
Figure 5.
Fezf2 expression in the cerebral cortex of juvenile and adult mice. Coronal sections of P14 (A–C), P21 (D–F), P56 (G–I), and P70 (J–L) brains containing the rostral (M1/S1 level; A, D, G, J), intermediate (S2 level; B, E, H, K), and caudal (V1 level; C, F, I, L) areas. M–P, Enlarged images of the areas indicated by the black rectangles in A, D, G, J. At all ages studied, the majority of Fezf2-positive cells were observed in layer 5, but a considerable number were also seen in layer 6. Q, Quantitative analysis of L5 Fezf2-poitive cells in cortical area M1/S1 (n = 3). The age-related decrease in the density of Fezf2-positive neurons was much smaller than that of C7-projecting neurons. Scale bars: L, 1 mm; P, 100 μm.
Given the extensive distribution of motor cortical neurons converging on C7, it follows that at least some of the cells may diverge to multiple spinal segments. Indeed, the area containing the CS neurons converging to the C7 gray matter also contains the region known to be the hindlimb area (Pronichev and Lenkov, 1998; Tennant et al., 2011), which is laterally bordered by the forelimb area (Tennant et al., 2011). To examine the relationship between these two areas, we performed retrograde double labeling. On P7 or P56, red fluorescent microspheres were injected into one lumbar segment, the L4 gray matter, whereas green microspheres were injected into C7, after which the mice were allowed to survive for 2 weeks (Fig. 6A). In both the juveniles and adults, the area projecting to L4 was much smaller (Fig. 6B2,C2) and was included within the area projecting to C7 (Fig. 6B1–C3). Interestingly, L4-projecting neurons showed no age-related reduction in either their extent or density (Fig. 6B2,C2). Thus, CS projection to the lumbar cord may not undergo the major remodeling during development that CS projection to the cervical cord undergoes.
Figure 6.
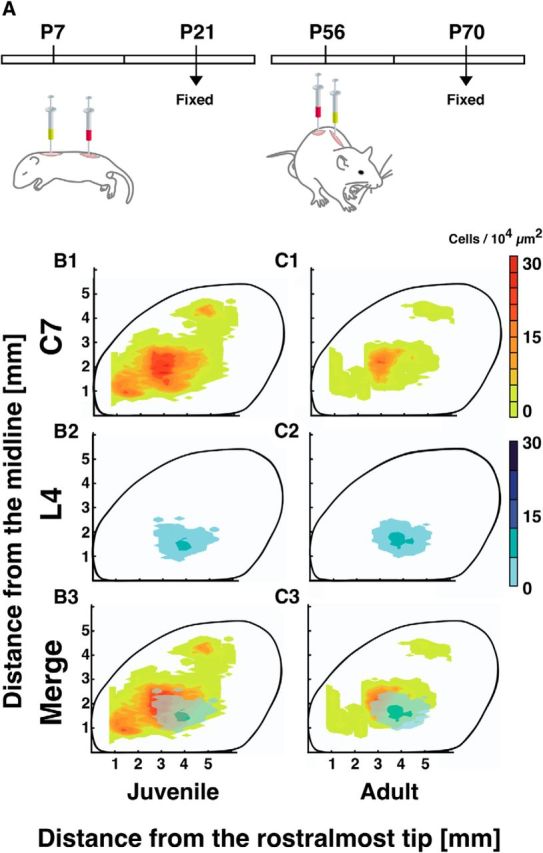
Retrograde double labeling of C7- and L4-projecting cells. A, Schematic diagram of a double-injection experiment with juvenile (P7) and adult (P56) mice. All animals were fixed 2 weeks after injection. B, C, Distribution of C7- and L4-projecting neurons in the juvenile (B1–B3) and adult (C1–C3) cerebral cortices. In both juveniles and adults, the area projecting to L4 was much smaller and contained within the area projecting to C7. Each distribution map was made using data pooled from 5 mice.
Surprisingly, the double labeling also revealed that a considerable number of CS neurons innervate both the cervical and lumbar cord (Fig. 7). These neurons were widely distributed in the L4-projecting area in both juveniles and adults (Fig. 7C,D), although their numbers had declined by ∼80% in the adults. These results indicate that subpopulations of CS neurons diverge broadly, sending axon collaterals to both forelimb and hindlimb segments of the spinal cord.
To examine the extent to which CS axons in the spinal gray matter make synaptic contacts with spinal neurons during this period, we used exo utero electroporation (Saito, 2006) to introduce expression vectors encoding DsRed and synaptophysin-GFP, a component of presynaptic structures, into mouse embryos (E12.5) to label layer 5 cortical axons and their synaptic terminals, respectively (Fig. 8A). DsRed-immunopositive axons (successfully labeled CS axons) possessing GFP-immunopositive puncta (putative presynaptic sites) were distributed throughout the spinal gray matter on P7-P8 (Fig. 8B). To determine whether there are area-related differences in synapse formation within spinal gray matter, unilateral spinal gray matter was divided into four fan-shaped areas using four radial lines extending from the ventral tip of the dorsal column (Fig. 8B3), and DsRed-positive axon segments (>30 μm, 8–12 segments in each part) were randomly selected and examined for colocalization of GFP-immunopositive puncta (Fig. 8C). The prevalence of axons containing synaptophysin-GFP-positive puncta was quite high in every area (n = 3 mice): 0.90 ± 0.10, 0.87 ± 0.06, 0.84 ± 0.08, and 0.89 ± 0.10 in the mediodorsal, dorsolateral, ventrolateral, and medioventral areas, respectively. This suggests that nearly all CS axons entering the C7 gray matter form synapses with spinal neurons on P7, regardless of the area in the spinal gray matter.
Figure 8.
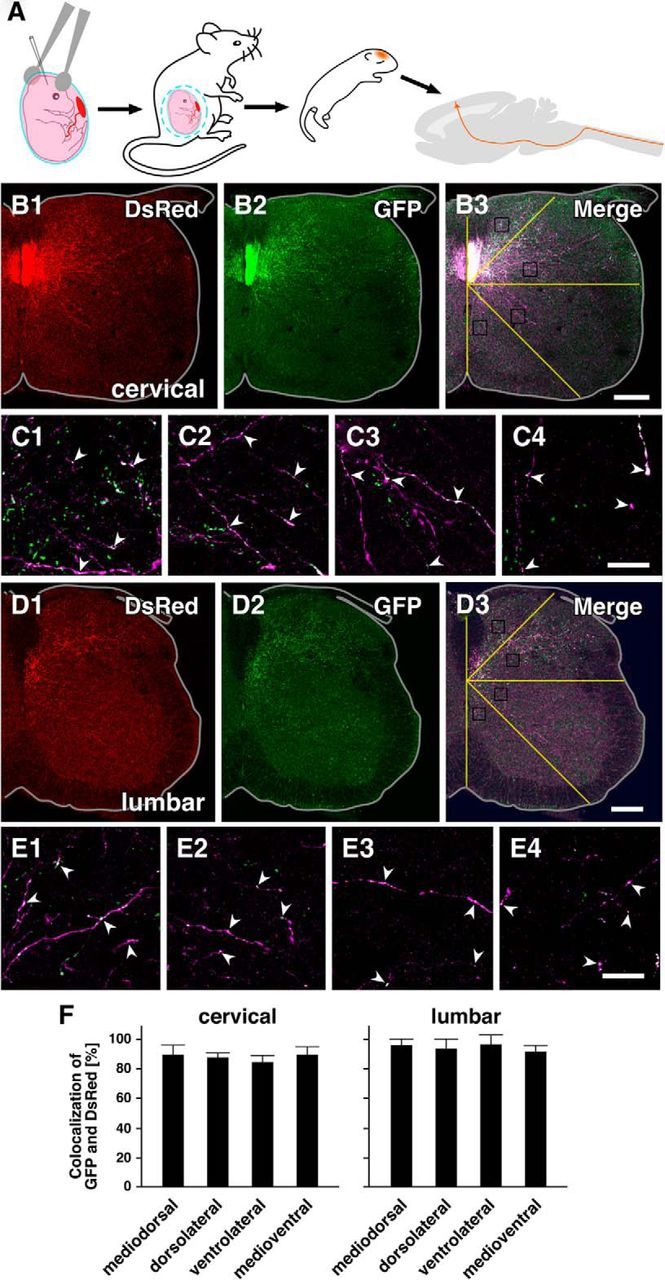
CS axons in the gray matter of juvenile mice possess presynaptic structures. A, Using exo utero electroporation, synaptophysin-EGFP and DsRed expression vectors were introduced into the lateral ventricles of E12.5 mouse embryos to label layer 5 CS neurons. B, Distribution of GFP (synaptophysin)- and DsRed-immunopositive axons in C7 of P7 mice. Unilateral images of transverse spinal cord sections were shown: upward is dorsal; lateral is to the right. Because synaptophysin is sparsely distributed in the axoplasm (Leclerc et al., 1989), the ventral dorsal column (CS tract), where CS axons are densely packed, fluoresces relatively strongly. Nonetheless, presynaptic synaptophysin clusters are clearly discernible in single axons (B2,B3). Colocalization of GFP and DsRed immunoreactivity was frequently observed (C, arrowheads) in CS axons distributed in the mediodorsal (C1), dorsolateral (C2), ventrolateral (C3), and medioventral areas (C4) of the spinal cord, suggesting that CS axons make synaptic contacts on spinal neurons. D, Distribution of GFP- and DsRed-immunopositive axons in L4 of P14 mice. The same orientation as in B. Colocalization was also frequently observed (E, arrowheads) in CS axons distributed in each area (E1–E4) of the spinal cord. F, Rates of GFP and DsRed colocalization in the cervical (left) and lumbar cord (right). The rates in both segments were very high, and the colocalization was not spatially biased. Scale bars: B, D, 200 μm; C, E, 20 μm.
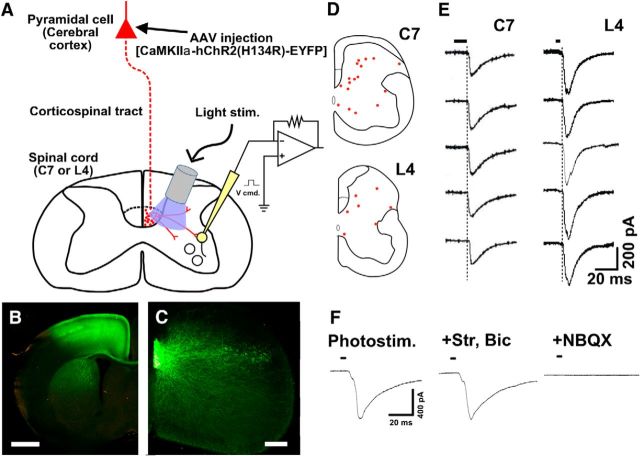
Postsynaptic responses of spinal neurons to CS axon stimulation were confirmed using optogenetic and electrophysiological methods (Fig. 9A). To selectively activate CS axons, we injected recombinant AAV encoding ChR2-EYFP into the deep layers of the sensorimotor cortex of P0 mice (Fig. 9B). Despite a shorter expression time than usually used in optogenetic experiments (Zhang et al., 2010), YFP immunoreactivity was widely discernible in the spinal gray matter, suggesting that ChR2-EYFP was expressed at considerable levels within 1 week and was transported to the distal portion of CS axons (Fig. 9C). On P7-P10, transverse C7 slices were prepared and whole-cell patch recordings were made from 49 randomly selected spinal neurons in 15 slices derived from 7 mice. Using an LED lamp attached to an optical fiber (0.5 mm diameter), photostimuli were applied to CS fibers in the dorsal column and the adjacent gray matter (Fig. 9A). EPSCs were recorded from 24 neurons. These currents were short with fixed latencies and the same time courses; there were no earlier responses (Fig. 9D,E). The expression of ChR2 was weaker than typically seen in optogenetic studies (see Discussion), and it is likely that the observed responses were mediated by monosynaptic input from CS fibers rather than being polysynaptic. The mean amplitude of the EPSCs was 119.3 ± 39.3 pA, and the mean putative “latency” measured from the onset of illumination was 9.7 ± 0.9 ms. It is possible that the recorded synaptic potentials were mediated polysynaptically by inhibitory interneurons, as receptor chloride channels activated by GABA or glycine are known to depolarize, rather than hyperpolarize, postsynaptic cells during development (Ben-Ari et al., 2012). To rule out this possibility, we applied bicuculline (10 μm), a GABAA receptor antagonist, and strychnine (2 μm), a glycine receptor antagonist, which did not affect the response. By contrast, NBQX (5 μm), an AMPA receptor antagonist, abolished the response (Fig. 9F; n = 7). These results, together with the morphological findings, suggest that synaptic connections between CS axons and C7 spinal neurons are robustly established in P7-P8 mouse spinal cords, after which a considerable fraction is eliminated.
Figure 9.
CS-EPSC elicited by optogenetic stimulation of CS axons. A, Schematic diagram of the setup used for recording CS-postsynaptic responses. ChR2-EYFP expression vectors were introduced into layer 5 pyramidal cells using an AAV vector, after which ChR2-positive axons were activated by photostimulation, and whole-cell recordings were made from cells in spinal cord slices. B, Representative coronal image of an AAV-injected cerebral cortex. Intense YFP fluorescence was observed in M1. YFP-labeled cells were restricted within the cerebral cortex. C, YFP immunoreactivity in the C7 spinal gray matter. D, Locations of cells from which EPSCs were recorded in C7 (top) and L4 (bottom). E, Representative traces of responses (Vhold: −90 mV) recorded in C7 (left) and L4 (right panels). Black bars represent the photostimulation period. Dotted lines indicate the onset of responses (EPSCs). F, Effects of glycine, GABAA, and AMPA receptor antagonists on the responses of a neuron (Vhold: −90 mV). Each trace represents averaged data from five responses. Strychnine (2 μm) and bicuculline (10 μm) did not affect the response, but NBQX (5 μm) blocked it completely. Scale bars: B, 1 mm; C, 400 μm.
We also examined synapse formation in the L4 gray matter. CS axons reach C7 in the dorsal column on P2 (i.e., 5–6 d before our study), whereas they reach L4 on P9 (Gianino et al., 1999). We performed our experiment on P14–P15 (i.e., 5–6 d after CS axons arrived at L4). The prevalence of axons with synaptophysin-GFP-positive puncta was also high in L4: 0.96 ± 0.10, 0.93 ± 0.12, 0.97 ± 0.12, and 0.92 ± 0.07 in the mediodorsal, dorsolateral, ventrolateral, and medioventral areas, respectively. Monosynaptic EPSCs were recorded from 7 of 13 randomly selected neurons in 4 slices derived from 4 mice (Fig. 9D). The mean amplitude was 124.6 ± 50.0 pA, and the putative latency was 6.2 ± 0.7 ms. These results suggest that synapse formation by CS axons in L4 was also established at an early stage of development. In addition, the EPSC amplitude was larger and the latency was shorter in L4 than C7 on corresponding developmental days. This would be primarily because the incubation time for expression of ChR2 after AAV injection was twice as long for L4 than C7 (see Discussion), but also because the maturation rate of CS synapses in L4 may be faster than in C7.
Discussion
In the present study, we showed that (1) an unexpectedly large rostral cortical area innervates C7 in juvenile mice and that most of the axons made synaptic contacts with spinal neurons. By contrast, (2) classical overgrowth of CS projections from the occipital cortex did not lead to formation of synaptic contacts. (3) The density of cortical cells innervating C7 declined greatly during development due to axon elimination, not cell death. (4) Despite this reduction in density, the extent of the distribution of cells projecting to C7 did not shrink very much; consequently, even in adults, the distribution of C7-projecting cells was significantly larger than previously thought. (5) On the other hand, the distribution of cells projecting to L4 was limited to the conventional hindlimb area and did not change in size or cell density during development. This indicates an essential difference in developmental remodeling between the subgroups projecting to C7 and L4, and suggests that postnatal refinement of the corticospinal projection to the cervical cord may be required for finer control of forelimb movement, which is not necessary for the coarser hindlimb movement.
We used an optogenetic method to selectively stimulate CS axons in spinal cord slices. ChR2 levels in CS axon terminals are dependent on the interval between vector injection and performance of the photostimulation experiments, as well as on the transport distance from the somata, where the protein is synthesized, to the axon terminals. For stimulation experiments, it is recommended that one wait 3 weeks after injection of the AAV-ChR2 expression system (Zhang et al., 2010). But because this was a developmental study, we waited only ∼1 week after injection (experiments on P7-P10). Nonetheless, ChR2 was expressed at levels sufficient to generate spikes in CS axons upon photostimulation. That said, ChR2 expression on P7-P10 was much lower than on P14 (2 weeks after injection), as estimated from tagged EYFP fluorescence measured over the course of the CS tract (data not shown), and was not sufficient to directly activate nerve terminal Ca channels for transmitter release without generation of action potentials (i.e., in the presence of tetrodotoxin, an Na channel blocker, and 4-aminopyridine, a K channel blocker), as is sometimes done in experiment with adults. Although these rigorous experiments may be desirable, selective axonal activation is adequate to show that CS axons make synaptic contact with spinal cord neurons in the juvenile mouse spinal cord. Moreover, it is unlikely that selective electrical stimulation of CS axons can be achieved, as the CS tract (ventralmost part of the dorsal column) is too small to avoid current spread to the other groups of axons. On the other hand, the responses recorded from lumbar cord cells on P14-P15 showed shorter latencies and larger amplitudes. This would be primarily due to the higher levels of ChR2 after the longer incubation period, resulting in activation of more CS axons and their nearer segments (far from the illumination probe) upon photostimulation at the same intensity.
During development, cells in a wide area of the cerebral cortex, including the occipital cortex, send axons to the CS tract and then retract a large number of them (Stanfield et al., 1982; Bates and Killackey, 1984; Oudega et al., 1994). Moreover, anecdotal observations suggest that some of the aberrant axons enter the spinal gray matter (Joosten et al., 1987) and that some form synapses in the vicinity of the dorsal column (Low et al., 2008). However, it was not yet clear whether the majority of overgrowth axons enter the spinal gray matter and make synaptic contacts with spinal neurons (Stanfield, 1992). Cells in the occipital cortex were not labeled during our retrograde tracing of nerve terminals in the spinal gray matter, although these aberrant axons are still present in the cervical cord during the second postnatal week in rats (Joosten et al., 1987) and hamsters (Kuang and Kalil, 1994). On the other hand, nearly all the CS axons within the spinal gray matter of P7-P10 mice made synaptic connections with C7 spinal neurons (Figs. 8 and 9). This suggests that CS projections undergo at least two types of regressive events. Exuberant axons derived from most rostral cortical areas are integrated into the spinal circuit at an early developmental stage; this involves reorganization of neuronal circuits with synaptic connections. By contrast, few, if any, exuberant axons from caudal cortical areas, including the occipital cortex, are integrated into the spinal circuit; instead, they retract from the CS tract (white matter) without innervating the spinal cord. Several earlier studies showed that approximately half of the axons at the level of the medullary pyramids are eliminated during development (Reh and Kalil, 1982; Gorgels, 1990; Oudega et al., 1994). In the present study, cell density in M1/S1, a major source of CS axons, was reduced by 75%; and in other areas, the density was reduced by up to 92%, suggesting that additional branch elimination or rewiring occurred below the pyramid level (i.e., at the intraspinal level).
It has been shown in many laboratories that in a process involving reorganization of the circuits controlling the forelimb movements, synapse numbers increase and synaptic responses become larger during development, despite synapse elimination (Tapia and Lichtman, 2013). This is the case with the spinal gray matter during development, the CS axons not eliminated undergo the next stage of development, which includes increases in fine axon branching, in the density of axon varicosities (indicating synapses) and in their clustering (Li and Martin, 2002). It is also known that CS stimulation at the level of the medullary pyramids in young animals and at the motor cortex in humans does not elicit muscle contraction, although the CS axons make synaptic contacts with spinal neurons (Bruce and Tatton, 1980; Nezu et al., 1997; Olivier et al., 1997; Meng et al., 2004). This appears to be due, at least in part, to a lack of frequency facilitation (i.e., poor temporal summation of CS-EPSPs), which is prominent in adults (Meng et al., 2004). Thus, our present observation may be compatible with the idea (Li and Martin, 2000) that early CS synapses might be involved in mediating the formation and maturation of motor circuits, rather than producing movement. In addition, synapse elimination with axonal regression was pronounced in the area innervating C7 (Fig. 6) but not the area innervating L4. This suggests the neuronal circuits controlling forelimb movements undergo greater developmental refinement than those controlling the hindlimbs.
In contrast to the distribution of C7-projecting cells, that of L4-projecting cells is consistent with the conventional hindlimb area. Furthermore, the size of the distribution and the number of cells projecting to L4 remain nearly unchanged during development. The wider cortical area involved in control of forelimb movements and its greater remodeling and plasticity during development might be the basis for the greater complexity, coordination, and flexibility of forelimb movement, compared with hindlimb movement.
We initially expected cortical areas innervating C7 in adult animals to reflect the discrete somatotopic organization of the motor cortex typified by the motor cortical homunculus (Welker et al., 1957; Penfield and Rasmussen, 1968), although not necessarily a precise point-to-point representation (Fetz and Cheney, 1980; Shinoda et al., 1986). We found, however, that the cortical areas innervating C7 were unexpectedly large, as exemplified by cells innervating both the cervical and lumbar cord (Fig. 7). By contrast, the area innervating L4 was limited to the conventional hindlimb area. Presumably, CS neurons controlling the forelimb muscles are abundantly connected to multiple spinal segments and motoneuron pools, although each main target would be tuned to a few muscles. This might explain, at least in part, the motor cortical plasticity associated with motor training (Nudo et al., 1996a; Kleim et al., 1998) or functional compensation after injury (Nudo et al., 1996b), which could be achieved through sprouting/retraction of nerve terminals and/or potentiation/depression of synaptic connections within the spinal cord.
Footnotes
This work was supported by Ministry of Education, Culture, Sports, Science and Technology, Japan Grant-in-Aid Grant 23300141 to M.S. We thank Dr. T. Saito for his help with in vivo electroporation in embryonic mice; Dr. S. Okabe for supplying the plasmids for expression of synaptophysin-EGFP; Dr. H. Niwa for providing pCAGGS promoter; Dr. N. Yamamoto for supplying the DsRed expression vector; Dr. K. Deisseroth for supplying the ChR2 construct; and T. Shinozaki and I. Yokota for helpful advice on statistical analysis.
The authors declare no competing financial interests.
References
- Anderson CT, Sheets PL, Kiritani T, Shepherd GM. Sublayer-specific microcircuits of corticospinal and corticostriatal neurons in motor cortex. Nat Neurosci. 2010;13:739–744. doi: 10.1038/nn.2538. [DOI] [PMC free article] [PubMed] [Google Scholar]
- Bates CA, Killackey HP. The emergence of a discretely distributed pattern of corticospinal projection neurons. Brain Res. 1984;315:265–273. doi: 10.1016/0165-3806(84)90161-5. [DOI] [PubMed] [Google Scholar]
- Ben-Ari Y, Khalilov I, Kahle KT, Cherubini E. The GABA excitatory/inhibitory shift in brain maturation and neurological disorders. Neuroscientist. 2012;18:467–486. doi: 10.1177/1073858412438697. [DOI] [PubMed] [Google Scholar]
- Bruce IC, Tatton WG. Sequential output–input maturation of kitten motor cortex. Exp Brain Res. 1980;39:411–419. doi: 10.1007/BF00239305. [DOI] [PubMed] [Google Scholar]
- Chen B, Schaevitz LR, McConnell SK. Fezl regulates the differentiation and axon targeting of layer 5 subcortical projection neurons in cerebral cortex. Proc Natl Acad Sci U S A. 2005;102:17184–17189. doi: 10.1073/pnas.0508732102. [DOI] [PMC free article] [PubMed] [Google Scholar]
- Dum RP, Strick PL. Motor areas in the frontal lobe: the anatomical substrate for the central control of movement. In: Riehle A, Vaadia E, editors. Motor cortex in voluntary movements. Boca Raton, FL: CRC; 2004. pp. 4–47. [Google Scholar]
- Fetz EE, Cheney PD. Postspike facilitation of forelimb muscle activity by primate corticomotoneuronal cells. J Neurophysiol. 1980;44:751–772. doi: 10.1152/jn.1980.44.4.751. [DOI] [PubMed] [Google Scholar]
- Gianino S, Stein SA, Li H, Lu X, Biesiada E, Ulas J, Xu XM. Postnatal growth of corticospinal axons in the spinal cord of developing mice. Brain Res Dev Brain Res. 1999;112:189–204. doi: 10.1016/S0165-3806(98)00168-0. [DOI] [PubMed] [Google Scholar]
- Gorgels TG. A quantitative analysis of axon outgrowth, axon loss, and myelination in the rat pyramidal tract. Brain Res Dev Brain Res. 1990;54:51–61. doi: 10.1016/0165-3806(90)90064-6. [DOI] [PubMed] [Google Scholar]
- Joosten EA, Gribnau AA, Dederen PJ. An anterograde tracer study of the developing corticospinal tract in the rat: three components. Brain Res. 1987;433:121–130. doi: 10.1016/0165-3806(87)90070-8. [DOI] [PubMed] [Google Scholar]
- Kamiyama T, Yoshioka N, Sakurai M. Synapse elimination in the corticospinal projection during the early postnatal period. J Neurophysiol. 2006;95:2304–2313. doi: 10.1152/jn.00295.2005. [DOI] [PubMed] [Google Scholar]
- Katz LC, Iarovici DM. Green fluorescent latex microspheres: a new retrograde tracer. Neuroscience. 1990;34:511–520. doi: 10.1016/0306-4522(90)90159-2. [DOI] [PubMed] [Google Scholar]
- Katz LC, Burkhalter A, Dreyer WJ. Fluorescent latex microspheres as a retrograde neuronal marker for in vivo and in vitro studies of visual cortex. Nature. 1984;310:498–500. doi: 10.1038/310498a0. [DOI] [PubMed] [Google Scholar]
- Kleim JA, Barbay S, Nudo RJ. Functional reorganization of the rat motor cortex following motor skill learning. J Neurophysiol. 1998;80:3321–3325. doi: 10.1152/jn.1998.80.6.3321. [DOI] [PubMed] [Google Scholar]
- Kuang RZ, Kalil K. Development of specificity in corticospinal connections by axon collaterals branching selectively into appropriate spinal targets. J Comp Neurol. 1994;344:270–282. doi: 10.1002/cne.903440208. [DOI] [PubMed] [Google Scholar]
- Kuypers HGJM. Anatomy of the discending pathways. In: Brooks VB, editor. Handbook of physiology: the nervous system. Bethesda, MD: American Physiological Society; 1981. pp. 597–666. [Google Scholar]
- Leclerc N, Beesley PW, Brown I, Colonnier M, Gurd JW, Paladino T, Hawkes R. Synaptophysin expression during synaptogenesis in the rat cerebellar cortex. J Comp Neurol. 1989;280:197–212. doi: 10.1002/cne.902800204. [DOI] [PubMed] [Google Scholar]
- Leone DP, Srinivasan K, Chen B, Alcamo E, McConnell SK. The determination of projection neuron identity in the developing cerebral cortex. Curr Opin Neurobiol. 2008;18:28–35. doi: 10.1016/j.conb.2008.05.006. [DOI] [PMC free article] [PubMed] [Google Scholar]
- Li Q, Martin JH. Postnatal development of differential projections from the caudal and rostral motor cortex subregions. Exp Brain Res. 2000;134:187–198. doi: 10.1007/s002210000454. [DOI] [PubMed] [Google Scholar]
- Li Q, Martin JH. Postnatal development of connectional specificity of corticospinal terminals in the cat. J Comp Neurol. 2002;447:57–71. doi: 10.1002/cne.10203. [DOI] [PubMed] [Google Scholar]
- Low LK, Liu XB, Faulkner RL, Coble J, Cheng HJ. Plexin signaling selectively regulates the stereotyped pruning of corticospinal axons from visual cortex. Proc Natl Acad Sci U S A. 2008;105:8136–8141. doi: 10.1073/pnas.0803849105. [DOI] [PMC free article] [PubMed] [Google Scholar]
- Maeda H, Ohno T, Sakurai M. Optical and electrophysiological recordings of corticospinal synaptic activity and its developmental change in in vitro rat slice co-cultures. Neuroscience. 2007;150:829–840. doi: 10.1016/j.neuroscience.2007.10.010. [DOI] [PubMed] [Google Scholar]
- Martin JH, Friel KM, Salimi I, Chakrabarty S. Corticospinal development. In: Lemke G, editor. Developmental neurobiology. Amsterdam: Elsevier; 2009. pp. 403–414. [Google Scholar]
- Meng Z, Li Q, Martin JH. The transition from development to motor control function in the corticospinal system. J Neurosci. 2004;24:605–614. doi: 10.1523/JNEUROSCI.4313-03.2004. [DOI] [PMC free article] [PubMed] [Google Scholar]
- Molyneaux BJ, Arlotta P, Hirata T, Hibi M, Macklis JD. Fezl is required for the birth and specification of corticospinal motor neurons. Neuron. 2005;47:817–831. doi: 10.1016/j.neuron.2005.08.030. [DOI] [PubMed] [Google Scholar]
- Nezu A, Kimura S, Uehara S, Kobayashi T, Tanaka M, Saito K. Magnetic stimulation of motor cortex in children: maturity of corticospinal pathway and problem of clinical application. Brain Dev. 1997;19:176–180. doi: 10.1016/S0387-7604(96)00552-9. [DOI] [PubMed] [Google Scholar]
- Nudo RJ, Milliken GW, Jenkins WM, Merzenich MM. Use-dependent alterations of movement representations in primary motor cortex of adult squirrel monkeys. J Neurosci. 1996a;16:785–807. doi: 10.1523/JNEUROSCI.16-02-00785.1996. [DOI] [PMC free article] [PubMed] [Google Scholar]
- Nudo RJ, Wise BM, SiFuentes F, Milliken GW. Neural substrates for the effects of rehabilitative training on motor recovery after ischemic infarct. Science. 1996b;272:1791–1794. doi: 10.1126/science.272.5269.1791. [DOI] [PubMed] [Google Scholar]
- Ohno T, Maeda H, Sakurai M. Regionally specific distribution of corticospinal synapses because of activity-dependent synapse elimination in vitro. J Neurosci. 2004;24:1377–1384. doi: 10.1523/JNEUROSCI.3903-03.2004. [DOI] [PMC free article] [PubMed] [Google Scholar]
- Ohno T, Maeda H, Murabe N, Kamiyama T, Yoshioka N, Mishina M, Sakurai M. Specific involvement of postsynaptic GluN2B-containing NMDA receptors in the developmental elimination of corticospinal synapses. Proc Natl Acad Sci U S A. 2010;107:15252–15257. doi: 10.1073/pnas.0906551107. [DOI] [PMC free article] [PubMed] [Google Scholar]
- Olivier E, Edgley SA, Armand J, Lemon RN. An electrophysiological study of the postnatal development of the corticospinal system in the macaque monkey. J Neurosci. 1997;17:267–276. doi: 10.1523/JNEUROSCI.17-01-00267.1997. [DOI] [PMC free article] [PubMed] [Google Scholar]
- Oudega M, Varon S, Hagg T. Distribution of corticospinal motor neurons in the postnatal rat: quantitative evidence for massive collateral elimination and modest cell death. J Comp Neurol. 1994;347:115–126. doi: 10.1002/cne.903470109. [DOI] [PubMed] [Google Scholar]
- Penfield W, Rasmussen T. The cerebral cortex of man: a clinical study of localization of function. New York: Hafner; 1968. [Google Scholar]
- Porter R, Lemon R. Corticospinal function and voluntary movement: Monographs of the Physiological Society. Oxford: Clarendon; 1993. [Google Scholar]
- Pronichev IV, Lenkov DN. Functional mapping of the motor cortex of the white mouse by a microstimulation method. Neurosci Behav Physiol. 1998;28:80–85. doi: 10.1007/BF02461916. [DOI] [PubMed] [Google Scholar]
- Reh T, Kalil K. Development of the pyramidal tract in the hamster: II. An electron microscopic study. J Comp Neurol. 1982;205:77–88. doi: 10.1002/cne.902050108. [DOI] [PubMed] [Google Scholar]
- Saito T. In vivo electroporation in the embryonic mouse central nervous system. Nat Protoc. 2006;1:1552–1558. doi: 10.1038/nprot.2006.276. [DOI] [PubMed] [Google Scholar]
- Shinoda Y, Yamaguchi T, Futami T. Multiple axon collaterals of single corticospinal axons in the cat spinal cord. J Neurophysiol. 1986;55:425–448. doi: 10.1152/jn.1986.55.3.425. [DOI] [PubMed] [Google Scholar]
- Stanfield BB. The development of the corticospinal projection. Prog Neurobiol. 1992;38:169–202. doi: 10.1016/0301-0082(92)90039-H. [DOI] [PubMed] [Google Scholar]
- Stanfield BB, O'Leary DD, Fricks C. Selective collateral elimination in early postnatal development restricts cortical distribution of rat pyramidal tract neurones. Nature. 1982;298:371–373. doi: 10.1038/298371a0. [DOI] [PubMed] [Google Scholar]
- Tapia JC, Lichtman JW. Synapse elimination. In: Squire L, Berg D, Bloom FE, du Lac S, Ghosh A, Spitzer NC, editors. Fundamental neuroscience. Ed 4. Amsterdam: Academic; 2013. pp. 437–455. [Google Scholar]
- Tennant KA, Adkins DL, Donlan NA, Asay AL, Thomas N, Kleim JA, Jones TA. The organization of the forelimb representation of the C57BL/6 mouse motor cortex as defined by intracortical microstimulation and cytoarchitecture. Cereb Cortex. 2011;21:865–876. doi: 10.1093/cercor/bhq159. [DOI] [PMC free article] [PubMed] [Google Scholar]
- Welker WI, Benjamin RM, Miles RC, Woolsey CN. Motor effects of stimulation of cerebral cortex of squirrel monkey (Saimiri sciureus) J Neurophysiol. 1957;20:347–364. doi: 10.1152/jn.1957.20.4.347. [DOI] [PubMed] [Google Scholar]
- Yoshioka N, Murabe N, Sakurai M. Regressive events in rat corticospinal axons during development in in vitro slice cocultures: retraction, amputation, and degeneration. J Comp Neurol. 2009;513:164–172. doi: 10.1002/cne.21950. [DOI] [PubMed] [Google Scholar]
- Zhang F, Gradinaru V, Adamantidis AR, Durand R, Airan RD, de Lecea L, Deisseroth K. Optogenetic interrogation of neural circuits: technology for probing mammalian brain structures. Nat Protoc. 2010;5:439–456. doi: 10.1038/nprot.2009.226. [DOI] [PMC free article] [PubMed] [Google Scholar]


