

Abstract
Dopamine is a critical neuromodulator that activates GPCRs in mammals or ligand-gated ion channels in invertebrates. The present study demonstrates that dopamine (0.1–10 mm) exerts novel, opposing effects on different populations of mammalian (rat) GABAA receptors. Using whole-cell patch-clamp electrophysiology, we observed direct dopamine-mediated inhibition of tonic-level (1 μm) GABA-evoked currents in untransfected striatal neurons that could be recapitulated in HEK293 cells containing α1β3 or α1β2γ2 subunits. Surprisingly, direct activation by dopamine was seen in the absence of GABA with α1β2γ2, α5β3γ2, or α1β3γ2 transfections. This activity was also present in α1β3γ2 receptors containing a mutant β3 subunit (H267A [Zβ3]) insensitive to trace levels of inhibitory Zn2+. Dopamine activation required β and γ subunits but not α subunits (Zβ3γ2 EC50 value, 660 μm). Dopamine activity was fully blocked by picrotoxin but not GABAA competitive antagonists, and was strongly correlated with spontaneous receptor activity. We also report opposing effects of bicuculline and gabazine, such that bicuculline surprisingly activated non-α-containing (β3γ2) GABAA receptors, whereas gabazine suppressed spontaneous activity in these receptors. Our results suggest that dopamine may directly inhibit GABAA receptors that are both immediately adjacent to dopamine release sites in the striatum and activated by tonic GABA. Furthermore, synaptic/phasic release of dopamine may directly enhance signaling at some spontaneously active noncanonical GABAA receptors that lack α subunits.
Keywords: dopamine, electrophysiology, GABA, GABAA, LGIC, spontaneous activity
Introduction
Dopamine (DA) is a fundamental neuromodulator that controls movement initiation, reward acquisition, learning, and decision making (Tritsch and Sabatini, 2012). To properly facilitate movement, substantia nigra (SNc) dopaminergic cells must balance the activities of direct pathway medium spiny neurons (MSNs; containing Gs-coupled DA D1 receptors) and indirect pathway MSNs (containing Gi/o-coupled D2 receptors) via direct projections to the dorsal striatum. Death of these SNc dopaminergic neurons in Parkinson's disease (PD) results in a loss of this balance. As DA modulation declines, D1 MSNs become hypoactive while D2 MSNs become hyperactive partly because signaling from striatal fast-spiking GABAergic interneurons remains unchanged (Mallet et al., 2006). Spillover from GABAergic synapses evokes low-level (tonic) GABA currents in D2 MSNs and less so in D1 MSNs, further revealing a difference between these cell types (Ade et al., 2008). The major brain receptors for GABA are the Cys-loop GABAA receptors (GABAARs), ligand-gated chloride channels that control vertebrate neural inhibition through phasic and tonic components (Belelli et al., 2009; Sigel and Steinmann, 2012).
LGC-53, a ligand-gated ion channel (LGIC) activated by DA, exists in the invertebrate Caenorhabditis elegans (Ringstad et al., 2009). While no DA-gated LGIC is known to exist in mammalian brain, the related GABAARs are ubiquitous (Sigel and Steinmann, 2012). Most GABAARs are heteropentamers consisting of two α subunits, two β subunits, and a fifth variable subunit (γ, δ, ε, or β) arranged clockwise α-β-α-β-X (Baumann et al., 2001), although 19 known subunits (α1–6, β1–3, γ1–3, δ, ε, θ, π, ρ1–3) may theoretically coassemble in hundreds of arrangements (Olsen and Sieghart, 2008). Subunits have plus (+) and minus (−) sides and GABA binds at extracellular interfaces between two subunits (β+α−; Smith and Olsen, 1995), while benzodiazepines target α+γ− (Sigel, 2002). The pharmacologies of other interfaces including γ+β− or α+β− are less clear (Ramerstorfer et al., 2011).
In striatal neurons, where dopaminergic innervation is strongest (Tritsch and Sabatini, 2012), the GABAAR β3 subunit shows comparatively high expression (Wisden et al., 1992; Pirker et al., 2000). Both D1 MSNs and D2 MSNs require β3 subunits to maintain tonic GABAAR currents (Janssen et al., 2009, 2011). Also, in some cases, striatal postsynaptic densities express β2 or β3 subunits and might be adjacent to boutons containing DA but not GABA (Pickel and Chan, 1990; Smith and Bolam, 1990; Fujiyama et al., 2000). Based on structural homology between invertebrate LGC-53 and mammalian β3, the expression profile of β3 in striatal neurons, and the physiological role β3 plays in MSNs, we hypothesized that DA might directly modulate β3-containing GABAARs at high DA concentrations corresponding to synaptic/phasic release (Garris et al., 1994; Moore et al., 1999). This hypothesis was tested in cultured cells using whole-cell recordings of native and recombinant GABAARs exposed to tonic levels of GABA.
Our studies reveal opposing direct actions of DA at rat GABAARs. On one hand, DA inhibited tonic-level GABAAR currents in native and recombinant receptors. On the other, DA directly activated certain GABAAR subtypes. These novel activities of DA may impel new definitions of dopaminergic signaling in the brain.
Materials and Methods
Compounds, solutions, and abbreviations.
Neuron culture reagents were purchased from Invitrogen: Ca2+/Mg2+-free HBSS, Minimum Essential Medium (MEM), N-2 supplement, and heat-inactivated horse serum (HIHS). Human BDNF (hBDNF) was from Alomone Labs (#B-250). Poly-d-lysine (PDL) and 1-β-d-arabinofuranosylcytosine (ara-C) were from Sigma-Aldrich. Most compounds for electrophysiological recordings were purchased from Sigma-Aldrich: GABA, l-ascorbic acid (reagent grade), gabazine (GBZ; SR-95531), (±)-octopamine, dl-norepinephrine, (±)-epinephrine, choline chloride, acetylcholine chloride (ACh), tryptamine, serotonin HCl (5-HT), pentobarbital sodium salt (Pb), 1(S),9(R)-(−)-bicuculline methbromide [bicuculline (BIC)], picrotoxin (PTX), ZnCl2 (Zn2+), and TTX. Tyramine HCl, 3,4-dihydroxyphenylacetic acid (DOPAC), and homovanillic acid were from Acros and l-DOPA was from Bioanalytical Systems. For recording, compounds were dissolved directly in extracellular solution (see Electrophysiology, below) from undissolved stocks or prepared solutions. On days in which DA was tested, all recording solutions except control contained 0.1% w/v ascorbate made fresh to prevent oxidation. In solutions containing PTX, ≤0.1% DMSO was present to facilitate dissolution. All compounds were made fresh from undissolved stocks except GABA, choline, ACh, Pb, BIC, GBZ, and Zn2+, which were consistently stable at −20 or 4°C.
Protein sequence alignments.
Alignments were done using the National Center for Biotechnology Information Basic Local Alignment Search Tool (BLAST; https://blast.ncbi.nlm.nih.gov). The subunit protein sequence for C. elegans LGC-53 (GenBank accession #NP_741945.3) was compared with a blastp algorithm (protein-protein BLAST) to sequences in the database “nonredundant protein sequences” filtered with an Entrez query by organism for human or rat. Specific proteins used for comparison include human GABAAR ρ1 (accession #AAI30345.1) or β3 (accession #NP_000805.1 or 4COF_A). Gaps in the aligned sequences were recorded as dashes, and residues determined to be functionally similar had chemically similar side chains as detected by the BLAST algorithm. Protein sequences were numbered according to the mature protein [with predicted N-terminal signal peptide removed (using http://www.cbs.dtu.dk/services/SignalP/) under the default settings; Petersen et al., 2011]. Known ligand-binding loops were defined as by Mortensen et al. (2014) and Khatri and Weiss (2010).
Neuron culture.
All experiments were performed in accordance with Animal Care and Use Protocol #12-03009 approved by the Institutional Animal Care and Use Committee at Albany Medical College, a facility accredited by the Association for Assessment and Accreditation of Laboratory Animal Care. Primary cultures of rat embryonic striatal neurons were prepared essentially as described by Ventimiglia and Lindsay (1998), but with substrate and media preparation as described for low-density rat hippocampal cultures (Kaech and Banker, 2006). Briefly, acid-washed 18 mm German glass coverslips were heat-sterilized and dehydrated, dotted with paraffin “feet,” coated with PDL, and then rinsed in sterile water and incubated for 4 d at 36°C in 5% CO2 in Petri dishes containing neuron plating medium (MEM, 0.1 mm pyruvate, 10 mm HEPES, and 10% HIHS). On the day of culture preparation, embryonic day 17 Sprague Dawley rat embryos of either sex (Taconic) were decapitated, and the striata were rapidly dissected, minced in HBSS, and dissociated by treatment with 0.25% trypsin followed by trituration with a fire-polished pipette. The cells were plated into dishes containing coverslips at a density of 6000 cells/cm2 and returned to the incubator. After 3 h, the coverslips with neurons attached were transferred into dishes containing a monolayer of rat cortical astrocytes in which serum-free neuron maintenance medium (MEM with N-2 supplement and 0.1 mm pyruvate) was added 1 d earlier. The coverslips were oriented “paraffin dots down” (so the neurons faced but did not contact the glial cell layer), and hBDNF (50 ng/ml) was added at this time and again 3 and 5 d after plating. Glial conditioning and BDNF have been shown to promote the survival and differentiation of striatal MSNs in vitro (Ventimiglia et al., 1995; Penrod et al., 2011). To prevent glial overgrowth on the coverslips without affecting the glial monolayer, ara-C (5 mm) was added on day 3. This protocol produced low-density striatal monocultures with continuous glial conditioning in which neurons survived and extended processes for ≥15 d. Such conditions provided excellent optical visualization for single-neuron recording and immunocytochemical staining.
Immunofluorescence.
Twelve days after plating, neurons on coverslips were rinsed in Dulbecco's PBS, fixed in 3.7% formaldehyde, permeabilized in 0.5% Triton X-100 (Sigma-Aldrich), and blocked with 2% goat serum (Sigma-Aldrich). Coverslips were then incubated for 30 min in anti-GABAAR β3 primary antibody [0.5 μg/ml (1:2000) mouse monoclonal IgG1 clone #S87-25; Sigma-Aldrich]. After rinsing, coverslips were incubated for 30 min in Alexa 488-conjugated secondary antibody [4 μg/ml (1:500) goat anti-mouse IgG; Invitrogen]. Antibody solutions contained 2% goat serum. After rinsing, coverslips were mounted onto slides with aqueous mounting solution (Prolong Gold Antifade Mountant with DAPI to visualize nuclei; Invitrogen). All steps were performed at room temperature.
To confirm the manufacturer's claim that the primary antibody fails to cross-react with other β subunits, we first noted that it was raised against the unique intracellular β3 subunit M3-4 loop (amino acids 370–433; accession #AAB60502). This sequence was compared with mouse β1 and β2 in a BLAST alignment and we found ≤38% sequence identity, suggesting that the antibody is specific. A few experiments were conducted in transfected HEK293 cells demonstrating robust immunostaining in β3-transfected but not β1/2-transfected cells and a single Western blot band at ∼55 kDa indicating β3, which confirmed the antibody specificity.
Cells were viewed with an Olympus BX50 fluorescence microscope equipped with a WH15×/14 eyepiece lens and the following Olympus air-interface objective lenses: UPlanFl 10×/0.30, 20×/0.50, or 40×/0.75 ∞/0.17. To count GABAAR β3-positive cells, a circular region on a given slide was randomly selected at 20× objective magnification based on the presence of DAPI-positive nuclei. Then cells that coexpressed bright green β3 staining (assessed with a FITC filter) were counted manually as a percentage of total DAPI-positive cells in the field. Counts were performed for 10 nonoverlapping regions on the same slide, then added together for that slide and totals averaged (±SEM) with counts from two additional identically treated slides. Fluorescent and differential interference contrast (DIC) photomicrographs were captured with a QImaging QICAM digital camera (1×) mounted on an Olympus IX71 fluorescence microscope fitted with a LUCPlanFl 40×/0.6 RC3 objective (∞/0–2). Images were processed on a personal computer with QCapture software. Exposure settings were identical for primary-treated and control slides for a given fluorescent channel at a specified magnification. Separate channel photomicrographs were merged using the GNU Image Manipulation Program and image settings were optimized in individual channels with all pixels treated identically.
HEK293 cells, cDNA, and transfection.
Procedures and materials were the same as previously described (Fleck, 2002) but with the following specifications. HEK293 fibroblasts were obtained from ATCC (CRL-1573), stored in liquid N2 vapor phase <−130°C, and then thawed and cultured at 37°C in 5% CO2. Before transfection, cells were rinsed with Dulbecco's PBS and dissociated with 0.05% trypsin-EDTA (Invitrogen) for 4 min at 37°C. Trypsinization was stopped by supplementing 1:1 with DMEM/10% FBS (Sigma-Aldrich/Invitrogen) and centrifuging for 1 min at 1800 × g. Cells were resuspended and plated in 35 mm Nunclon Δ Surface recording dishes (Nunc; Thermo Fisher Scientific) at 80,000 cells/dish. Complimentary rat DNA encoding GABAAR subunits were dissolved in Tris-EDTA buffer, pH 8.0, and stored until use at 4°C at 0.5–1.0 mg/ml. All subunit cDNA were expressed in ampicillin-resistant mammalian pRK vectors and kindly provided by Dr. Peter Seeburg, Max Planck Institute for Medical Research. Subunit sequences corresponded to the following GenBank accession numbers: α1, X15468; α5, X51992.1; β2, X15467.1; β3, NM_017065.1; γ2, NM_183327.1. For transfections, 0.82 μl of Lipofectamine 2000 (Life Technologies) was combined with 50 μl/dish warmed MEM, then mixed 1:1 with a solution containing a total of 0.9 μg of subunit cDNAs (which were diluted sequentially to generate heteromeric receptors). For heterotrimeric transfections consisting of GABAAR α, β, and γ, the cDNA ratio was 1:1:2; other transfections were α:β (1:1) or β:γ (1:2).
Mutagenesis.
β3 [H267A (Zβ3)] was made using QuikChange site-directed mutagenesis according to the manufacturer's instructions (Agilent). PCR conditions were as follows: cycle 1: 95°C for 4 min; cycles 2–19: 95°C for 30 s, 65°C for 1 min, 72°C for 10 min. In all cases, methylated parent DNA was removed by digestion with DpnI, and cDNA products were incubated with subcloning efficiency DH5α Escherichia coli (Invitrogen) and streaked on ampicillin-containing agar plates. Colonies were then selected, subjected to further growth, and cDNA was isolated, purified, and sequenced (Genewiz) to ensure the presence of the mutation. The software DeepView/Swiss-PdbViewer (http://spdbv.vital-it.ch; Swiss Institute of Bioinformatics, 2012; Guex and Peitsch, 1997) was used to depict the mutant GABAAR β3 homopentamer (Protein Data Bank ID 4COF; Miller and Aricescu, 2014).
Electrophysiology.
Whole-cell patch-clamp recordings were performed mostly as described by Fleck (2002), but with the following specifications. Eleven to 15 d following plating (for neurons) or 1–3 d following transfection (for HEK293 cells), culture medium was exchanged with extracellular recording solution, pH 7.3 (290–305 mOsm), consisting of 0.1 mg/ml phenol red pH indicator and the following (in mm): 145 NaCl, 3 KCl, 5 HEPES, 1.8 CaCl2, 1 MgCl2, and, for neurons only, 10 glucose. Glass microelectrodes were filled with neuron intracellular solution, consisting of the following (in mm): 145 CsCl, 5 EGTA, 10 HEPES, 0.5 CaCl2, 3 ATP-Mg2+, and 10 phosphocreatine, pH 7.3 (280–290 mOsm). ATP and phosphocreatine were added fresh on the day of recording. For HEK293 cells, intracellular solution contained the following (in mm): 135 CsCl, 10 CsF, 5 EGTA, 10 HEPES, 0.5 CaCl2, and 1 MgCl2, pH 7.3 (295 mOsm). Given equimolar ion concentrations for extracellular and intracellular solutions, no correction was made for liquid junction potential.
Recording dishes were mounted on the stage of an Olympus IX70 fluorescence microscope equipped with WH10×/22 eyepiece and 20×/0.40 Ph1 ∞/ objective lenses. Phase photomicrographs of cells were captured with a Dage-MTI CCD100 camera, optimized by a Dage-MTI InvestiGator and processed using a personal computer. During neuron superfusion, 0.5 μm TTX was added to control but not drug solutions. In this manner, recorded neurons were exposed to TTX to block action potentials for the vast majority of the patch duration, with only short intervals (≤6 s) of drug perfusion without TTX, during which recordings were not affected. Following the formation of a gigaseal and break-in, cells were exposed to control superfusion with TTX and allowed to rest for ≥ 30 s before application of compounds to allow intracellular solution to equilibrate throughout the entire internal volume. Solution superfusion was driven at 1.5–2.0 ml/min. Holding potentials were −60 mV (for neurons) unless specified. For HEK293 cells, an identical negative holding potential was used for all drug comparisons made on an individual cell (mostly −80 mV, but reduced if needed to ≤−10 mV to avoid saturating amplifier output). Current amplitudes varied linearly with voltage and as such normalized values could be compared cell to cell.
Data analysis.
τ values were calculated by fitting the currents recorded during solution exchange to an exponential plateauing at 95% of the postexchange amplitude, as defined in the following equation:
 |
where Io is starting amplitude, IA is postexchange amplitude, and It is amplitude at time t. Current amplitudes were manually measured and recorded with baseline subtracted. Modulatory effects were assessed by comparing the amplitude during modulation (or the extent of inhibition) to the amplitude of the initial pulse of GABA or DA, or, in the case of desensitization, by comparing to the predicted amplitude based on both the initial and final pulse (see Fig. 3C). For experiments in which drug washoff had slow kinetics (see Fig. 7C,G), currents were measured at a time just before cessation of the final pulse of DA to allow maximal recovery. All data and statistical comparisons were analyzed with GraphPad Prism. Normalized inhibition curves were calculated by constraining Max = 1 and Min = 0 using the following equation:
 |
where nH is the Hill coefficient. For compounds that generated activation instead, unconstrained normalized curves were generated using the following equation:
 |
For all statistical comparisons (detailed in Results), a p value ≤0.05 is considered significant.
Figure 3.
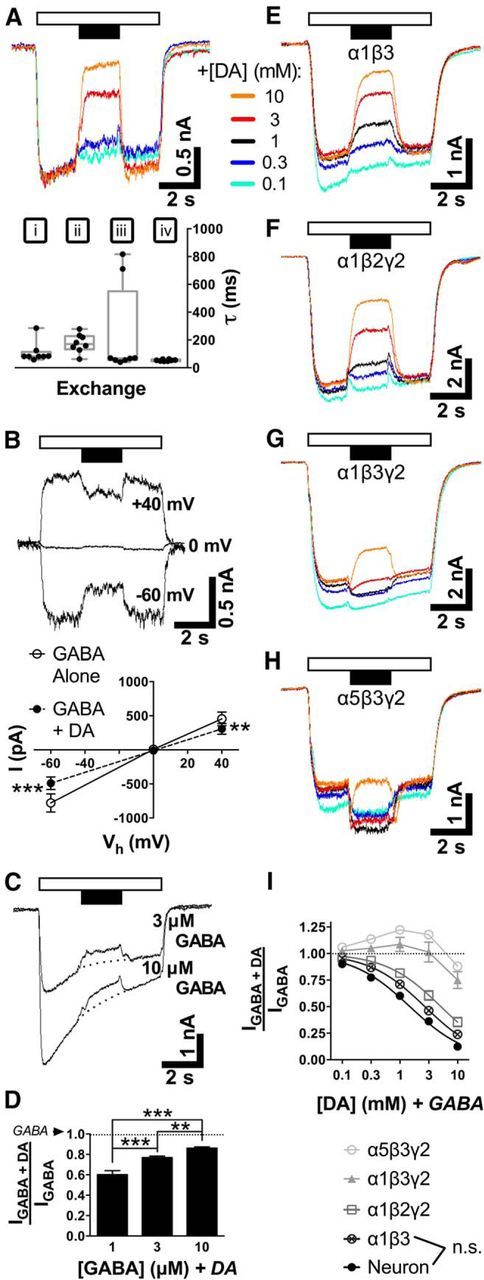
DA rapidly modulates currents evoked by applying tonic levels of GABA. A, Traces demonstrating effects of DA application (filled bar) on GABA (1 μm, unfilled bar) in a typical neuron. Roman numerals represent GABA onset from control solution (i), GABA + DA onset (ii), DA termination (iii), and control resumption (iv). The graph shows response times (τ) following solution exchanges i, ii, iii, or iv for DA (1 mm) and/or GABA (1 μm). Median values are plotted with interquartile range (box) and overall range (whiskers). B, Current–voltage relationship (top, traces; bottom, mean ± SEM) for inhibition of GABA (1 μm) by DA (1 mm). Vh, Holding potential. C, D, Effect of increasing GABA concentrations on DA (1 mm) inhibition (C), quantified in D (mean ± SEM). E–H, Traces showing GABAAR subtype-dependent effects of DA on GABA (1 μm) for recombinant receptors expressed in HEK293 cells. I, Concentration–response curves (mean ± SEM) comparing amplitudes from DA-evoked modulation of GABA (1 μm) in untransfected neurons and transfected cells expressing recombinant receptor subtypes. Differences between α1β3 and neuron values were not significant (n.s.) at any individual concentration (see Results). **p < 0.01; ***p < 0.001.
Figure 7.

Effects of GABAA antagonists on DA-gated GABAARs. A–C, For α1Zβ3γ2, traces show typical effects of DA (1 mm, unfilled bars) or antagonist (10 μm, filled bars) applied alone (left) or in the middle of a DA pulse (1 mm, right). D, Comparative analysis (mean ± SEM) of antagonists acting on α1Zβ3γ2 alone or in combination with DA. All comparisons are made to 1 mm DA-evoked amplitudes in individual cells (normalized to −1, dotted line). Concentrations are the same as A–C. Washoff represents removal of antagonist only. E–G, Same as A–C, but for Zβ3γ2 receptors instead of α1Zβ3γ2. H, Analysis as done in D, except with Zβ3γ2. I, Example of statistical comparisons and symbols used in Table 1 for a single ANOVA of a hypothetical drug. All comparisons for Figure 7 are shown in Table 1.
Results
Similarity of GABAAR β3 to DA-sensitive LGIC subunits
To establish whether mammalian channels might be previously unidentified DA receptors, we first screened all human proteins against the full-length C. elegans DA-gated LGC-53 receptor subunit in a BLAST search. The most similar nonorphan receptor proteins (according to Expect [E] value) included GABAAR ρ2 (5 × 10−62), GlyR subunits (7–10 × 10−62), and GABAAR β3 (4–9 × 10−61, depending on isoform), although GABAAR subunits in general shared homology with LGC-53. The E value represents the significance of the alignment comparison, with lower values indicating higher significance (Altschul et al., 1997). Given the high brain expression patterns of GABAAR compared with GlyR (Lynch, 2009), we screened human GABAAR ρ1 (which when expressed exogenously can be directly inhibited by DA; Ochoa-de la Paz et al., 2012) and human GABAAR β3 against a 183-residue section of LGC-53 with an N terminus located 20–25 residues upstream of the predicted binding loops important for neurotransmitter binding and extending to just before the first transmembrane helix (Fig. 1; Khatri and Weiss, 2010; Miller and Aricescu, 2014; Mortensen et al., 2014). Compared with LGC-53, a substantial number of these residues were identical (29% of total aligned residues for ρ1 and 30% for β3) or functionally conserved (25% for ρ1 and 21% for β3), both in ligand-binding loops and elsewhere on the sequence (Fig. 1).
Figure 1.

Alignment of amino acid residues belonging to the extracellular ligand-binding domains for C. elegans LGC-53, human/rat ρ1, and human/rat β3. Numbering corresponds to the mature protein sequence. Residues that are identical or functionally similar are emphasized in black or gray, respectively. Loops are critical homologous motifs that bind ligands for the entire Cys-loop superfamily, characterized by a Cys-13-Cys sequence. Binding occurs at interface sites between the principal (+) and complimentary (−) sides of adjacent subunits.
Expression of GABAAR β3 in cultured striatal neurons
Considering that the alignment of putative extracellular neurotransmitter regions revealed 51% homology between mammalian β3 and DA-gated invertebrate LGC-53 channels (Fig. 1), we next asked how DA might interact with β3 in the brain. This question was approached with evidence that striatal MSNs express GABAARs that require β3 to gate tonic currents (Janssen et al., 2009, 2011). In addition, MSNs make up 90–95% of the rodent striatal neuron population and these neurons in particular are major output targets for DA terminals (Tritsch and Sabatini, 2012). Therefore, it was hypothesized that neurons from primary striatal cultures would express β3-containing GABAARs with the potential to be direct targets of DA.
Between 11 and 15 d after plating, numerous striatal neurons with many extensive processes were readily visualized by DIC microscopy. The morphological complexity of these neurons (Fig. 2A) resembled examples reported in the literature for striatal cultures (Ventimiglia et al., 1995; Penrod et al., 2011). On day 12, neurons were immunolabeled for the GABAAR β3 subunit and costained with DAPI to label cell nuclei (Fig. 2B). In striatal neuron cultures, strong immunofluorescence corresponding to β3 was observed in 79 ± 3% of cells (n = 3 separate assays), suggesting high levels of endogenous expression. Most β3-positive neurons were approximately symmetrical, with many processes; these neurons exhibited strong fluorescence at the soma with slightly weaker staining in processes (Fig. 2B). Furthermore, β3-positive neurons appeared to be randomly interspersed with weakly labeled or unlabeled neurons (data not shown). Control slides (for which the anti-β3 primary antibody was omitted) were devoid of fluorescence.
Figure 2.

Primary striatal cultures endogenously express the GABAAR β3 subunit. A, DIC image showing typical morphology of cultured neurons. B, Same field demonstrating β3 immunofluorescence in both processes and soma. Scale bars, 25 μm.
Modulatory effects of DA on native and recombinant GABAARs
Striatal GABAARs are generally located at postsynaptic regions of inhibitory symmetric synapses, for which a surprising fraction (∼40%) may not contain presynaptic GABA (Fujiyama et al., 2000). In addition, presynaptic TH staining (indicating the presence of DA) is overwhelmingly prevalent at striatal inhibitory symmetric synapses (as opposed to excitatory asymmetric synapses; Pickel and Chan, 1990). However, DA GPCRs are mainly present in perisynaptic regions (Yung et al., 1995). These findings suggest that striatal GABAARs instead of D1–5 may experience high concentrations of DA (and perhaps not even GABA) achieved transiently during synaptic/phasic release (Garris et al., 1994).
We first asked whether cultured striatal neurons elicit currents upon fast local perfusion of GABA (at low, tonic levels) and, if so, whether DA (at synaptic/phasic levels) can modulate these currents. Whole-cell patch-clamp recordings were done in the presence of external TTX and internal Cs+ to minimize confounding channel effects and transmitter release. If neurons had stable baselines (75% of attempted whole-cell recordings), then inward currents from 2 s pulses of GABA (1 μm) were always observed (mean, −706 ± 93 pA; n = 16 cells). Figure 3A shows rapid exchange rates for GABA onset [i; median τ = 81.6 (25th–75th percentile, 80.9–93.4 ms)] and washoff [iv; τ = 53.2 (48.4–57.1 ms)], as expected for LGICs. In 15 of 16 neurons, a 2 s pulse of DA (0.1–10 mm) applied in the middle of a 6 s GABA pulse inhibited GABA-evoked currents (Fig. 3A; quantified in Fig. 3I); the remaining neuron (excluded from analyses) displayed a small amount of potentiation at DA concentrations <10 mm. Inhibition resulting from DA onset (1 mm) in the presence of GABA (ii) was rapid [median τ = 170 (144–222 ms)] but slower than the onset of GABA alone. Upon termination of DA (iii), DA-mediated inhibition quickly ceased [τ = 68.1 (55.7–230 ms)]. For all response exchange analyses, n = 8 neurons.
Next, we questioned the origin of DA inhibition. Over the course of recording from a single neuron (ranging from 3 to 10 min), no obvious rundown of GABA current amplitudes or DA inhibition occurred. In addition, GABA currents reversed at 0 mV as expected from recording conditions having equimolar external/internal chloride (Fig. 3B; see Materials and Methods), and DA-mediated inhibition was equally effective at +40 or −60 mV. For GABA alone or GABA+DA, mean I = −779 ± 134 or −490 ± 92.8 pA (at −60 mV, 63% of GABA alone); and 454 ± 99.5 or 307 ± 77.8 pA (at +40 mV, 68% of GABA alone), respectively. Separate repeated-measures t tests determined p = 0.0005 (at −60 mV; n = 8 cells) or p = 0.0048 (at +40 mV; n = 5 cells) for GABA+DA compared with GABA (alone).
Third, we asked whether DA inhibition of GABA-evoked currents in striatal neurons changes at higher GABA concentrations approximating synaptic GABAAR EC50 values. DA (1 mm) inhibition was still seen at 3 and 10 μm GABA (Fig. 3C), but inhibition relative to GABA current amplitudes (dotted lines) decreased as GABA concentration was increased (Fig. 3D). One-way ANOVA showed significance by concentration (p < 0.0001; n ≥ 9 cells per group; F(2,30) = 29.5), and Tukey's multiple-comparisons test confirmed differences among all groups (p ≤ 0.01).
If neurons express GABAARs that are sensitive to DA inhibition, then our observations should be reproducible in cells expressing the appropriate recombinant receptors. HEK293 cells were used to transiently express rat cDNAs encoding individual subunits to generate four different GABAAR subunit combinations, which were each tested separately. These subunit combinations were selected based on the overall high brain expression of the α1 subunit (Sieghart and Sperk, 2002), striatal expression (Wisden et al., 1992; Pirker et al., 2000), and the likelihood that they may act in extrasynaptic (α1β3 and α5β3γ2) or synaptic (α1β2γ2 and α1β3γ2) capacities in vivo (Olsen and Sieghart, 2008). Currents evoked by GABA (1 μm) were inhibited by DA in cells transfected with α1β3 or α1β2γ2 (Fig. 3E,F) but were variably enhanced in α1β3γ2-containing or α5β3γ2-containing cells (Fig. 3G,H). In the presence of 1 mm DA, GABA-evoked amplitudes were inhibited by 40 ± 4% (neuron; IC50 = 1.5 ± 0.3 mm), 29 ± 2% (α1β3; IC50 = 2.7 ± 0.4), or 18 ± 4% (α1β2γ2; IC50 = 5.1 ± 1.2; Fig. 3I; n = 8 cells/subtype). On the other hand, GABA currents appeared to be potentiated by 9 ± 7% (α1β3γ2; n = 8) or 22 ± 4% (α5β3γ2; n = 8) in the presence of DA (1 mm). Two-way ANOVA of Figure 3I gave p < 0.0001 (n ≥ 7 cells per point) for comparisons by interaction (F(24,245) = 15.2), concentration (F(4,245) = 210), and subtype (F(6,245) = 182). Comparing GABA (alone) versus GABA+DA current amplitudes, Tukey's tests gave p ≤ 0.01 for neurons (or for α1β3/α1β2γ2) at individual DA concentrations ≥0.3 mm (or ≥1 mm). The same tests demonstrated that all subtypes except α1β3 differed from neurons when DA concentrations exceeded 0.1 mm.
Direct effects of DA on native and recombinant GABAARs
In the course of testing DA inhibition, we observed that application of DA alone surprisingly could evoke currents in HEK293 cells transfected with α1β2γ2, α5β3γ2, or α1β3γ2, but not in striatal neurons (n = 14) or α1β3 (Fig. 4A). As with GABA, DA-evoked currents were inward, as expected from the recording conditions, and showed rapid on/off kinetics. DA response amplitudes for transfected cells clamped at −80 mV (n = 8 per group) were −30 ± 6.22 pA (α1β3), −229 ± 76.4 pA (α1β2γ2), −497 ± 78.6 pA (α5β3γ2), or −517 ± 120 pA (α1β3γ2). One-way ANOVA determined significant effects by subtype (p < 0.0001; F(5,54) = 20.1), and Dunnett's multiple-comparisons test confirmed subtype differences. Given that the largest responses were from α1β3γ2, and that the α1 subunit is ubiquitous in the brain (Wisden et al., 1992; Sieghart and Sperk, 2002), α1β3γ2 became the focus for many experiments in the present study.
Figure 4.
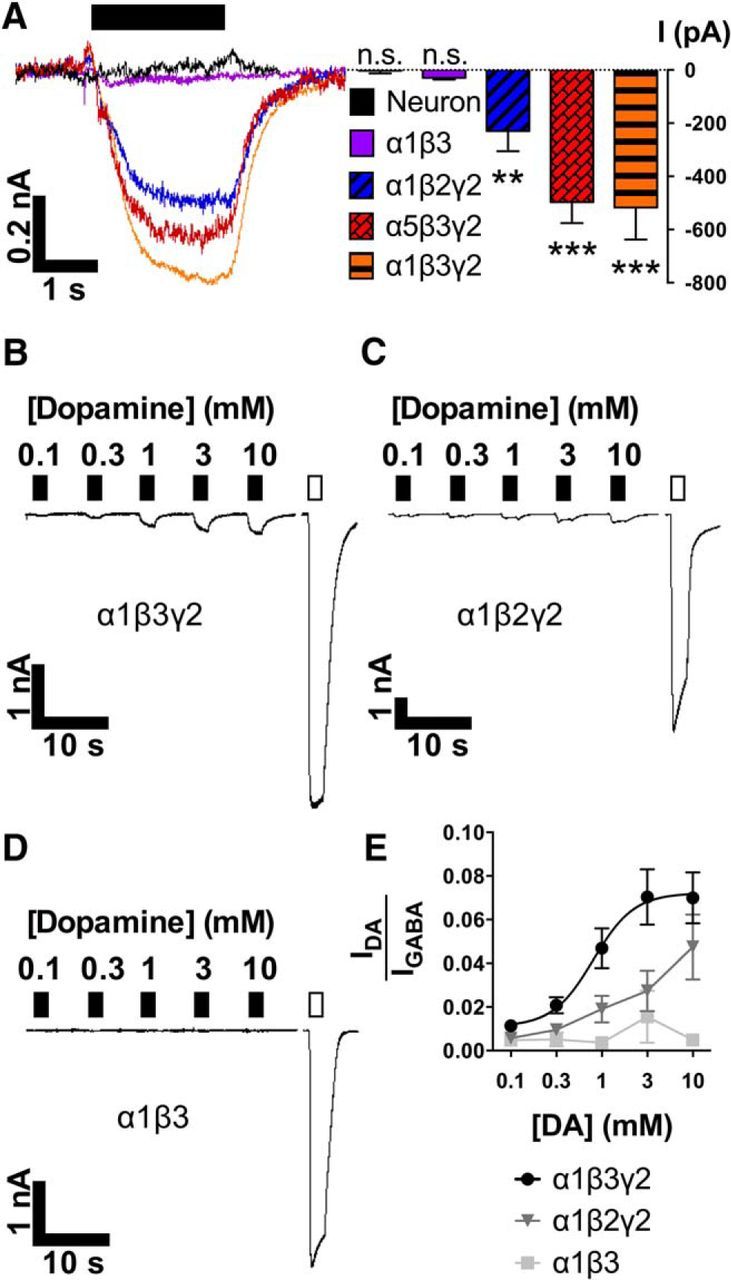
DA activates γ subunit-containing recombinant GABAARs. A, Traces (left) and quantitative analysis (right; mean ± SEM) of currents evoked by DA alone (1 mm, filled bar) in untransfected neurons or transfected HEK293 cells. **p < 0.01, ***p < 0.001. B–D, Traces depicting concentration–response curves for DA (0.1–10 mm, filled bars) and supramaximal GABA (0.1 mm, unfilled bar) according to transfected subtype. E, Mean ± SEM for DA-evoked amplitudes compared with GABA amplitudes in individual cells.
We next determined the effects of a range of DA concentrations (0.1–10 mm, compared with supramaximal GABA) acting on cells transfected with different sets of subunits. For α1β3γ2 (Fig. 4B), DA elicited concentration-dependent currents with minimum (zero) amplitudes at ∼0.1 mm and maximal amplitudes at 3–10 mm. Responses demonstrated low efficacy corresponding to 7.2 ± 2% of saturating GABA currents and EC50 = 804 μm (95% confidence from 359 to 1798 μm), with nH = 1.94 (n ≥ 12 cells per point; Fig. 4E). In comparisons between GABAAR subtypes, two features were observed that characterized DA activation: the presence of the β3 subunit was preferred over β2 (Fig. 4C,E) and the γ2 subunit was required (Fig. 4D,E). Two-way ANOVA (n ≥ 6 cells per point) gave the following results: interaction (p = 0.039; F(8,126) = 2.12), concentration (p < 0.0001; F(4,126) = 7.6), and subtype (p < 0.0001; F(2,126) = 21.2). Dunnett's multiple comparisons confirmed that α1β3 averages differ from α1β3γ2 (p ≤ 0.01 at 1, 3, and 10 mm) and α1β2γ2 (p ≤ 0.01 at 10 mm).
Optimization of β3-containing GABAARs: removal of Zn2+ inhibition
After confirming the importance of the β3 subunit for DA activation, we sought to more thoroughly characterize its role. Experiments with β3 showed some variability (Fig. 4E), and others have demonstrated that receptors containing β3 are susceptible to inhibition by Zn2+ at trace concentrations (≥10 nm; Wooltorton et al., 1997). Additionally, Zn2+ interaction is a common feature for many LGICs (Smart et al., 1994). A key Zn2+-binding β3 residue is H267, located at the extracellular mouth of the channel pore, which can coordinate Zn2+ independently in individual subunits to block channel responses (Wooltorton et al., 1997; Alberts et al., 1998). To overcome possible variability in our results from trace Zn2+ contamination, we generated the mutant Zβ3 (Fig. 5A), which is ∼1000-fold less sensitive to Zn2+ (Dunne et al., 2002). For wild-type and mutant, GABA potencies were similar [EC50 = 5.8 ± 0.8 μm (α1β3γ2) or 4.5 ± 0.7 μm (α1Zβ3γ2)], as were the calculated Hill coefficients [nH = 1.8 ± 0.2 (α1β3γ2) or 1.9 ± 0.3 (α1Zβ3γ2); Fig. 5B]. Two-way ANOVA (n ≥ 6 cells per point) gave the following effects of interaction (p = 0.33; F(6,121) = 1.17), concentration (p < 0.0001; F(6,121) = 341), and mutation (p = 0.002; F(1,121) = 9.61) although Bonferroni's multiple comparisons revealed no significance at each individual concentration. Compared with Figure 4 data, the Zβ3 mutation did not generally affect DA gating (Fig. 5C), and the γ2 subunit remained necessary for DA activity. However, the mutation increased DA efficacy (at 10 mm) from 7.2 ± 2% (for α1β3γ2; Fig. 4E) to 14 ± 2% of maximal GABA (for α1Zβ3γ2; Fig. 5C). Repeated-measures two-way ANOVA (n ≥ 7 cells per point) showed significant differences for interaction (p < 0.0001; F(3,69) = 11), concentration (p < 0.0001; F(3,69) = 13.1), presence of γ2 (p = 0.004; F(1,23) = 10), and matching (p < 0.0001; F(23,69) = 20).
Figure 5.
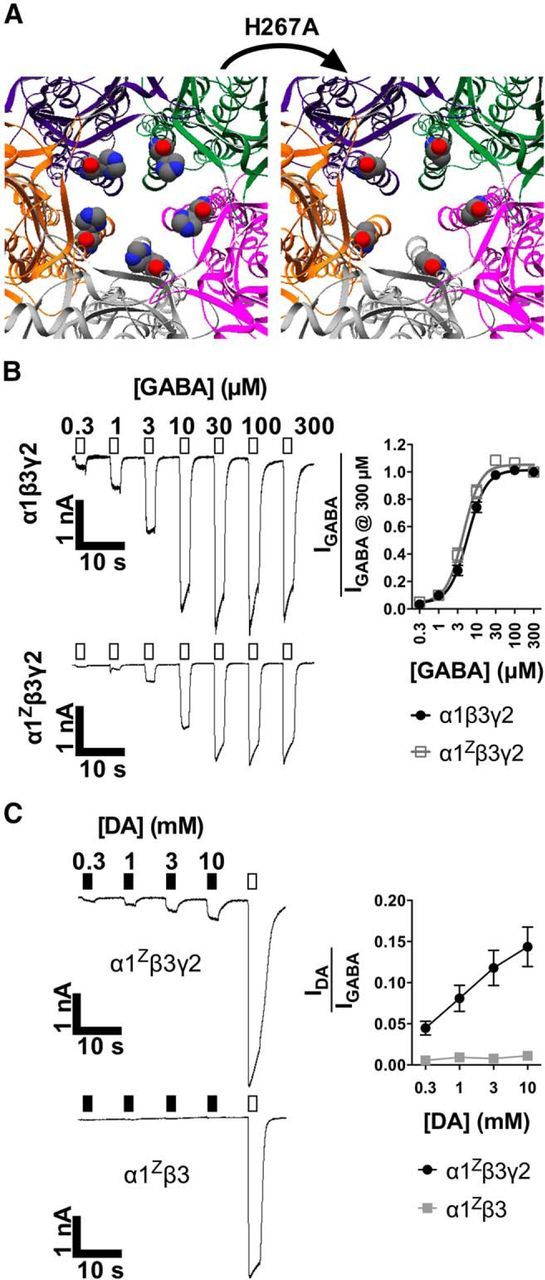
GABA and DA function is preserved in receptors with Zβ3 subunits. A, Close-up overhead views of the human β3 homopentamer channel pore emphasizing H267 or H267A (space-filling models). Note the presence (left) and absence (right) of Zn2+-coordinating imidazole side chains. B, Traces and quantitative analysis of GABA concentration–response curves in cells transfected with α1β3γ2 or α1Zβ3γ2 receptors. The plot shows mean ± SEM for GABA-evoked amplitudes compared with 300 μm. C, Traces and analysis of concentration–response curves for DA (filled bars) compared with GABA (0.1 mm, unfilled bars) in α1Zβ3γ2-transfected or α1Zβ3-transfected cells. Quantified data represent mean ± SEM for evoked currents from DA compared with GABA.
DA-gated channels composed only of GABAAR β3 and γ2 subunits
Thus far, our results indicated that β and γ subunits (but not necessarily α subunits) determine the extent of DA activation (Figs. 4, 5). Moreover, in experiments overexpressing α1 relative to β3 and γ2 subunits, we observed greatly reduced DA-evoked currents (data not shown). Therefore, we explored the hypothesis that α may not be needed for DA gating. This type of phenomenon occurs for Pb, histamine, and benzamidine at β3 homopentamers (Cestari et al., 1996; Saras et al., 2008; Miller and Aricescu, 2014). We found that the α subunit was indeed unnecessary for the formation of GABAARs consisting only of Zβ3 and γ2 subunits, which were activated mainly by DA and Pb (Fig. 6A). Wild-type β3γ2 receptors were similarly gated by both DA (0.1–10 mm) and Pb (0.1 mm; n = 7; traces not shown, but data quantified in Fig. 6B,C). Others have also observed Pb-evoked activation of β3γ2 receptors that were shown to be pharmacologically distinct from β3 homomers (Taylor et al., 1999). Expressed alone, neither Zβ3 nor γ2 could generate receptors gated by DA, although Pb robustly activated Zβ3 receptors, as expected (Fig. 6A; Cestari et al., 1996). Notably, Pb responses also had slower onset in Zβ3γ2 compared with Zβ3. All tested compounds failed to elicit detectable currents (>50 pA) in cells transfected with γ2 only (n = 11).
Figure 6.
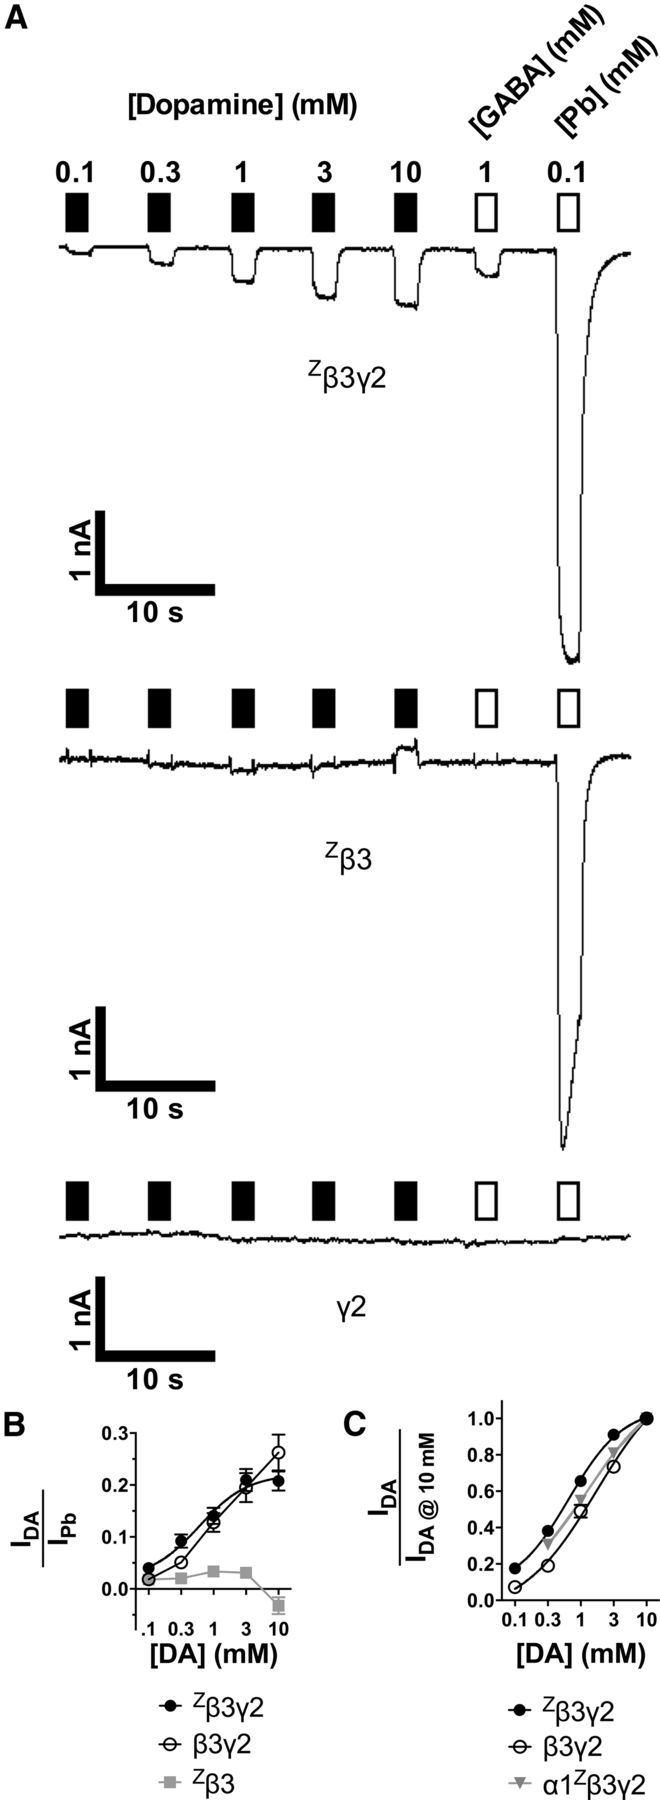
GABAARs composed only of β3 and γ2 subunits are DA-gated ion channels. A, Typical traces demonstrating currents evoked by DA (filled bars), GABA or Pb (unfilled bars) applied to cells transfected with Zβ3γ2 (top), Zβ3 (middle), or γ2 (bottom). B, Mean ± SEM for current amplitudes elicited by DA compared with 0.1 mm Pb in individual cells. C, Concentration–response curves (mean ± SEM) for DA activation in cells transfected with Zβ3γ2, wild-type β3γ2, or α1Zβ3γ2. Responses are normalized to current amplitudes from 10 mm DA in individual cells.
DA could evoke currents in Zβ3γ2-expressing cells that were 22 ± 3% of Pb current amplitudes (n ≥ 28 cells per point; Fig. 6B). However, in cells transfected with Zβ3 alone, the largest inward DA-generated currents were only 3 ± 1% of Pb amplitudes, and 10 mm DA appeared to elicit small inverse responses (−3 ± 2% compared with Pb; n = 8 cells per point; Fig. 6A,B). Likewise, cells expressing wild-type β3γ2 receptors demonstrated 10 mm DA-evoked currents that were 26 ± 4% of Pb amplitudes (n = 7 cells per point; Fig. 6B). Two-way ANOVA of Figure 6B with Bonferroni's multiple comparisons showed significant effects of interaction (p < 0.0001; F(8,227) = 5.1), concentration (p < 0.0001; F(4,227) = 14.1), and presence of γ2 (p < 0.0001; F(2,227) = 40.3), with individual differences between Zβ3γ2 and Zβ3 at [DA] = 1, 3, and 10 mm. Figure 6C compares the concentration dependence of DA activation of Zβ3γ2 or α1Zβ3γ2 receptors. For Zβ3γ2, DA EC50 = 660 μm (n ≥ 28 cells per point; R2 = 0.94; 95% confidence from 539 to 808 μm) with nH = 1.05. Similar apparent EC50 values were reported for DA responses from cells transfected with wild-type β3γ2 (1.7 mm; n = 7) or α1Zβ3γ2 (1.3 mm; n = 18).
DA as an agonist of spontaneously active GABAARs
Based on our observations that DA binds to non-α subunit interfaces to activate GABAARs (Fig. 6), we examined whether antagonists that bind at the β+α− GABA pocket (BIC and GBZ; Ueno et al., 1997), and the ligand-gated chloride channel blocker PTX inhibit DA actions. Current amplitudes were recorded for compounds applied alone, in combination with DA, or following compound washoff (with DA remaining in perfusion; Fig. 7). Acting alone on α1Zβ3γ2-transfected cells, we observed that BIC, GBZ, and PTX all produced apparently inverse (outward) currents compared with DA (Fig. 7A–D). This implies that these antagonists block a population of spontaneously active GABAAR channels. Similar outward currents were seen in wild-type α1β3γ2-transfected cells (n = 7): 10 μm antagonist-evoked amplitudes (normalized to DA at −1) had mean values of +0.37 (BIC), +0.44 (GBZ), or +0.53 (PTX). Spontaneous gating has been observed for α1β3γ2 (McCartney et al., 2007), but its appearance seems more robust in β3 homomultimers (Saras et al., 2008) or ε-containing GABAARs (Neelands et al., 1999).
Interestingly, BIC evoked inward currents (41 ± 4% of DA amplitudes) in cells containing Zβ3γ2 receptors (Fig. 7E,H) whereas GBZ and PTX both generated inverse (outward) currents on their own (Fig. 7F–H). Wild-type β3γ2 receptors elicited similar responses (n = 5 cells): compared with DA (normalized at −1), 10 μm of each drug produced mean values of −0.24 (BIC), +0.55 (GBZ), or +0.60 (PTX). In general, BIC and GBZ washed out more easily than PTX (Fig. 7). Although we used antagonist concentrations that tend to fully inhibit GABAAR currents in conventional α-containing receptors (Ueno et al., 1997, Krishek et al., 1996), BIC and GBZ did not fully block both spontaneous and DA-evoked inward currents (Fig. 7; Table 1). For all groups in Figure 7, n ≥ 6 cells, and Figure 7I depicts statistical comparisons made between these groups in Table 1.
Table 1.
| α1Zβ3γ2 | Drug alone | Drug + DA | Wash | Zβ3γ2 | Drug alone | Drug + DA | Wash |
|---|---|---|---|---|---|---|---|
| BIC | ****/†††† | §§§§/†††† | Not significant | BIC | ****/†††† | §§§§/†† | Not significant |
| GBZ | ****/†††† | §§§§/†††† | Not significant | GBZ | ****/†††† | §§§§/†††† | Not significant |
| PTX | ****/†††† | Not significant/†††† | ††† | PTX | **/†††† | Not significant/†††† | †††† |
aSummary of statistical significance for GABAA antagonists modulating α1Zβ3γ2 (Fig. 7D) or Zβ3γ2 (Fig. 7H) receptors. Columns represent drug perfused alone (black bars from figure), drug applied with DA (hatched bars), or drug washoff with DA still present (white bars). Compounds were segregated by subtype and separately analyzed in one-way ANOVAs. Symbols show p values calculated within each ANOVA from Bonferroni's tests comparing data to baseline (*), DA (†), or drug alone (§; Fig. 7I). The correspondence between number of symbols and significance is as follows: 1, p ≤ 0.05; 2, p ≤ 0.01; 3, p ≤ 0.001; 4, p ≤ 0.0001.
In addition, Zn2+ alone (at 1 mm) generated robust inverse (outward) currents in cells transfected with either Zβ3γ2 or β3γ2 (n ≥ 6; data not shown), similarly to GBZ (Fig. 7F). This confirms that β3γ2-transfected cells express spontaneously active receptors, and the Zβ3γ2 result is not unusual since the Zβ3 mutation (H267A) fails to prevent inhibition from Zn2+ at concentrations > 10 μm (Wooltorton et al., 1997). Other investigators have also found that PTX and Zn2+ block spontaneous currents in wild-type β3γ2 receptors (Taylor et al., 1999).
In cells transfected with Zβ3γ2, spontaneous gating and DA activity were almost always present. However, DA activity as a function of GABA current amplitudes varied in cells transfected with α1Zβ3γ2 (Fig. 5C), and spontaneous gating seemed to predict DA activity. Thus, we asked whether DA might be an agonist only at subpopulations of spontaneously active GABAARs that favor the inclusion of β and γ subunits over α subunits. If true, current amplitudes from antagonists (each at 10 μm unless noted) should correlate inversely with amplitudes from DA (at 1 mm) on a cell-by-cell basis. In cells transfected with α1Zβ3γ2, there were strong inverse relationships for DA versus BIC (r = −0.97, r2 = 0.94, p < 0.0001, n = 23), GBZ (r = −0.99, r2 = 0.97, p < 0.0001, n = 24), and PTX (r = −0.86, r2 = 0.74, p < 0.0001, n = 20) using Pearson parametric two-tailed correlation tests. In the same tests for Zβ3γ2, such relationships were determined for GBZ (r = −0.96, r2 = 0.93, p < 0.0001, n = 10), 1 mm Zn2+ (r = −0.80, r2 = 0.63, p = 0.006, n = 10), and PTX (r = −0.76, r2 = 0.57, p = 0.003, n = 13). Likewise, Pearson tests revealed inverse correlations for wild-type α1β3γ2 receptors with DA versus BIC (r = −0.93, r2 = 0.87, p = 0.0022, n = 7), GBZ (r = −0.97, r2 = 0.94, p = 0.0004, n = 7), and PTX (r = −0.93, r2 = 0.87, p = 0.0020, n = 7). For wild-type β3γ2, inverse relationships were present for GBZ (r = −0.94, r2 = 0.89, p = 0.016, n = 5), 1 mm Zn2+ (r = −0.98, r2 = 0.96, p = 0.004, n = 5), and PTX (r = −0.92, r2 = 0.85, p = 0.026, n = 5). As such, DA's ability to activate GABAARs depended on both spontaneous activity and the presence of β and γ subunits.
Interactions of other biogenic amines with DA-gated GABAARs
If DA can activate receptors in cells transfected with α1Zβ3γ2, might other biogenic amines be equally or more effective? We investigated this question using lone applications of l-DOPA, DOPAC, homovanillic acid, tyramine, octopamine, norepinephrine, epinephrine, choline, ACh, tryptamine, or 5-HT (each at 1 mm; n ≥ 7 cells per compound). These amines produced variable responses that were always less than same-cell currents evoked by DA (1 mm). One-way ANOVA with Dunnett's multiple comparisons to DA confirmed that none of the tested amines were as active as DA (p ≤ 0.0001 for all compounds).
Discussion
This report indicates that DA is a novel direct-acting modulator of mammalian GABAARs, and β3 subunits appear to be pivotal for this modulation. Initial reasons to consider β3 as a possible DA target included its homology to LGC-53, strong striatal expression, and ability to form homomultimers gated by non-GABA bioamines like histamine (for review, see Saras et al., 2008; Seeger et al., 2012; Fleck et al., 2012).
DA-mediated inhibition
Nearly 80% of cultured striatal cells robustly expressed the β3 subunit, and synaptic/phasic levels of DA inhibited tonic-level GABA-evoked currents in >90% of neurons. The fast on/off kinetics of DA effects (<200 ms) implicate direct channel interactions and not GPCRs or enzymatic receptors (Lohse et al., 2008). The DA concentrations required to induce the weakest GABAAR inhibition would saturate all known DA GPCRs (Missale et al., 1998). Furthermore, DA did not block the GABAAR channel pore: when the membrane potential was reversed from negative to positive such that the cationic DA should have been repelled, DA inhibition was unabated. This contrasts with DA's ability to block NMDA channels in a voltage-dependent manner via the polyamine site (Castro et al., 1999; Kotecha et al., 2002; Masuko et al., 2004; Cui et al., 2006). In addition, higher GABA concentrations reduced DA inhibition, implying a pseudocompetitive, use-independent mechanism. However, the fact that DA activated GABAARs that lacked α subunits instead of causing inhibition favors a theory that DA exerts subunit-dependent effects at extracellular ligand-binding interfaces.
Although ρ subunits are likely unsung players in striatal GABAAR signaling (Rosas-Arellano et al., 2012), it is doubtful that these subunits contributed to GABA currents seen presently. DA inhibits exogenous GABAAR ρ1 homomultimers (Ochoa-de la Paz et al., 2012), but the inhibition IC50 (210 μm) was sevenfold more potent than we observed in neurons or recombinant subtypes (≥1.5 mm). In contrast to the present results, Ochoa-de la Paz et al. (2012) found that 1 mm DA did not inhibit α1β2γ2 receptors. This disagreement could have resulted from differences in expression system, receptor subpopulations, or GABA concentrations. However, in terms of β subunits, the DA-mediated inhibition we observed may be from β1 and not β3 (β2 appears not to be expressed in MSNs; Flores-Hernandez et al., 2000). Nonetheless, we showed robust β3 expression on neuronal processes, and MSN dendrites strongly express β3 over other β subunits (Pirker et al., 2000, Schwarzer et al., 2001), suggesting a likely role for β3 in currents presently evoked by GABA. Our finding that DA blocked α1β2γ2-mediated currents implies that DA might also inhibit tonic GABA signaling via non-β3-containing synaptic-type receptors throughout the brain (Brickley and Mody, 2012).
DA-mediated activation
Surprisingly, DA was found here to potentiate or directly elicit currents in αβ3γ2-transfected cells. From this, we infer that receptors with β3 and γ2 can assemble to generate DA-activated receptors. The finding that DA-induced potentiation was higher in α5-containing compared with α1-containing receptors suggests that the α subunit may differentially gate the modulatory effects. Others have shown that extrasynaptic-type α5β3γ2 receptors may drive D2-MSN tonic currents, while synaptic-type α1β3γ2 receptors probably do not (Ade et al., 2008). Presently, DA inhibited α1β3 receptors (which may exist extrasynaptically; Olsen and Sieghart, 2008) in contrast to α5β3γ2 receptors, suggesting that tonic GABA currents might have dissimilar subtype-dependent modulation by DA. Since D1 MSNs and D2 MSNs express different extrasynaptic GABAAR populations (Ade et al., 2008), this distinction might underlie physiological differences between these cell populations in health or in PD (Mallet et al., 2006; Gerfen and Surmeier, 2011). Adding to the complexity, D1 MSNs evoke greater GABAAR δ-subunit-mediated tonic currents after DA GPCR stimulation compared with D2 MSNs (Maguire et al., 2014), but D2 MSNs show higher tonic currents in developing neurons (from basally phosphorylated β3 subunits) than D1 MSNs (Janssen et al., 2009).
Requirements for DA gating
DA reliably evoked currents in cells without α1 subunits (but with β3 and γ2) similarly to those containing α1. However, in α1-expressing cells, GABA-evoked currents were consistently robust but DA responses were variable. Furthermore, DA did not evoke currents in cultured striatal neurons, even though these neurons probably contain heterotrimeric receptors composed of α, β3, and γ2 subunits (Pirker et al., 2000; Olsen and Sieghart, 2008; present work). We also observed DA gating in wild-type (α1)β3γ2 receptors and receptors designed to minimize confounding trace Zn2+ inhibition through a β3 H267A mutation [(α1)Zβ3γ2]. Together, these results suggest that DA activation may occur in native receptor subpopulations that have fewer than the usual two α subunits per receptor complex. As such, the fact that DA did not inhibit GABA-evoked currents in αβ3γ2-transfected cells must be interpreted with the caveat that DA might activate such subpopulations in addition to any simultaneous effects on canonical αβγ (with 2:2:1 subunit stoichiometry; Baumann et al., 2001). While speculative, it may be possible for native receptor subpopulations to intermittently lack α subunits, as (for example) 6-OHDA-lesioned rats have fluctuating striatal expression levels of α1/2 but not β2/3 subunits (Caruncho et al., 1997).
Further investigations with (α1)Zβ3γ2 receptors revealed several interesting features. Zβ3γ2 (or wild-type β3γ2) had spontaneous activity blocked by PTX or high concentrations of Zn2+, and were activated by Pb, in agreement with a previous study that described β3γ2 (Taylor et al., 1999). The presently observed inhibitory effects of GBZ and activation by BIC, however, have not been reported for β3γ2. These results corroborate the interpretation that GABAAR competitive antagonists are allosteric modulators (Ueno et al., 1997). Moreover, the finding that BIC blocked spontaneous activity in α1Zβ3γ2-transfected cells (like GBZ) demonstrates that constitutively active channels in these cells express ≥1α subunit per pentameric complex. Thus, BIC is a competitive allosteric inhibitor of α-containing GABAARs that blocks spontaneous gating activity even without GABA present. Conversely, BIC is a positive modulator of non-α-containing receptors. Since DA activity in (α1)Zβ3γ2 and (α1)β3γ2 receptors showed strong correlations to spontaneous gating inhibition by GBZ and Zn2+ (and BIC when α1 was present), we suspect that DA acts as a positive modulator at the GABAAR γ/β interface.
Although GABAAR spontaneous gating is more often associated with β3 homomultimers (Saras et al., 2008) or ε-containing receptors (Neelands et al., 1999), such activity has been reported for α1β3γ2 (McCartney et al., 2007). In agreement with our results, these investigators revealed that BIC and Zn2+ could block α1β3γ2-mediated spontaneous currents. However, McCartney et al. (2007) also observed that GBZ lacked negative efficacy (in contrast to our data). The reason for this discrepancy is unclear, but it may be related to unknown differences in cDNA constructs or the resulting subpopulations produced in HEK293 cells. These subpopulations may consist of receptors with less than the canonical two α subunits per complex, as discussed previously in the context of DA modulation. Furthermore, since α1β3γ2-evoked spontaneous currents were similar in absolute magnitude to DA currents, it should be noted that the effect of spontaneous opening in these receptors would be relatively small (5–10% of maximal GABA current amplitude).
DA selectivity and relevance
The idea that some biogenic amines other than DA might also activate GABAARs is not extraordinary, given that tyramine, octopamine, choline, ACh, and 5-HT activate known Cys-loop homologs (Kilpatrick et al., 1990; Alkondon et al., 1997; Pirri et al., 2009; Ringstad et al., 2009; Changeux, 2012). However, upon screening a battery of biogenic amines, DA produced the largest relative α1Zβ3γ2-mediated responses, suggesting that DA may be a preferred GABAAR modulator. Although all amines were tested at 1 mm, it is unknown if many reach this level in vivo. DA concentrations, however, have been estimated to reach 1.6 mm transiently in the synaptic cleft during phasic release (Garris et al., 1994), similar to fast amino acid neurotransmitters (Barberis et al., 2011). Additionally, dopaminergic firing has a low failure rate and is rapidly detected postsynaptically (in <5 ms; Garris et al., 1994; Kress et al., 2014). Thus, the range of active concentrations tested presently (0.1–10 mm) corresponds to estimates of synaptic/phasic DA concentrations during real-time release.
Implications for neural activity
Overall, this study establishes novel mechanisms for DA as a direct modulator of GABAARs. These findings might be most relevant at potential DA release sites where β3 subunits coexist with low tonic levels of GABA, and not at sites that corelease GABA and DA (Tritsch et al., 2012, 2014). Also, improper dopaminergic control of tonic GABA currents (through direct GABAAR modulation) could contribute to PD, addiction, or cognitive illnesses, a hypothesis to be examined in future studies. Given the multiplicity and ubiquity of GABAARs in the brain, it might be clinically useful to pursue selective drugs that take advantage of DA–GABAAR interactions.
Footnotes
This work was supported by Albany Medical College. Support for neuron culture experiments was provided by the Thelma P. Lally Endowment for Neuroscience Education (to T.A.L.). We thank Dr. Rick Keller for helpful comments on the manuscript, Dr. Jun Yang for assistance with mutagenesis, Ellinor Grinde for help with HEK293 cells, and Dr. Lindsay Hough for support with experimental design. A version of this work was presented at the 2014 Society for Neuroscience annual meeting (abstract #782.05/B25).
The authors declare no competing financial interests.
References
- Ade KK, Janssen MJ, Ortinski PI, Vicini S. Differential tonic GABA conductances in striatal medium spiny neurons. J Neurosci. 2008;28:1185–1197. doi: 10.1523/JNEUROSCI.3908-07.2008. [DOI] [PMC free article] [PubMed] [Google Scholar]
- Alberts IL, Nadassy K, Wodak SJ. Analysis of zinc binding sites in protein crystal structures. Protein Sci. 1998;7:1700–1716. doi: 10.1002/pro.5560070805. [DOI] [PMC free article] [PubMed] [Google Scholar]
- Alkondon M, Pereira EF, Cortes WS, Maelicke A, Albuquerque EX. Choline is a selective agonist of alpha7 nicotinic acetylcholine receptors in the rat brain neurons. Eur J Neurosci. 1997;9:2734–2742. doi: 10.1111/j.1460-9568.1997.tb01702.x. [DOI] [PubMed] [Google Scholar]
- Altschul SF, Madden TL, Schäffer AA, Zhang J, Zhang Z, Miller W, Lipman DJ. Gapped BLAST and PSI-BLAST: a new generation of protein database search programs. Nucleic Acids Res. 1997;25:3389–3402. doi: 10.1093/nar/25.17.3389. [DOI] [PMC free article] [PubMed] [Google Scholar]
- Barberis A, Petrini EM, Mozrzymas JW. Impact of synaptic neurotransmitter concentration time course on the kinetics and pharmacological modulation of inhibitory synaptic currents. Front Cell Neurosci. 2011;5:6. doi: 10.3389/fncel.2011.00006. [DOI] [PMC free article] [PubMed] [Google Scholar]
- Baumann SW, Baur R, Sigel E. Subunit arrangement of gamma-aminobutyric acid type A receptors. J Biol Chem. 2001;276:36275–36280. doi: 10.1074/jbc.M105240200. [DOI] [PubMed] [Google Scholar]
- Belelli D, Harrison NL, Maguire J, Macdonald RL, Walker MC, Cope DW. Mini-Symposium: extrasynaptic GABAA receptors: form, pharmacology, and function. J Neurosci. 2009;29:12757–12763. doi: 10.1523/JNEUROSCI.3340-09.2009. [DOI] [PMC free article] [PubMed] [Google Scholar]
- Brickley SG, Mody I. Extrasynaptic GABA(A) receptors: their function in the CNS and implications for disease. Neuron. 2012;73:23–34. doi: 10.1016/j.neuron.2011.12.012. [DOI] [PMC free article] [PubMed] [Google Scholar]
- Caruncho HJ, Liste I, Rozas G, López-Martín E, Guerra MJ, Labandeira-García JL. Time course of striatal, pallidal and thalamic alpha 1, alpha 2 and beta 2/3 GABAA receptor subunit changes induced by unilateral 6-OHDA lesion of the nigrostriatal pathway. Brain Res Mol Brain Res. 1997;48:243–250. doi: 10.1016/S0169-328X(97)00097-1. [DOI] [PubMed] [Google Scholar]
- Castro NG, de Mello MC, de Mello FG, Aracava Y. Direct inhibition of the N-methyl-D-aspartate receptor channel by dopamine and (+)-SKF38393. Br J Pharmacol. 1999;126:1847–1855. doi: 10.1038/sj.bjp.0702479. [DOI] [PMC free article] [PubMed] [Google Scholar]
- Cestari IN, Uchida I, Li L, Burt D, Yang J. The agonistic action of pentobarbital on GABAA beta-subunit homomeric receptors. Neuroreport. 1996;7:943–947. doi: 10.1097/00001756-199603220-00023. [DOI] [PubMed] [Google Scholar]
- Changeux JP. The nicotinic acetylcholine receptor: the founding father of the pentameric ligand-gated ion channel superfamily. J Biol Chem. 2012;287:40207–40215. doi: 10.1074/jbc.R112.407668. [DOI] [PMC free article] [PubMed] [Google Scholar]
- Cui C, Xu M, Atzori M. Voltage-dependent block of N-methyl-D-aspartate receptors by dopamine D1 receptor ligands. Mol Pharmacol. 2006;70:1761–1770. doi: 10.1124/mol.106.028332. [DOI] [PubMed] [Google Scholar]
- Dunne EL, Hosie AM, Wooltorton JR, Duguid IC, Harvey K, Moss SJ, Harvey RJ, Smart TG. An N-terminal histidine regulates Zn(2+) inhibition on the murine GABA(A) receptor beta3 subunit. Br J Pharmacol. 2002;137:29–38. doi: 10.1038/sj.bjp.0704835. [DOI] [PMC free article] [PubMed] [Google Scholar]
- Fleck MW. Molecular actions of (S)-desmethylzopiclone (SEP-174559), an anxiolytic metabolite of zopiclone. J Pharmacol Exp Ther. 2002;302:612–618. doi: 10.1124/jpet.102.033886. [DOI] [PubMed] [Google Scholar]
- Fleck MW, Thomson JL, Hough LB. Histamine-gated ion channels in mammals? Biochem Pharmacol. 2012;83:1127–1135. doi: 10.1016/j.bcp.2011.12.011. [DOI] [PubMed] [Google Scholar]
- Flores-Hernandez J, Hernandez S, Snyder GL, Yan Z, Fienberg AA, Moss SJ, Greengard P, Surmeier DJ. D1 dopamine receptor activation reduces GABAA receptor currents in neostriatal neurons through a PKA/DARPP-32/PP1 signaling cascade. J Neurophysiol. 2000;83:2996–3004. doi: 10.1152/jn.2000.83.5.2996. [DOI] [PubMed] [Google Scholar]
- Fujiyama F, Fritschy JM, Stephenson FA, Bolam JP. Synaptic localization of GABA(A) receptor subunits in the striatum of the rat. J Comp Neurol. 2000;416:158–172. doi: 10.1002/(SICI)1096-9861(20000110)416:2<158::AID-CNE3>3.3.CO;2-C. [DOI] [PubMed] [Google Scholar]
- Garris PA, Ciolkowski EL, Pastore P, Wightman RM. Efflux of dopamine from the synaptic cleft in the nucleus accumbens of the rat brain. J Neurosci. 1994;14:6084–6093. doi: 10.1523/JNEUROSCI.14-10-06084.1994. [DOI] [PMC free article] [PubMed] [Google Scholar]
- Gerfen CR, Surmeier DJ. Modulation of striatal projection systems by dopamine. Annu Rev Neurosci. 2011;34:441–466. doi: 10.1146/annurev-neuro-061010-113641. [DOI] [PMC free article] [PubMed] [Google Scholar]
- Guex N, Peitsch MC. SWISS-MODEL and the Swiss-PdbViewer: an environment for comparative protein modeling. Electrophoresis. 1997;18:2714–2723. doi: 10.1002/elps.1150181505. [DOI] [PubMed] [Google Scholar]
- Janssen MJ, Ade KK, Fu Z, Vicini S. Dopamine modulation of GABA tonic conductance in striatal output neurons. J Neurosci. 2009;29:5116–5126. doi: 10.1523/JNEUROSCI.4737-08.2009. [DOI] [PMC free article] [PubMed] [Google Scholar]
- Janssen MJ, Yasuda RP, Vicini S. GABA(A) receptor beta3 subunit expression regulates tonic current in developing striatopallidal medium spiny neurons. Front Cell Neurosci. 2011;5:15. doi: 10.3389/fncel.2011.00015. [DOI] [PMC free article] [PubMed] [Google Scholar]
- Kaech S, Banker G. Culturing hippocampal neurons. Nat Protoc. 2006;1:2406–2415. doi: 10.1038/nprot.2006.356. [DOI] [PubMed] [Google Scholar]
- Khatri A, Weiss DS. The role of Loop F in the activation of the GABA receptor. J Physiol. 2010;588:59–66. doi: 10.1113/jphysiol.2009.179705. [DOI] [PMC free article] [PubMed] [Google Scholar]
- Kilpatrick GJ, Bunce KT, Tyers MB. 5-HT3 receptors. Med Res Rev. 1990;10:441–475. doi: 10.1002/med.2610100404. [DOI] [PubMed] [Google Scholar]
- Kotecha SA, Oak JN, Jackson MF, Perez Y, Orser BA, Van Tol HH, MacDonald JF. A D2 class dopamine receptor transactivates a receptor tyrosine kinase to inhibit NMDA receptor transmission. Neuron. 2002;35:1111–1122. doi: 10.1016/S0896-6273(02)00859-0. [DOI] [PubMed] [Google Scholar]
- Kress GJ, Shu HJ, Yu A, Taylor A, Benz A, Harmon S, Mennerick S. Fast phasic release properties of dopamine studied with a channel biosensor. J Neurosci. 2014;34:11792–11802. doi: 10.1523/JNEUROSCI.2355-14.2014. [DOI] [PMC free article] [PubMed] [Google Scholar]
- Krishek BJ, Moss SJ, Smart TG. A functional comparison of the antagonists bicuculline and picrotoxin at recombinant GABAA receptors. Neuropharmacology. 1996;35:1289–1298. doi: 10.1016/S0028-3908(96)00089-5. [DOI] [PubMed] [Google Scholar]
- Lohse MJ, Hein P, Hoffmann C, Nikolaev VO, Vilardaga JP, Bunemann M. Kinetics of G-protein-coupled receptor signals in intact cells. Br J Pharmacol. 2008;153(suppl 1):S125–S132. doi: 10.1038/sj.bjp.0707656. [DOI] [PMC free article] [PubMed] [Google Scholar]
- Lynch JW. Native glycine receptor subtypes and their physiological roles. Neuropharmacology. 2009;56:303–309. doi: 10.1016/j.neuropharm.2008.07.034. [DOI] [PubMed] [Google Scholar]
- Maguire EP, Macpherson T, Swinny JD, Dixon CI, Herd MB, Belelli D, Stephens DN, King SL, Lambert JJ. Tonic inhibition of accumbal spiny neurons by extrasynaptic α4βδ GABAA receptors modulates the actions of psychostimulants. J Neurosci. 2014;34:823–838. doi: 10.1523/JNEUROSCI.3232-13.2014. [DOI] [PMC free article] [PubMed] [Google Scholar]
- Mallet N, Ballion B, Le Moine C, Gonon F. Cortical inputs and GABA interneurons imbalance projection neurons in the striatum of parkinsonian rats. J Neurosci. 2006;26:3875–3884. doi: 10.1523/JNEUROSCI.4439-05.2006. [DOI] [PMC free article] [PubMed] [Google Scholar]
- Masuko T, Suzuki I, Kizawa Y, Kusama-Eguchi K, Watanabe K, Kashiwagi K, Igarashi K, Kusama T. Monoamines directly inhibit N-methyl-D-aspartate receptors expressed in Xenopus oocytes in a voltage-dependent manner. Neurosci Lett. 2004;371:30–33. doi: 10.1016/j.neulet.2004.08.030. [DOI] [PubMed] [Google Scholar]
- McCartney MR, Deeb TZ, Henderson TN, Hales TG. Tonically active GABAA receptors in hippocampal pyramidal neurons exhibit constitutive GABA-independent gating. Mol Pharmacol. 2007;71:539–548. doi: 10.1124/mol.106.028597. [DOI] [PubMed] [Google Scholar]
- Miller PS, Aricescu AR. Crystal structure of a human GABAA receptor. Nature. 2014;512:270–275. doi: 10.1038/nature13293. [DOI] [PMC free article] [PubMed] [Google Scholar]
- Missale C, Nash SR, Robinson SW, Jaber M, Caron MG. Dopamine receptors: from structure to function. Physiol Rev. 1998;78:189–225. doi: 10.1152/physrev.1998.78.1.189. [DOI] [PubMed] [Google Scholar]
- Moore H, West AR, Grace AA. The regulation of forebrain dopamine transmission: relevance to the pathophysiology and psychopathology of schizophrenia. Biol Psychiatry. 1999;46:40–55. doi: 10.1016/S0006-3223(99)00078-5. [DOI] [PubMed] [Google Scholar]
- Mortensen M, Iqbal F, Pandurangan AP, Hannan S, Huckvale R, Topf M, Baker JR, Smart TG. Photo-antagonism of the GABAA receptor. Nat Commun. 2014;5:4454. doi: 10.1038/ncomms5454. [DOI] [PMC free article] [PubMed] [Google Scholar]
- Neelands TR, Fisher JL, Bianchi M, Macdonald RL. Spontaneous and γ-aminobutyric acid (GABA)-activated GABAA receptor channels formed by ε subunit-containing isoforms. Mol Pharmacol. 1999;1:168–178. doi: 10.1124/mol.55.1.168. [DOI] [PubMed] [Google Scholar]
- Ochoa-de la Paz LD, Estrada-Mondragón A, Limón A, Miledi R, Martínez-Torres A. Dopamine and serotonin modulate human GABArho1 receptors expressed in Xenopus laevis oocytes. ACS Chem Neurosci. 2012;3:96–104. doi: 10.1021/cn200083m. [DOI] [PMC free article] [PubMed] [Google Scholar]
- Olsen RW, Sieghart W. International Union of Pharmacology. LXX. Subtypes of gamma-aminobutyric acid(A) receptors: classification on the basis of subunit composition, pharmacology, and function. Update. Pharmacol Rev. 2008;60:243–260. doi: 10.1124/pr.108.00505. [DOI] [PMC free article] [PubMed] [Google Scholar]
- Penrod RD, Kourrich S, Kearney E, Thomas MJ, Lanier LM. An embryonic culture system for the investigation of striatal medium spiny neuron dendritic spine development and plasticity. J Neurosci Methods. 2011;200:1–13. doi: 10.1016/j.jneumeth.2011.05.029. [DOI] [PMC free article] [PubMed] [Google Scholar]
- Petersen TN, Brunak S, von Heijne G, Nielsen H. SignalP 4.0: discriminating signal peptides from transmembrane regions. Nat Methods. 2011;8:785–786. doi: 10.1038/nmeth.1701. [DOI] [PubMed] [Google Scholar]
- Pickel VM, Chan J. Spiny neurons lacking choline acetyltransferase immunoreactivity are major targets of cholinergic and catecholaminergic terminals in rat striatum. J Neurosci Res. 1990;25:263–280. doi: 10.1002/jnr.490250302. [DOI] [PubMed] [Google Scholar]
- Pirker S, Schwarzer C, Wieselthaler A, Sieghart W, Sperk G. GABA(A) receptors: immunocytochemical distribution of 13 subunits in the adult rat brain. Neuroscience. 2000;101:815–850. doi: 10.1016/S0306-4522(00)00442-5. [DOI] [PubMed] [Google Scholar]
- Pirri JK, McPherson AD, Donnelly JL, Francis MM, Alkema MJ. A tyramine-gated chloride channel coordinates distinct motor programs of a Caenorhabditis elegans escape response. Neuron. 2009;62:526–538. doi: 10.1016/j.neuron.2009.04.013. [DOI] [PMC free article] [PubMed] [Google Scholar]
- Ramerstorfer J, Furtmüller R, Sarto-Jackson I, Varagic Z, Sieghart W, Ernst M. The GABAA receptor α+β− interface: a novel target for subtype selective drugs. J Neurosci. 2011;31:870–877. doi: 10.1523/JNEUROSCI.5012-10.2011. [DOI] [PMC free article] [PubMed] [Google Scholar]
- Ringstad N, Abe N, Horvitz HR. Ligand-gated chloride channels are receptors for biogenic amines in C. elegans. Science. 2009;325:96–100. doi: 10.1126/science.1169243. [DOI] [PMC free article] [PubMed] [Google Scholar]
- Rosas-Arellano A, Machuca-Parra AI, Reyes-Haro D, Miledi R, Martínez-Torres A. Expression of GABAρ receptors in the neostriatum: localization in aspiny, medium spiny neurons and GFAP-positive cells. J Neurochem. 2012;122:900–910. doi: 10.1111/j.1471-4159.2011.07621.x. [DOI] [PubMed] [Google Scholar]
- Saras A, Gisselmann G, Vogt-Eisele AK, Erlkamp KS, Kletke O, Pusch H, Hatt H. Histamine action on vertebrate GABAA receptors: direct channel gating and potentiation of GABA responses. J Biol Chem. 2008;283:10470–10475. doi: 10.1074/jbc.M709993200. [DOI] [PubMed] [Google Scholar]
- Schwarzer C, Berresheim U, Pirker S, Wieselthaler A, Fuchs K, Sieghart W, Sperk G. Distribution of the major gamma-aminobutyric acid(A) receptor subunits in the basal ganglia and associated limbic brain areas of the adult rat. J Comp Neurol. 2001;433:526–549. doi: 10.1002/cne.1158. [DOI] [PubMed] [Google Scholar]
- Seeger C, Christopeit T, Fuchs K, Grote K, Sieghart W, Danielson UH. Histaminergic pharmacology of homo-oligomeric beta3 gamma-aminobutyric acid type A receptors characterized by surface plasmon resonance biosensor technology. Biochem Pharmacol. 2012;84:341–351. doi: 10.1016/j.bcp.2012.04.008. [DOI] [PubMed] [Google Scholar]
- Sieghart W, Sperk G. Subunit composition, distribution and function of GABA(A) receptor subtypes. Curr Top Med Chem. 2002;2:795–816. doi: 10.2174/1568026023393507. [DOI] [PubMed] [Google Scholar]
- Sigel E. Mapping of the benzodiazepine recognition site on GABAA receptors. Curr Top Med Chem. 2002;2:833–839. doi: 10.2174/1568026023393444. [DOI] [PubMed] [Google Scholar]
- Sigel E, Steinmann ME. Structure, function, and modulation of GABA(A) receptors. J Biol Chem. 2012;287:40224–40231. doi: 10.1074/jbc.R112.386664. [DOI] [PMC free article] [PubMed] [Google Scholar]
- Smart TG, Xie X, Krishek BJ. Modulation of inhibitory and excitatory amino acid receptor ion channels by zinc. Prog Neurobiol. 1994;42:393–441. doi: 10.1016/0301-0082(94)90082-5. [DOI] [PubMed] [Google Scholar]
- Smith AD, Bolam JP. The neural network of the basal ganglia as revealed by the study of synaptic connections of identified neurones. Trends Neurosci. 1990;13:259–265. doi: 10.1016/0166-2236(90)90106-K. [DOI] [PubMed] [Google Scholar]
- Smith GB, Olsen RW. Functional domains of GABAA receptors. Trends Pharmacol Sci. 1995;16:162–168. doi: 10.1016/S0165-6147(00)89009-4. [DOI] [PubMed] [Google Scholar]
- Taylor PM, Thomas P, Gorrie GH, Connolly CN, Smart TG, Moss SJ. Identification of amino acid residues within GABAA receptor β subunits that mediate both homomeric and heteromeric receptor expression. J Neurosci. 1999;19:6360–6371. doi: 10.1523/JNEUROSCI.19-15-06360.1999. [DOI] [PMC free article] [PubMed] [Google Scholar]
- Tritsch NX, Sabatini BL. Dopaminergic modulation of synaptic transmission in cortex and striatum. Neuron. 2012;76:33–50. doi: 10.1016/j.neuron.2012.09.023. [DOI] [PMC free article] [PubMed] [Google Scholar]
- Tritsch NX, Ding JB, Sabatini BL. Dopaminergic neurons inhibit striatal output through non-canonical release of GABA. Nature. 2012;490:262–266. doi: 10.1038/nature11466. [DOI] [PMC free article] [PubMed] [Google Scholar]
- Tritsch NX, Oh WJ, Gu C, Sabatini BL. Midbrain dopamine neurons sustain inhibitory transmission using plasma membrane uptake of GABA, not synthesis. Elife. 2014;3:e01936. doi: 10.7554/eLife.01936. [DOI] [PMC free article] [PubMed] [Google Scholar]
- Ueno S, Bracamontes J, Zorumski C, Weiss DS, Steinbach JH. Bicuculline and gabazine are allosteric inhibitors of channel opening of the GABAA receptor. J Neurosci. 1997;17:625–634. doi: 10.1523/JNEUROSCI.17-02-00625.1997. [DOI] [PMC free article] [PubMed] [Google Scholar]
- Ventimiglia R, Lindsay RM. Rat striatal neurons in low-density serum-free culture. In: Goslin G, Banker GA, editors. Culturing nerve cells. Cambridge, MA: MIT; 1998. pp. 371–393. [Google Scholar]
- Ventimiglia R, Mather PE, Jones BE, Lindsay RM. The neurotrophins BDNF, NT-3 and NT-4/5 promote survival and morphological and biochemical differentiation of striatal neurons in vitro. Eur J Neurosci. 1995;7:213–222. doi: 10.1111/j.1460-9568.1995.tb01057.x. [DOI] [PubMed] [Google Scholar]
- Wisden W, Laurie DJ, Monyer H, Seeburg PH. The distribution of 13 GABAA receptor subunit mRNAs in the rat brain. I. Telencephalon, diencephalon, mesencephalon. J Neurosci. 1992;12:1040–1062. doi: 10.1523/JNEUROSCI.12-03-01040.1992. [DOI] [PMC free article] [PubMed] [Google Scholar]
- Wooltorton JR, McDonald BJ, Moss SJ, Smart TG. Identification of a Zn2+ binding site on the murine GABAA receptor complex: dependence on the second transmembrane domain of beta subunits. J Physiol. 1997;505:633–640. doi: 10.1111/j.1469-7793.1997.633ba.x. [DOI] [PMC free article] [PubMed] [Google Scholar]
- Yung KK, Bolam JP, Smith AD, Hersch SM, Ciliax BJ, Levey AI. Immunocytochemical localization of D1 and D2 dopamine receptors in the basal ganglia of the rat: light and electron microscopy. Neuroscience. 1995;65:709–730. doi: 10.1016/0306-4522(94)00536-E. [DOI] [PubMed] [Google Scholar]