

Abstract
The mouse vomeronasal organ (VNO) plays a critical role in semiochemical detection and social communication. Vomeronasal stimuli are typically secreted in various body fluids. Following direct contact with urine deposits or other secretions, a peristaltic vascular pump mediates fluid entry into the recipient's VNO. Therefore, while vomeronasal sensory neurons (VSNs) sample various stimulatory semiochemicals dissolved in the intraluminal mucus, they might also be affected by the general physicochemical properties of the “solvent.” Here, we report cycle stage-correlated variations in urinary pH among female mice. Estrus-specific pH decline is observed exclusively in urine samples from sexually experienced females. Moreover, patch-clamp recordings in acute VNO slices reveal that mouse VSNs reliably detect extracellular acidosis. Acid-evoked responses share the biophysical and pharmacological hallmarks of the hyperpolarization-activated current Ih. Mechanistically, VSN acid sensitivity depends on a pH-induced shift in the voltage-dependence of Ih activation that causes the opening of HCN channels at rest, thereby increasing VSN excitability. Together, our results identify extracellular acidification as a potent activator of vomeronasal Ih and suggest HCN channel-dependent vomeronasal gain control of social chemosignaling. Our data thus reveal a potential mechanistic basis for stimulus pH detection in rodent chemosensory communication.
Keywords: HCN, ion channel, signaling, vomeronasal organ
Introduction
In rodents, the vomeronasal organ (VNO) detects a broad range of semiochemicals and other social cues. As mediators of heterospecific and conspecific communication, these structurally diverse chemosignals are typically released in various body fluids and secretions (Brennan and Kendrick, 2006). While the exact chemical composition of such fluids is unclear, various secreted compounds are under endocrine control (Hayashi and Kimura, 1974; Doty, 1986; Pankevich et al., 2004; Kelliher and Wersinger, 2009; Petrulis, 2013). For example, urine—a rich source of semiochemicals that is frequently used as a “broadband” stimulus for vomeronasal neurons (Holy et al., 2000; Spehr et al., 2002; Ben-Shaul et al., 2010)—provides an olfactory signature that reports a female's cycle stage (Lydell and Doty, 1972; Johnston and Bronson, 1982; He et al., 2008; Haga-Yamanaka et al., 2014) and consequently sexual receptivity (Davies and Bellamy, 1974; Aron, 1979). While a number of estrus-dependent constituents of female rodent urine have been described (Andreolini et al., 1987; Achiraman et al., 2010; Nielsen et al., 2011; Haga-Yamanaka et al., 2014), estrus-specific regulation of more general physicochemical urine properties, such as pH, has not been investigated.
Rodent vomeronasal sensory neurons (VSNs) are among the most sensitive chemosensors in mammals (Leinders-Zufall et al., 2000; Ferrero et al., 2013). Along with other factors, their high input resistance of typically several gigaohms (Liman and Corey, 1996) renders VSNs exquisitely sensitive to stimulation. Thus, at resting membrane potential, depolarizing currents of only a few picoamperes generate repetitive action potential (AP) discharge (Liman and Corey, 1996; Kim et al., 2012). In addition to Hodgkin–Huxley type voltage-gated channels, VSNs express several “nonstandard” ion channels, such as ether-à-go-go-related K+ channels (Hagendorf et al., 2009) and hyperpolarization-activated cyclic nucleotide-gated (HCN) channels (Dibattista et al., 2008), that shape the VSN-specific input–output function.
Initially discovered in sinoatrial node cells (Noma and Irisawa, 1976; DiFrancesco, 1981, 1986), HCN channel-mediated hyperpolarization-activated currents (Ih) have since been described in a variety of cardiac cells and neurons (Pape, 1996; Robinson and Siegelbaum, 2003; Biel et al., 2009). The four mammalian HCN isoforms (HCN1–HCN4) serve diverse neuronal functions, from rhythmic oscillatory activity and generation of intrinsic resonance to dendritic integration and synaptic plasticity (Beaumont and Zucker, 2000; Magee, 2000; Angelo et al., 2007; Giocomo et al., 2011). This functional diversity results from an unusual biophysical profile that includes slow voltage-dependent activation upon hyperpolarization, mixed Na+ and K+ permeability, essentially no inactivation, and a small single-channel conductance (Robinson and Siegelbaum, 2003; Biel et al., 2009). In addition, modulation by various extracellular and intracellular factors turns HCN channels into versatile neuronal integrators of both electrical and biochemical signals.
Here, we report HCN channel-dependent detection of extracellular/environmental acidosis by mouse VSNs. Lowering extracellular pH shifts the voltage-dependence of Ih activation to more positive potentials and thus increases VSN excitability. By additionally demonstrating that stage-correlated drops in urinary pH can signal estrus in sexually experienced females, our data reveal a mechanism that could contribute to estrus detection in chemosensory communication.
Materials and Methods
Chemicals, solutions, and stimulus presentation.
The following solutions were used: (S1) HEPES-buffered extracellular solution containing (in mm) 145 NaCl, 5 KCl, 1 CaCl2, 1 MgCl2, and 10 HEPES, with pH 7.3 (adjusted with NaOH) and osmolarity 300 mOsm (adjusted with glucose); (S2) oxygenated (95% O2, 5% CO2) extracellular solution containing (in mm) 125 NaCl, 25 NaHCO3, 5 KCl, 1 CaCl2, 1 MgSO4, and 5 BES [N,N-bis(2-hydroxyethyl)-2-aminoethanesulfonic acid], with pH 7.3 and osmolarity 300 mOsm; (S3) extracellular solution used to set the K+ equilibrium potential (EK+) to −70 mV, containing (in mm) 141 NaCl, 9 KCl, 1 CaCl2, 1 MgCl2, and 10 HEPES, with pH 7.3 and osmolarity 300 mOsm; (S4) N-methyl-d-glucamine (NMDG)-based “cation-free” extracellular solution containing (in mm) 141 NMDG, 141 HCl, 9 KCl, and 10 HEPES, with pH 7.3 (adjusted with NMDG/HCl) and osmolarity 300 mOsm; (S5) Na+-free extracellular solution containing (in mm) 141 NMDG, 141 HCl, 9 KCl, 1 CaCl2, 1 MgCl2, and 10 HEPES, with pH 7.3 and osmolarity 300 mOsm; (S6) Ca2+-free extracellular solution containing (in mm) 145 NaCl, 5 KCl, 5 EGTA, 1.25 MgCl2 (free Mg2+, 1 mm), and 10 HEPES, with pH 7.3 (NaOH) and osmolarity 300 mOsm; (S7) elevated K+ solution containing (in mm) 100 NaCl, 50 KCl, 1 CaCl2, 1 MgCl2, and 10 HEPES, with pH 7.3 (NaOH) and osmolarity 300 mOsm; and (S8) pipette solution containing (in mm) 143 KCl, 2 KOH, 1 EGTA, 0.3 CaCl2 (free Ca2+, 110 nm), 10 HEPES, 2 MgATP, and 1 NaGTP, with pH 7.1 (adjusted with KOH) and osmolarity 290 mOsm. For pH ≤6 extracellular acidic solutions, HEPES was replaced with 2-(N-morpholino)ethanesulfonic acid (MES). Free Ca2+ and Mg2+ concentrations were calculated using WEBMAXC STANDARD (available at http://www.stanford.edu/∼cpatton/webmaxcS.htm). If not stated otherwise, chemicals were purchased from Sigma. SB-366791 was purchased from Enzo Life Science, and ZD7288 was purchased from Abcam. Final DMSO, ethanol, or methanol concentrations were ≤0.1%. Stimuli and pharmacological agents were applied from air-pressure-driven reservoirs via an eight-in-one multibarrel “perfusion pencil” (Science Products). Changes in focal superfusion (Veitinger et al., 2011) were software controlled and synchronized with data acquisition by transistor–transistor logic input to 12 V DC solenoid valves using a TIB 14S digital output trigger interface (HEKA Elektronik).
Animals and tissue preparation.
All animal procedures were approved by local authorities and in compliance with European Union legislation (Directive 86/609/EEC) and recommendations by the Federation of European Laboratory Animal Science Associations. Both C57BL/6 mice (Charles River Laboratories) and mice with a homozygous deletion in the Trpc2 gene (TRPC2−/− mice; Leypold et al., 2002; kindly provided by T. Leinders-Zufall and F. Zufall, University of Saarland, Homburg, Germany) were housed in groups of both sexes [room temperature (RT); 12 h light/dark cycle; food and water available ad libitum]. Experiments used young adults of either sex (79 female and 59 male mice). We did not observe obvious gender-dependent differences. Mice were killed by brief exposure to a CO2 atmosphere and decapitation. For in vivo recordings, sexually naive male BALB/c mice were used (Harlan Laboratories). All in vivo experiments were performed in compliance with the Hebrew University Animal Care and Use Committee.
Acute coronal VNO slices were prepared as described previously (Hagendorf et al., 2009; Spehr et al., 2009). Briefly, the lower jaw and palate were removed. The VNO was dissected, embedded in 4% low-gelling-temperature agarose, and placed in ice-cold oxygenated S2, and coronal slices (250–300 μm) were cut on a VT1000S vibratome (Leica Biosystems). Slices were transferred to a submerged, chilled, and oxygenated (S2) storage chamber until use. Intact vomeronasal sensory epithelia for en face confocal Ca2+ recordings from the VNO luminal surface were prepared as previously described with minor modifications (Rivière et al., 2009). Briefly, the fur, lower jaw, and upper incisors were removed, and a sagittal hemisection was performed ∼2 mm lateral to midline. The hemisected head was transferred to a 35 mm culture dish, embedded in agar (10%), and immersed in S2. The cartilaginous capsule surrounding the VNO was opened laterally, and the cavernous tissue was gently removed to gain access to the luminal surface of the sensory epithelium. For immunochemistry, the skin, lower jaw, palate, upper incisors, and all soft tissue at the tip of the nose were removed from the rostral part of a coronal hemisection of the head.
Electrophysiology.
VNO slices were transferred to a recording chamber (Luigs and Neumann) on an upright fixed-stage video-microscope (DM LSFA; Leica Microsystems) equipped for infrared-optimized differential interference contrast (IR-DIC). Neurons were visualized using 10× (HC PL FL 10×/0.30 numerical aperture (NA)) and 63× (HCX APO L U-V-I 63×/0.90 NA) objectives as well as a cooled CCD camera (DFC360FX; Leica Microsystems). Slices were continuously superfused with oxygenated S2 (∼3 ml/min; gravity flow; RT). Patch pipettes (4–7 MΩ) were pulled from borosilicate glass capillaries (1.50 mm outer diameter, 0.86 mm inner diameter; Science Products) on a PC-10 micropipette puller (Narishige Instruments), fire polished (MF-830 Microforge; Narishige Instruments) and filled with S8 solution. An agar bridge (150 mm KCl) connected the reference electrode and bath solution. An EPC-10 amplifier controlled by Patchmaster 2.53 software (HEKA Elektronik) was used for data acquisition. We monitored and compensated pipette and membrane capacitance as well as series resistance. Only neurons exhibiting stable access resistances (change <20%) were used for analysis. Liquid junction potentials were calculated using JPCalcW software (Barry, 1994) and corrected online. If not stated otherwise, signals were low-pass filtered (analog three- and four-pole Bessel filters, −3 dB, adjusted to one-third to one-fifth of the sampling rate, 5–10 kHz, depending on protocol). Stimulation artifacts were removed for clarity. Recordings of low-amplitude proton-dependent currents at constant holding potentials were low-pass filtered at 0.5 kHz to unmask small VSN responses (Kim et al., 2012). If not stated otherwise, the holding potential (Vhold) was −70 mV. All electrophysiological data were recorded at room temperature.
“Loose-patch” recordings were performed from intact VSN somata to prevent dialysis of intracellular components. Action potential-driven capacitive currents were recorded in a loose-seal cell-attached configuration (seal resistance, 30–150 MΩ; pipettes filled with S1). Spikes were analyzed using Igor Pro functions (SpAcAn, written by G. Dugué and C. Rousseau, Ecole Normale Supérieure, Institut de Biologie de l'ENS, IBENS, Paris, France) for detection and analysis of spontaneous events by a threshold detection algorithm. Interstimulus intervals were 55–60 s. Neuronal responses (or the lack thereof) were classified according to the following criteria: (1) discharge was time locked to stimulus presentation; (2) spike patterns clearly deviated from prior baseline activity (Frequency histograms (1 s bin width) were calculated, and responses were evaluated according to a Δf > 3 × SD f(baseline) criterion).
Confocal Ca2+ imaging.
Ca2+-sensitive dye loading was performed as described previously (Rivière et al., 2009) with minor modifications. Briefly, the hemisected head including the laterally opened VNO was incubated (20 min; 37°C) in S2 containing fluo-4 AM (10 μm) and 0.4% pluronic acid. After washing twice (S2), the culture dish was mounted on the stage of an upright fixed-stage scanning confocal microscope (TCS SP5 DM6000CFS; Leica Microsystems) equipped with a 20×/1.0 NA water immersion objective (HCX APO L; Leica Microsystems). The bath solution (S2) was continuously exchanged (∼5 ml/min; gravity flow). Fluo-4 was excited using the 488 nm line of an argon laser. Changes in dendritic knob cytosolic Ca2+ were monitored over time at 0.5–1.5 Hz frame rates.
Urine collection and pH measurement.
Urine was collected according to previously described protocols for mouse micturation over a plastic vial (Kurien et al., 2004). Application of gentle transabdominal pressure resulted in ∼30–70 μl of urine, a quantity sufficient for immediate measurement of urinary pH (Kurien et al., 2004). An InLab Ultra-Micro pH electrode (Mettler Toledo) was used for pH measurements that were controlled by parallel readings from pH-indicator strips (Merck). For in vivo recordings and behavioral assays, urine was collected as described above from group-housed 10- to 14-week-old female mice (several daily collections over 2 weeks). Male mouse urine for in vivo recordings was collected from four individuals from different strains (FVB, BALB/c, C57BL/6, and Sabra; housed in the Hebrew University's animal facility) and diluted 10 times in Ringer's solution. Samples were pooled and stored at −80°C until use. For female urine stimulus preparation, urine was diluted 1:2 (behavioral assay) or 1:10 (in vivo recordings) in MES-based or HEPES-based solution, respectively (10 mm each, depending on the target pH) and titrated to the target pH value (NaOH/HCl).
Estrous cycle stage determination.
Mouse estrous cycle stage was determined by vaginal smear cytology based on the ratio of polymorphonuclear leukocytes and cornified squamous epithelial and nucleated epithelial cells (Byers et al., 2012; McLean et al., 2012).
Immunohistochemistry.
Vomeronasal tissue was fixed in 4% paraformaldehyde in Ca2+/Mg2+-free phosphate buffer (PB; 0.1 m, pH 7.4, 15–30 min, RT), washed (PB), and subsequently cryoprotected in PB containing 10% sucrose/0.05% NaN3 (24 h, 4°C) and 30% sucrose/0.05% NaN3 (48 h, 4°C). Samples were embedded in NEG-50 (Thermo Fisher Scientific), frozen, sectioned at 18 μm on a cryostat (HM 560 Cryo-Star; Microm), and mounted on Superfrost Plus slides (Menzel). In some cases, antigen retrieval was performed by heating sections (100°C, 3 min) in sodium citrate buffer (10 mm, pH 6.0), equilibrating in sodium borate buffer (40 mm, pH 8.0, 5 min, RT), and washing in PB. Next, sections were incubated in PB (1 h, RT) containing 5% chemiblocker (Millipore), 0.5% Triton X-100, and 0.05% NaN3 [blocking/staining solution (Sbs)].
Primary antibodies [polyclonal rabbit anti-HCN2α (Harzheim et al., 2008), monoclonal rat anti-HCN4 (PG2-1A4; Mataruga et al., 2007), and monoclonal mouse anti-villin (0258; Immunotech)] were diluted in Sbs, and sections were incubated overnight at RT with primary antibody solutions in a humidified chamber. After washing in PB, sections were incubated in Sbs (1 h, RT, without NaN3) containing secondary antibodies (Alexa Fluor 488 goat anti-rabbit IgG, A11034, Invitrogen; Alexa Fluor 488 goat anti-rat IgG, A11006, Invitrogen; and donkey anti-mouse IgG–Cy3, 715-165-150, Dianova). Excess antibodies were removed by washing (PB), and sections were coverslipped with Aqua Polymount (Polysciences). Fluorescent images were taken using a confocal laser-scanning microscope (TCS SP5 II; Leica Microsystems) equipped with a 63×/1.4 NA oil-immersion objective. Antibody concentration, laser intensity, and filter settings (525 ± 15 nm, Alexa 488; 615 ± 35 nm, Cy3) were carefully controlled. Sequential scanning mode was used to rule out detection channel cross talk. Control experiments without primary antibodies were performed in parallel with each procedure. Target specificity of the primary HCN channel antibodies was confirmed by Western blot analysis of membrane preparations from Flp-In 293 cells (Invitrogen) expressing HCN2, HCN4, or no recombinant protein (data not shown). Digital images were uniformly adjusted for brightness and contrast using Adobe Photoshop CS3 (Adobe Systems).
In vivo recordings.
Electrophysiological recordings of accessory olfactory bulb (AOB) neurons were performed as described previously in detail (Ben-Shaul et al., 2010). Briefly, mice were anesthetized with 100 mg/kg ketamine and 10 mg/kg xylazine. A tracheotomy was made using a polyethylene tube to allow breathing during VNO flushing; a cuff electrode was placed on the sympathetic nerve trunk with the carotid serving as a scaffold. Incisions were closed, and the mouse was placed in a custom-built stereotaxic apparatus where anesthesia was maintained throughout the entire experiment with 0.5–1% isoflurane in O2. A craniotomy was performed immediately rostral to the rhinal sinus, the dura was removed around the penetration site, and electrophysiological probes were advanced into the AOB using an electronic micromanipulator (MP-285; Sutter Instruments). All recordings were made with 32-channel probes (NeuroNexus Technologies). During each trial, 2 μl of stimulus solution was placed directly in the nostril (in one session, 6 μl were used). After 20 s, a square-wave stimulation train (duration, 1.6 s; current, ±120 μA; frequency, 30 Hz) was applied through the sympathetic nerve cuff electrode to induce VNO pumping and, accordingly, stimulus entry to the VNO lumen. Following each stimulus presentation, Ringer's solution (1–2 ml) was flushed from the nostril and through the nasopalatine duct to cleanse both the VNO and nasal cavity. This cleansing procedure lasted 40 s and included sympathetic trunk stimulation to facilitate stimulus elimination from the VNO lumen.
Using an RZ2 processor, PZ2 preamplifier, and two RA16CH head-stage amplifiers (Tucker-Davis Technologies), neuronal activity was sampled at 25 kHz and bandpass filtered at 0.3–5 kHz. Custom Matlab (MathWorks) programs were used to extract spike waveforms. Spikes were sorted automatically according to their projections on two principle components using KlustaKwik (Harris et al., 2000) and then manually verified and adjusted using the Klusters program (Hazan et al., 2006).
Two-choice assay.
For behavioral tests, animals were maintained on a reverse 12 h light/dark cycle (food and water available ad libitum). Both urine collection and behavioral testing were performed under low-intensity red light during the nocturnal phase. Urine was collected as described above. To maintain cycling, male soiled bedding was added daily to the females' cages.
Eleven sexually experienced male mice (13–16 weeks) were used in behavioral assays. On consecutive days, each assay consisted of a handling period (2 d), habituation trials (2 d), and experimental trials (3 d). Habituation trials were identical to experimental trials, except that no stimuli were presented. For experimental trials, subjects were placed in a clean autoclaved 300 × 180 × 240 mm cage and allowed to habituate for 3 min. Next, two 35 mm dishes, each containing 100 μl of stimulus solution, were simultaneously positioned in the cage. Mice were allowed to freely investigate during 5 min trials that were digitally recorded by a CCD camera (stc-tb33usb-as; Sensor Technologies America). Each mouse was tested once per condition: (1) water versus water; (2) urine with pH 5 (MES) versus urine with pH 7 (HEPES); and (3) urine with pH 6.5 (MES) versus urine with pH 6.5 (HEPES). To exclude directional bias, each stimulus was presented on both sides of the cage (50% left/50% right).
Based on a nose-point/tail-base tracking algorithm implemented in EthoVision XT10 video tracking software (Noldus Information Technology), animal position was automatically tracked on a frame-by-frame basis. Correct body-point positions were verified by studying the video/body point overlay in slow motion (1/2 or 1/4 speed). Falsely tracked points were manually corrected. Areas corresponding to each dish were defined as regions of interest, and the cumulative time that nose points were detected inside these regions was calculated. All analyses were performed blind.
Data analysis.
All data were obtained from independent experiments performed on at least 3 d using at least three different animals. Individual numbers of cells and experiments (n) are denoted in the figure legends. If not stated otherwise, results are presented as means ± SEM. Ca2+ imaging and electrophysiological data from VSNs were analyzed off-line using FitMaster 2.20 (HEKA Elektronik), LAS MM AF 1.8 (Leica Microsystems), IGOR Pro 6.3 (WaveMetrics), and Excel (Microsoft) software. Activation curves were fitted by the Hill equation to calculate the membrane potential of half-maximal activation (V1/2) and slope factor (k). Current activation time constants (τ) were calculated by fitting individual traces to monoexponential functions: I(t) = I1 [exp (−t/τ)] + I0. Linear correlation of two parameters was analyzed by calculating the Pearson correlation coefficient using IGOR Pro's linear correlation procedure. Statistical analyses were performed using paired or unpaired t tests (as dictated by experimental design) or one-way ANOVA with Tukey's HSD post hoc test. Tests and corresponding p values that report statistical significance (≤0.05) are specified individually in figure legends.
For in vivo recordings from the AOB, each of the stimuli were presented five times in a pseudorandom interleaved order (in a minority of cases, four or six repeats of each stimulus were done). A unit's response/firing rate change to a given stimulus presentation was defined by calculating the mean peristimulus spiking rate (averaged over a 40 s period following stimulus delivery and over four to six repeated presentations of the same stimuli) and subtracting the average activity over a 10 s baseline period preceding stimulus presentation. Response significance (for a given unit–stimulus pair) was determined using a one-way nonparametric ANOVA with a p value of <0.05, implemented with the Matlab Kruskal–Wallis function. The test compared the set of poststimulation spiking rates to the set of all prestimulation spiking rates across all stimuli. The effect of acidity on neuronal responses to female urine was also tested using a one-way nonparametric ANOVA (p < 0.05, Kruskal–Wallis function). Specifically, the comparison included all single trial responses (as defined above) to female urine at different pH values. The null hypothesis was that responses to all pH values originate from the same underlying distribution.
In patch-clamp whole-cell recordings, VSNs were judged as responsive if (1) membrane depolarization or current deflections exceeded a critical value calculated as the average prestimulation baseline plus twice its standard deviation, and (2) if the response was observed during proton application.
In fluorescence imaging experiments, regions of interest were defined to encompass 30 randomly chosen single knob regions per field of view based on dye-loaded cell morphology at rest. Changes in relative fluorescence intensity were measured in arbitrary units. An increase in fluorescence intensity was judged as a stimulus-dependent response if the following two criteria were both fulfilled (Rivière et al., 2009; Fluegge et al., 2012): (1) the peak intensity value exceeded the average prestimulation baseline intensity plus two standard deviations [Iresp > Ibaseline + 2 × SD(Ibaseline)]; (2) the increase in fluorescence intensity was observed during stimulus application.
Results
Urinary pH varies with estrous cycle
Mouse urine and other bodily secretions are highly complex aqueous biofluids that contain hundreds of potentially bioactive constituents (Novotny, 2003; Röck et al., 2006; Ferrero and Liberles, 2010; Sturm et al., 2013). As the local physicochemical environment exerts profound effects on such compounds (Berg et al., 2010), we analyzed the free proton concentration in fresh urine samples from four cohorts of adult C57BL/6 mice categorized by both gender and sexual experience. Surprisingly, we found a significantly reduced urinary pH in samples from experienced females (Fig. 1A). Individual values, however, were not normally distributed and varied considerably (Fig. 1A, inset). Therefore, we measured urinary proton concentration as a function of the estrous cycle (Fig. 1B). Our results revealed a significantly reduced pH in urine samples from experienced females in estrus versus diestrus. This “pH cyclicity” was not only apparent from the sample average, but became also manifest in consecutive measurements from individual animals (Fig. 1C), which revealed cycle-dependent pH differences in individual mice that spanned at least one logarithmic unit (Fig. 1B, inset). Notably, no cycle dependence was observed when sexually inexperienced females were tested (Fig. 1D). Together, these data reveal an estrus-dependent drop in urinary pH among sexually experienced female mice.
Figure 1.

Cycle-dependent changes in mouse urinary pH. A, Average pH measured in urine samples from sexually naive and sexually experienced males (7.32 ± 0.11 vs 6.96 ± 0.1) as well as sexually naive and sexually experienced females (6.94 ± 0.16 vs 6.27 ± 0.1, respectively). Data are plotted as mean ± SEM. Numbers of experiments are indicated above bars. Urinary pH was significantly reduced in samples from sexually experienced females (one-way ANOVA with Tukey's HSD post hoc test; *1p < 0.001). Inset, Scatter dot plot of individual pH measurements from experienced females (248 samples, 26 animals, 10 consecutive days). Red bars indicate mean ± SD (6.29 ± 0.75). B, Average urinary pH in experienced females during the four stages of the mouse estrous cycle. The pie chart indicates approximate stage duration. Numbers of individual measurements are indicated above bars. Results (6.16 ± 0.1, proestrus; 6.11 ± 0.07, estrus; 6.32 ± 0.11, metestrus; 6.43 ± 0.07, diestrus) represent means ± SEM. Samples taken from six animals over 30 consecutive days (*2p = 0.01, one-way ANOVA with Tukey's HSD post hoc test). Inset, Maximum cycle-dependent pH differences in individual mice during estrus and diestrus, respectively. In all animals, pH values differ by at least one logarithmic unit (ΔpH range, 1.0–1.7). C, Representative time course of “pH cyclicity.” Over 3 weeks, urinary pH is determined on a daily basis (black). Corresponding cycle stages are superimposed (red). D, Average urinary pH in sexually naive female mice (n = 4; 30 consecutive days) during proestrus (6.92 ± 0.15), estrus (6.84 ± 0.11), metestrus (6.87 ± 0.16), and diestrus (7.07 ± 0.09). Numbers of individual measurements are indicated above bars. Data represent means ± SEM. No significant differences were observed (one-way ANOVA).
Urinary pH constitutes a chemosensory signaling parameter
As a major source of semiochemicals, physicochemical changes in urine could directly affect its signaling properties. Therefore, we next asked whether mice can discriminate neutral from acidic urine and, if so, whether this sensory information might entail any meaning. In a two-choice preference assay (Pankevich et al., 2004), male mice spent significantly more time freely investigating the more acidic of two pooled female urine samples (pH 5 vs pH 7; n = 11; Fig. 2A,B). This effect was independent of stimulus location (left vs right side of the cage) and the buffer used (HEPES vs MES). These behavioral results indicate that the free urinary proton concentration is not only detectable, but also changes the preference of male mice to urine stimuli.
Figure 2.
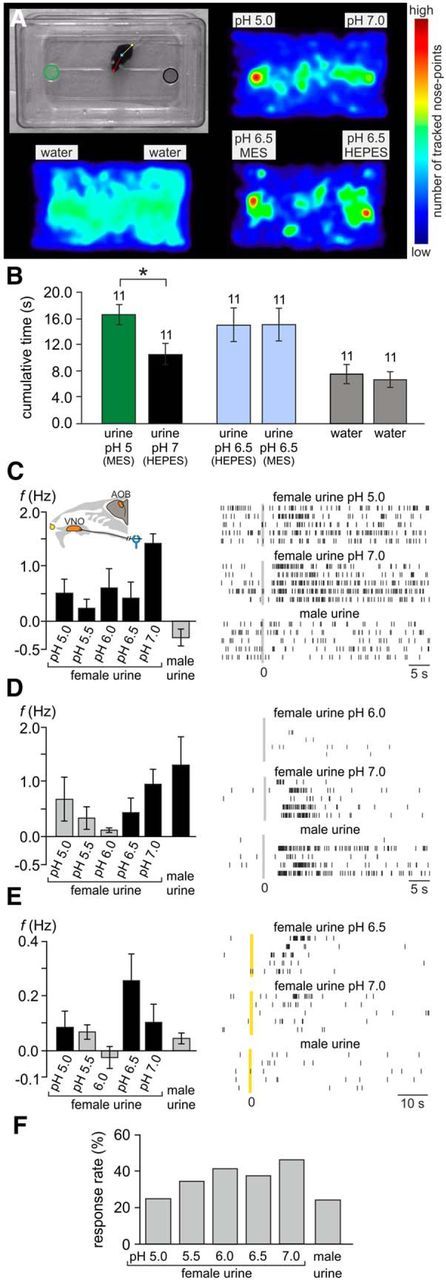
Urinary pH constitutes a chemosensory signaling parameter. A, B, Two-choice assay reveals male place preference for acidic female urine. A, Experimental setup (top left) and accumulated heat maps depicting the count of tracked nose points (normalized to the overall maximum value). Top left, Single video frame illustrating assay design. Dishes used for stimulus presentation on either side of the cage are marked as areas of interest (green and black circles). Markers on the mouse denote multiple software-defined body points (nose, center, tail base) used for automated (and manually verified/corrected) tracking. Other images show pseudocolor heat maps of normalized nose-point distribution under three different experimental conditions: urine/pH 5 (MES-buffered) versus urine/pH 7 (HEPES-buffered) (top right), water versus water (bottom left), and urine/pH 6.5 (MES-buffered) versus urine/pH 6.5 (HEPES-buffered) (bottom right). B, Behavioral assay quantification. The bar graph shows the average cumulative duration (mean ± SEM) that an animal's nose point was detected within each area of interest. The asterisk denotes statistical significance; p < 0.001 (paired-sample t test). C–E, Stimulus-induced firing rate changes of three individual representative AOB units. Left, Bar charts depicting average changes in spike frequency (mean ± SEM; across all repeated presentations of the same stimulus) in response to female urine at five different pH values (5.0–7.0) and male urine, respectively. Black bars indicate firing rate changes that are statistically significant (see Materials and Methods). Gray bars correspond to rate variations that were not statistically significant from prestimulation baseline activity. The inset in C shows a schematic of the experimental in vivo preparation. Right, Raster displays of unit activity in response to three of the six stimuli. For each unit, discharge in response to male urine, neutral female urine (pH 7.0), and either of four acidic female urine stimuli is shown. Within each panel, each row indicates spike times during a single stimulus presentation. Per panel, all five rows display responses to the same stimulus. Time 0 indicates sympathetic nerve stimulation (C, D) or stimulus application to the nostril (E). F, Percentage of significant stimulation-induced responses (p < 0.05; Kruskal–Wallis one-way ANOVA) for female urine at different pHs and for male urine. Units included in this analysis were those responding to at least one of the female stimuli (n = 133).
We next asked whether urinary pH variation in the range observed during estrus cycle fluctuations is detectable by the vomeronasal system in vivo. To address this question, we measured neuronal responses in the mouse AOB upon exposure to a series of five female urine samples that were chemically identical except for proton concentration (pH 7.0–5.0) and to male urine (pH not controlled). In these experiments, each of the different stimuli was presented repeatedly (four to six trials per stimulus) in a pseudorandom interleaved order. For each unit–stimulus pair, responses were quantified as the average rate change following stimulus delivery to the vomeronasal organ. Of 156 units (including both single and multiunit activity) that responded to at least one stimulus, 133 showed a significant response to one or more female urine samples. A subset of these units (14 of 133, 10.5%) displayed a differential response as a function of pH (p < 0.05, one-way nonparametric ANOVA). Across the population of AOB units sampled, urine stimuli at all tested pH values elicited responses. Response patterns were generally more prone to higher pH values (Fig. 2C,F), yet several other patterns, including nonmonotonic response profiles, were observed as well (Fig. 2D,E). Using the binomial distribution, the probability to observe 14 or more such units under the null hypothesis of no pH modulation is 0.007. Thus, these results demonstrate that, in a physiological setting, small stimulus volumes (∼2 μl), inevitably diluted in the VNO lumen, can convey information about urinary pH through the vomeronasal system.
Extracellular acidification stimulates vomeronasal neurons
Vomeronasal response modulation by urine of different pHs could either be indirect (e.g., by altering ligand conformation or charge) or represent a direct effect of proton concentration on VSN activity. To address the latter, we next asked whether VSNs are sensitive to the environmental proton concentration ([H+]e). Using whole-cell patch-clamp recordings from visually identified neurons in acute VNO slices (Fig. 3A), we recorded a slowly developing sustained inward current during extracellular acidification in the vast majority of VSNs (Fig. 3B; 97/102 neurons; Vhold = −70 mV), regardless of their apical or basal epithelial distribution. Frequently, stimulus removal prompted a small “off”/rebound current (Fig. 3B,C, asterisks). In few cases (∼25%), we also observed a transient instantaneous current (Fig. 3B, arrowhead). Prolonged (Fig. 3C) as well as repeated (D,E) exposure to acidic pH triggered robust responses in both voltage- and current-clamp mode without signs of desensitization. Sensitivity to extracellular acidification was dose dependent (Fig. 3F–H), with a threshold [H+]e of ∼300 nm (pH 6.5) and no apparent saturation within the concentration range tested (pH ≥ 4.0). These data show that essentially all VSNs respond to extracellular acidification with a gradually developing nondesensitizing inward current that dose-dependently depolarizes the membrane to subthreshold or suprathreshold potentials.
Figure 3.

Extracellular acidification stimulates VSNs. A, IR-DIC photomicrograph showing part of the sensory neuroepithelium of an acute coronal VNO section (250 μm). The patch pipette (P), lamina propria (LP), somata layer (SL), dendritic layer (DL), microvillar layer (ML), and lumen (L) are indicated. The patch pipette targets a VSN in the most basal layer of the sensory epithelium. B, Bar chart illustrating the response type distribution when VSNs are challenged with an increased extracellular proton concentration (pH 4). Most neurons display a gradually developing H+-induced current, either exclusively (sustained only; 72.5%) or preceded by a transient instantaneous current (transient + sustained; 22.5%). Inset, Representative recordings illustrating the two most common response types (Vhold = −70 mV). The arrow indicates transient current, and the asterisks (B, C) mark “off”/rebound currents. C, Representative original traces depicting nondesensitizing responses to prolonged extracellular acidification. Frequently, mild acidification (pH 6) triggers continuous action potential discharge (top; n = 9), whereas more pronounced changes (pH 4) induce transient high-frequency firing followed by a lasting plateau potential (middle; n = 25). Consequently, the underlying H+-dependent currents show no signs of desensitization (bottom; n = 58; Vhold = −70 mV). D, E, Highly reproducible responses to repeated stimulation. D, Repetitive exposure to acidic pH (ISI, 30 s) triggers robust signals recorded in current-clamp (pH 6; top) and voltage-clamp (pH 4; bottom) modes. E, Quantification of data shown in D. Bar chart depicting normalized response amplitudes (n = 12; current density and depolarization, respectively; mean ± SEM). F–H, Dose–response relationship for acidic stimuli ≥pH 4.0. F, Representative membrane potential changes (top) and whole-cell inward currents (bottom) recorded from the same VSN challenged with increasing proton concentrations (pH 6.5–pH 4.0). G, Quantification of data shown in F. Both maximum depolarization and current amplitude are plotted as functions of proton concentration. Data indicate mean ± SEM (n = 12). H, Dose-dependent increase in VSN response frequency. Bar chart shows the percentage of responding cells depending on stimulus strength (pH 6.5–pH 4.0) and recording mode (voltage/current clamp). The number of cells tested under each condition is indicated above individual bars. nd, Not determined.
Focal acidification at the intact epithelial surface triggers VSN responses
For changes in luminal proton concentration to affect VSNs in vivo, protons must readily cross the vomeronasal paracellular barrier, or, alternatively, the molecular machinery that constitutes the VSN “pH detector” must be localized to the microvillar layer. To investigate whether luminal acidification is sufficient to stimulate VSNs, we used a previously established en face imaging technique (Rivière et al., 2009). This method allows monitoring of cytosolic Ca2+ signals in single neurons at the VNO sensory surface without disruption of epithelial integrity (Fig. 4A,B). Sequential luminal exposure to acidic (pH 6 and pH 4) and depolarizing (elevated K+) solutions induced robust Ca2+ responses in the majority of neurons (Fig. 4C, top, D). Moreover, relatively mild acidification (pH 6.75) was sufficient to trigger Ca2+ signals in a subset of cells (17.1%; Fig. 4C, bottom, D). All stimulus-dependent Ca2+ responses, however, were abolished after Cd2+ preincubation (Fig. 4D), suggesting that gating of voltage-dependent Ca2+ channels is required for acid-evoked VSN Ca2+ elevations. Together, these results suggest that, in the intact neuroepithelium, vomeronasal mucus acidification is sufficient to activate VSNs.
Figure 4.

Subtle changes in extracellular pH induce vomeronasal responses under physiological conditions. A–D, Luminal acidification is sufficient to stimulate VSNs. A, Merged macroscopic bright-field and fluorescence image of the hemisected rostral head of an OMP-GFP mouse illustrating the en face confocal Ca2+-imaging approach. The schematic depicts the position of the perfusion pencil and microscope objective. The white box delimits a region of the sensory epithelium shown at a higher magnification in B. MOE, Main olfactory epithelium. B, Three-dimensional reconstruction of a confocal z-stack scan of the VNO dendritic knob surface (epithelial area shown in A). Note that individual knobs are readily discernible. C, Top, Representative original recording of cytosolic Ca2+ signals in a VSN dendritic knob in response to acidic solutions (pH 6, pH 4). Bottom, Average trace from 17 individual knobs stimulated with decreasing pH values (6.75, 6.5, 6.0, and 4.0) and elevated extracellular potassium (K+; 100 mm). The integrated relative fluorescence intensities in user-defined regions of interest are displayed in arbitrary units and viewed as a function of time. D, Bar graph showing the percentage of proton-sensitive VSNs. Data are normalized to the proportion of neurons responding to K+-mediated membrane depolarization. While threshold Ca2+ signals are observed upon relatively mild acidification (pH 6.75), the percentage of pH-sensitive neurons increases dose dependently. Numbers of individual VSN knobs are indicated above bars (n = 35–173; 14 animals). Note that dendritic Ca2+ elevations in response to both the acidic solution (pH 6) and K+-dependent depolarization are abolished after Cd2+ incubation (200 μm; 4 min; n = 17; 5 animals). E–G, pH-dependent AP discharge recorded in a loose-seal cell-attached configuration, a recording mode that keeps the intracellular milieu intact and does not perturb VSN input resistance and resting potential. E, Original representative recordings from a single neuron challenged successively with elevated K+ (50 mm) and increasing extracellular proton concentrations (pH 6.75–pH 6.0). Horizontal black bars indicate stimulation (K+, 1 s; pH, 5 s). Inset (right), Bar chart depicting response rate versus proton concentration. Data are normalized to the K+-sensitive VSN population. F, Spike raster plot of 40 VSNs stimulated as in E. Stimulus exposure is indicated by the horizontal blue bars and gray columnar shading. G, Peristimulus time histogram (PSTH) illustrating K+-/pH-dependent changes in spike frequency over time. Individual data points in a given PSTH depict the average firing rates of all tested VSNs (means ± SEM; 1 s bin width; n = 40). Stimulus-evoked mean firing rates up to 6.2 ± 0.9 Hz were recorded (pH 6.0).
Next, we asked whether extracellular acidification evokes VSN firing at physiological/unperturbed resting membrane potentials. We therefore recorded neuronal activity in a loose-seal cell-attached configuration upon exposure to relatively mild acidification (pH 6.75 to pH 6.0) or elevated K+ (Fig. 4E–G). Spike recordings from 40 VSNs revealed dose-dependent recruitment of pH-sensitive neurons (Fig. 4E, inset) that responded to increasing extracellular proton concentrations with time-locked trains of action potentials (Fig. 4F,G). These data indicate that intact VSNs can generate substantial output when challenged with relatively subtle changes in extracellular pH.
Classical acid-responsive ion channels are dispensable for vomeronasal proton sensitivity
We next sought to determine which molecular mechanism(s) underlie acid sensitivity in VSNs. Directly gated by extracellular protons, both acid-sensing ion channels (ASICs) and transient receptor potential vanilloid 1 (TRPV1) channels are prototypical neuronal pH sensors (Holzer, 2009). However, neither amiloride, a nonselective ASIC antagonist (Waldmann et al., 1997), nor capsazepine or SB-366791, two specific TRPV1 inhibitors (Szallasi et al., 2007), affected VSN inward currents or membrane depolarization in response to acidic pH (Fig. 5A,B,E–H). In addition to direct channel opening, extracellular acidification can also enhance neuronal excitability by inhibition of constitutively active K2P background channels (Duprat et al., 1997; Lesage and Lazdunski, 2000). However, when modifying the extracellular solution to set the K+ equilibrium potential to −70 mV (S3; Vhold = EK+), pH-dependent currents remained unchanged (Fig. 5C,E). Moreover, recordings from mice deficient for the VNO-specific TRP channel subunit TRPC2 (Leypold et al., 2002; Stowers et al., 2002) also revealed no significant differences in acid-evoked responses (Fig. 5D,E). Together, these data demonstrate that neither TRPC2 nor “classical” proton-sensitive ion channels mediate VSN responses to acidic pH.
Figure 5.
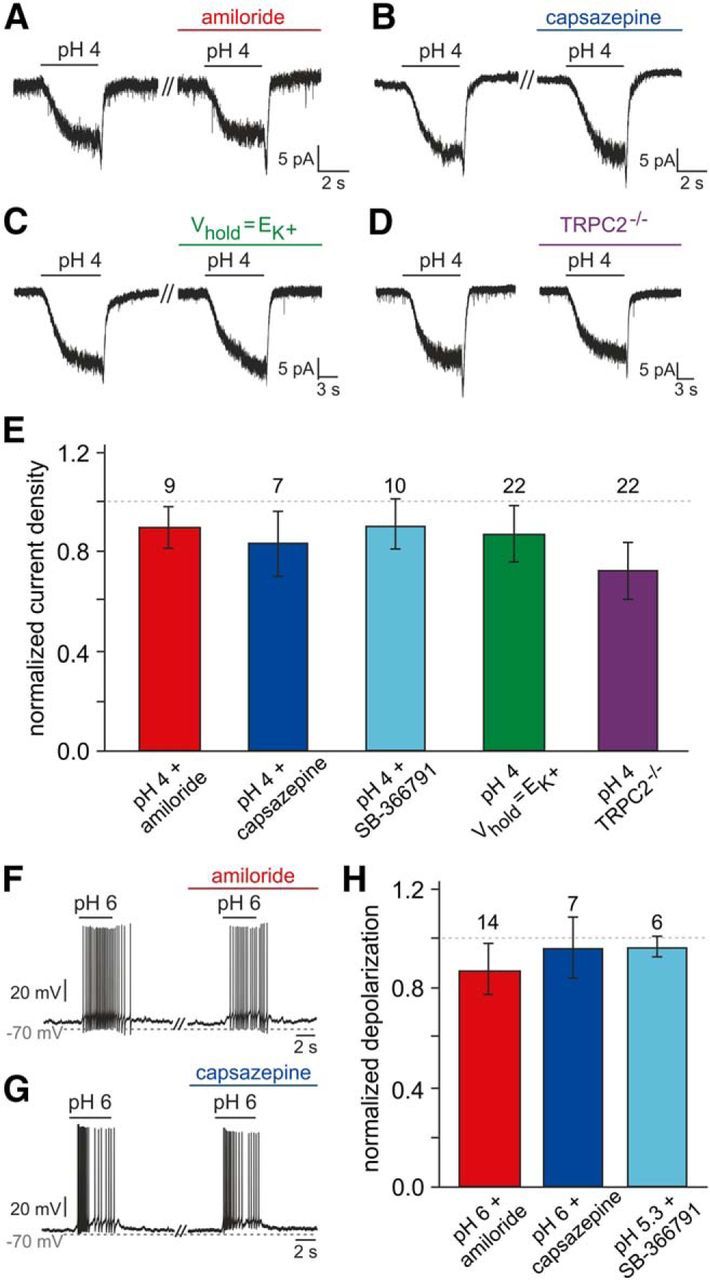
Addressing the mechanistic basis of vomeronasal proton sensitivity. A, B, Representative original recordings of acid-induced currents (pH 4; Vhold = −70 mV) under control conditions and during pharmacological treatment (preincubation, ≥120 s). No obvious changes are detected in presence of either amiloride (100 μm; A) or capsazepine (10 μm; B). C, Representative acid-evoked currents (pH 4; Vhold = −70 mV) under control conditions (EK+ = −86 mV) and at a set K+ equilibrium potential (EK+ = Vhold). Eliminating the driving force on K+ does not alter pH sensitivity. D, Original recordings of acid-induced responses in VSNs from both wild-type animals (left) and mice with homozygous deletions of the trpc2 gene (TRPC2−/−; right). E, Bar graph (mean ± SEM) quantitatively summarizing the experimental results exemplified in A–D [additionally including data obtained using the TRPV1 inhibitor SB-366791 (10 μm; 90 ± 10%)]. Neither experimental condition nor animal genotype causes significant differences in response current density (one-way ANOVA). Data are normalized to results obtained from the same neurons before pharmacological treatment (amiloride, 90 ± 8%; capsazepine, 83 ± 13%) or a different sample of neurons comparable in size (Vhold = EK+, n = 17, 87 ± 12%; TRPC2−/−, n = 23, 72 ± 11%). The number of cells tested under each condition is indicated above individual bars. The dashed line denotes 100%. F–H, Acidification-dependent membrane depolarization and AP discharge under control conditions and during pharmacological treatment. F, G, Representative original recordings of acid-induced depolarizations and superimposed spikes (pH 6; drug preincubation, ≥120 s) in the absence and presence of either amiloride (100 μm; F) or capsazepine (10 μm; G). H, Bar chart (mean ± SEM) describing the quantitative analysis of experiments exemplified in F and G (including additional data obtained using SB-366791, 10 μm).
A biophysical “fingerprint” of acid-evoked VSN responses
Since initial pharmacological and genotypic profiling did not reveal the mechanistic basis of vomeronasal proton sensitivity, we next focused on the ionic composition of acid-evoked currents. Isosmotic replacement of extracellular Na+ and Ca2+ with the large organic cation NMDG (NMDG+; Vhold = EK) demonstrated the cationic nature of the current (Fig. 6A,B). Moreover, selective substitution of either Na+ or Ca2+ revealed that, when VSNs were clamped at EK, proton-induced currents were largely carried by Na+ (Fig. 6A,B). We additionally calculated an average activation time constant (τact) of 3.5 ± 0.6 s from monoexponential fits to the slow rising phase of the pH4-induced negative current (Fig. 6C; Vhold = −70 mV; n = 10). Our results thus show that acid-evoked currents in VSNs are, at EK, largely carried by Na+ and develop slowly over several seconds.
Figure 6.

Biophysical properties of proton-mediated signals. A, Representative original traces of acid-evoked whole-cell currents recorded under control conditions versus in a modified ionic environment. Extracellular Na+ and/or Ca2+ was replaced by the largely impermeable cation NMDG+ (preincubation, ≥120 s). B, Bar chart (mean ± SEM) quantitatively summarizing the results exemplified in A. Data are normalized to current densities recorded from the same neurons before cation exchange. The dashed line denotes 100%. Numbers of experiments are indicated above individual bars. The asterisk denotes statistical significance; p = 0.003 (paired-sample t test). While selective replacement of Ca2+ did not change pH-dependent currents (109 ± 9%), substitution of Na+, either alone (19 ± 6%) or together with Ca2+ (28 ± 7%), strongly reduced acid-evoked signals. C, Original recording illustrating the time course of acid-evoked currents. Activation kinetics are well fit by a single exponential function (red curve).
Extracellular acidification modulates vomeronasal Ih
The above properties are hallmarks of hyperpolarization-activated currents (Robinson and Siegelbaum, 2003; Biel et al., 2009). Therefore, we investigated vomeronasal Ih (Dibattista et al., 2008) and its potential modulation by extracellular acidification. Hyperpolarizing voltage steps elicited slowly developing inward currents (Fig. 7A) sensitive to the bradycardic agent ZD7288, a specific and isoform-nonselective blocker of HCN channels (BoSmith et al., 1993; Harris and Constanti, 1995; Gasparini and DiFrancesco, 1997) that binds to the channel's S6-helix with high affinity and very slow off kinetics resulting in an almost irreversible block (Postea and Biel, 2011). Steady-state activation curves derived from control tail current recordings showed a sigmoidal dependence on hyperpolarizing voltage (Fig. 7B). Together, these data confirm the presence of Ih in rodent VSNs (Dibattista et al., 2008).
Figure 7.

Vomeronasal HCN channels are modulated by extracellular protons. A, Ih recorded from a representative VSN (whole-cell voltage clamp). The cell was held at −50 mV and hyperpolarized for 1.5 s in steps of 5 mV from −50 to −140 mV before stepping back to −90 mV for 300 ms. Traces represent recordings under control conditions (pH 7.3; left) and in the presence of the specific HCN channel antagonist ZD7288 (100 μm; middle). When data recorded during drug treatment are digitally subtracted from control recordings, the ZD7288-sensitive current becomes apparent (right). Inset, Pulse protocol for HCN channel activation. B, Normalized Ih activation curve. Steady-state current amplitudes are measured upon stepping back to −90 mV (asterisk in A) and plotted as a function of prepulse hyperpolarization. The solid black line represents a sigmoidal fit to the data points (mean ± SEM; V0.5 = −108.8 ± 0.3 mV; slope constant, 11.3 ± 0.3). The numbers of neurons analyzed under control conditions (black) as well as during treatment (red) are shown in parentheses. Inset, Expanded view of steady-state currents shown in A (dashed red rectangles) under control conditions and in the presence of ZD7288, respectively. C, D, Ih activation at different extracellular pH values. C, Hyperpolarization-evoked currents under acidic conditions (pH 5; left), in the presence of ZD7288 (100 μm; middle) and after off-line subtraction (right). D, Normalized Ih activation curves at different extracellular proton concentrations. Solid lines represent sigmoidal fits to the data points (mean ± SEM). Note that acidification shifts activation curves toward more positive potentials. The numbers of neurons analyzed are shown in parentheses. The dashed horizontal gray line marks an arbitrary threshold of 5% current activation. E, F, Effect of extracellular acidification on Ih activation threshold (5%; E) and half-maximal activation (V0.5; F). Data are derived from individual activation curve fits and presented as means ± SEM. The numbers of neurons analyzed are shown adjacent to each data point. Orange dots indicate results from ZD7288-sensitive currents obtained by off-line subtraction. Note that pharmacological isolation of Ih suggests an even stronger impact of extracellular pH. G, Semilogarithmic plot of Ih activation time constants versus hyperpolarizing membrane potential. Average τact values (±SEM) are derived from monoexponential fits (inset) to ZD7288-sensitive current traces under control conditions (pH 7.3; black; n = 3) and during acidification (pH 5; orange; n = 8). An estimate for τact under acidic conditions (pH 5) at rest (−70 mV) can be obtained by linear extrapolation (dashed orange lines). H, Representative Ih current–voltage relationship. ZD7288-sensitive plateau currents (arrowhead in A) are plotted against a hyperpolarizing step pulse. Erev is calculated by linear regression of data points corresponding to full activation (red dots; derived from individual activation curves).
Next, we analyzed Ih activation at different acidic [H+]e (Fig. 7C–F; Stevens et al., 2001). With increasing acidification, normalized current activation curves shift toward more positive potentials (Fig. 7D). Over approximately three pH units, this effect manifests as a ∼29 mV depolarizing shift in Ih activation threshold (Fig. 7E) and a ∼32 mV change in half-maximal (V0.5) activation (Fig. 7F). Moreover, we observed a pH-dependent acceleration of current activation (Fig. 7G). When plotted on a semilogarithmic scale, linear extrapolation predicts an activation time constant of ∼2.3 s at −70 mV (n = 8), a value similar to the average τact derived from acid-evoked currents in VSNs (Fig. 6C). In addition, we obtained Erev estimates for vomeronasal Ih from linear fits to those data points in individual current–voltage plots that correspond to saturated activation curve values (Erev = −32.8 ± 8.4 mV; n = 7; Fig. 7H). Together, these results strongly suggest that mouse vomeronasal HCN channels respond to extracellular acidification with a substantial depolarizing shift of the activation voltage dependence and kinetics.
Ih expression typically manifests as a rebound depolarization (sag) at hyperpolarized potentials (Robinson and Siegelbaum, 2003). In current-clamp recordings, we thus measured the hyperpolarization-evoked sag potential in VSNs under control conditions and during extracellular acidification (Fig. 8A–C). Plotting the sag potential amplitude (Vsag) as a function of peak hyperpolarization reveals a pH-induced shift in the voltage dependence of sag amplitude toward more positive potentials (Fig. 8D). In conclusion, the above results identify extracellular acidification as a potent activator of vomeronasal Ih.
Figure 8.

Hyperpolarization-evoked sag potentials vary with [H+]e. A–C, Example membrane-voltage traces highlighting the effects of acidosis (pH 5) and ZD7288 on hyperpolarization-evoked sag potentials (Vsag). Responses to hyperpolarizing current injections (0 to −24 pA, −4 pA increments) show the voltage-dependence of Vsag amplitude. For quantification, Vsag is determined as the voltage difference between the peak hyperpolarization and the steady-state membrane potential (filled and open triangles, respectively; B). D, Vsag amplitude versus peak hyperpolarization (10 mV bins). Data represent the means ± SEM (control/pH 7.3, n = 11; pH 5, n = 11; pH 7.3 + ZD7288, n = 7). Note that, under acidic conditions, Vsag is significantly larger at hyperpolarizations ranging from −80 to −110 mV (unpaired t test; *1p = 0.0014; *2p = 0.0003; *3p = 0.0003). Moreover, no sag is observed in presence of ZD7288.
Subcellular distribution of vomeronasal HCN channels
Previous work has reported transcription of two HCN channel genes, HCN2 and HCN4, in the mouse VNO (Dibattista et al., 2008), whereas transcripts for isoforms 1 and 3 were not detected. Our own previous large-scale gene expression profiling study (Hagendorf et al., 2009) confirmed these findings. However, the (sub)cellular vomeronasal distribution of either channel has not been described. Double immunostaining of coronal VNO cryosections against either HCN2 or HCN4 and the microvillar marker villin (Revenu et al., 2012) revealed prominent expression of HCN2 in the microvillar layer of the sensory neuroepithelium (Fig. 9A,B). HCN4, however, showed a broader epithelial distribution (Fig. 9C,D). Notably, strong immunosignals for both HCN2 and HCN4 were also detected in VSN axon bundles within the lamina propria (Fig. 9A,C). These data suggest that either HCN2 or HCN4 channels, or both, mediate hyperpolarization-evoked vomeronasal Ih currents and, consequently, Ih-dependent responses to extracellular acidification.
Figure 9.

Expression of HCN2 and HCN4 in the VNO sensory epithelium. A–D, Confocal laser-scanning microscopic images of the vomeronasal neuroepithelium. A, B, Double immunofluorescence labeling for HCN2 (green) and villin (red) and nuclear staining with ToPro (blue). B, High-magnification single optical section images from the boxed area in A. Note the colabeling of HCN2 and villin in the merged image (right). C, Confocal images showing the VNO sensory epithelium stained with an antibody against HCN4 (green). Nuclear staining with ToPro (blue) is also shown. D, High-magnification merged optical sections from the boxed area in C. AB, Axon bundles; SCL, sustentacular cell layer; ML, microvillar layer; L, lumen.
Acid-evoked responses depend on HCN channel modulation
If VSN responses to extracellular acidification are indeed mediated by pH-sensitive vomeronasal HCN channels, acid-evoked signals should be (1) blocked by ZD7288 and (2) correlated in magnitude to the pH-dependent shift in Ih activation. To test whether these assumptions are met by acid-evoked VSN signals, we recorded VSN currents across a hyperpolarized voltage range (−60 to −120 mV) at neutral (7.3) and acidic (4.0) pHs, respectively (Fig. 10A). Digital off-line subtraction unmasked the acid-sensitive current and its voltage dependence (Fig. 10B). The resulting currents closely followed a model I–V relationship derived from subtraction of the average activation curves at pH 7.3 (control) and pH 4.0 (Figs. 7D, 10B, inset). Next, we recorded VSN responses to an acidic solution (pH 4; Vhold = −70 mV) in the absence and presence of ZD7288 (Fig. 10C,D). The drug considerably reduced acid-evoked currents. Moreover, action potential discharge triggered by extracellular acidification was substantially reduced, if not abolished, by ZD7288 (Fig. 10E–H). Drug treatment, however, did not affect general discharge capacity when VSN firing was induced by current injection (Fig. 10I). Finally, when pH 5-dependent membrane depolarization in individual VSNs is plotted as a function of each neuron's Ih activation threshold, correlation of both parameters becomes apparent (Fig. 10J). Together, these results strongly suggest that pH-dependent modulation of HCN channel activation underlies VSN sensitivity to extracellular acidification.
Figure 10.
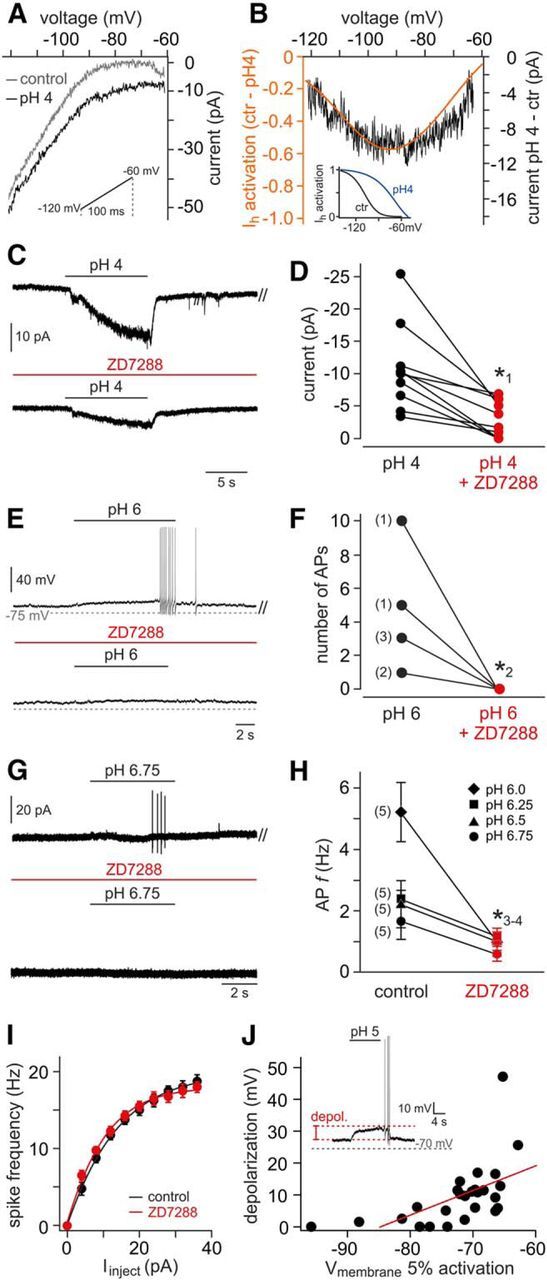
Acid-evoked VSN responses are mediated by HCN channels. A, Original voltage ramp recordings from a representative VSN. Traces represent currents across a hyperpolarized voltage range (inset; −120 to −60 mV; ramp duration, 100 ms) recorded under control (pH 7.3, gray) and acidic conditions (pH 4, black). B, Acid-sensitive current (black) revealed by off-line subtraction of traces shown in A. Superimposed is a model I–V curve (orange) derived from subtraction of Ih activation curve fits (inset; pH 7.3 to pH 4.0). Ctr, Control. C, Representative recordings of pH 4-induced VSN responses. ZD7288 treatment (100 μm; preincubation, ≥400 s) strongly reduced current amplitude. D, Quantification of data shown in C. Data points correspond to peak current measurements in the absence (black) and presence (red) of ZD7288, respectively. Data from individual VSNs are connected by black lines. When normalized to control responses, average current densities are significantly reduced (39 ± 10%; n = 10). The asterisk (*1) denotes statistical significance; p = 0.018 (paired-sample t test). E–H, Acid-evoked firing is diminished by HCN channel inhibition. E, Membrane voltage deflections and action potential discharge elicited by acidic solution (pH 6) in the absence and presence of ZD7288 (100 μm; preincubation, ≥400 s). F, Quantification of data shown in E. The action potential counts before and after HCN channel block are compared. The numbers of neurons corresponding to each data point are shown in parentheses. The asterisk (*2) denotes statistical significance; p = 0.019 (paired-sample t test). G, Representative original recordings (loose-seal cell-attached configuration) of action potential firing, or the lack thereof, from a single neuron in response to mild acidification (pH 6.75) in the absence (top) and presence (bottom) of ZD7288 (100 μm; preincubation, ≥400 s). H, Spike frequency quantification of discharge data obtained from VSNs exposed to variable levels of acidification (pH 6.75 to pH 6.0; mean ± SEM). VSN numbers corresponding to each pair of data points are shown in parentheses. The asterisks (*3-4) denote statistical significance (paired-sample t test); *3p = 0.02 (pH 6.0); *4p = 0.03 (pH 6.25). I, Plot of mean firing rate versus stationary current input (f–I curve) in the absence (black) and presence (red) of ZD7288 (n = 4). Data represent mean ± SEM. J, Scatter plot depicting the relationship between Ih activation thresholds (i.e., 5% current activation) and amplitudes of evoked depolarizations (inset) under acidic conditions (pH 5). Linear regression indicates correlation of the parameters (Pearson's correlation coefficient, r = 0.576; n = 28 cells).
Discussion
Rodent urine is a rich source of semiochemicals. As such, it represents a repository of conspecific chemosignals that promote social behavior. Among these signals are cues that report a female's cycle stage (Lydell and Doty, 1972; Johnston and Bronson, 1982; He et al., 2008; Achiraman et al., 2010; Nielsen et al., 2011; Haga-Yamanaka et al., 2014) and consequently sexual receptivity (Davies and Bellamy, 1974; Aron, 1979). Here, we report estrus-specific drops in mouse urinary pH. This cycle-dependent modification is observed exclusively in sexually experienced females. Behavioral analysis and in vivo recordings from AOB neurons reveal that urinary pH constitutes a chemosensory signaling parameter that can be, at least in part, detected by the vomeronasal system. A focused electrophysiological study of VNO sensory neurons in acute tissue slices indicates their direct sensitivity to extracellular acidosis. Essentially all VSNs respond to extracellular acidification with a slowly developing nondesensitizing inward current that drives dose-dependent membrane depolarization. We show that even relatively mild vomeronasal mucus acidification (pH ≤ 6.75) is sufficient to activate VSNs, and we observe that acid-evoked currents share the hallmarks of Ih. Accordingly, we identify extracellular acidification as a potent activator of vomeronasal Ih and suggest that modulation of either HCN2 or HCN4 channels, or both, causes VSN acid sensitivity. The underlying mechanism is a pH-induced shift in the voltage-dependence of Ih activation that opens HCN channels at rest, thereby promoting an increase in VSN excitability.
For mice fed on a standard rodent diet, wild-type mouse urinary pH between 6.1 and 7.5 has been reported (Finberg et al., 2005; Cheval et al., 2006; Kovacikova et al., 2006; Reisinger et al., 2009; Izumi et al., 2011). Few of these studies, however, outlined gender-specific results (Cheval et al., 2006; Reisinger et al., 2009), and none distinguished between female cycle stages. In general, systemic acid–base balance and, consequently, urinary net acid excretion are controlled by renal mechanisms that either acidify urine or buffer protons. A major regulator of acidification is the vacuolar-type H+-ATPase (Finberg et al., 2005). This potent mediator of H+ secretion is expressed in apical membranes of type A intercalated cells of the collecting duct. Interestingly, H+-ATPase plasma membrane expression is under tight endocrine control with 17-β-estradiol promoting membrane incorporation of H+-ATPase containing vesicles (Hofmeister et al., 2012). Since, in mice, 17-β-estradiol levels increase on the preovulatory day, remain elevated during estrus, but decrease during metestrus (Walmer et al., 1992; Caligioni, 2009), an estrogen-dependent increase in renal H+-ATPase activity could explain the drop in urinary pH we observed during estrus.
Vomeronasal Ih expression has been reported previously in both frog and mouse VSNs (Liman and Corey, 1996; Trotier and Døving, 1996), and a small, though significant, contribution to setting the VSN resting membrane potential has been proposed (Dibattista et al., 2008). Our data confirm and extend these studies by demonstrating that extracellular acidification substantially shifts the voltage dependence of vomeronasal Ih activation, thereby promoting an increase in VSN excitability. Based on transcriptome profiling (Dibattista et al., 2008; Hagendorf et al., 2009), immunohistochemistry, and functional Ih characterization, we conclude that homomeric or heteromeric assembly of two of the four HCN channel isoforms—HCN2 and HCN4—underlies vomeronasal Ih. Half-maximal activation at approximately −110 mV as well as activation time constants of ∼200 ms at −140 mV and ∼1.5 s at −100 mV, respectively, are well in line with results obtained from heterologous expression of isoforms 2 and 4 (Craven and Zagotta, 2006; Biel et al., 2009). Extracellular acidification shifts the threshold voltage of Ih activation to values less than or equal to −60 mV. Based on extracellular spike recordings, this shift is sufficient to cause VSN depolarization under physiological conditions. The hyperpolarization-activated currents recorded in VSNs are rather small. However, given their extraordinarily high input resistance (Liman and Corey, 1996; Shimazaki et al., 2006), Ih amplitudes of only a few picoamperes will depolarize these neurons.
In general, HCN channels are modulated by a variety of physiological factors and pathways (Biel et al., 2009). Among those are a number of molecules previously implicated in vomeronasal signaling (Tirindelli et al., 2009) such as phosphatidylinositol-4,5-bisphosphate (Pian et al., 2006) and arachidonic acid (Fogle et al., 2007), as well as cytosolic protons (Munsch and Pape, 1999). HCN channel modulation by extracellular protons, however, has so far only been described for isoforms 1 and 4 in taste cells of the rat vallate papilla (Stevens et al., 2001). For recombinant HCN1 channels, the same study reported that strong acidification (pH 3.9) accelerates channel kinetics and shifts both V0.5 and the activation threshold by up to 35 and 50 mV, respectively (Stevens et al., 2001). Our results thus add to the notion that proton sensitivity might be a general feature of HCN channels in a variety of tissues.
The prototypic neuronal acid detectors are ASICs and the polymodal nocisensor TRPV1 (Holzer, 2009). While our results exclude a predominant role of these channels in driving the slow, sustained acid-evoked current observed in essentially all VSNs, we cannot rule out a more specialized function restricted, for example, to the VSN population that also displays a transient response component. Furthermore, we cannot exclude proton-dependent modulation of other VSN ion channels such as TRPC2. Although not statistically significant, we observed reduced acid-evoked currents in TRPC2−/− mice. Moreover, it is tempting to speculate that the small rebound current observed upon washout of the acidic solution can be attributed to open channel block removal. Similar effects of extracellular protons have been described for purinergic receptors (Stoop and Quayle, 1998) and voltage-gated Ca2+ channels (Pietrobon et al., 1989).
For changes in luminal pH to affect vomeronasal HCN channels in vivo, either paracellular proton permeability in the neuroepithelium must be substantial or the channels must be targeted to the microvillar layer. The generally small Ih amplitude recorded in VSNs suggests a rather low channel density. Yet, immunocytochemistry localizes HCN2 and HCN4 to VSNs and indicates some colocalization of HCN2 with a microvillar marker. In addition, en face Ca2+ imaging of the intact VNO epithelial surface demonstrates that transient luminal acidification indeed activates VSNs with threshold responses triggered by relatively mild acidification (pH 6.75). These findings, however, do not rule out that, depending on the claudin composition of the vomeronasal tight junction barrier (Günzel and Yu, 2013), paracellular proton permeability could add considerably to VSN stimulation. In particular, claudin-2 would decrease the overall epithelial resistance and render the VNO neuroepithelium rather “leaky.” However, freeze-fracture studies of rodent vomeronasal epithelia have revealed extensive tight junctional complexes (Miragall et al., 1979; Miragall and Mendoza, 1982; Mendoza and Breipohl, 1983).
The in vivo effects of pH variation on AOB neurons are not a simple mirror image of the direct acid-dependent changes in VSN excitability that result from Ih modulation. Urinary acidification mediated neither general activation nor broad silencing of AOB activity, but rather subtle response pattern modulations. Although we did observe cases in which decreasing urine pH elicited stronger responses, such monotonic linearity was rather the exception than the rule. Already, at the VSN level, several complementary mechanisms could underlie vomeronasal sensitivity to stimulus pH. Aside from a direct effect on Ih, acidic stimulus conditions are likely to change ligand properties as well. Moreover, changes in luminal pH could affect the extracellular domains of primary signal transduction proteins and thus alter their physiological function(s). Future studies will aim to pinpoint the individual contribution of each mechanism.
Notably, the VNO and the AOB represent distinct stages of information detection/processing within the accessory olfactory pathway, and the principles of sensory input transformation from VNO to AOB appear highly complex (Meeks et al., 2010; Tolokh et al., 2013). As one of only two processing stages that separate vomeronasal input from hypothalamic output (Halpern, 1987), the AOB subserves complex aspects of neural coding. For representation of sex-selective cues in particular, (lateral) inhibition appears to play a widespread role in AOB processing (Hendrickson et al., 2008). Moreover, the potentially heterotypic glomerular organization of VSN-to-mitral cell connectivity (Wagner et al., 2006) provides an anatomical substrate for both response selectivity (Luo et al., 2003) and hierarchical integration of socially relevant cues (Meeks et al., 2010; Haga-Yamanaka et al., 2014).
What is the physiological function of vomeronasal proton sensitivity? As behavioral analysis and in vivo AOB recordings demonstrate, stimulus pH emerges as a novel dimension in vomeronasal system function. However, in an in vivo setting, acidification does not simply activate, but instead seems to play a modulatory role. Indeed, a scenario of “linear dependence” between the neural representations of a multidimensional stimulus such as urine and a unidimensional factor such as pH would entail a dramatic loss of information-coding space. Adding a dimension (acidity) that is informative on its own (endocrine state), however, will increase coding capacity. Another intriguing possibility is that pH sensitivity might not only play a role in sensing external, but also in detecting internal conditions. For example, systemic acidification during estrus could change vomeronasal mucus pH and thus alter “intrinsic” VNO excitability during the estrus cycle. While it is impossible to specify the luminal proton concentration effectively acting on VSNs in a physiologically relevant context, stimulus dilution by the vomeronasal mucus will most likely result in mild acidification and, consequently, subthreshold effects of Ih activation. For a stimulus such as female urine, however, the estrus-dependent drop in pH could readily result in a general subthreshold increase in VSN excitability, and thus raise the “alert level” of the recipient.
Footnotes
This work was supported by grants from the Volkswagen Foundation (I/83533), the Deutsche Forschungsgemeinschaft (SP724/7-1), DFG priority program SPP 1392: Integrative Analysis of Olfaction, and the German-Israeli Foundation for Scientific Research and Development (1-1193-153.13/2012), and by the Excellence Initiative of the German federal and state governments. M.S. is a Lichtenberg Professor of the Volkswagen Foundation. We thank Tom Bozza (Northwestern University) for help with behavioral experiments and Susanne Lipartowski (RWTH Aachen University) for excellent technical assistance.
The authors declare no competing financial interests.
References
- Achiraman S, Archunan G, Ponmanickam P, Rameshkumar K, Kannan S, John G. 1-Iodo-2 methylundecane [1I2MU]: an estrogen-dependent urinary sex pheromone of female mice. Theriogenology. 2010;74:345–353. doi: 10.1016/j.theriogenology.2010.01.027. [DOI] [PubMed] [Google Scholar]
- Andreolini F, Jemiolo B, Novotny M. Dynamics of excretion of urinary chemosignals in the house mouse (Mus musculus) during the natural estrous cycle. Experientia. 1987;43:998–1002. doi: 10.1007/BF01952217. [DOI] [PubMed] [Google Scholar]
- Angelo K, London M, Christensen SR, Häusser M. Local and global effects of I(h) distribution in dendrites of mammalian neurons. J Neurosci. 2007;27:8643–8653. doi: 10.1523/JNEUROSCI.5284-06.2007. [DOI] [PMC free article] [PubMed] [Google Scholar]
- Aron C. Mechanisms of control of the reproductive function by olfactory stimuli in female mammals. Physiol Rev. 1979;59:229–284. doi: 10.1152/physrev.1979.59.2.229. [DOI] [PubMed] [Google Scholar]
- Barry PH. JPCalc, a software package for calculating liquid junction potential corrections in patch-clamp, intracellular, epithelial and bilayer measurements and for correcting junction potential measurements. J Neurosci Methods. 1994;51:107–116. doi: 10.1016/0165-0270(94)90031-0. [DOI] [PubMed] [Google Scholar]
- Beaumont V, Zucker RS. Enhancement of synaptic transmission by cyclic AMP modulation of presynaptic Ih channels. Nat Neurosci. 2000;3:133–141. doi: 10.1038/72072. [DOI] [PubMed] [Google Scholar]
- Ben-Shaul Y, Katz LC, Mooney R, Dulac C. In vivo vomeronasal stimulation reveals sensory encoding of conspecific and allospecific cues by the mouse accessory olfactory bulb. Proc Natl Acad Sci U S A. 2010;107:5172–5177. doi: 10.1073/pnas.0915147107. [DOI] [PMC free article] [PubMed] [Google Scholar]
- Berg JM, Tymoczko JL, Stryer L. Biochemistry. Ed 7. New York: W. H. Freeman; 2010. [Google Scholar]
- Biel M, Wahl-Schott C, Michalakis S, Zong X. Hyperpolarization-activated cation channels: from genes to function. Physiol Rev. 2009;89:847–885. doi: 10.1152/physrev.00029.2008. [DOI] [PubMed] [Google Scholar]
- BoSmith RE, Briggs I, Sturgess NC. Inhibitory actions of ZENECA ZD7288 on whole-cell hyperpolarization activated inward current (If) in guinea-pig dissociated sinoatrial node cells. Br J Pharmacol. 1993;110:343–349. doi: 10.1111/j.1476-5381.1993.tb13815.x. [DOI] [PMC free article] [PubMed] [Google Scholar]
- Brennan PA, Kendrick KM. Mammalian social odours: attraction and individual recognition. Philos Trans R Soc Lond B Biol Sci. 2006;361:2061–2078. doi: 10.1098/rstb.2006.1931. [DOI] [PMC free article] [PubMed] [Google Scholar]
- Byers SL, Wiles MV, Dunn SL, Taft RA. Mouse estrous cycle identification tool and images. PLoS One. 2012;7:e35538. doi: 10.1371/journal.pone.0035538. [DOI] [PMC free article] [PubMed] [Google Scholar]
- Caligioni C. Assessing reproductive status/stages in mice. Curr Protoc Neurosci. 2009;48:A.4I.1–A.4I.8. doi: 10.1002/0471142301.nsa04is48. [Appendix] [DOI] [PMC free article] [PubMed] [Google Scholar]
- Cheval L, Morla L, Elalouf JM, Doucet A. Kidney collecting duct acid-base “regulon”. Physiol Genom. 2006;27:271–281. doi: 10.1152/physiolgenomics.00069.2006. [DOI] [PubMed] [Google Scholar]
- Craven KB, Zagotta WN. CNG and HCN channels: two peas, one pod. Annu Rev Physiol. 2006;68:375–401. doi: 10.1146/annurev.physiol.68.040104.134728. [DOI] [PubMed] [Google Scholar]
- Davies VJ, Bellamy D. Effects of female urine on social investigation in male mice. Anim Behav. 1974;22:239–241. doi: 10.1016/S0003-3472(74)80074-6. [DOI] [PubMed] [Google Scholar]
- Dibattista M, Mazzatenta A, Grassi F, Tirindelli R, Menini A. Hyperpolarization-activated cyclic nucleotide-gated channels in mouse vomeronasal sensory neurons. J Neurophysiol. 2008;100:576–586. doi: 10.1152/jn.90263.2008. [DOI] [PubMed] [Google Scholar]
- DiFrancesco D. A new interpretation of the pace-maker current in calf Purkinje fibres. J Physiol. 1981;314:359–376. doi: 10.1113/jphysiol.1981.sp013713. [DOI] [PMC free article] [PubMed] [Google Scholar]
- DiFrancesco D. Characterization of single pacemaker channels in cardiac sino-atrial node cells. Nature. 1986;324:470–473. doi: 10.1038/324470a0. [DOI] [PubMed] [Google Scholar]
- Doty RL. Odor-guided behavior in mammals. Experientia. 1986;42:257–271. doi: 10.1007/BF01942506. [DOI] [PubMed] [Google Scholar]
- Duprat F, Lesage F, Fink M, Reyes R, Heurteaux C, Lazdunski M. TASK, a human background K+ channel to sense external pH variations near physiological pH. EMBO J. 1997;16:5464–5471. doi: 10.1093/emboj/16.17.5464. [DOI] [PMC free article] [PubMed] [Google Scholar]
- Ferrero DM, Liberles SD. The secret codes of mammalian scents. Wiley Interdiscip Rev Syst Biol Med. 2010;2:23–33. doi: 10.1002/wsbm.39. [DOI] [PubMed] [Google Scholar]
- Ferrero DM, Moeller LM, Osakada T, Horio N, Li Q, Roy DS, Cichy A, Spehr M, Touhara K, Liberles SD. A juvenile mouse pheromone inhibits sexual behaviour through the vomeronasal system. Nature. 2013;502:368–371. doi: 10.1038/nature12579. [DOI] [PMC free article] [PubMed] [Google Scholar]
- Finberg KE, Wagner CA, Bailey MA, Paunescu TG, Breton S, Brown D, Giebisch G, Geibel JP, Lifton RP. The B1-subunit of the H(+) ATPase is required for maximal urinary acidification. Proc Natl Acad Sci U S A. 2005;102:13616–13621. doi: 10.1073/pnas.0506769102. [DOI] [PMC free article] [PubMed] [Google Scholar]
- Fluegge D, Moeller LM, Cichy A, Gorin M, Weth A, Veitinger S, Cainarca S, Lohmer S, Corazza S, Neuhaus EM, Baumgartner W, Spehr J, Spehr M. Mitochondrial Ca2+ mobilization is a key element in olfactory signaling. Nat Neurosci. 2012;15:754–762. doi: 10.1038/nn.3074. [DOI] [PubMed] [Google Scholar]
- Fogle KJ, Lyashchenko AK, Turbendian HK, Tibbs GR. HCN pacemaker channel activation is controlled by acidic lipids downstream of diacylglycerol kinase and phospholipase A2. J Neurosci. 2007;27:2802–2814. doi: 10.1523/JNEUROSCI.4376-06.2007. [DOI] [PMC free article] [PubMed] [Google Scholar]
- Gasparini S, DiFrancesco D. Action of the hyperpolarization-activated current (Ih) blocker ZD 7288 in hippocampal CA1 neurons. Pflugers Arch. 1997;435:99–106. doi: 10.1007/s004240050488. [DOI] [PubMed] [Google Scholar]
- Giocomo LM, Hussaini SA, Zheng F, Kandel ER, Moser MB, Moser EI. Grid cells use HCN1 channels for spatial scaling. Cell. 2011;147:1159–1170. doi: 10.1016/j.cell.2011.08.051. [DOI] [PubMed] [Google Scholar]
- Günzel D, Yu ASL. Claudins and the modulation of tight junction permeability. Physiol Rev. 2013;93:525–569. doi: 10.1152/physrev.00019.2012. [DOI] [PMC free article] [PubMed] [Google Scholar]
- Haga-Yamanaka S, Ma L, He J, Qiu Q, Lavis LD, Looger LL, Yu CR. Integrated action of pheromone signals in promoting courtship behavior in male mice. Elife. 2014;3:e03025–e03025. doi: 10.7554/eLife.03025. [DOI] [PMC free article] [PubMed] [Google Scholar]
- Hagendorf S, Fluegge D, Engelhardt C, Spehr M. Homeostatic control of sensory output in basal vomeronasal neurons: activity-dependent expression of ether-à-go-go-related gene potassium channels. J Neurosci. 2009;29:206–221. doi: 10.1523/JNEUROSCI.3656-08.2009. [DOI] [PMC free article] [PubMed] [Google Scholar]
- Halpern M. The organization and function of the vomeronasal organ. Annu Rev Neurosci. 1987;10:325–362. doi: 10.1146/annurev.ne.10.030187.001545. [DOI] [PubMed] [Google Scholar]
- Harris KD, Henze DA, Csicsvari J, Hirase H, Buzsáki G. Accuracy of tetrode spike separation as determined by simultaneous intracellular and extracellular measurements. J Neurophysiol. 2000;84:401–414. doi: 10.1152/jn.2000.84.1.401. [DOI] [PubMed] [Google Scholar]
- Harris NC, Constanti A. Mechanism of block by ZD 7288 of the hyperpolarization-activated inward rectifying current in guinea pig substantia nigra neurons in vitro. J Neurophysiol. 1995;74:2366–2378. doi: 10.1152/jn.1995.74.6.2366. [DOI] [PubMed] [Google Scholar]
- Harzheim D, Pfeiffer KH, Fabritz L, Kremmer E, Buch T, Waisman A, Kirchhof P, Kaupp UB, Seifert R. Cardiac pacemaker function of HCN4 channels in mice is confined to embryonic development and requires cyclic AMP. EMBO J. 2008;27:692–703. doi: 10.1038/emboj.2008.3. [DOI] [PMC free article] [PubMed] [Google Scholar]
- Hayashi S, Kimura T. Sex-attractant emitted by female mice. Physiol Behav. 1974;13:563–567. doi: 10.1016/0031-9384(74)90287-X. [DOI] [PubMed] [Google Scholar]
- Hazan L, Zugaro M, Buzsáki G. Klusters, NeuroScope, NDManager: A free software suite for neurophysiological data processing and visualization. J Neurosci Methods. 2006;155:207–216. doi: 10.1016/j.jneumeth.2006.01.017. [DOI] [PubMed] [Google Scholar]
- He J, Ma L, Kim S, Nakai J, Yu CR. Encoding gender and individual information in the mouse vomeronasal organ. Science. 2008;320:535–538. doi: 10.1126/science.1154476. [DOI] [PMC free article] [PubMed] [Google Scholar]
- Hendrickson RC, Krauthamer S, Essenberg JM, Holy TE. Inhibition shapes sex selectivity in the mouse accessory olfactory bulb. J Neurosci. 2008;28:12523–12534. doi: 10.1523/JNEUROSCI.2715-08.2008. [DOI] [PMC free article] [PubMed] [Google Scholar]
- Holy TE, Dulac C, Meister M. Responses of vomeronasal neurons to natural stimuli. Science. 2000;289:1569–1572. doi: 10.1126/science.289.5484.1569. [DOI] [PubMed] [Google Scholar]
- Holzer P. Acid-sensitive ion channels and receptors. In: Canning BJ, Spina D, editors. Handbook of experimental pharmacology. Berlin: Springer; 2009. pp. 283–323. [DOI] [PMC free article] [PubMed] [Google Scholar]
- Izumi Y, Hori K, Nakayama Y, Kimura M, Hasuike Y, Nanami M, Kohda Y, Otaki Y, Kuragano T, Obinata M, Kawahara K, Tanoue A, Tomita K, Nakanishi T, Nonoguchi H. Aldosterone requires vasopressin V1a receptors on intercalated cells to mediate acid-base homeostasis. J Am Soc Nephrol. 2011;22:673–680. doi: 10.1681/ASN.2010050468. [DOI] [PMC free article] [PubMed] [Google Scholar]
- Johnston RE, Bronson F. Endocrine control of female mouse odors that elicit luteinizing hormone surges and attraction in males. Biol Reprod. 1982;27:1174–1180. doi: 10.1095/biolreprod27.5.1174. [DOI] [PubMed] [Google Scholar]
- Kelliher KR, Wersinger SR. Olfactory regulation of the sexual behavior and reproductive physiology of the laboratory mouse: effects and neural mechanisms. ILAR J. 2009;50:28–42. doi: 10.1093/ilar.50.1.28. [DOI] [PubMed] [Google Scholar]
- Kim S, Ma L, Jensen KL, Kim MM, Bond CT, Adelman JP, Yu CR. Paradoxical contribution of SK3 and GIRK channels to the activation of mouse vomeronasal organ. Nat Neurosci. 2012;15:1236–1244. doi: 10.1038/nn.3173. [DOI] [PMC free article] [PubMed] [Google Scholar]
- Kovacikova J, Winter C, Loffing-Cueni D, Loffing J, Finberg KE, Lifton RP, Hummler E, Rossier B, Wagner CA. The connecting tubule is the main site of the furosemide-induced urinary acidification by the vacuolar H+-ATPase. Kidney Int. 2006;70:1706–1716. doi: 10.1038/sj.ki.5001851. [DOI] [PubMed] [Google Scholar]
- Kurien BT, Everds NE, Scofield RH. Experimental animal urine collection: a review. Lab Anim. 2004;38:333–361. doi: 10.1258/0023677041958945. [DOI] [PubMed] [Google Scholar]
- Leinders-Zufall T, Lane AP, Puche AC, Ma W, Novotny M V, Shipley MT, Zufall F. Ultrasensitive pheromone detection by mammalian vomeronasal neurons. Nature. 2000;405:792–796. doi: 10.1038/35015572. [DOI] [PubMed] [Google Scholar]
- Lesage F, Lazdunski M. Molecular and functional properties of two-pore-domain potassium channels. Am J Physiol Renal Physiol. 2000;279:793–801. doi: 10.1152/ajprenal.2000.279.5.F793. [DOI] [PubMed] [Google Scholar]
- Leypold BG, Yu CR, Leinders-Zufall T, Kim MM, Zufall F, Axel R. Altered sexual and social behaviors in trp2 mutant mice. Proc Natl Acad Sci U S A. 2002;99:6376–6381. doi: 10.1073/pnas.082127599. [DOI] [PMC free article] [PubMed] [Google Scholar]
- Liman ER, Corey DP. Electrophysiological characterization of chemosensory neurons from the mouse vomeronasal organ. J Neurosci. 1996;16:4625–4637. doi: 10.1523/JNEUROSCI.16-15-04625.1996. [DOI] [PMC free article] [PubMed] [Google Scholar]
- Luo M, Fee MS, Katz LC. Encoding pheromonal signals in the accessory olfactory bulb of behaving mice. Science. 2003;299:1196–1201. doi: 10.1126/science.1082133. [DOI] [PubMed] [Google Scholar]
- Lydell K, Doty RL. Male rat of odor preferences for female urine as a function of sexual experience, urine age, and urine source. Horm Behav. 1972;3:205–212. doi: 10.1016/0018-506X(72)90033-5. [DOI] [PubMed] [Google Scholar]
- Magee JC. Dendritic integration of excitatory synaptic input. Nat Rev Neurosci. 2000;1:181–190. doi: 10.1038/35044552. [DOI] [PubMed] [Google Scholar]
- Mataruga A, Kremmer E, Müller F. Type 3a and type 3b OFF cone bipolar cells provide for the alternative rod pathway in the mouse retina. J Comp Neurol. 2007;502:1123–1137. doi: 10.1002/cne.21367. [DOI] [PubMed] [Google Scholar]
- McLean AC, Valenzuela N, Fai S, Bennett SA. Performing vaginal lavage, crystal violet staining, and vaginal cytological evaluation for mouse estrous cycle staging identification. J Vis Exp. 2012;67:e4389. doi: 10.3791/4389. [DOI] [PMC free article] [PubMed] [Google Scholar]
- Meeks JP, Arnson HA, Holy TE. Representation and transformation of sensory information in the mouse accessory olfactory system. Nat Neurosci. 2010;13:723–730. doi: 10.1038/nn.2546. [DOI] [PMC free article] [PubMed] [Google Scholar]
- Mendoza AS, Breipohl W. The cell coat of the olfactory epithelium proper and vomeronasal neuroepithelium of the rat as revealed by means of the Ruthenium-red reaction. Cell Tissue Res. 1983;230:139–146. doi: 10.1007/BF00216034. [DOI] [PubMed] [Google Scholar]
- Miragall F, Mendoza AS. Intercellular junctions in the rat vomeronasal neuroepithelium: a freeze-fracture study. J Submicrosc Cytol. 1982;14:597–605. [PubMed] [Google Scholar]
- Miragall F, Breipohl W, Bhatnagar KP. Ultrastructural investigation on the cell membranes of the vomeronasal organ in the rat: a freeze-etching study. Cell Tissue Res. 1979;200:397–408. doi: 10.1007/BF00234851. [DOI] [PubMed] [Google Scholar]
- Munsch T, Pape HC. Modulation of the hyperpolarization-activated cation current of rat thalamic relay neurones by intracellular pH. J Physiol. 1999;519:493–504. doi: 10.1111/j.1469-7793.1999.0493m.x. [DOI] [PMC free article] [PubMed] [Google Scholar]
- Nielsen BL, Jerôme N, Saint-Albin A, Thonat C, Briant C, Boué F, Rampin O, Maurin Y. A mixture of odorant molecules potentially indicating oestrus in mammals elicits penile erections in male rats. Behav Brain Res. 2011;225:584–589. doi: 10.1016/j.bbr.2011.08.026. [DOI] [PubMed] [Google Scholar]
- Noma A, Irisawa H. Membrane currents in the rabbit sinoatrial node cell as studied by the double microelectrode method. Pflugers Arch. 1976;52:45–52. doi: 10.1007/BF01062910. [DOI] [PubMed] [Google Scholar]
- Novotny MV. Pheromones, binding proteins and receptor responses in rodents. Biochem Soc Trans. 2003;31:117–122. doi: 10.1042/bst0310117. [DOI] [PubMed] [Google Scholar]
- Pankevich DE, Baum MJ, Cherry JA. Olfactory sex discrimination persists, whereas the preference for urinary odorants from estrous females disappears in male mice after vomeronasal organ removal. J Neurosci. 2004;24:9451–9457. doi: 10.1523/JNEUROSCI.2376-04.2004. [DOI] [PMC free article] [PubMed] [Google Scholar]
- Pape HC. Queer current and pacemaker: the hyperpolarization-activated cation current in neurons. Annu Rev Physiol. 1996;58:299–327. doi: 10.1146/annurev.ph.58.030196.001503. [DOI] [PubMed] [Google Scholar]
- Petrulis A. Chemosignals, hormones and mammalian reproduction. Horm Behav. 2013;63:723–741. doi: 10.1016/j.yhbeh.2013.03.011. [DOI] [PMC free article] [PubMed] [Google Scholar]
- Pian P, Bucchi A, Robinson RB, Siegelbaum SA. Regulation of gating and rundown of HCN hyperpolarization-activated channels by exogenous and endogenous PIP2. J Gen Physiol. 2006;128:593–604. doi: 10.1085/jgp.200609648. [DOI] [PMC free article] [PubMed] [Google Scholar]
- Pietrobon D, Prod'hom B, Hess P. Interactions of protons with single open L-type calcium channels. J Gen Physiol. 1989;94:1–21. doi: 10.1085/jgp.94.1.1. [DOI] [PMC free article] [PubMed] [Google Scholar]
- Postea O, Biel M. Exploring HCN channels as novel drug targets. Nat Rev Drug Discov. 2011;10:903–914. doi: 10.1038/nrd3576. [DOI] [PubMed] [Google Scholar]
- Reisinger AJ, Tannehill-Gregg SH, Waites CR, Dominick MA, Schilling BE, Jackson TA. Dietary ammonium chloride for the acidification of mouse urine. J Am Assoc Lab Anim Sci. 2009;48:144–146. [PMC free article] [PubMed] [Google Scholar]
- Revenu C, Ubelmann F, Hurbain I, El-Marjou F, Dingli F, Loew D, Delacour D, Gilet J, Brot-Laroche E, Rivero F, Louvard D, Robine S. A new role for the architecture of microvillar actin bundles in apical retention of membrane proteins. Mol Biol Cell. 2012;23:324–336. doi: 10.1091/mbc.E11-09-0765. [DOI] [PMC free article] [PubMed] [Google Scholar]
- Rivière S, Challet L, Fluegge D, Spehr M, Rodriguez I. Formyl peptide receptor-like proteins are a novel family of vomeronasal chemosensors. Nature. 2009;459:574–577. doi: 10.1038/nature08029. [DOI] [PubMed] [Google Scholar]
- Robinson RB, Siegelbaum SA. Hyperpolarization-activated cation currents: from molecules to physiological function. Annu Rev Physiol. 2003;65:453–480. doi: 10.1146/annurev.physiol.65.092101.142734. [DOI] [PubMed] [Google Scholar]
- Röck F, Mueller S, Weimar U, Rammensee HG, Overath P. Comparative analysis of volatile constituents from mice and their urine. J Chem Ecol. 2006;32:1333–1346. doi: 10.1007/s10886-006-9091-2. [DOI] [PubMed] [Google Scholar]
- Shimazaki R, Boccaccio A, Mazzatenta A, Pinato G, Migliore M, Menini A. Electrophysiological properties and modeling of murine vomeronasal sensory neurons in acute slice preparations. Chem Senses. 2006;31:425–435. doi: 10.1093/chemse/bjj047. [DOI] [PubMed] [Google Scholar]
- Spehr J, Hagendorf S, Weiss J, Spehr M, Leinders-Zufall T, Zufall F. Ca2+ -calmodulin feedback mediates sensory adaptation and inhibits pheromone-sensitive ion channels in the vomeronasal organ. J Neurosci. 2009;29:2125–2135. doi: 10.1523/JNEUROSCI.5416-08.2009. [DOI] [PMC free article] [PubMed] [Google Scholar]
- Spehr M, Hatt H, Wetzel CH. Arachidonic acid plays a role in rat vomeronasal signal transduction. J Neurosci. 2002;22:8429–8437. doi: 10.1523/JNEUROSCI.22-19-08429.2002. [DOI] [PMC free article] [PubMed] [Google Scholar]
- Stevens DR, Seifert R, Bufe B, Müller F, Kremmer E, Gauss R, Meyerhof W, Kaupp UB, Lindemann B. Hyperpolarization-activated channels HCN1 and HCN4 mediate responses to sour stimuli. Nature. 2001;413:631–635. doi: 10.1038/35098087. [DOI] [PubMed] [Google Scholar]
- Stoop R, Quayle JM. Fading and rebound of P2X 2 currents at millimolar ATP concentrations caused by low pH. Br J Pharmacol. 1998;125:235–237. doi: 10.1038/sj.bjp.0702056. [DOI] [PMC free article] [PubMed] [Google Scholar]
- Stowers L, Holy TE, Meister M, Dulac C, Koentges G. Loss of sex discrimination and male-male aggression in mice deficient for TRP2. Science. 2002;295:1493–1500. doi: 10.1126/science.1069259. [DOI] [PubMed] [Google Scholar]
- Sturm T, Leinders-Zufall T, Maček B, Walzer M, Jung S, Pömmerl B, Stevanović S, Zufall F, Overath P, Rammensee H-G. Mouse urinary peptides provide a molecular basis for genotype discrimination by nasal sensory neurons. Nat Commun. 2013;4:1616. doi: 10.1038/ncomms2610. [DOI] [PubMed] [Google Scholar]
- Szallasi A, Cortright DN, Blum CA, Eid SR. The vanilloid receptor TRPV1: 10 years from channel cloning to antagonist proof-of-concept. Nat Rev Drug Discov. 2007;6:357–372. doi: 10.1038/nrd2280. [DOI] [PubMed] [Google Scholar]
- Tirindelli R, Dibattista M, Pifferi S, Menini A. From pheromones to behavior. Physiol Rev. 2009;89:921–956. doi: 10.1152/physrev.00037.2008. [DOI] [PubMed] [Google Scholar]
- Tolokh II, Fu X, Holy TE. Reliable sex and strain discrimination in the mouse vomeronasal organ and accessory olfactory bulb. J Neurosci. 2013;33:13903–13913. doi: 10.1523/JNEUROSCI.0037-13.2013. [DOI] [PMC free article] [PubMed] [Google Scholar]
- Trotier D, Døving KB. Direct influence of the sodium pump on the membrane potential of vomeronasal chemoreceptor neurones in frog. J Physiol. 1996;490:611–621. doi: 10.1113/jphysiol.1996.sp021171. [DOI] [PMC free article] [PubMed] [Google Scholar]
- Veitinger S, Veitinger T, Cainarca S, Fluegge D, Engelhardt CH, Lohmer S, Hatt H, Corazza S, Spehr J, Neuhaus EM, Spehr M. Purinergic signalling mobilizes mitochondrial Ca2+ in mouse Sertoli cells. J Physiol. 2011;589:5033–5055. doi: 10.1113/jphysiol.2011.216309. [DOI] [PMC free article] [PubMed] [Google Scholar]
- Hofmeister MV, Damkier HH, Christensen BM, Olde B, Fredrik Leeb-Lundberg LM, Fenton RA, Praetorius HA, Praetorius J. 17β-Estradiol induces nongenomic effects in renal intercalated cells through G protein-coupled estrogen receptor 1. Am J Physiol Renal Physiol. 2012;302:F358–F368. doi: 10.1152/ajprenal.00343.2011. [DOI] [PubMed] [Google Scholar]
- Wagner S, Gresser AL, Torello AT, Dulac C. A multireceptor genetic approach uncovers an ordered integration of VNO sensory inputs in the accessory olfactory bulb. Neuron. 2006;50:697–709. doi: 10.1016/j.neuron.2006.04.033. [DOI] [PubMed] [Google Scholar]
- Waldmann R, Champigny G, Bassilana F, Heurteaux C, Lazdunski M. A proton-gated cation channel involved in acid-sensing. Nature. 1997;386:173–177. doi: 10.1038/386173a0. [DOI] [PubMed] [Google Scholar]
- Walmer DK, Wrona MA, Hughes CL, Nelson KG. Lactoferrin expression in the mouse reproductive tract during the natural estrous cycle: correlation with circulating estradiol and progesterone. Endocrinology. 1992;131:1458–1466. doi: 10.1210/endo.131.3.1505477. [DOI] [PubMed] [Google Scholar]