

Abstract
Microcircuits are composed of multiple cell classes that likely serve unique circuit operations. But how cell classes map onto circuit functions is largely unknown, particularly for primate prefrontal cortex during actual goal-directed behavior. One difficulty in this quest is to reliably distinguish cell classes in extracellular recordings of action potentials. Here we surmount this issue and report that spike shape and neural firing variability provide reliable markers to segregate seven functional classes of prefrontal cells in macaques engaged in an attention task. We delineate an unbiased clustering protocol that identifies four broad spiking (BS) putative pyramidal cell classes and three narrow spiking (NS) putative inhibitory cell classes dissociated by how sparse, bursty, or regular they fire. We speculate that these functional classes map onto canonical circuit functions. First, two BS classes show sparse, bursty firing, and phase synchronize their spiking to 3–7 Hz (theta) and 12–20 Hz (beta) frequency bands of the local field potential (LFP). These properties make cells flexibly responsive to network activation at varying frequencies. Second, one NS and two BS cell classes show regular firing and higher rate with only marginal synchronization preference. These properties are akin to setting tonically the excitation and inhibition balance. Finally, two NS classes fired irregularly and synchronized to either theta or beta LFP fluctuations, tuning them potentially to frequency-specific subnetworks. These results suggest that a limited set of functional cell classes emerges in macaque prefrontal cortex (PFC) during attentional engagement to not only represent information, but to subserve basic circuit operations.
Keywords: anterior cingulate cortex, cell types, clustering, nonhuman primates, synchronization, variability
Introduction
Pyramidal neurons and the high diversity of interneurons are assumed to be the building blocks in the cortical microcircuit for canonical computations such as input integration, gating, context-specific coordination of subnetworks, and balance of excitation and inhibition (Constantinidis and Wang, 2004; Wang et al., 2004; Ascoli et al., 2008; DeFelipe et al., 2013; Womelsdorf et al., 2014b). Using stereotyped protocols, in vitro studies have identified a large variety of neuron subtypes defined by morphological, molecular, and electrophysiological properties (Markram et al., 2004; Ascoli et al., 2008; DeFelipe et al., 2013). However, the firing of neurons in a circuit is modulated in a state-dependent manner by the dynamics of the local population. Thus, characterizing cell diversity under natural conditions, as during ongoing goal-directed behavior, is essential to understand the specific role of cell classes in network function (Ascoli et al., 2008).
One procedure to delineate cell-specific functions in circuits is to manipulate the activity of a cell subtype with optogenetic techniques (Xue et al., 2014). While this endeavor is highly promising (Roux et al., 2014), it remains a major challenge to link the artificial light stimulation regime to the way circuits operate and dynamically recruit cell classes (Lee et al., 2014). Moreover, flexible use of optogenetic techniques is largely confined to studies in rodents, which compared with nonhuman primates are more limited in performing behavioral tasks of higher cognitive demands. The cortical microcircuit itself may vary across species (Preuss, 1995; Povysheva et al., 2007), and in the case of primate lateral prefrontal cortex (PFC) rodents may not possess functionally analogous circuits (Passingham and Wise, 2012). Thus, the macaque monkey provides a key model to study cell-specific circuit operations of the human PFC during higher cognitive operations. On the other hand, many of the insights from rodent and nonhuman primate in vitro studies as well as studies with behaving rodents may extrapolate to behaving primates. Therefore, it is critical to find ways to bridge the gap between these different sorts of cell-type studies and the cortical microcircuit in primates underlying goal-directed behavior.
Consequently, this study aims to identify cell diversity within prefrontal regions of the macaque monkey while performing an attention task (Kaping et al., 2011), as a step toward unraveling cell-specific circuit operations in PFC. For this, we analyzed major electrophysiological features in extracellularly recorded cells and scored them statistically according to their mutual redundancy and specific relevance. The five most informative measures, including properties of the spike waveform, averaged firing rate, and measures of the firing variability, distinguished seven cell classes, which hierarchically distributed in four classes of broad spiking (BS) cells and three classes of narrow spiking (NS) cells. These neurons, respectively, represented putative pyramidal cells and interneurons (Wilson et al., 1994; but see Vigneswaran et al., 2011 for a modest proportion of pyramidal cells with narrow spikes in deep layers of primary motor cortex).
Remarkably, distinct characteristics of cell classes in the PFC provide specific signatures that relate to network function. These results start to bridge the gap between slice studies, behaving rodent studies, and computational models of working memory and attention, and suggest the pieces and structural organization on top of which different views of efficient coding may converge.
Materials and Methods
Electrophysiological recording and data acquisition.
Single-cell activity and local field potentials (LFPs) were recorded while two male macaque monkeys were performing a selective attention, two-forced choice discrimination task that was described in detail previously (Kaping et al., 2011). In brief, the selective attention task involved 2 s intertrial intervals with a blank dark screen, before a small gray fixation point was presented centrally on the monitor. Monkeys had to direct their gaze and keep fixation onto that fixation point until the end of the trial. After 300 ms fixation, two black/white grating stimuli were presented to the left and right of the center and contained oblique movements of the grating within their circular aperture. After 0.4 s each stimuli changed color to either black/red or black/green. The color was associated with fluid reward if it was acted upon at a later stage during the trial. After a variable time (0.05–0.75 s) the color of the central fixation point changed to either red or green, which cued the monkeys to covertly shift attention toward the location where the color of the grating matched the color of the fixation point (Attention epoch). Monkeys had to maintain attention on the cued stimulus until it underwent a transient clockwise or counterclockwise rotation, ignoring possible rotations of the nonattended (uncued) stimulus, which occurred in 50% of the trials (Filter epoch). To obtain a liquid reward, the monkeys had to discriminate the rotation of the cued stimulus by making upward or downward saccades for clockwise/counterclockwise rotations (Choice epoch). This mapping was reversed between monkeys. Following this choice and a 0.4 s waiting period, the animals received fluid reward (Reward epoch). The magnitude of the fluid reward varied as a function of the color of the attended stimulus that the monkeys acted upon. High/low rewards were linked to the red/green color of the attended stimuli (with the color-reward mapping changing in blocks of 30 correctly performed trials).
We followed guidelines of the Canadian Council of Animal Care policy on the use of laboratory animals and of the University of Western Ontario Council on Animal Care (Kaping et al., 2011). Extracellular recordings commenced with 1–6 tungsten electrodes (impedance 1.2–2.2 MΩ; FHC) through standard recording chambers (19 mm inner diameter) implanted over the left hemisphere in both monkeys. Electrodes were lowered through guide tubes with software-controlled precision microdrives (NAN Instruments) on a daily basis, through a recording grid with 1 mm interhole spacing. Before recordings began, anatomical 7 T MRIs were obtained from both monkeys, visualizing possible electrode trajectories though a recording grid within the chamber using iodine.
Data amplification, filtering, and acquisition were done with a multichannel processor (Map System; Plexon), using headstages with unit gain. Spiking activity was obtained following a 100–8000 Hz passband filter and further amplification and digitization at 40 kHz sampling rate. During recording, the spike threshold was always adjusted such that there was a low proportion of multi-unit activity visible against which we could separate single neuron action potentials in a 0.85–1.1 ms time window. Sorting and isolation of single-unit activity was performed off-line with the Plexon Offline Sorter, based on Principal Component Analysis (PCA) of the spike waveforms, and strictly limiting unit isolation to periods with temporal stability. We limited all analysis to the subset of maximally isolated single units whose waveform 2D principle components were clearly separated, and whose density profile was separated from influences from other simultaneously recorded waveforms and from multi-unit activities.
The recording experiments were performed in a sound-attenuating isolation chamber (Crist Instrument) with monkeys sitting in a custom-made primate chair viewing visual stimuli on a computer monitor (85 Hz refresh rate, distance of 58 cm). The monitor covered 36 × 27° of visual angle at a resolution of 28.5 pixel/degree. Eye positions were monitored using a video-based eye-tracking system (ISCAN; sampling rate 120 Hz) calibrated before each experiment to a five point fixation pattern (one central fixation point and the remaining four points offset by vertical 8.8° and horizontal 6° toward the four corners of the monitor). Eye fixation was controlled within a 1.4–2.0 degree radius window. During the experiments, stimulus presentation, monitored eye positions, and reward delivery were controlled via MonkeyLogic (open-source software; http://www.monkeylogic.net) running on a Pentium III PC (Asaad and Eskandar, 2008a,b). Liquid reward was delivered by a custom-made, air compression-controlled, mechanical valve system with a noise level during valve openings of 17 dB within the isolation chamber.
The anatomical site of each recorded cell was reconstructed and projected onto the 2D flat map representation of a standardized macaque brain (“F99”) available within the MR software Caret (Van Essen et al., 2001). Reconstruction began by projecting each electrode trajectory onto the 2D brain slices obtained from 7 T anatomical MRI images, using the open-source OsiriX Imaging software (Rosset et al., 2004) and custom-written MATLAB programs (The MathWorks), using the iodine-visualized electrode trajectory within the electrode grid placed within the recording chamber during MR scanning. We drew the coronal outline of the cortical folding of the MR grayscale image to ease the comparison of the individuals monkey brain slices to standard anatomical atlases, before projecting the electrode tip position into the standardized macaque brain (F99) available in Caret. Note that we initially reproduced the individual monkey brains within the Caret software to validate similarity and derive the scaling factors to match the lower resolution monkey MRs to the higher resolution standard F99 brain. We then manually projected, under visual guidance, the electrode position to the matched location in the standard brain in Caret (Van Essen, 2002).
After identifying all recording sites within the standard brain, we used the Caret software to render the brain to a 3D volume, spherically inflated and cut it to unfold the brain into 2D space. In an independent procedure we visualized major anatomical subdivision schemes of the frontocingulate cortex, using the scheme from Barbas and Zikopoulos (2007) as a reference.
Waveform analysis.
For each highly isolated cell (n = 422), we normalized and averaged all action potentials (APs) aligned to their threshold crossings (Fig. 1E). The waveform from each cell was then cubically interpolated (spline) from an original precision of 25 to 2.5 μs. On the resultant waveform, we analyzed two measures (Fig. 1A): the peak-to-trough duration and the time for repolarization. The time for repolarization was defined as the time at which the waveform amplitude decayed 25% from its peak value. These two measures were highly correlated (r = 0.65, p = 1.5 × 10−50, Pearson correlation). We computed the PCA and used the first component (83% of the total variance), as it allowed for better discrimination between narrow and broad spiking neurons, compared with each of the two measures alone.
Figure 1.

Two distinct cell types in macaque prefrontal cortex: broad and narrow spiking cells. A, Illustration of the two features used to characterize extracellular APs: the peak-to-trough duration and the time for repolarization. B, Distribution across cells of the peak-to-trough durations (left), the time for repolarization (middle), and the first component of the PCA, linear combination of the two raw measures (right). The calibrated Hartigan's dip test discarded unimodality with a highly reliable significance only on the distribution resultant from the PCA analysis. C, Sensitivity of original versus calibrated Hartigan's dip test to reject unimodality on surrogate data with modes of different size. We confirmed that the calibrated version is more sensitive by using overlapping Gaussian modes in a 4:1 ratio (similar to the ratio between broad and narrow cell types in B). Triangles represent the median and lines represent the SE of each mode. Middle, Best reproduces the two modes in the PCA distribution (B, right). D, The distributions of narrow spiking cells and broad spiking cells were better fitted with two rather than one Gaussian component. Three sets of cells were then identified according to a conservative criterion: broad cells (blue), narrow cells (red), and nonreliably characterized cells (gray). See Materials and Methods for further details. E, Normalized APs of all cells, showing distinct AP shapes of narrow (red) and broad (blue) cells. Gray-coded APs mark the cells that were classified as intermediate between narrow and broad in D.
To test for bimodality of the distribution we used the calibrated version of the Hartigan dip test that shows superior sensitivity of the test for unimodality (Cheng and Hall, 1998; Henderson et al., 2008) compared with the original test (Hartigan and Hartigan, 1985). To better illustrate this for the reader, we compared the two tests over a mixture of two Gaussian distributions of different size (4:1) to resemble the proportion of pyramidal cells with respect to interneurons. The two Gaussian distributions were sampled randomly. Figure 1C shows the results of the two dip tests as a matter of the overlap between the two modes. Results from the calibrated dip test discarded unimodality for the first PCA component (p < 0.01) and for the peak-to-trough duration (p < 0.05) but not for the time for repolarization (p > 0.05).
We then used the two Gaussian models and defined two cutoffs on that model that divided neurons into three groups (Fig. 1D). In fact, Akaike's criterion and Bayesian information criterion decreased for the two versus one Gaussian model (from −650 to −771 and from −642 to −751, respectively), confirming that using extra parameters in the two Gaussian model was justified and that the two Gaussian model was a better model (Fig. 1D). The first cutoff was defined as the point at which the likelihood to be a narrow spiking cell was at least 10 times larger than to be a broad spiking cell. Similarly, the second cutoff was defined as the point at which the likelihood to be a broad spiking cell was at least 10 times larger than to be a narrow spiking cell. Thus, 95.1% of neurons (n = 384 of 404) were reliably classified (Fig. 1D,E): neurons at the left side of the first cutoff were reliably classified as narrow spiking neurons (n = 79), neurons at the right side of the second cutoff were reliably classified as broad spiking neurons (n = 305). Classification for the cells in between was not reliable and they were left unclassified (n = 20).
In few cases (n = 18, 4.3%), the action potential waveform did not reach the time for repolarization. For these cells, we based categorization on the peak-to-trough duration only. We classified cells as broad spiking if their peak-to-trough duration exceeded the 5% confidence interval of broad cells (i.e., >0.305). Analogously, we would have classified cells as narrow spiking if the peak-to-trough duration would fall behind the 95% confidence interval of narrow cells (i.e., <0.249); however, the 18 cells had all much larger peak to trough (i.e., ≥0.31) compared with all narrow cells (i.e., ≤0.255), and were classified as broad spiking. Together, narrow cells represented 18.7% of the cells, broad cells represented 76.5%, and 4.7% of the cells remained unreliably classified.
Open source code repositories.
A MATLAB/GNU Octave open source code implementation of the just previously introduced waveform analysis is freely available on the following public Git repository: https://bitbucket.org/sardid/waveformanalysis.
A second MATLAB/GNU Octave open source code repository implements the clustering analysis introduced in the Results section (Figs. 3–6). It is also freely available on the following public Git repository https://bitbucket.org/sardid/clusteringanalysis.
Figure 3.
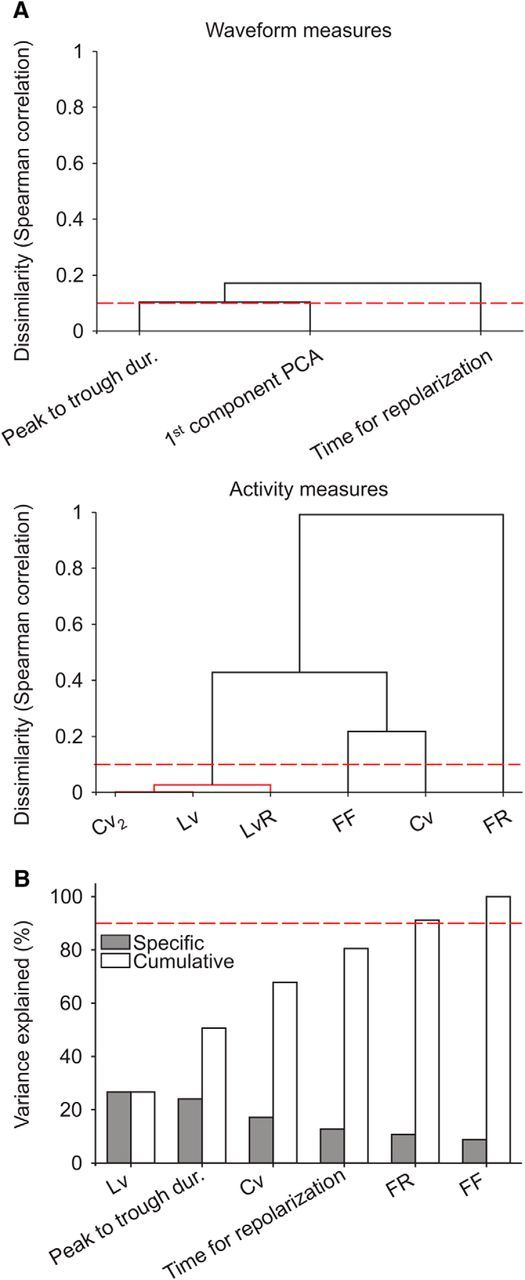
Preclustering analysis disregarding redundant and uninformative measures. Measures were previously normalized to be in the same range [0,1]. A, Dissimilarity among cell features. We used a cutoff of 0.1 as a criterion for the dissimilarity between measures (red dashed line). Top, Dendrogram of waveform measures based on nearest distance, using Spearman correlation as a metric. The two raw measures of the waveform, the peak-to-trough duration and time for repolarization, were above threshold and passed this filter. The first component of the PCA, linear combination of the two waveform measures, was only represented to ease the comparison with the two raw measures. Bottom, Analogous dendrogram for activity measures. The local variation, local coefficient of variation, and revised local variation were below threshold and then considered mutually redundant. From the three, the local variation was more representative of the centroid (center of the branch in the dendrogram) and then considered in posterior analyses. B, Amount of information brought by cell features. Cell features were progressively incorporated to the subsequent clustering analysis until a cutoff of 90% of the total variance explained in the dataset was reached (red dashed line). The remaining feature, the Fano factor, was disregarded under the criterion that it was barely informative about the gross variability.
Figure 4.
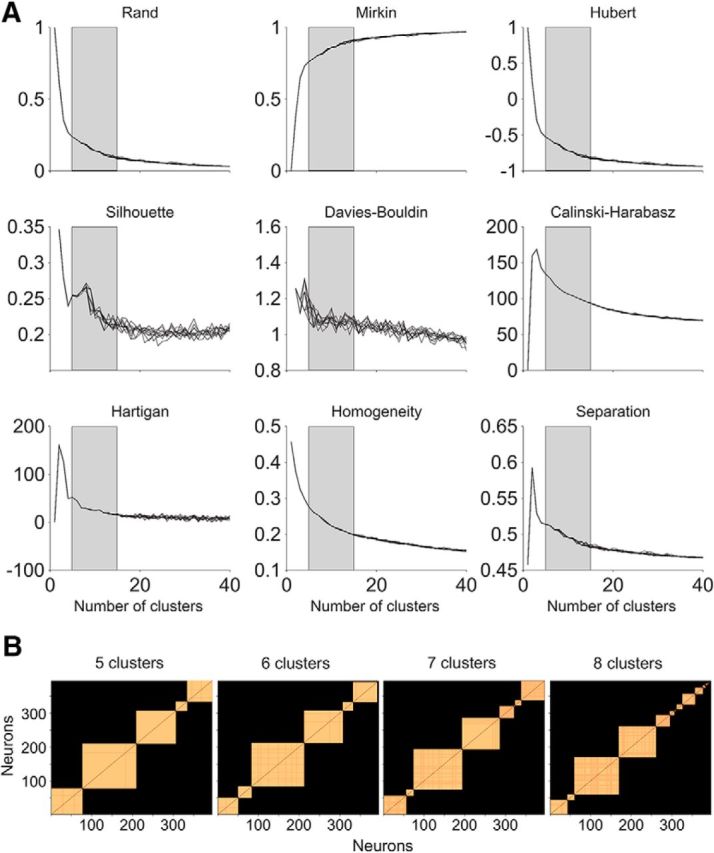
Estimating the number of distinct cell classes in the prefrontal microcircuit. A, A committee of metrics was used to narrow down the range of number of clusters. We limited the range of proper numbers of clusters in the K-means algorithm (from the original [1, 40] range to [5, 15]; gray-shaded area) based on the near-asymptotic behavior of a set of indices that evaluate the quality of the clustering: Rand, Mirkin, Hubert, Silhouette, Davies–Bouldin, Calinski–Harabasz, Hartigan, Homogeneity, and Separation. The different lines that appear in each part correspond to different initializations (n = 10). See text for details. B, Distribution of cells after imposing k distinct clusters. We used the symmetric reverse Cuthill–McKee permutation to ease visualization of how the different neurons clustered together and the proportion of neurons that remained unclustered after imposing k in [5, 15] in the K-means algorithm (only k in [5, 8] shown). This permutation was applied to sparse pairwise matrices that, for each k, encoded the probability for any two neurons to belong to the same cluster. This probability is represented in the each part in orange scale. A lower cutoff for probabilities <90% was used (see text for details), so they appear in black. The result of the permutation is a reorganization of neurons, so the highest probabilities appear closest to the diagonal.
Figure 5.

Seven reliable cell classes emerge from clustering five cell features: two properties of the extracellular spike waveform, two measures of the spike train statistics, and the firing rate magnitude. A, Distribution of the seven classes of cells. We used the symmetric reverse Cuthill–McKee permutation to ease visualization of how the different neurons clustered together and the proportion of neurons that remained unclustered (n = 4) after imposing seven clusters in the K-means algorithm (tested k in [5,15]; Fig. 4B). B, Heat map of cell features (x-axis) across all cells (y-axis) with red to blue corresponding to increasing normalized values. Dashed lines show cell class borders with the dendrogram on the left showing the square Euclidean distances between clusters' centroids. The color bar on the left encodes cell type: narrow/broad/unclassified cells in red/blue/gray, respectively. C, How cell properties contributed to distinguish among cell classes. For each of the five measures that characterize neurons, we applied a Kruskal–Wallis test with Bonferroni correction for multiple comparisons to address whether individual measures were significantly different (blue), or not (gray), between each pair of cell classes.
Figure 6.

Validation of the identified cell classes appearing in Figure 5. A, B, Validating the meta-clustering analysis by using dataset randomization (n = 200 realizations). Dataset randomization with repetitions guarantees the same sample size with respect to control. A, Validation according to cluster distance. In each realization, each cluster was associated to the closest cell class in Figure 5, e.g., B1. From all realizations and for each cell class, the difference between the mean of the intradistances (i.e., all clusters that were associated to the same cell class, e.g., B1) with respect to the extradistances (i.e., all clusters that were not associated to that cell class, e.g., B2–B4 and N1–N4) is plotted (gray bars). The white bars show the respective results from random assignation. B, Validation according to the proportion of cell matches. In each realization, the proportion was the number of consistently associated cells to a class, over the total number of control cells in the class that was selected by the randomization procedure. As in A, gray bars refer to dataset randomization (mean and SE) and white bars to random assignation (mean and SE). The red dashed line represents the proportion of cells as if cells would evenly distribute among the seven reliable cell classes. C, D, Validating the meta-clustering analysis by splitting the datasets of the two monkeys. C, Validation according to cluster distance. Analogous analysis to A for each monkey dataset (Monkey M in red and Monkey R in blue). D, Validation according to proportion of cell matches. Analogous analysis to B for each monkey dataset. The black dashed line represents the proportion of cells as if cells would evenly distribute among the seven reliable cell classes.
Analysis of spiking activity.
For each neuron we calculated the overall firing rate. Additionally, we were interested in analyzing spiking variability properties to classify neurons as showing either regular, Poisson-like or bursty firing. Thus, for each cell we computed the Fano factor (variance over mean of the spike count in consecutive time windows of 100 ms) and the coefficient of variation (SD over mean of the interspike intervals).
Fano factor and coefficient of variation are highly sensitive to activity that is not stationary, in which case both measures artificially inflate their value. Therefore, we also considered local measures of spiking variability that are demonstrated to be much more robust to changes in firing rate: the local coefficient of variation (Holt et al., 1996; Compte et al., 2003; Cv2) and the local variation (Lv; Shinomoto et al., 2003). Cv2 is based on the difference between consecutive interspike intervals, whereas Lv relies on the square difference, which in fact represents the cross-correlation of consecutive interspike intervals (Shinomoto et al., 2009). For the sake of completeness, we also considered the revised version of the local variation, which accounts for a hypothetical refractory period of 5 ms (LvR; Shinomoto et al., 2009).
Poisson-like firing takes values close to 1 for all introduced measures of variability, whereas more regular spiking is associated with values significantly lower than 1, and bursty activity with values significantly larger.
Spike-LFP phase locking.
Spiking activity was related to the local population network activity as indexed by the same-electrode LFP. An LFP snippet around each spike was removed and the signal was cubically interpolated to avoid influences of the filtered AP waveform on the LFP phase, which can induce spurious locking at mid-to-high frequencies (Zanos et al., 2011; Womelsdorf et al., 2012). The exact position of each spike and the proper interval of the LFP time series to cut were estimated by computing the absolute value of the first derivative of the raw LFP signal. Thus, the maximum amplitude of the derivative in absolute terms represented the exact time at which the spike was triggered, and the region to cut was determined by using the 99th percentile cutoff around that time. For most of the spikes, this cutoff took <10 ms (median 7 ms). For the rare cases in which the cutoff took a long interval, we cut a flat ±12 ms snippet of the LFP signal around the spike. The spike-triggered LFP spectrum was then generated by applying a Hanning tapered Fourier transform. The spike LFP coupling was estimated every 1.5 Hz, and adaptive time windows were used to compute it to contain five complete cycles at each frequency. This whole procedure did not introduce artifacts in the estimation of the phase-locking preferences in the low and mid frequencies analyzed here (Fig. 8C).
Figure 8.
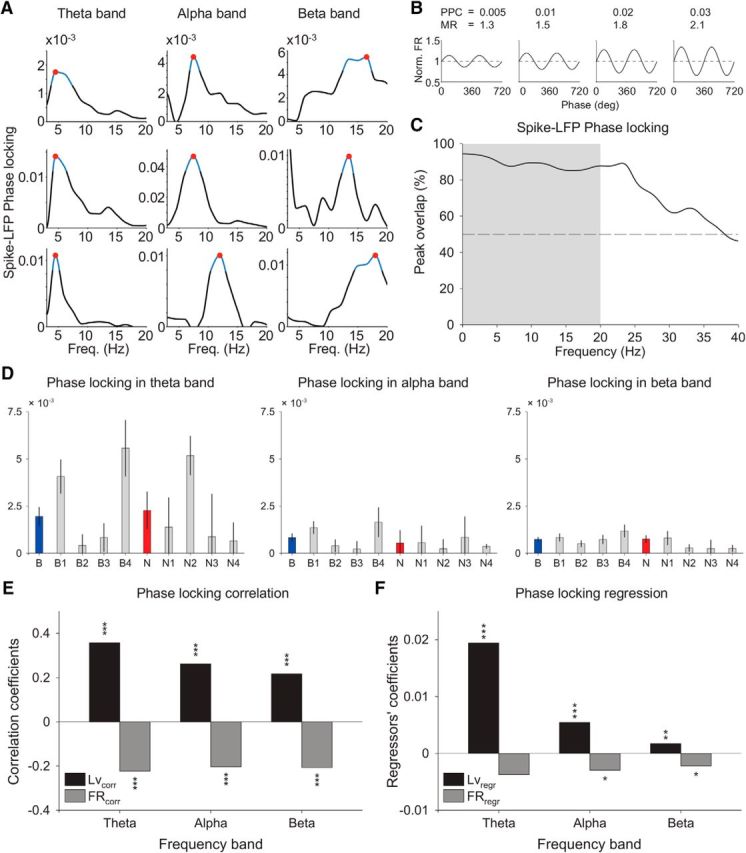
Functional relationship between phase locking and firing pattern. A, Spike-LFP phase-locking cell exemplars in theta (3–7 Hz), alpha (7–12 Hz), and beta (12–20 Hz) frequency bands. The peak in phase-locking strength is represented by the red dot and the blue line reflects the frequency region in which the phase locking was reliable and significant. See Material and Methods for more specific details about the phase-locking analysis. B, PPC and its relation with the modulation of firing rate (MR = FRpeak/FRtrough). MR represents the highest firing rate modulation. C, Reliable frequency localization (±5%) of the phase-locking peak with and without spike removal interpolation. Approximately 90% of the peaks within theta, alpha, and beta bands (up to 20 Hz) stayed largely unaltered after spike removal interpolation. This analysis confirms that spikes leak to the LFP mostly on higher frequency bands (>25 Hz). D, Weighted phase-locking strength in cell types and their respective cell classes. Weighted phase locking for each cell was scaled by the Rayleigh statistics across frequencies within a band (see text). Left, The median and SE of each group of cells in the theta band. Center, Same for the alpha band. Right, Same for the beta band. E, Phase-locking correlation with the firing pattern. Local variation and firing rate were highly correlated with the weighted phase-locking strength in theta, alpha, and beta bands (p < 0.001, Pearson correlation). F, Coefficients and significance of regressors in a frequency band-specific regression analysis of the weighted PPC with respect to the five cell properties (only local variation and firing rate shown). D–F, These observations remained qualitatively unaltered if raw PPC was used instead of weighted PPC (data not shown).
Spike-LFP phase locking was then computed as the pairwise phase consistency (PPC), a measure that is unbiased by the firing rate allowing straightforward comparisons across cells (Vinck et al., 2010, 2012). Values of the PPC can be directly translated in the modulation depth of phase modulated firing, i.e., the proportion of spikes falling at peak versus trough of the oscillation cycle (Fig. 8B), according to (1 + 2)/(1 − 2). As a reference, values of the PPC close to 0.01 correspond approximately to a phase-locking value of 0.1.
As an ultimate control, we checked for artificial frequency shifts (>5%) in synchronization (PPC peaks) that could be introduced by the spike removal. We found that ∼90% of the phase-locking peaks in theta, alpha, and beta bands (up to 20 Hz), with and without the LFP snippet removal, stayed in the same frequencies (Fig. 8C). This analysis confirmed that spikes leak to the LFP mostly on higher frequency bands (>25 Hz).
Statistical test of spike-LFP coupling.
As preferred frequencies of spike-LFP locking are not a priori known because multiple rhythms may co-occur in the same area, we developed a novel permutation test to detect at which frequency bands single neurons reliably synchronize to LFP oscillations (Womelsdorf et al., 2012). The structure of the statistical algorithm is as follows: a permutation distribution is constructed under the null hypothesis of no significant spike-LFP phase locking such that statistical dependencies between spike phases (Vinck et al., 2012) and across frequencies are preserved. We then identify bands of significant frequencies (p < 0.05, Rayleigh test), and compute for each band the sum of the PPC (Vinck et al., 2010). The PPC is unbiased by spike number and controls for dependencies between spike phases within trials. Significance is then determined based on PPC band-mass or on the maximum PPC value.
A conservative peak-detection algorithm based on local minima and maxima of the PPC spectrum was used to detect only the significant frequency bands around reliable PPC peaks. We filtered out spurious PPC peaks that represent “locally noisy” fluctuations in the PPC spectrum by discarding those with a local amplitude (defined as the increment in PPC from the peak to the highest of their two neighbor local minima) below 20% of the PPC range. The same method was then used to consider reliable frequency bands around relevant PPC peaks: reliable frequency bands were the closest frequencies to the relevant PPC peak that (1) were significant according to the permutation test explained above and (2) held the local amplitude above 20% of the PPC range.
Our procedure has two main advantages relative to standard available techniques to detect significant phase locking: it shows enhanced sensitivity compared with other Bonferroni or false discovery rate multiple-comparison correction techniques that control for multiple statistical Rayleigh tests across frequencies. In addition, it avoids the problem of the Rayleigh test being sensitive to non-Poissonian history effects within the same trial (e.g., as for bursty activity), in which case the underlying assumption of the Rayleigh test is violated (Vinck et al., 2012). Finally, the conservative peak-detection method removes spurious peaks that otherwise generate noisy results.
Results
Reliable classification of PFC neurons based on extracellular AP waveforms
In this study, we analyzed the activity of 422 isolated neurons recorded in the prefrontal cortex of two monkeys while performing an attentional task (Kaping et al., 2011). We then classified these neurons in either narrow or broad spiking cell types based on the characteristics of their action potential waveform (Fig. 1).
The basics of the method are similar to previous attempts (Wilson et al., 1994; Constantinidis and Goldman-Rakic, 2002; Mitchell et al., 2007; Diester and Nieder, 2008; Hussar and Pasternak, 2009; Johnston et al., 2009; Kaufman et al., 2010), but we improved it by explicitly considering the following aspects. First, bimodality of waveforms was increased and hence better discriminated by including, in addition to the peak-to-trough duration, the time of repolarization (Fig. 1A,B). We combined the two by means of a PCA. Cell-type discrimination was then based on the first component of the PCA (Fig. 1B,D). Second, bimodal distribution of waveform measures are typically analyzed using the Hartigan dip test (Hartigan and Hartigan, 1985). However, sensitivity in rejecting unimodality is enhanced by using its calibrated version (Cheng and Hall, 1998; Henderson et al., 2008), especially when a different proportion exists between the two modes, as is the case for narrow and broad spiking cells (Fig. 1B,C). Third, unimodality rejection in Hartigan's dip test (as well as in its calibrated version) is sensitive to discontinuities present in the distribution. For waveform measures it is then essential to previously diminish by nonlinear (e.g., cubic spline) interpolation the discontinuities that are artificially introduced by the sampling frequency of waveforms.
This procedure applied to our dataset (see Material and Methods for details) showed that the two waveform measures were highly correlated (r = 0.653, p = 1.49 × 10−50, Pearson correlation), and that the combination of the two measures through the first principal component strongly improved the reliability of the cell-type classification (p = 0.0088 for the first component of the PCA vs p = 0.0458 for the peak-to-trough duration alone vs p = 0.152 for the time for repolarization alone, according to the calibrated Hartigan's dip test for unimodality; Fig. 1B).
We then used the two Gaussian model and defined two cutoffs on that model that divided neurons into three groups (Fig. 1D). The first cutoff was defined as the point at which the likelihood to be a narrow spiking cell was at least 10 times larger than to be a broad spiking cell. Similarly, the second cutoff was defined as the point at which the likelihood to be a broad spiking cell was at least 10 times larger than to be a narrow spiking cell. The analysis resulted in 18.7% (n = 79) narrow spiking cells, 76.5% (n = 305) broad spiking cells, and 4.7% (n = 20) of cells that were left unclassified because their waveform measures fell into the dip of the bimodal distribution (Fig. 1D). These proportions are similar to previous studies reporting 13–25% narrow spiking cells in PFC areas 8 and 46 (Constantinidis and Goldman-Rakic, 2002; Diester and Nieder, 2008; Johnston et al., 2009).
Specific firing pattern of narrow versus broad spiking cell types
We next analyzed the firing statistics of narrow and broad spiking cells (Fig. 2). Other studies have shown differences in the overall firing rate and the firing variability between narrow and broad spiking neurons supporting that this distinction maps closely onto fast spiking interneurons and regular pyramidal cells (Csicsvari et al., 1999; Mitchell et al., 2007; Ascoli et al., 2008). Consistent with these findings we found that narrow spiking cells with respect to broad spiking cells had on average higher firing rate (7.65 Hz median, 1.11 Hz SE vs 2.19 Hz median, 0.296 Hz SE; p = 3.3 × 10⁻⁸, Mann–Whitney–Wilcoxon test; Fig. 2A), and Fano factor (1.4 median, 0.07 SE vs 1.25 median, 0.025 SE; Mann–Whitney–Wilcoxon test, p = 9.2 × 10⁻⁶, Mann–Whitney–Wilcoxon test; Fig. 2B).
Figure 2.
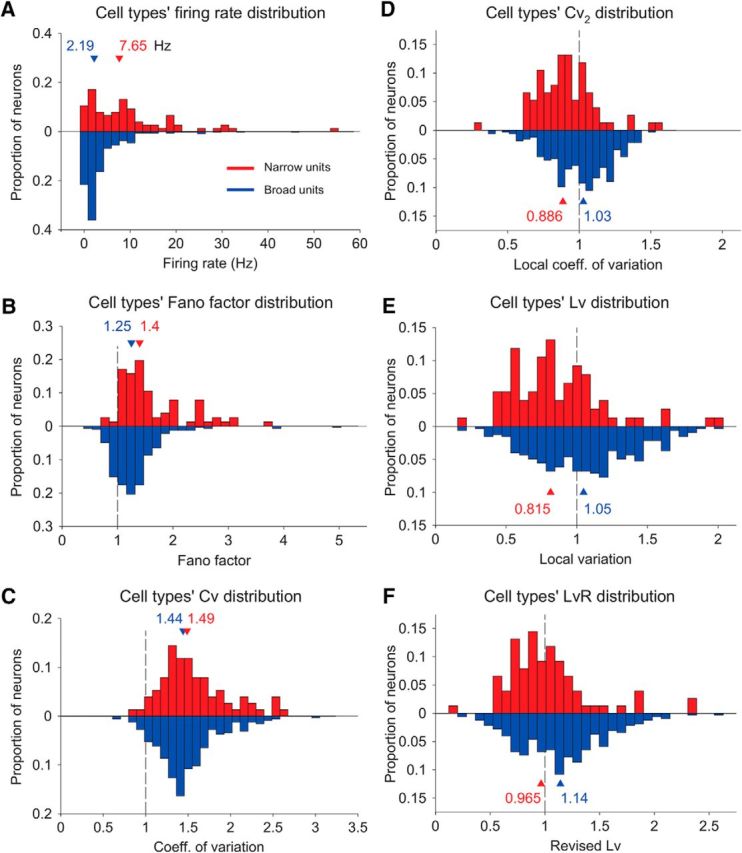
Distinct firing properties in the two cell types. A–F, Characterization of the spike trains of narrow spiking cells (red) and broad spiking cells (blue) according to the average firing rate (A), the Fano factor (B), the coefficient of variation (C), the local coefficient of variation (D), the local variation (E), and the revised local variation (F). From them all, only the distributions of coefficient of variations between narrow and broad cell types (C) did not reach a significant difference.
The Cv was not significantly different between narrow and broad spiking cells (1.49 median, 0.0452 SE vs 1.44 median, 0.0198 SE; Mann–Whitney–Wilcoxon test, p = 0.163, Mann–Whitney–Wilcoxon test; Fig. 2C) primarily due to nonstationary firing rates. In fact, lower firing variability in narrow spiking cells was found after using measures that control for transient changes in the firing rate, such as the local coefficient of variation Cv2 (Holt et al., 1996; Compte et al., 2003; 0.886 median, 0.0237 SE vs 1.03 median, 0.0114 SE; Mann–Whitney–Wilcoxon test, p = 7.96 × 10⁻⁶, Mann–Whitney–Wilcoxon test; Fig. 2D), the Lv (Shinomoto et al., 2003; 0.815 median, 0.038 SE vs 1.05 median, 0.019 SE; Mann–Whitney–Wilcoxon test, p = 7.25 × 10⁻⁶, Mann–Whitney–Wilcoxon test; Fig. 2E), and the revised local variation LvR (Shinomoto et al., 2009; 0.965 median, 0.0434 SE vs 1.14 median, 0.0217 SE; Mann–Whitney–Wilcoxon test, p = 7.9 × 10⁻⁴, Mann—Whitney–Wilcoxon test; Fig. 2F). Local variability measures, in contrast to the Cv, consider only incremental variation in the sequence of interspike intervals (see Material and Methods for details).
Similarly to the Cv and Fano factor, all local variability measures take values <1 when firing is temporally structured (i.e., regular spike train), values ∼1 when firing is irregular (i.e., Poisson-like spike train), and values >1 if firing is highly irregular, as when spike trains entail a high proportion of bursts (Shinomoto et al., 2005). Consistent with this study, Lv values in our neurons were highly correlated with the proportion of bursts, calculated here as the proportion of two consecutive short interspike intervals (<5 ms) with respect to the total number of two consecutive interspike intervals (r = 0.510, p = 0, Spearman correlation, only neurons that displayed at least one of these bursts were considered in the analysis, n = 173).
Identifying cell classes in prefrontal cortex (I): disregarding redundant and uninformative measures
Our ultimate goal was to identify distinct cell classes in prefrontal cortex by splitting the variability in the dataset according to unbiased clustering techniques. However, clustering is sensitive to (1) redundant measures, as they duplicate the weight of their variability and bias classification, and to (2) uninformative measures (defined as those that barely contribute to the variability in the dataset) as they basically bring noise and blur classification.
To classify cells objectively, we first standardized measures, so their values were all in the same range [0,1]. Then, to find out whether there were redundant measures in our dataset, we computed the dissimilarity among them, based on deviations from complete Spearman correlation (Fig. 3A). We considered a cutoff for the dissimilarity of 0.1, and filtered out the measures that were correlated beyond that point (i.e., >0.9 Spearman correlation). From all measures, only measures of local variability presented a degree of redundancy that exceeded the cutoff (Fig. 3A, bottom). Thus, we maintained in posterior analyses the local variation Lv, and disregarded the local coefficient of variation Cv2 and the revised local variation LvR, under the assumption that they basically represent redundant information to the Lv measure. Note that the first component of the PCA was introduced in Figure 3A for visualization purposes only. Being a particular linear combination of the peak-to-trough duration and time for repolarization, its variability was already included in these two measures of the AP waveform.
We then computed the relative contribution of remaining measures to the variance in the dataset (Fig. 3B). We considered negligible all those measures that together represented <10% of the total variance. This cutoff disregarded the Fano factor (FF; 8.8% of the total variability). Thus, the subsequent clustering analysis for cell class identification took into account a total of five measures, two of them based on neurons' waveform—the peak-to-trough duration and the time for repolarization—and the other three based on firing properties—firing rate (FR), coefficient of variation Cv, and local variation Lv. Together they accounted for the gross of the variance (91.2%), sorted in the following order: Lv (26.6%), peak-to-trough duration (24%), Cv (17.2%), time for repolarization (12.7%), and firing rate (10.7%).
Identifying cell classes in prefrontal cortex (II): estimating the total number of classes
To characterize classes of cells in the dataset, we used the K-means clustering algorithm upon the hyperspace of unbiased neuronal measures described above. A challenge for using K-means is that the number of clusters in which the data splits needs to be known in advance (Jain and Dubes, 1988). However, this is precisely what we aimed to determine. To estimate then a narrow range in the number of clusters, we used a set of indexes that evaluate the quality of the results from K-means clustering (Milligan and Cooper, 1985; Jain and Dubes, 1988; Halkidi et al., 2001; Vendramin et al., 2010): Rand, Mirkin, Hubert, Silhouette, Davies–Bouldin, Calinski–Harabasz, Hartigan, Homogeneity and Separation indices (Fig. 4A).
The following procedure was used: 50 replicates of the K-means clustering were run for different number of clusters, from k = 1 to k = 40. For each k, the best replicate was selected in terms of minimum squared Euclidean distance from all cluster elements to their respective centroids. Validity measures improved with increasing numbers of clusters, but the benefit slowed down after considering five or more clusters (Fig. 4A). To discard initialization issues, 10 identical realizations were run, each with a new set of initial centroids, randomly chosen. For most validity measures, initial conditions affected clustering results when validity measures were deeper into saturation, which suggested an excessive number of partitions (Fig. 4A). The overall analysis estimated a proper number of clusters between 5 and 15 for our dataset.
We then developed a meta-clustering analysis to select the most appropriate number of clusters: a large number of realizations (n = 500) of the K-means (from k = 5 to k = 15) were run. We considered 50 replicates for each k and n and selected the best replicates. For each k, we computed the probability across n that different pairs of neurons belonged to a same cluster. A probability threshold (p ≥ 0.9) was then used to identify reliable from spurious clusters. Finally to remove clusters composed of outliers, we considered as reliable only those clusters with at least five neurons. Using such procedures, we found that a K-means clustering with k = 7, compared with k = 5–6, was able to identify a larger set of distinct cell classes, whereas, compared with k = 8 and above, it was still reliable to characterize most of the neurons in the dataset (Fig. 4B). The validity of this selection was also supported according to Akaike's criterion and Bayesian criterion (values in bold are the best (lowest) according to the two criteria, and represent the one (k = 7) that was finally used): {−9372.8, −9413.1, −9527.8, −8757.6} and {−9173.7, −9174.2, −9249.1, −8439.0} for k = {5, 6, 7, 8}, respectively.
Electrophysiological properties of cell classes
The seven reliable clusters corresponded to four classes of broad spiking cells and three reliable classes of narrow cells (Fig. 5A,B; see also Insel and Barnes (2014) for another example where distinct broad spiking neurons show specific functional properties). Four cells were not reliably classified in any cluster. Given that all of them were narrow spiking neurons, we grouped and labeled them as N3, even though these neurons did not conform to a reliable cell class (n < 5).
The separation in classes obeyed a hierarchical organization according to the distance between cell class centroids (Fig. 5B). Neurons of the same cell type, but in different classes, were still mutually closer compared with neurons of different type (Fig. 5B), even though the most informative measure was about firing (Lv; Fig. 3B). Within each cell type, waveform measures only slightly differed (Figs. 5C, 7D,E), so cell classes mainly separated in terms of firing variability and rate (Figs. 5C, 7A–C). Thus, cell classes had a tendency to either show bursty (Lv > 1), Poisson (Lv ∼ 1), or regular activity (Lv < 1), and while some cell classes only fired sparsely, others showed high firing rate.
Figure 7.
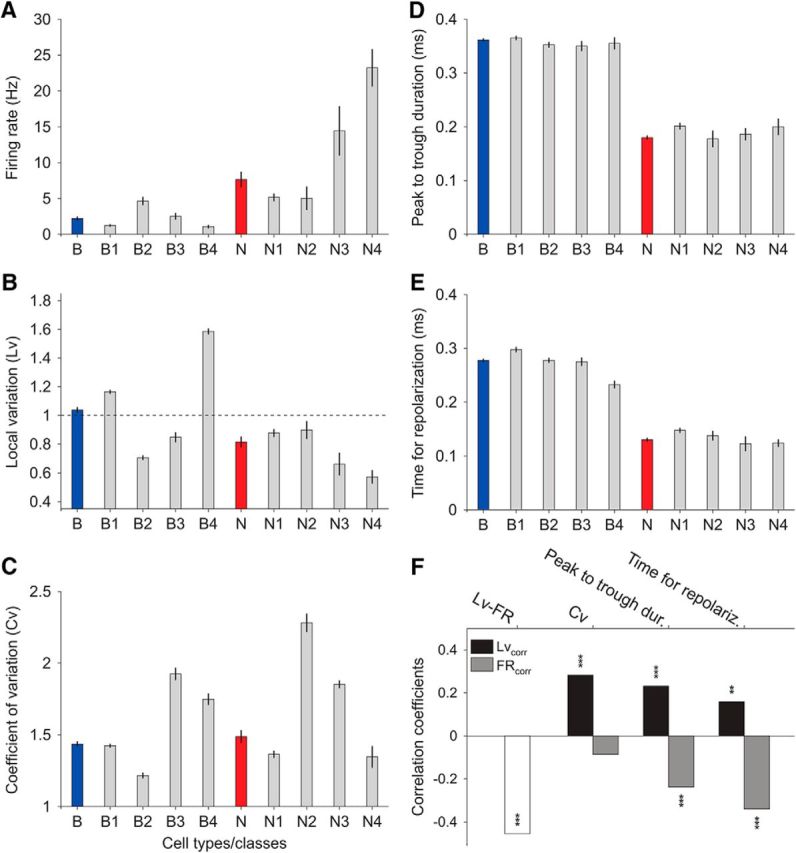
Comparison of each cell property among cell classes. A, Firing rate in cell classes and their respective cell type. B–E, Same for local variation, coefficient of variation, peak-to-trough duration, and time for repolarization, respectively. F, Correlation of cell properties to the firing pattern. Given the systematic negative correlation between firing rate and local variation across cell types and respective classes (A vs B), we evaluated across all cells the Pearson correlation between local variation and firing rate, and then how other cell properties correlated to each of these two.
Validation of the identified cell classes
We validated the meta-clustering analysis shown in Figure 5 in two ways (Fig. 6). First, we used dataset randomization (n = 200 realizations) in contrast to random assignation (Fig. 6A,B) to compute two complementary validity measures: (1) validation based on cluster distance (Fig. 6A) and (2) validation according to the proportion of matches when assigning cells to clusters (Fig. 6B). Figure 6A shows that the distance between the clusters associated with a given class was significantly shorter on average compared with the distance between the clusters that were not associated to that class. By construction, the difference of the two (not assoc. vs assoc.) was expected to be larger than zero, but this effect was estimated by the random assignation procedure (Fig. 6A, white bars). However, results from randomization (Fig. 6A, gray bars) were always much larger in magnitude, which validated our clustering procedure. Similarly, Figure 6B illustrates that the amount of matching cells with respect to control was systematically much higher from dataset randomization than from random assignation, further supporting our cell classification.
Second, we further validated our meta-clustering analysis by applying an analogous approach to each monkey dataset independently (Fig. 6C,D). This set of analyses, as a whole, demonstrated (1) that cell assignments based on our clustering procedure are highly reliable and statistically significant and (2) that the difference in sample size of the cell classes (and datasets) does not introduce a systematic bias.
Relationship between firing variability and firing rate
In previous sections we have shown that the local variation was the most informative measure overall (Fig. 3B) and that in terms of classes, neurons first separated in cell types (Fig. 5B). Furthermore, cell classes within each type showed a diversity of increased/decreased firing rate and regularity. Together this shows an intricate complexity that cannot reduce cell classification to a single dimension.
On the other hand, cell properties were also mutually correlated. In fact, a negative correlation between the local variability and the firing rate was systematic across cell types and classes (Fig. 7A,B). We quantified the correlation among all individual neurons, first between the firing rate and the local variation, and then between each of the two with respect to the remaining cell properties (Fig. 7F).
Indeed, the strongest correlation was the negative correlation between firing rate and local variation. Given that Lv is robust to local changes in firing rate (Shinomoto et al., 2003), this analysis mainly identified a canonical relationship between firing rate and the statistics of the firing pattern in the active prefrontal cortex. Other significant correlations informed about (1) broad spiking cells having a tendency toward larger Lv values (Fig. 7B,F) and (2) narrow spiking cells having a tendency toward higher firing rates (Fig. 7A,F). In addition, Lv and the coefficient of variation were also highly correlated (Fig. 7F), even though the coefficient of variation is highly sensitive to local changes in firing rate that inflate its value (Fig. 2C).
Phase-locking preferences and firing properties are functionally related
We next directed our attention to rhythmic synchronization. While synchronization in different frequency bands is known to occur in the PFC/ACC (Buschman and Miller, 2007; Gregoriou et al., 2009, 2012; Womelsdorf et al., 2010, 2014a; Buschman et al., 2012), typical studies only examine one frequency band at a time and do not attempt to identify the possible cell-specific origin of phase locking in awake and actively engaged animals. We therefore examined single-cell locking strength and significance across distinct frequency bands (Fig. 8A). After confirming that the phase-locking analysis was reliable up to 20 Hz (see Materials and Methods), we tested the possibility that neurons would show a functional interaction between phase-locking and firing properties in these frequencies. To apply the analysis to all cells and frequencies within a band, we first computed a weighted average of the phase locking in which the PPC measure for each cell was scaled across frequencies by the Rayleigh statistics (w = 1 − pvalue).
Figure 8D shows how the weighted PPC changed across cell types and classes in theta, alpha, and beta frequency bands. In general, the phase-locking strength decreased with increased frequency bands (from theta to beta band), and while broad classes B1 and B4 were predominant in the three frequency ranges, N1 and N2 specifically synchronized to beta versus theta bands, respectively. To further validate these results, we applied a permutation analysis (n = 2000), so that in each realization the elements of a cell class were randomly selected from its pool of neurons. The results of this analysis showed that in 83.5% of the realizations the weighted PPC value at theta frequencies was higher for N2 compared with N1, and the reverse was true at beta frequencies, so in 84.3% of them the weighted PPC value was higher for N1 compared with N2.
We then confirmed significant correlations of weighted PPC with local variation and firing rate (Fig. 8E). Correlation with local variation was slightly larger in magnitude compared with the correlation with firing rate, and positive instead of negative. However, it was not surprising to find an almost complete reversed pattern of correlation, given the relationship between Lv and firing rate (Fig. 7F).
We developed a multilinear regression analysis to better control for mutual correlations among cell properties, and thus determine which of them most strongly interacted with the phase-locking strength at each frequency band (Fig. 8F). In theta band, only the local variation (p < 0.001) and the peak-to-trough duration (p < 0.01; data not shown) reached significance, whereas only the local variation and the firing rate reached significance in alpha (p < 0.001 and p < 0.05, respectively) and beta bands (p < 0.01 and p < 0.05, respectively). The coefficient of the regressors in addition showed that the local variation had the highest impact on the phase-locking strength in theta and alpha bands, whereas it was slightly lower (but still more reliable) compared with the firing rate in the beta band, overall confirming that Lv was the property more closely related to coordinated activity.
Epoch-specific modulation of firing properties
We were interested in testing whether cells, as suggested (Ascoli et al., 2008), modify their physiological properties in a state-dependent manner, especially during actively engaged cognitive conditions. We then analyzed and indeed saw that cell types and classes modulated their firing pattern in the most demanding epochs of the selective attention task: Attention, Filter, Choice, and Reward epochs (Fig. 9A; see Material and Methods for specific details about the task). In terms of cell types (Fig. 9B), broad cells principally separated from narrow cells in terms of larger firing rate changes. In fact, broad cells presented a much larger variation in firing rate than in local variation in all epochs, compared with similar changes in narrow cells. And across epochs, there was a much larger variation with respect to baseline (i.e., whole trial average) in the Filter and Reward epochs.
Figure 9.

Epoch-specific shift in firing pattern. A, Selective attention task. Monkeys had to keep fixation to a centered point through the course of a trial, while presented in front of two peripheral grating stimuli. First, both grating stimuli changed their color to either green or red, the location of which was random. Then, the fixation point changed its color to match one of the two gratings, and the monkeys had to use this cue instruction to covertly attend the relevant stimulus. Monkeys had then to wait until the relevant stimulus rotated, filtering out a potential rotation of the distractor stimulus, and finally report it with a saccadic response to one of two target locations (top vs bottom) in association with a clockwise versus counterclockwise rotation. Monkeys only received reward after a correct consecution of the task in the trial. See Material and Methods for more specific details of the task. For the subsequent analysis of epoch-dependent change in firing pattern, we preselected epochs with high cognitive demand: Attention, Filter Epoch, Choice, and Reward. B, Epoch-specific change in firing pattern for broad and narrow spiking cell types. Solid lines in each data point represent SEs associated to the changes in firing rate and local variation. C, D, Epoch-specific change in firing pattern within broad (C) and narrow (D) cell classes. Cells in N3 were not considered in the analysis because they were not informative about any reliable cell class and, given its small sample size (n = 4), their basic contribution was to bring noise to the plot representation, diminishing the salience of the other truly representative narrow cell classes.
With respect to cell classes (Fig. 9C,D), they mainly followed the trend of their respective cell type. Thus, broad cell classes tended to have larger epoch-specific firing rate change compared with the local variation change. Similarly, narrow cell classes tended to have a more similar firing rate–local variation modulation, with the only exception of cells in class N2 in the Filter and Reward epochs, where the change in firing rate significantly exceeded the change in local variation. Across epochs, all cell classes, as their respective cell types, showed the largest modulations in the Filter and Reward epochs.
Topographical distribution of cell classes in prefrontal regions
Cells were recorded in multiple areas within the PFC and ACC of macaques (Kaping et al., 2011; Shen et al., 2014). This allowed testing of how cells were distributed across three larger anatomical PFC/ACC subdivisions (Fig. 10; see Materials and Methods for details). A significantly different proportion of cells was recorded within the ACC, ventromedial PFC, and lateral PFC, respectively (Bonferroni corrected p value for multiple comparisons: p < 0.0167, n = 3, χ2 test; Fig. 10B). Although B4 cells in ACC and N4 cells in ACC and lateral PFC seemed to deviate from this trend (p < 0.05, χ2 test), neither area-specific cell types, nor distinct cell classes, significantly differed from this original recording bias after correcting p values for multiple comparisons (Bonferroni correction: p > 0.005, n = 10).
Figure 10.

Anatomical topography of cell classes. A, Illustration of the three anatomical subdivisions in prefrontal and anterior cingulate cortex where cells were recorded on semi-inflated cortical sheets (see Materials and Methods). B, The proportion of cells recorded within the anterior cingulate cortex and ventromedial (vm) and lateral (lat) prefrontal cortex was significantly different among the three regions (Bonferroni corrected p value for multiple comparisons: p < 0.0167, n = 3). Region-specific cell types or cell classes did not significantly differ from this original recording bias (Bonferroni corrected p value for multiple comparisons: p > 0.005, n = 10). Dashed lines represent the averaged proportion of cells across regions. Note that the proportion of cell classes was normalized for each of the groups independently (All-B-N, B1–B4, and N1–N4) to ease a visual comparison between the different subgroups.
Division of labor in the primate prefrontal microcircuit in goal-directed behavior
The reported classes of cells in the prefrontal microcircuit can be summarized in four highly different sets of firing properties (Fig. 11), which could have fundamental implications for mediating the balance between excitation and inhibition (Vogels and Abbott, 2009; Isaacson and Scanziani, 2011; Karnani et al., 2014; Xue et al., 2014) that controls information flow (Constantinidis et al., 2002; Hangya et al., 2014; Kepecs and Fishell, 2014), and ultimately shapes the function of the prefrontal microcircuit (Constantinidis and Wang, 2004; Wang et al., 2004).
Figure 11.
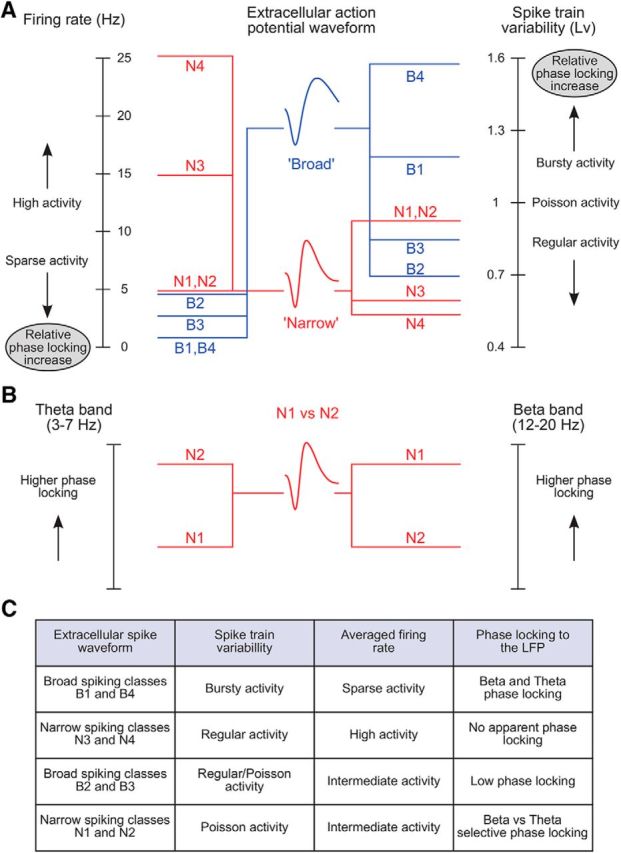
Schematic overview relating cell class-specific firing rate, spike train variability, and phase locking. A, Left, Firing rates in cell classes span from sparse to high activity, which specifically relate to broad and narrow action potential waveforms. Right, Local spike train variability (Lv) in classes of cells maps onto cells with broad and narrow waveforms. Within each cell type, cell classes show a systematic relationship, so that the higher the level of irregularity (regular to Poisson to burstiness), the more sparse is the activity and the higher is the phase-locking strength. Shown links are based on the specific properties of each cell class presented in Figures 7, A and B (median firing rate and local variation, respectively), and 8D (phase-locking strength). B, N1 and N2 cell classes possess similar firing rate and local variability but diverge in their preference to synchronize to the local field potential in beta and theta frequency bands, respectively. C, Four highly different sets of firing properties in the prefrontal microcircuit.
Broad cell classes B1 and B4 (Fig. 11A,C) show sparse firing (Fig. 7A), bursty activity (Fig. 7B), and strong phase coupling to the LFP (Fig. 8D), mainly in theta band, which is implicated in information coding (Jensen and Lisman, 2000; Huxter et al., 2003; Kayser et al., 2012). According to theories of efficient coding (Perkel and Bullock, 1968; Willmore et al., 2011; Ratté et al., 2013; Jadi and Sejnowski, 2014), these physiological properties are particularly well suited to actively participate in neuronal circuit computations (see Discussion for a brief overview of neural coding and how it may relate to these cells and their functions).
However, the properties of B1 and B4 cells are presumably inherited in large part by interactions with other cell classes in the local circuit. Notably, the two narrow cell classes N3 and N4 (Fig. 11A,C) were characterized by high and remarkably regular firing (Fig. 7A,B), and failed to show an apparent phase locking to the LFP (Fig. 8D). These cells may be interconnected with the BS classes B1 and B4 and thereby serve as a sustained inhibitory tone, suggestive of the recently outlined blankets of inhibition (Karnani et al., 2014).
A distinct functional profile was evident in the BS classes B2 and B3 (Fig. 11A,C), which showed higher and more regular firing rates than cells in B1 and B4 classes (Fig. 7A,B). Also compared withB1 and B4, these cells showed less phase locking to the LFP (Fig. 8D). This suggests that these two broad cell classes, as a whole, may maintain the basic excitatory input in the local network. Thus, interactions between cells in B2 and B3, on the one hand, and N3 and N4 on the other, may establish the balance between excitation and inhibition in the microcircuit (Isaacson and Scanziani, 2011). Together they may set a low excitability level that is ultimately responsible for keeping B1 and B4 broad cells in mostly silent conditions.
Sparse, bursty activity of B1 and B4 cells may emerge through windows of opportunity generated by enhanced local excitability that transiently shifts the balance between excitation and inhibition (Csicsvari et al., 1999). These transients in excitability may be facilitated by oscillatory activity in the local population, and reflected in the local field (Csicsvari et al., 1999; Fries, 2005; Akam and Kullmann, 2014). NS classes N1 and N2 fit well with this view (Fig. 11A–C). They are characterized by modest Poisson-like firing (Fig. 7A,B) and frequency-specific phase-locking preferences (Fig. 8D). These cells may regulate the excitatory–inhibitory balance at different timescales (frequency bands) and, together with B1 and B4 cells, are expected to be directly implicated in information transfer (Constantinidis et al., 2002; Hangya et al., 2014; Kepecs and Fishell, 2014), gating the firing of pyramidal cells at distinct rhythms, specifically at theta versus beta bands (Figs. 8D, 11B).
Discussion
Prefrontal areas of the cortex play a prominent role in higher brain functions and cognition (Miller and Cohen, 2001), but their implementation in terms of neuronal diversity and microcircuital organization under behavioral conditions has remained elusive.
Through the last two decades, several studies have characterized cell classes in the prefrontal cortex of awake behaving primates using extracellular procedures. Most of these primate-based studies focused on the shape of the action potential as the main feature to distinguish putative (narrow spiking) interneurons and (broad spiking) pyramidal cells (Wilson et al., 1994; Constantinidis and Goldman-Rakic, 2002; Diester and Nieder, 2008; Hussar and Pasternak, 2009; Johnston et al., 2009). Some other approaches focused on the statistics of the firing pattern (Compte et al., 2003; Shinomoto et al., 2009) to classify neurons into bursty, Poisson, and regular spiking cells. The work presented here is therefore one of the few attempts that combines the two main facets for cell classification in the prefrontal cortex while in function during attentive task performance (Compte et al., 2003), and the first relying on unbiased clustering techniques.
Our results also show specificity in the phase-locking preferences of cell classes (Figs. 8, 11), in concordance with observations in visual cortex (Vinck et al., 2013). Note that the phase locking (PPC value) was excluded from being a direct criterion to identify cell classes in the clustering procedure. PPC values are noisy in most of the frequencies, so simply including all PPC values in the clustering analysis would distort the clustering results. We developed a permutation test that is a very reliable (i.e., conservative) measure of the significance of the phase-locking value; however, at each frequency, it filters out the cell subsets that fail to show statistically significant synchronization. This makes it difficult to use this metric in the clustering procedure without rapidly decreasing the number of cells to which it is applied. On the other hand, we computed the weighted phase-locking value by Rayleigh statistics (wPPC), which has the advantage of reporting a metric for all cells at all frequencies. This measure is less reliable compared with the permutation test (i.e., it is expected to generate more false positives compared with the permutation test, although also less false negatives). Thus, using wPPC values for cell classification can introduce artificial cell class scattering, which can be prevented by using it at the postclustering stage. These major statistical challenges in de-noising phase-locking properties prior to clustering first need to be methodologically addressed before they can be applied to our procedure.
We reliably characterized seven distinct cell classes of the prefrontal and cingulate microcircuits while monkeys performed a demanding selective attention task (Kaping et al., 2011). This result highlights the relevance of the local firing variability as the primary signature in neuronal classification in the awake and behaving animal (Fig. 3B). Notably, this finding was not exclusive of a hierarchical classification, in which cells first separate according to broad versus narrow cell types, and then within each type, neurons split based on firing properties (Fig. 5B). As expected, this documents that no single spike waveform or firing-based measure by itself was able to account for all neural diversity.
Using unbiased, nonredundant complementary measures of the action potential waveform and firing variability was essential for such a detailed cell classification. Thus, the time for repolarization complemented the peak-to-trough duration for a more reliable broad versus narrow cell-type identification (Fig. 1). Similarly, the firing variability was analyzed through two complementary measures, the coefficient of variation and the local variation. The coefficient of variation is, in contrast to the local variation, sensitive to nonstationarities in the firing rate (Shinomoto et al., 2003). Therefore, it is typically used under highly controlled, stereotyped experiments, or otherwise disregarded. However, it is intrinsically difficult to isolate all ultimate sources of variability, as well as to keep stationary conditions experimentally, even under identical stimulation conditions and overall in behavioral studies (Renart and Machens, 2014). In fact, we found that the coefficient of variation was a source of additional information (Fig. 3), specifically in N2 and B3 cell classes that showed the highest tendency to transiently shift their firing rate (Fig. 7C) in an epoch context-specific manner (Fig. 9C,D).
Two functional relationships revealed from unbiased electrophysiological classification
Our cell classification procedure evidenced two nontrivial functional relationships between otherwise divergent cell properties. First, we found anticorrelation between the overall firing rate and the local variation that held across individual cells, cell types, and classes (Fig. 7F, compare A, B), a relationship that to our knowledge is reported here for the first time. Second, both firing properties correlated with phase locking (Fig. 8E), although the actual functional interaction was principally between phase locking and local variation, as confirmed by a more sophisticated analysis that controlled for mutual correlations (Fig. 8F). This finding fits well with the results in Compte et al. (2003), in particular with regard to cells showing bursty activity together with the strongest tendency to phase lock to frequencies below 20 Hz. Thus, strength and significance of cells' firing in synchrony to the LFP oscillation at particular frequency bands was predicted by their local variation, so the higher the variability, the higher the local activity coordination (Bair et al., 1994). Note though that our analysis was not directional and it may be also the case that phase locking modified the intrinsic variability of cells, a mechanism that has been suggested for selective communication (Izhikevich et al., 2003).
The active prefrontal microcircuit is optimized for efficient coding
Functionally characterizing cell diversity, while macaques were actively engaged in task performance, demonstrated to be the basis for elaborate conceptual models of network organization in the prefrontal cortex. Especially salient in this framework was that B1 and B4 cells were fine-tuned by the local network to operate in a regime in which multiple views of efficient coding (Perkel and Bullock, 1968; Willmore et al., 2011; Ratté et al., 2013; Jadi and Sejnowski, 2014) are concomitant.
These cells showed (1) strong phase coupling, which is useful as a network mechanism to establish functional assemblies (Varela et al., 2001; Fries, 2005; Buzsáki, 2010; Canolty et al., 2010; Buschman et al., 2012; Miller and Buschman, 2013), to multiplex information in the temporal and frequency domains (Panzeri et al., 2010; Akam and Kullmann, 2014), and to establish reliable clock references (Kayser et al., 2012) and (2) sparse firing, which refers to an average low activity (Hahnloser et al., 2002; Assisi et al., 2007) as well as to transiently strong responses under otherwise mostly silent conditions (Olshausen and Field, 1996; Bell and Sejnowski, 1997), both aspects being properties of B1 and B4 neurons (Figs. 7A, 9C). Sparse firing regimes have been shown to be metabolically and computationally efficient (Treves and Rolls, 1991; Levy and Baxter, 1996), so the amount of information conveyed by unit spike is enhanced (Levy and Baxter, 1996), and it facilitates associative learning (Petersen and Crochet, 2013) and the readout of information (Froudarakis et al., 2014). (3) These cells showed bursty activity, which is also proposed to increase the reliability of the information transfer to the next relay (Lisman, 1997; Izhikevich et al., 2003; Li et al., 2009).
Therefore, we suggest that these cells may be involved in integrating long-range excitatory inputs, in processing that information locally, and in gating certain signals as the outputs of the microcircuit for next relays.
How narrow cell classes relate to reported interneuron subtypes in other studies
We speculate that the seven cell classes map onto four main functional roles that derive from very divergent electrophysiological properties across cells (Fig. 11), which we suggest have strong implications for efficient coding and information control in the prefrontal microcircuit. But how do the seven distinct cell classes relate to other studies? Electrophysiological properties in N3 and N4 cells fit well with the recently proposed blanket of inhibition (Karnani et al., 2014), conformed of fast spiking cells expressing calcium-binding parvalbumin (PV) proteins and low-threshold spiking cells expressing neuropeptide somatostatin (SOM), which impact the majority of pyramidal cells in the microcircuit (Burkhalter, 2008; Karnani et al., 2014). The two cell types have different preferred timescales at which they operate based on synaptic depression versus facilitation (Burkhalter, 2008; Karnani et al., 2014): while PV interneurons typically show depression and then generate fast, transient inhibition, SOM cells, which in part overlap with calcium-binding calbindin protein-expressing cells (Rogers, 1992; Kawaguchi and Kubota, 1997), become facilitated on repeated activation, and then underlie slow long-lasting inhibition.
The inhibitory drive of these two cell types could be combined to establish an overall stable level of inhibition in pyramidal cells (as we suggest for cell classes N3 and N4), or they could be either fairly independent or mutually inhibit each other, in which case slow/fast timescales could be linked to more complex oscillatory behavior, as the theta and beta rhythms that we reported in N2 and N1 cell classes, respectively.
A third interneuron type that may also relate to our cells expresses vasoactive intestinal polypeptide (VIP). VIP cells are present in the prefrontal cortex and they mainly target SOM cells and to a lesser degree PV and pyramidal cells (Kepecs and Fishell, 2014). These cells present a significant overlap with calcium-binding calretinin protein-expressing cells (Rogers, 1992; Kawaguchi and Kubota, 1997), typically fire sparsely, and their spike waveform is predominantly broad (Gentet, 2012); thus it is plausible that the majority of these cells constitute a modest part of the neurons included in B1 and B4 classes. In that case it might be that information flow is, at least in part, dependent of VIP cell-mediated disinhibition (Jiang et al., 2013).
In summary, our procedure of cell classification has started to build a bridge among cell-type characterization from in vitro studies as well as behavioral studies in rodents and primates. In addition, our interpretation of the prefrontal microcircuit fits well with a theoretically proposed division of labor of cell types underlying working memory and attention in the local prefrontal network (Constantinidis and Wang, 2004; Wang et al., 2004). In a different vein, slight modulations in local prefrontal circuits may tweak the excitation–inhibition balance and dramatically affect the information flow, as during context-dependent shifts of sensory–response mapping (Ardid and Wang, 2013). Our approach may therefore be a versatile starting point to identify the component cells in the prefrontal microcircuit that implement higher order executive control during goal-directed behavior in primates.
Footnotes
This research was supported by grants from the Canadian Institutes of Health Research, the Natural Sciences and Engineering Research Council of Canada, and the Ontario Ministry of Economic Development and Innovation. We thank Iman Janemi and Michelle Bale for their help with recording and anatomical reconstruction of the neurophysiological data. We also thank the reviewers for their thoughtful comments and suggestions.
The authors declare no competing financial interests.
References
- Akam T, Kullmann DM. Oscillatory multiplexing of population codes for selective communication in the mammalian brain. Nat Rev Neurosci. 2014;15:111–122. doi: 10.1038/nrn3668. [DOI] [PMC free article] [PubMed] [Google Scholar]
- Ardid S, Wang X-J. A tweaking principle for executive control: neuronal circuit mechanism for rule-based task switching and conflict resolution. J Neurosci. 2013;33:19504–19517. doi: 10.1523/JNEUROSCI.1356-13.2013. [DOI] [PMC free article] [PubMed] [Google Scholar]
- Asaad WF, Eskandar EN. A flexible software tool for temporally-precise behavioral control in Matlab. J Neurosci Methods. 2008a;174:245–258. doi: 10.1016/j.jneumeth.2008.07.014. [DOI] [PMC free article] [PubMed] [Google Scholar]
- Asaad WF, Eskandar EN. Achieving behavioral control with millisecond resolution in a high-level programming environment. J Neurosci Methods. 2008b;173:235–240. doi: 10.1016/j.jneumeth.2008.06.003. [DOI] [PMC free article] [PubMed] [Google Scholar]
- Ascoli GA, Alonso-Nanclares L, Anderson SA, Barrionuevo G, Benavides-Piccione R, Burkhalter A, Buzsaki G, Cauli B, Defelipe J, Fairen A, Feldmeyer D, Fishell G, Fregnac Y, Freund TF, Gardner D, Gardner EP, Goldberg JH, Helmstaedter M, Hestrin S, Karube F, et al. Petilla terminology: nomenclature of features of GABAergic interneurons of the cerebral cortex. Nat Rev Neurosci. 2008;9:557–568. doi: 10.1038/nrn2402. [DOI] [PMC free article] [PubMed] [Google Scholar]
- Assisi C, Stopfer M, Laurent G, Bazhenov M. Adaptive regulation of sparseness by feedforward inhibition. Nat Neurosci. 2007;10:1176–1184. doi: 10.1038/nn1947. [DOI] [PMC free article] [PubMed] [Google Scholar]
- Bair W, Koch C, Newsome W, Britten K. Power spectrum analysis of bursting cells in area MT in the behaving monkey. J Neurosci. 1994;14:2870–2892. doi: 10.1523/JNEUROSCI.14-05-02870.1994. [DOI] [PMC free article] [PubMed] [Google Scholar]
- Barbas H, Zikopoulos B. The prefrontal cortex and flexible behavior. Neuroscientist. 2007;13:532–545. doi: 10.1177/1073858407301369. [DOI] [PMC free article] [PubMed] [Google Scholar]
- Bell AJ, Sejnowski TJ. The “independent components” of natural scenes are edge filters. Vision Res. 1997;37:3327–3338. doi: 10.1016/S0042-6989(97)00121-1. [DOI] [PMC free article] [PubMed] [Google Scholar]
- Burkhalter A. Many specialists for suppressing cortical excitation. Front Neurosci. 2008;2:155–167. doi: 10.3389/neuro.01.026.2008. [DOI] [PMC free article] [PubMed] [Google Scholar]
- Buschman TJ, Miller EK. Top-down versus bottom-up control of attention in the prefrontal and posterior parietal cortices. Science. 2007;315:1860–1862. doi: 10.1126/science.1138071. [DOI] [PubMed] [Google Scholar]
- Buschman TJ, Denovellis EL, Diogo C, Bullock D, Miller EK. Synchronous oscillatory neural ensembles for rules in the prefrontal cortex. Neuron. 2012;76:838–846. doi: 10.1016/j.neuron.2012.09.029. [DOI] [PMC free article] [PubMed] [Google Scholar]
- Buzsáki G. Neural syntax: cell assemblies, synapsembles, and readers. Neuron. 2010;68:362–385. doi: 10.1016/j.neuron.2010.09.023. [DOI] [PMC free article] [PubMed] [Google Scholar]
- Canolty RT, Ganguly K, Kennerley SW, Cadieu CF, Koepsell K, Wallis JD, Carmena JM. Oscillatory phase coupling coordinates anatomically dispersed functional cell assemblies. Proc Natl Acad Sci U S A. 2010;107:17356–17361. doi: 10.1073/pnas.1008306107. [DOI] [PMC free article] [PubMed] [Google Scholar]
- Cheng M-Y, Hall P. Calibrating the excess mass and dip tests of modality. J Roy Statist Soc Ser B. 1998;60:579–589. doi: 10.1111/1467-9868.00141. [DOI] [Google Scholar]
- Compte A, Constantinidis C, Tegner J, Raghavachari S, Chafee MV, Goldman-Rakic PS, Wang X-J. Temporally irregular mnemonic persistent activity in prefrontal neurons of monkeys during a delayed response task. J Neurophysiol. 2003;90:3441–3454. doi: 10.1152/jn.00949.2002. [DOI] [PubMed] [Google Scholar]
- Constantinidis C, Goldman-Rakic PS. Correlated discharges among putative pyramidal neurons and interneurons in the primate prefrontal cortex. J Neurophysiol. 2002;88:3487–3497. doi: 10.1152/jn.00188.2002. [DOI] [PubMed] [Google Scholar]
- Constantinidis C, Wang X-J. A neural circuit basis for spatial working memory. Neuroscientist. 2004;10:553–565. doi: 10.1177/1073858404268742. [DOI] [PubMed] [Google Scholar]
- Constantinidis C, Williams GV, Goldman-Rakic PS. A role for inhibition in shaping the temporal flow of information in prefrontal cortex. Nat Neurosci. 2002;5:175–180. doi: 10.1038/nn799. [DOI] [PubMed] [Google Scholar]
- Csicsvari J, Hirase H, Czurkó A, Mamiya A, Buzsáki G. Oscillatory coupling of hippocampal pyramidal cells and interneurons in the behaving rat. J Neurosci. 1999;19:274–287. doi: 10.1523/JNEUROSCI.19-01-00274.1999. [DOI] [PMC free article] [PubMed] [Google Scholar]
- DeFelipe J, Lopez-Cruz PL, Benavides-Piccione R, Bielza C, Larranaga P, Anderson S, Burkhalter A, Cauli B, Fairen A, Feldmeyer D, Fishell G, Fitzpatrick D, Freund TF, Gonzalez-Burgos G, Hestrin S, Hill S, Hof PR, Huang J, Jones EG, Kawaguchi Y, et al. New insights into the classification and nomenclature of cortical GABAergic interneurons. Nat Rev Neurosci. 2013;14:202–216. doi: 10.1038/nrn3444. [DOI] [PMC free article] [PubMed] [Google Scholar]
- Diester I, Nieder A. Complementary contributions of prefrontal neuron classes in abstract numerical categorization. J Neurosci. 2008;28:7737–7747. doi: 10.1523/JNEUROSCI.1347-08.2008. [DOI] [PMC free article] [PubMed] [Google Scholar]
- Fries P. A mechanism for cognitive dynamics: neuronal communication through neuronal coherence. Trends Cogn Sci. 2005;9:474–480. doi: 10.1016/j.tics.2005.08.011. [DOI] [PubMed] [Google Scholar]
- Froudarakis E, Berens P, Ecker AS, Cotton RJ, Sinz FH, Yatsenko D, Saggau P, Bethge M, Tolias AS. Population code in mouse V1 facilitates readout of natural scenes through increased sparseness. Nat Neurosci. 2014;17:851–857. doi: 10.1038/nn.3707. [DOI] [PMC free article] [PubMed] [Google Scholar]
- Gentet LJ. Functional diversity of supragranular GABAergic neurons in the barrel cortex. Front Neural Circuits. 2012;6:52. doi: 10.3389/fncir.2012.00052. [DOI] [PMC free article] [PubMed] [Google Scholar]
- Gregoriou GG, Gotts SJ, Zhou H, Desimone R. High-frequency, long-range coupling between prefrontal and visual cortex during attention. Science. 2009;324:1207–1210. doi: 10.1126/science.1171402. [DOI] [PMC free article] [PubMed] [Google Scholar]
- Gregoriou GG, Gotts SJ, Desimone R. Cell-type-specific synchronization of neural activity in FEF with V4 during attention. Neuron. 2012;73:581–594. doi: 10.1016/j.neuron.2011.12.019. [DOI] [PMC free article] [PubMed] [Google Scholar]
- Hahnloser RH, Kozhevnikov AA, Fee MS. An ultra-sparse code underlies the generation of neural sequences in a songbird. Nature. 2002;419:65–70. doi: 10.1038/nature00974. [DOI] [PubMed] [Google Scholar]
- Halkidi M, Batistakis Y, Vazirgiannis M. On clustering validation techniques. J Intell Inform Syst. 2001;17:107–145. doi: 10.1023/A:1012801612483. [DOI] [Google Scholar]
- Hangya B, Pi HJ, Kvitsiani D, Ranade SP, Kepecs A. From circuit motifs to computations: mapping the behavioral repertoire of cortical interneurons. Curr Opin Neurobiol. 2014;26:117–124. doi: 10.1016/j.conb.2014.01.007. [DOI] [PMC free article] [PubMed] [Google Scholar]
- Hartigan JA, Hartigan PM. The dip test of unimodality. Ann Statist. 1985;13:70–84. doi: 10.1214/aos/1176346577. [DOI] [Google Scholar]
- Henderson DJ, Parmeter CF, Russell RR. Modes, weighted modes, and calibrated modes: evidence of clustering using modality tests. J Appl Econom. 2008;23:607–638. doi: 10.1002/jae.1023. [DOI] [Google Scholar]
- Holt GR, Softky WR, Koch C, Douglas RJ. Comparison of discharge variability in vitro and in vivo in cat visual cortex neurons. J Neurophysiol. 1996;75:1806–1814. doi: 10.1152/jn.1996.75.5.1806. [DOI] [PubMed] [Google Scholar]
- Hussar CR, Pasternak T. Flexibility of sensory representations in prefrontal cortex depends on cell type. Neuron. 2009;64:730–743. doi: 10.1016/j.neuron.2009.11.018. [DOI] [PMC free article] [PubMed] [Google Scholar]
- Huxter J, Burgess N, O'Keefe J. Independent rate and temporal coding in hippocampal pyramidal cells. Nature. 2003;425:828–832. doi: 10.1038/nature02058. [DOI] [PMC free article] [PubMed] [Google Scholar]
- Insel N, Barnes CA. Differential activation of fast-spiking and regular-firing neuron populations during movement and reward in the dorsal medial frontal cortex. Cereb Cortex. 2014 doi: 10.1093/cercor/bhu062. Advance online publication. Retrieved April 3, 2014. [DOI] [PMC free article] [PubMed] [Google Scholar]
- Isaacson JS, Scanziani M. How inhibition shapes cortical activity. Neuron. 2011;72:231–243. doi: 10.1016/j.neuron.2011.09.027. [DOI] [PMC free article] [PubMed] [Google Scholar]
- Izhikevich EM, Desai NS, Walcott EC, Hoppensteadt FC. Bursts as a unit of neural information: selective communication via resonance. Trends Neurosci. 2003;26:161–167. doi: 10.1016/S0166-2236(03)00034-1. [DOI] [PubMed] [Google Scholar]
- Jadi MP, Sejnowski TJ. Cortical oscillations arise from contextual interactions that regulate sparse coding. Proc Natl Acad Sci U S A. 2014;111:6780–6785. doi: 10.1073/pnas.1405300111. [DOI] [PMC free article] [PubMed] [Google Scholar]
- Jain AK, Dubes RC. Algorithms for clustering data. Englewood Cliffs, NJ: Prentice-Hall; 1988. [Google Scholar]
- Jensen O, Lisman JE. Position reconstruction from an ensemble of hippocampal place cells: contribution of theta phase coding. J Neurophysiol. 2000;83:2602–2609. doi: 10.1152/jn.2000.83.5.2602. [DOI] [PubMed] [Google Scholar]
- Jiang X, Wang G, Lee AJ, Stornetta RL, Zhu JJ. The organization of two new cortical interneuronal circuits. Nat Neurosci. 2013;16:210–218. doi: 10.1038/nn.3305. [DOI] [PMC free article] [PubMed] [Google Scholar]
- Johnston K, DeSouza JF, Everling S. Monkey prefrontal cortical pyramidal and putative interneurons exhibit differential patterns of activity between prosaccade and antisaccade tasks. J Neurosci. 2009;29:5516–5524. doi: 10.1523/JNEUROSCI.5953-08.2009. [DOI] [PMC free article] [PubMed] [Google Scholar]
- Kaping D, Vinck M, Hutchison RM, Everling S, Womelsdorf T. Specific contributions of ventromedial, anterior cingulate, and lateral prefrontal cortex for attentional selection and stimulus valuation. PLoS Biol. 2011;9:e1001224. doi: 10.1371/journal.pbio.1001224. [DOI] [PMC free article] [PubMed] [Google Scholar]
- Karnani MM, Agetsuma M, Yuste R. A blanket of inhibition: functional inferences from dense inhibitory connectivity. Curr Opin Neurobiol. 2014;26:96–102. doi: 10.1016/j.conb.2013.12.015. [DOI] [PMC free article] [PubMed] [Google Scholar]
- Kaufman MT, Churchland MM, Santhanam G, Yu BM, Afshar A, Ryu SI, Shenoy KV. Roles of monkey premotor neuron classes in movement preparation and execution. J Neurophysiol. 2010;104:799–810. doi: 10.1152/jn.00231.2009. [DOI] [PMC free article] [PubMed] [Google Scholar]
- Kawaguchi Y, Kubota Y. GABAergic cell subtypes and their synaptic connections in rat frontal cortex. Cereb Cortex. 1997;7:476–486. doi: 10.1093/cercor/7.6.476. [DOI] [PubMed] [Google Scholar]
- Kayser C, Ince RA, Panzeri S. Analysis of slow (theta) oscillations as a potential temporal reference frame for information coding in sensory cortices. PLoS Comput Biol. 2012;8:e1002717. doi: 10.1371/journal.pcbi.1002717. [DOI] [PMC free article] [PubMed] [Google Scholar]
- Kepecs A, Fishell G. Interneuron cell types are fit to function. Nature. 2014;505:318–326. doi: 10.1038/nature12983. [DOI] [PMC free article] [PubMed] [Google Scholar]
- Lee SH, Kwan AC, Dan Y. Interneuron subtypes and orientation tuning. Nature. 2014;508:E1–E2. doi: 10.1038/nature13128. [DOI] [PubMed] [Google Scholar]
- Levy WB, Baxter RA. Energy efficient neural codes. Neural Comput. 1996;8:531–543. doi: 10.1162/neco.1996.8.3.531. [DOI] [PubMed] [Google Scholar]
- Li CY, Poo MM, Dan Y. Burst spiking of a single cortical neuron modifies global brain state. Science. 2009;324:643–646. doi: 10.1126/science.1169957. [DOI] [PMC free article] [PubMed] [Google Scholar]
- Lisman JE. Bursts as a unit of neural information: making unreliable synapses reliable. Trends Neurosci. 1997;20:38–43. doi: 10.1016/S0166-2236(96)10070-9. [DOI] [PubMed] [Google Scholar]
- Markram H, Toledo-Rodriguez M, Wang Y, Gupta A, Silberberg G, Wu C. Interneurons of the neocortical inhibitory system. Nat Rev Neurosci. 2004;5:793–807. doi: 10.1038/nrn1519. [DOI] [PubMed] [Google Scholar]
- Miller EK, Buschman TJ. Cortical circuits for the control of attention. Curr Opin Neurobiol. 2013;23:216–222. doi: 10.1016/j.conb.2012.11.011. [DOI] [PMC free article] [PubMed] [Google Scholar]
- Miller EK, Cohen JD. An integrative theory of prefrontal cortex function. Annu Rev Neurosci. 2001;24:167–202. doi: 10.1146/annurev.neuro.24.1.167. [DOI] [PubMed] [Google Scholar]
- Milligan GW, Cooper MC. An examination of procedures for determining the number of clusters in a data set. Psychometrika. 1985;50:159–179. doi: 10.1007/BF02294245. [DOI] [Google Scholar]
- Mitchell JF, Sundberg KA, Reynolds JH. Differential attention-dependent response modulation across cell classes in macaque visual area V4. Neuron. 2007;55:131–141. doi: 10.1016/j.neuron.2007.06.018. [DOI] [PubMed] [Google Scholar]
- Olshausen BA, Field DJ. Emergence of simple-cell receptive field properties by learning a sparse code for natural images. Nature. 1996;381:607–609. doi: 10.1038/381607a0. [DOI] [PubMed] [Google Scholar]
- Panzeri S, Brunel N, Logothetis NK, Kayser C. Sensory neural codes using multiplexed temporal scales. Trends Neurosci. 2010;33:111–120. doi: 10.1016/j.tins.2009.12.001. [DOI] [PubMed] [Google Scholar]
- Passingham RE, Wise SP. The neurobiology of the prefrontal cortex: anatomy, evolution, and the origin of insight. New York: Oxford UP; 2012. [Google Scholar]
- Perkel DH, Bullock TH. Neural coding. Neurosci Res Prog Bull. 1968;6:221–348. [Google Scholar]
- Petersen CC, Crochet S. Synaptic computation and sensory processing in neocortical layer 2/3. Neuron. 2013;78:28–48. doi: 10.1016/j.neuron.2013.03.020. [DOI] [PubMed] [Google Scholar]
- Povysheva NV, Zaitsev AV, Kröner S, Krimer OA, Rotaru DC, Gonzalez-Burgos G, Lewis DA, Krimer LS. Electrophysiological differences between neurogliaform cells from monkey and rat prefrontal cortex. J Neurophysiol. 2007;97:1030–1039. doi: 10.1152/jn.00794.2006. [DOI] [PubMed] [Google Scholar]
- Preuss TM. Do rats have prefrontal cortex? The Rose-Woolsey-Akert program reconsidered. J Cogn Neurosci. 1995;7:1–24. doi: 10.1162/jocn.1995.7.1.1. [DOI] [PubMed] [Google Scholar]
- Ratté S, Hong S, De Schutter E, Prescott SA. Impact of neuronal properties on network coding: roles of spike initiation dynamics and robust synchrony transfer. Neuron. 2013;78:758–772. doi: 10.1016/j.neuron.2013.05.030. [DOI] [PMC free article] [PubMed] [Google Scholar]
- Renart A, Machens CK. Variability in neural activity and behavior. Curr Opin Neurobiol. 2014;25:211–220. doi: 10.1016/j.conb.2014.02.013. [DOI] [PubMed] [Google Scholar]
- Rogers JH. Immunohistochemical markers in rat cortex: co-localization of calretinin and calbindin-D28k with neuropeptides and GABA. Brain Res. 1992;587:147–157. doi: 10.1016/0006-8993(92)91439-L. [DOI] [PubMed] [Google Scholar]
- Rosset A, Spadola L, Ratib O. OsiriX: an open-source software for navigating in multidimensional DICOM images. J Digit Imaging. 2004;17:205–216. doi: 10.1007/s10278-004-1014-6. [DOI] [PMC free article] [PubMed] [Google Scholar]
- Roux L, Stark E, Sjulson L, Buzsáki G. In vivo optogenetic identification and manipulation of GABAergic interneuron subtypes. Curr Opin Neurobiol. 2014;26:88–95. doi: 10.1016/j.conb.2013.12.013. [DOI] [PMC free article] [PubMed] [Google Scholar]
- Shen C, Ardid S, Kaping D, Westendorff S, Everling S, Womelsdorf T. Anterior cingulate cortex cells identify process-specific errors of attentional control prior to transient prefrontal-cingulate inhibition. Cereb Cortex. 2014 doi: 10.1093/cercor/bhu028. Advance online publication. Retrieved March 2, 2014. [DOI] [PMC free article] [PubMed] [Google Scholar]
- Shinomoto S, Shima K, Tanji J. Differences in spiking patterns among cortical neurons. Neural Comput. 2003;15:2823–2842. doi: 10.1162/089976603322518759. [DOI] [PubMed] [Google Scholar]
- Shinomoto S, Miyazaki Y, Tamura H, Fujita I. Regional and laminar differences in in vivo firing patterns of primate cortical neurons. J Neurophysiol. 2005;94:567–575. doi: 10.1152/jn.00896.2004. [DOI] [PubMed] [Google Scholar]
- Shinomoto S, Kim H, Shimokawa T, Matsuno N, Funahashi S, Shima K, Fujita I, Tamura H, Doi T, Kawano K, Inaba N, Fukushima K, Kurkin S, Kurata K, Taira M, Tsutsui K, Komatsu H, Ogawa T, Koida K, Tanji J, et al. Relating neuronal firing patterns to functional differentiation of cerebral cortex. PLoS Comput Biol. 2009;5:e1000433. doi: 10.1371/journal.pcbi.1000433. [DOI] [PMC free article] [PubMed] [Google Scholar]
- Treves A, Rolls ET. What determines the capacity of autoassociative memories in the brain? Network. 1991;2:371–397. doi: 10.1088/0954-898X/2/4/004. [DOI] [Google Scholar]
- Van Essen DC. Windows on the brain: the emerging role of atlases and databases in neuroscience. Curr Opin Neurobiol. 2002;12:574–579. doi: 10.1016/S0959-4388(02)00361-6. [DOI] [PubMed] [Google Scholar]
- Van Essen DC, Drury HA, Dickson J, Harwell J, Hanlon D, Anderson CH. An integrated software suite for surface-based analyses of cerebral cortex. J Am Med Inform Assoc. 2001;8:443–459. doi: 10.1136/jamia.2001.0080443. [DOI] [PMC free article] [PubMed] [Google Scholar]
- Varela F, Lachaux JP, Rodriguez E, Martinerie J. The brainweb: phase synchronization and large-scale integration. Nat Rev Neurosci. 2001;2:229–239. doi: 10.1038/35067550. [DOI] [PubMed] [Google Scholar]
- Vendramin L, Campello RJ, Hruschka ER. Relative clustering validity criteria: a comparative overview. Statist Anal Data Mining. 2010;3:209–235. [Google Scholar]
- Vigneswaran G, Kraskov A, Lemon RN. Large identified pyramidal cells in macaque motor and premotor cortex exhibit “thin spikes”: implications for cell type classification. J Neurosci. 2011;31:14235–14242. doi: 10.1523/JNEUROSCI.3142-11.2011. [DOI] [PMC free article] [PubMed] [Google Scholar]
- Vinck M, van Wingerden M, Womelsdorf T, Fries P, Pennartz CM. The pairwise phase consistency: a bias-free measure of rhythmic neuronal synchronization. Neuroimage. 2010;51:112–122. doi: 10.1016/j.neuroimage.2010.01.073. [DOI] [PubMed] [Google Scholar]
- Vinck M, Battaglia FP, Womelsdorf T, Pennartz C. Improved measures of phase-coupling between spikes and the local field potential. J Comput Neurosci. 2012;33:53–75. doi: 10.1007/s10827-011-0374-4. [DOI] [PMC free article] [PubMed] [Google Scholar]
- Vinck M, Womelsdorf T, Buffalo EA, Desimone R, Fries P. Attentional modulation of cell-class-specific gamma-band synchronization in awake monkey area v4. Neuron. 2013;80:1077–1089. doi: 10.1016/j.neuron.2013.08.019. [DOI] [PMC free article] [PubMed] [Google Scholar]
- Vogels TP, Abbott LF. Gating multiple signals through detailed balance of excitation and inhibition in spiking networks. Nat Neurosci. 2009;12:483–491. doi: 10.1038/nn.2276. [DOI] [PMC free article] [PubMed] [Google Scholar]
- Wang X-J, Tegnér J, Constantinidis C, Goldman-Rakic PS. Division of labor among distinct subtypes of inhibitory neurons in a cortical microcircuit of working memory. Proc Natl Acad Sci U S A. 2004;101:1368–1373. doi: 10.1073/pnas.0305337101. [DOI] [PMC free article] [PubMed] [Google Scholar]
- Willmore BD, Mazer JA, Gallant JL. Sparse coding in striate and extrastriate visual cortex. J Neurophysiol. 2011;105:2907–2919. doi: 10.1152/jn.00594.2010. [DOI] [PMC free article] [PubMed] [Google Scholar]
- Wilson FA, O'Scalaidhe SP, Goldman-Rakic PS. Functional synergism between putative gamma-aminobutyrate-containing neurons and pyramidal neurons in prefrontal cortex. Proc Natl Acad Sci U S A. 1994;91:4009–4013. doi: 10.1073/pnas.91.9.4009. [DOI] [PMC free article] [PubMed] [Google Scholar]
- Womelsdorf T, Johnston K, Vinck M, Everling S. Theta-activity in anterior cingulate cortex predicts task rules and their adjustments following errors. Proc Natl Acad Sci U S A. 2010;107:5248–5253. doi: 10.1073/pnas.0906194107. [DOI] [PMC free article] [PubMed] [Google Scholar]
- Womelsdorf T, Lima B, Vinck M, Oostenveld R, Singer W, Neuenschwander S, Fries P. Orientation selectivity and noise correlation in awake monkey area V1 are modulated by the gamma cycle. Proc Natl Acad Sci U S A. 2012;109:4302–4307. doi: 10.1073/pnas.1114223109. [DOI] [PMC free article] [PubMed] [Google Scholar]
- Womelsdorf T, Ardid S, Everling S, Valiante TA. Burst firing synchronizes prefrontal and anterior cingulate cortex during attentional control. Curr Biol. 2014a;24:2613–2621. doi: 10.1016/j.cub.2014.09.046. [DOI] [PubMed] [Google Scholar]
- Womelsdorf T, Valiante TA, Sahin NT, Miller KJ, Tiesinga P. Dynamic circuit motifs underlying rhythmic gain control, gating and integration. Nat Neurosci. 2014b;17:1031–1039. doi: 10.1038/nn.3764. [DOI] [PubMed] [Google Scholar]
- Xue M, Atallah BV, Scanziani M. Equalizing excitation-inhibition ratios across visual cortical neurons. Nature. 2014;511:596–600. doi: 10.1038/nature13321. [DOI] [PMC free article] [PubMed] [Google Scholar]
- Zanos TP, Mineault PJ, Pack CC. Removal of spurious correlations between spikes and local field potentials. J Neurophysiol. 2011;105:474–486. doi: 10.1152/jn.00642.2010. [DOI] [PubMed] [Google Scholar]