

Abstract
Topographic organization is one of the main principles of organization in the human brain. Specifically, whole-brain topographic mapping using spectral analysis is responsible for one of the greatest advances in vision research. Thus, it is intriguing that although topography is a key feature also in the motor system, whole-body somatosensory-motor mapping using spectral analysis has not been conducted in humans outside M1/SMA. Here, using this method, we were able to map a homunculus in the globus pallidus, a key target area for deep brain stimulation, which has not been mapped noninvasively or in healthy subjects. The analysis clarifies contradictory and partial results regarding somatotopy in the caudal-cingulate zone and rostral-cingulate zone in the medial wall and in the putamen. Most of the results were confirmed at the single-subject level and were found to be compatible with results from animal studies. Using multivoxel pattern analysis, we could predict movements of individual body parts in these homunculi, thus confirming that they contain somatotopic information. Using functional connectivity, we demonstrate interhemispheric functional somatotopic connectivity of these homunculi, such that the somatotopy in one hemisphere could have been found given the connectivity pattern of the corresponding regions of interest in the other hemisphere. When inspecting the somatotopic and nonsomatotopic connectivity patterns, a similarity index indicated that the pattern of connected and nonconnected regions of interest across different homunculi is similar for different body parts and hemispheres. The results show that topographical gradients are even more widespread than previously assumed in the somatosensory-motor system. Spectral analysis can thus potentially serve as a gold standard for defining somatosensory-motor system areas for basic research and clinical applications.
Keywords: functional connectivity, motor system, spectral analysis, topography
Introduction
Topographic organization is one of the main organizing principles in several systems in the brain, including the visual and auditory systems. Topography is also a key feature of the somatosensory-motor system (Penfield and Boldrey, 1937). Despite the importance of efficient and accurate topographic mapping of motor areas in the human brain for both basic research and medical applications, body-part mapping in key areas is still unclear or lacking.
Specifically, studies examining the somatotopic gradients in the globus pallidus, a target area for deep brain stimulation (DBS), have been carried out on Parkinson's disease or dystonia patients using electric stimulation during surgery. These studies targeted the globus pallidus internus and have yielded a wide assortment of results ranging from a complete absence of somatotopy (Yelnik et al., 2000), through partial replication of the results from animal studies (Chang et al., 2007), to a detailed description of somatotopy that is consistent with animal studies (Baker et al., 2010). To the best of our knowledge, noninvasive studies of somatotopic mapping in the globus pallidus, which potentially can serve to guide DBS, or of somatotopic mapping in healthy subjects, have never been conducted.
In the putamen, brain-mapping studies have yielded conflicting results (Maillard et al., 2000; Gerardin et al., 2003; Choi et al., 2012). All previous studies of this nucleus have investigated the response to movement in only a limited number of body parts.
Motor-related areas can also be found in the medial wall. In their meta-analysis of positron emission topography studies in humans, Picard and Strick (1996) suggested that the human medial wall is divided into four areas, which closely correspond to areas found in monkeys: the supplementary motor area (SMA), the pre-SMA, the caudal cingulate zone (CCZ), and the rostral cingulate zone (RCZ). While the somatotopic organization in the SMA is well established in humans and animals (Mitz and Wise, 1987; Zeharia et al., 2012), this organization is much less clear in the CCZ and RCZ, and even in the corresponding areas in animals (Woolsey et al., 1952; Luppino et al., 1991; Wu et al., 2000). Even though noninvasive and invasive human studies have consistently reported motor-related activations in these areas, the reported somatotopic organization (Paus et al., 1993; Picard and Strick, 1996; Arienzo et al., 2006) is not consistent across studies, is often unclear, and contains a very limited representation of the body.
Here we used a variety of methods to reveal the topographic mapping of the globus pallidus, putamen, CCZ, and RCZ at the group and single-subject level, and to characterize some of their properties. These methods include spectral analysis, which is widely used to map sensory representations (Engel, 2012); multivoxel pattern analysis (MVPA), which can verify the existence of somatotopic information (Zeharia et al., 2012); and functional connectivity, which can demonstrate the existence of somatotopic and nonsomatotopic connections as well as shed light on the connectivity pattern of the homunculi found.
Given the extent and importance of topographic organization, comprehensive mapping of the sensory-motor system can serve as a guide for a variety of future scientific and clinical explorations.
Materials and Methods
Subjects
Sixteen healthy, right-handed subjects (eight women) aged 25–35 years participated in the periodic (11 subjects) and the slow event-related (seven subjects) experiments. Two of the subjects participated in both the periodic and event-related experiments. The experimental procedure was approved by the local ethics committee and written informed consent was obtained from all subjects. The details of the periodic experiments and the event-related experiment are also described elsewhere (Zeharia et al., 2012).
Periodic experiments
Toes to tongue.
Subjects moved 20 body parts consecutively, while lying with their eyes closed and blindfolded inside the fMRI scanner (Fig. 1A, left). The movement sequence followed the order from toes to tongue described by Penfield and Boldrey (1937) in the primary motor cortex homunculus. It included bilateral movements of the following body parts: toes (flexion/extension), feet (flexion/extension), thighs (contraction), buttocks (contraction), stomach (contraction), upper arm (contraction), elbow (flexion/extension), wrist (flexion/extension), fist (contraction), little finger (flexion/extension), ring finger (flexion/extension), middle finger (flexion/extension), index finger (flexion/extension), thumb (flexion/extension), forehead (contraction), nose (contraction), eyelids (contraction), lips (contraction), jaw (flexion/extension), and tongue (a side to side movement with the mouth closed). The subjects were instructed to execute the movements on hearing an auditory cue, which was the spoken name of the body part followed by three metronome beeps at 1 s intervals, during which the subject moved the body part. Overall, each body part was moved three times within a period of 3 s, and the next body part was announced during the last second. The whole movement cycle lasted 60 s and was followed by a rest period of 12 s. Eight cycles of movement and rest were performed, at a stimulus frequency of 0.0138 Hz. The subjects were trained for ∼1 h before entering the scanner.
Figure 1.

Spectral analysis and MVPA of somatotopic gradients. A, The experimental design of the periodic experiment, comprising eight cycles of consecutive movements of 20 body parts from toes to tongue and eight reversed cycles from tongue to toes. B, The Fourier amplitude in various frequencies of a typical voxel from the anterior lobe of the cerebellum. A high amplitude at the repetition frequency of the experiment indicates that this voxel was responsive to movement. C, The amplitude at the repetition frequency and the phase value were derived from the Fourier analysis of the time course in a certain voxel, and were used to build a cosine, which served as a model of activation for this voxel. The BOLD signal of this cerebellar voxel is also shown. D, Somatotopic gradients derived from the Fourier analysis in M1 (1) and in the anterior lobe of the cerebellum (2). The color code corresponds to the average phase values of the toes-to-tongue (1 to 20) and tongue-to-toes (20 to 1) directions, from blue (first phase response, toes) to red (last phase response, tongue). An anatomical mask was applied to the anterior lobe of the cerebellum. Penfield's homunculus is illustrated for comparison (Zeharia et al., 2012). The same procedures were applied to all homunculi. E, The experimental design of the event-related experiment, with randomized, 4.5 s blocks of movement and 12 s of rest, 20 repetitions for each body part. F, MPVA; training and testing multiclass SVM separately for each group of body parts (blue, leg and trunk; green, hand; red, face body parts), using the β values from the event-related experiment and the leave-one-out approach. G, Average group results and error bars of the classification at the anterior lobe of the cerebellum, showing significant classification above the 95th percentile derived from a randomized permutation test (black; white, the mean of this test). Ant, Anterior; Pos, posterior; Ven, ventral; Dor, dorsal; H, homunculus F, finger; RH, right hemisphere; LH, left hemisphere. ***p < 0.001.
Tongue to toes.
Eight of the 11 subjects who participated in the toes-to-tongue experiment also participated in the tongue-to-toes experiment. This experiment was identical to the toes-to-tongue experiment but the movements were performed in the reverse order, from tongue to toes (Fig. 1A, right).
Event-related experiment
All 20 body-parts in the periodic experiments were moved 20 times each, in an event-related paradigm and in a pseudorandomized order balanced for first-order history (Fig. 1E).. In each event, a 4.5 s block of movement was followed by a 12 s rest. At the beginning of each movement period, subjects heard the name of the body part to be moved. Movement was paced with a metronome, and five movements were performed in each event at a frequency of 1 Hz. The 400 movement-rest periods were divided into 10 runs. After five runs, subjects left the scanner for 20 min and then returned for the remaining five runs. In five subjects, EMGs were recorded to ensure correct performance of the task.
Functional MRI acquisition
The BOLD fMRI measurements were obtained in a whole-body 3T Magnetom Trio scanner with 12 channels (Siemens). The fMRI protocols were based on multislice gradient echoplanar imaging and a standard head coil. The functional data were collected under the following timing parameters: TR = 1.5 s; TE = 30 ms; FA = 70°; imaging matrix, 80 × 80; FOV, 24 × 24 cm (i.e., in-plane resolution of 3 mm). We used a relatively short TR value to later superimpose the phase-locking spectral analysis approach. Twenty-six slices with slice thickness of 4.5 mm and no gaps were oriented in the axial position for complete coverage of the cortex. Given that the slice thickness was higher than the in-plane resolution, the spatial resolution along the dorsoventral, superior-inferior axis was lower than the resolution along the posterior-anterior and medial-lateral axes.
Three-dimensional recording and cortex reconstruction
Separate 3D recordings were used for coregistration. High-resolution 3D anatomical volumes were collected using T1-weighted images using a 3D turbo field echo T1-weighted sequence (equivalent to MP-RAGE). Typical parameters were as follows: FOV, 23 (right to left) × 23 (ventral to dorsal) × 17 (anterior to posterior) cm; foldover axis: right to left; data matrix: 160 × 160 × 144; zero filled to 256 in all directions (∼1 mm isovoxel native data); TR/TE = 9/6 ms; flip angle, 8°. Group results were superimposed on a 3D cortical reconstruction of a Talairach-normalized brain (Talairach and Tournoux, 1988). Cortical reconstruction included the segmentation of the white matter using a grow-region function embedded in the Brain Voyager QX 2.1.2 software package. The cortical surface was then inflated.
Preprocessing
The first 10 images (during the first baseline rest condition) were excluded from the analysis in all experiments because of nonsteady-state magnetization. Data were mainly preprocessed using the Brain Voyager QX software package (Brain Innovation). Functional MRI data preprocessing included head-motion correction. Slice scan time correction and high-pass filtering using temporal smoothing in the frequency domain removed drifts and improved the signal-to-noise ratio. Functional and anatomical datasets for each subject were aligned and fitted to standardized Talairach space. In this process, the data were resampled at a 3 × 3 × 3 mm resolution using a trilinear interpolation method. This mainly resulted in the addition of data points along the dorsoventral axis. This level of resampling is unlikely to create a gradient that does not exist, for instance, in the putamen or globus pallidus, despite the fact that the number of data points in the dorsoventral axis in these nuclei was relatively small.
Spectral analysis
Spectral analyses were conducted with an in-house program using Matlab (MathWorks). Before the analysis, the data from the periodic experiments were temporally smoothed (Gaussian kernel of 4 s FWHM) and detrended to remove the mean value and linear drift. Then, following standard retinotopy procedures (Engel et al., 1994, 1997), we applied Fourier analysis to the time course of each voxel, locked to the stimulus repetition frequency. The details of this analysis and the adaptation for use in Brain Voyager and Matlab programs have been described elsewhere (Hertz and Amedi, 2010; Zeharia et al., 2012). Briefly, the Fourier analysis delivered amplitude and phase values of the time course in each voxel. Figure 1B shows the Fourier amplitudes in various frequencies in a typical voxel at the anterior lobe of the cerebellum. This amplitude was the highest at the repetition frequency (0.0139 Hz). Figure 1C shows the BOLD signal in the same cerebellar voxel, along with a pure cosine function made up of the amplitude and the phase values at the repetition frequency. This cosine profile served as a model of the activation for further statistical evaluation of the results. A Pearson correlation coefficient was calculated between this model cosine and the time course in each voxel and this was used as a direct measure of the voxel's response to the movement (regardless of the specific body part represented in this voxel). The phase value was inspected in regions showing high correlations to the stimulus repetition frequency. Phase values were distributed between −π and π and represented time points within each movement cycle. Since the movement of any given body part was always made at a fixed time point in the movement cycle, the phase value served as a measure of the body part being moved.
This analysis captured the somatotopic gradients in the different brain areas. The resulting bilateral known somatotopic gradients in M1 and the anterior lobes of the cerebellum are shown in Figure 1D, in which the color code is a measure of the phase value (and the body part being moved) and ranges from blue to red to depict the first (1) to last (20) phase responses, respectively (marked by an arrow). In these maps, we present the average phase values of both directions—toes to tongue and tongue to toes. The average direction is shown as toes to tongue (1 to 20), when the first phase response was attributed to toe movement and the last phase response was attributed to the tongue movement (Fig. 2B).
Figure 2.

Spectral analysis reveals somatotopic gradients in the putamen for separate directions and single subjects. A, Anatomical marker and spectral analysis results in the putamen of single subjects in the right hemisphere, using spatially smoothed and unsmoothed (Raw) data. A ventral-to-rostral, toes-to-tongue somatotopic gradient in the putamen is evident at the single-subject level. The results show that this gradient was not the result of spatial smoothing. B, The group results of spectral analysis separately for the toes-to-tongue and the tongue-to-toes directions in the right hemisphere (RFX, corrected for multiple comparisons) illustrate a similar gradient in the putamen (top). The phase values of the tongue-to-toes direction are flipped (left, bottom) and then averaged (right, bottom) with the phase values of the toes-to-tongue direction. The results suggest that the gradients are due to somatotopy and not to an order effect. C, The group results of spectral analysis in the putamen averaged across both directions (RFX, corrected for multiple comparisons) are shown on sagittal slices at the right (top) and left (bottom) hemispheres. A similar ventral-to-rostral, toes-to-tongue somatotopic gradient in the putamen is illustrated (arrow). An anatomical mask for the putamen was applied. D, Same as in C, on an inflated reconstruction of the putamen, globus pallidus, and the head of the caudate in a lateral view. No anatomical mask was applied. No somatotopic gradient and almost no motor activation was seen in the head of the caudate. Ant, Anterior; Pos, posterior; Ven, ventral; Dor, dorsal; H, homunculus; RH, right hemisphere; LH, left hemisphere.
Single-subject results were analyzed both in spatially smoothed (Gaussian kernel of 4 mm FWHM) and in unsmoothed data, to ensure that the somatotopic gradient was not a result of spatial smoothing of the signal. The group results were compiled using random effect analysis.
To focus on each region separately, the gradients were examined in the anatomical location studied. For illustrative purposes in some of the cases, an anatomical mask is applied to the studied area in some of the figures (Figs. 2B,C, 3C, and 5A). Additionally, for visualization purposes alone, all the functional maps except for the ones presenting single-subject raw data (Fig. 2A and 5B, raw data) were interpolated to an anatomical 1 × 1 × 1 mm resolution. This interpolation was done for visualization purposes only, and did not create a gradient that was not present in the original data. Further details regarding spectral analysis are provided by Zeharia et al. (2012).
Figure 3.

Spectral analysis reveals a somatotopic gradient in the globus pallidus. Group, RFX, corrected for multiple comparisons. A, The results of spectral analysis in the basal ganglia are shown on an inflated reconstruction of the putamen, globus pallidus, and the head of the caudate in a medial view. A medial-to-lateral, anterior-to-posterior, dorsal-to-ventral, toes-to-tongue somatotopic gradient in the globus pallidus is shown. No somatotopic gradient and almost no motor activation was seen in the head of the caudate. B, An oblique cut through the putamen and the globus pallidus is illustrated, showing the full extent of the two gradients. No anatomical mask was applied. C, Group results of spectral analysis in the globus pallidus shown in axial slices, revealing the same gradient as in A and B. Anatomical mask to the globus pallidus was applied. D, Average group MVPA results and error bars of classification of leg and trunk (left), hand (middle), and face (right) body parts from the event-related experiment in the putamen, globus pallidus, and the head of the caudate. The mean (white dot) and 95th percentile (black dot) of a random permutation test are marked. The results show that for the two somatotopic gradients, the identity of the moving body part could be predicted, suggesting that somatotopic information is available in these regions. In contrast, the classification was not significant for the head of caudate, in which no somatotopic gradient was found. Additionally, the classification using information from the putamen and the globus pallidus was higher than the classification using information from the caudate. Ant, Anterior; Pos, posterior; Ven, ventral; Dor, dorsal; Med, medial; Lat, lateral; H, homunculus; Pu, putamen; Ca, caudate; NS, non-significant, RH, right hemisphere; LH, left hemisphere. ***p < 0.001, **p < 0.01, *p < 0.05.
Figure 5.
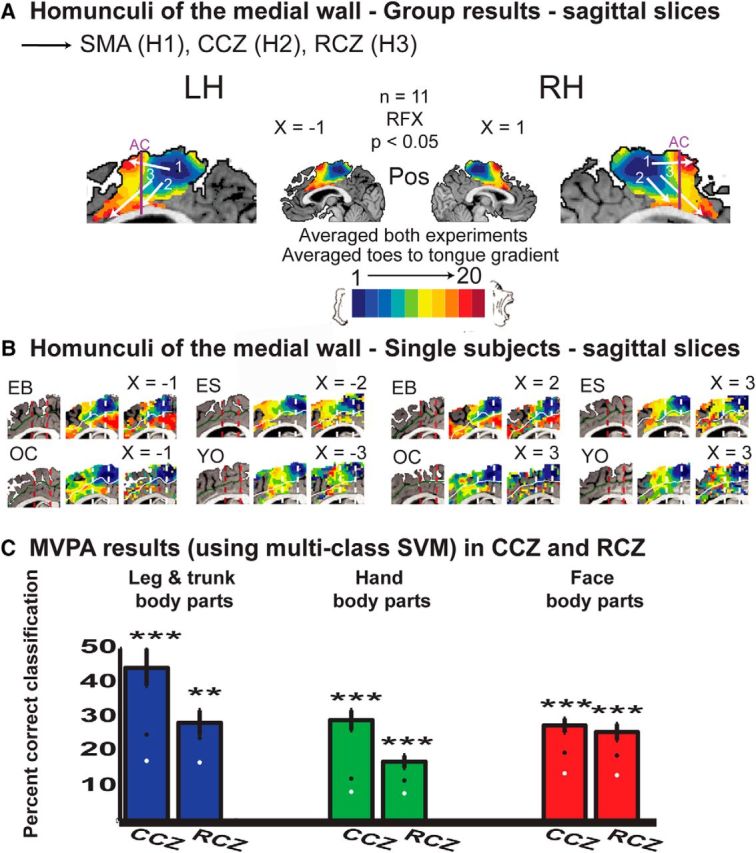
Spectral analysis reveals somatotopic gradients in the medial wall. A, Group, RFX, corrected for multiple comparisons, results of spectral analysis at the medial wall (sagittal slices). The results illustrate a toes-to-tongue somatotopic gradient at the SMA (1, posterior-to-anterior), the CCZ (2, dorsal-to-ventral, slightly posterior-to-anterior), and at the RCZ (3, dorsal-to-ventral, posterior-to-anterior). Anatomical masks for BA 4, 6, 24, and 32 were applied. B, Anatomical markers of the anterior commissure (dark red) and the posterior commissure (red) and spectral analysis results in the medial wall of single subjects in both hemispheres, using spatially smoothed and unsmoothed data. The results show that the gradients in the CCZ and RCZ are not the result of spatial smoothing. C, Average group MVPA results and errorbars of classification of leg and trunk (left), hand (middle), and face (right) body parts from the event-related experiment at the CCZ and RCZ, demonstrating significant classification in these areas. Ant, Anterior; Pos, posterior; H, homunculus; RH, right hemisphere; LH, left hemisphere. ***p < 0.001, **p < 0.01.
Head movements
Contamination of the signals from head movements of the subjects could potentially confound the results. The exclusion criterion was head movements of >1 voxel. However, none of the subjects reached this threshold: the maximum value of actual movement in the periodic experiments was 2.46 mm, and the mean was 0.21 ± 0.28 mm. In the event-related experiment, the maximum value was 2.11 mm and the mean was 0.13 ± 0.15 mm. This was achieved by giving the subjects an intensive training session of ∼1 h before the scanning, and through specific instructions to the subjects not to move their head (or any other body part they were not specifically instructed to move) during the experiment.
Another concern was whether head movements were correlated with the frequency of the experiment. To address this issue, we ran a spectral analysis of the head-movement data of all subjects. The average correlation coefficient value (which was calculated as described above for the entire signal) was 0.247 ± 0.089. This value, while indicating that some correlation did exist between head movements and the experimental frequency, was still significantly lower (p < 0.008) than the lowest threshold we used to determine responsiveness to movements. Given this fact and the low amplitude of the head movements, their contribution to the entire signal can reasonably be considered to be negligible.
Finally, repeating the analysis while regressing out the head-movement signals of each subject yielded highly similar results to the results presented here.
Linear regression analysis
To further assess the axes along which the gradients were found in the homunculi, as well as the directionality of the gradient along each axis, we performed a linear regression analysis (Table 1) using the group phase value as the dependent variable and the x, y, or z Talairach coordinates as the independent variable. The analysis was conducted separately for the putamen, globus pallidus, CCZ, and RCZ. The ROIs in which the analysis was performed were defined anatomically and were restricted by the significant group phase map in the case of the putamen, CCZ, and RCZ.
Table 1.
Linear regression analysis quantifies the existence and directionality of gradients
| Homunculus | Hemisphere | Axis | R values | R squared | p values | Direction of gradient (toes to tongue) |
|---|---|---|---|---|---|---|
| CCZ | Left | x | 0.35 | 0.1225 | 5.84 × 10⁻⁴ | Lateral to medial |
| y | 0.19 | 0.0361 | 0.58 | Not significant | ||
| z | −0.84 | 0.7056 | 9.11 × 10−36 | Dorsal to ventral | ||
| Right | x | −0.26 | 0.0676 | 0.16 | Not significant | |
| y | 0.24 | 0.0576 | 0.26 | Not significant | ||
| z | −0.9 | 0.81 | 6.56 × 10−39 | Dorsal to ventral | ||
| RCZ | Left | x | 0.1 | 0.01 | 5.47 | Not significant |
| y | 0.78 | 0.6084 | 3.24 × 10⁻²⁶ | Posterior to anterior | ||
| z | −0.85 | 0.7225 | 7.88 × 10−37 | Dorsal to ventral | ||
| Right | x | −0.26 | 0.0676 | 0.04 | Not significant | |
| y | 0.79 | 0.6241 | 1.22 × 10⁻²⁸ | Posterior to anterior | ||
| z | −0.75 | 0.5625 | 9.88 × 10⁻²⁴ | Dorsal to ventral | ||
| Putamen | Left | x | 0.1 | 0.01 | 1.62 | Not significant |
| y | 0.05 | 0.0025 | 7.24 | Not significant | ||
| z | −0.66 | 0.4356 | 2.71 × 10−38 | Dorsal to ventral | ||
| Right | x | −0.2 | 0.04 | 0.008 | Not significant | |
| y | 0.2 | 0.04 | 0.005 | Not significant | ||
| z | −0.79 | 0.6241 | 6.7 × 10−70 | Dorsal to ventral | ||
| Globus pallidus | Left | x | −0.72 | 0.5184 | 1.09 × 10⁻¹³ | Medial to lateral |
| y | −0.24 | 0.0576 | 0.62 | Not significant (anterior to posterior) | ||
| z | 0.08 | 0.0064 | 9.96 | Not significant (ventral to dorsal) | ||
| Right | x | 0.84 | 0.7056 | 2.26 × 10⁻²⁰ | Medial to lateral | |
| y | −0.44 | 0.1936 | 0.001 | Anterior to posterior | ||
| z | −0.18 | 0.0324 | 2.58 | Not significant (dorsal to ventral) |
For each axis, the significance of the correlation was assessed. A significant correlation along the x-axis, y-axis, and z-axis indicates a significant gradient along the medial-lateral, posterior-anterior, and dorsal-ventral axes, respectively. The sign of the correlation coefficient indicates the direction of the gradient [e.g., a positive correlation value in the y-axis indicates a posterior (lower y values)-to-anterior (higher y values), toes (lower phase values)-to-tongue (higher phase values) gradient, while a negative correlation value indicates an anterior-to-posterior, toes-to-tongue gradient]. Note that because x-axis values are negative in the left hemisphere and positive in the right hemispheres, the relationships between the sign of the correlation coefficient and the directionality of the gradient are reversed in each hemisphere.
MVPA
We used a multiclass support vector machine (SVM) to classify the data from the event-related experiment in the different ROIs. The classification was carried out in ROIs that were defined functionally as areas with significant group activation (p < 0.05) of either leg, hand, or face body parts from the periodic experiments, constrained by the individual anatomical positions of the relevant region for each subject separately. An additional control ROI was defined at the anatomical position of the head of the caudate for each subject.
The data to be classified were also defined separately for each subject. We used unsmoothed data to preserve the signal's distributed spatial pattern. For each of the trials in the event-related experiment, we obtained a GLM parameter estimator value in each voxel. This yielded 20 × 20 GLM parameter estimator values for each voxel in the ROI, corresponding to the 20 body parts and 20 trials for each body part. We then divided the data into three groups of neighboring body parts; i.e., five leg and trunk body parts (1–5: toes, feet, thighs, buttocks, and stomach), nine hand body parts (6–14: upper arm, elbow, wrist, fist, and all five fingers), and six face body parts (15–20: forehead, nose, eyelids, lips, jaw and tongue; Fig. 1F, top). The data for each trial across the different voxels were then z-scored to avoid classification due to global elevation or reduction of the signal.
We then (Fig. 1F) took one group of body parts and one ROI and used the “leave one out” approach for classification. We used the training data to train a linear SVM classifier with the “svmtrain” command in Matlab. Since there were several body parts in each group, we used a multiclass SVM, running the classification repeatedly between the different pairs of body parts within the one body-part group and then testing the performance of the classifier on the test data. The classification was considered correct only when the classifier chose the correct output in all the classification pairs. The performances of the classifier given a group of body parts in a given ROI were calculated as the mean of the percentages of successful classifications of each body part within this category. The group results were obtained by averaging the classification results of the different subjects (Fig. 1G). Significance levels were assessed by a permutation test on each group of body parts in each ROI for each subject. In this test, we randomly permutated the labels of the different categories and then trained and tested the classifier on these incorrectly labeled data. This procedure was repeated 1500 times, resulting in a distribution of performances of the classifier. The mean of this distribution stood for the chance levels of classification and was ∼1/number of categories (white dot). For each distribution we also calculated the 95th percentile (black dot). Only if the performance of the classifier was above this percentile was the classification considered significant. As can be seen, the anterior lobe of the cerebellum contains somatotopic information enabling the prediction of the moving body part for the face, hand, and leg and trunk body parts.
No correlation was found between the number of voxels in each ROI and the percentage of correct classifications (r = −0.14, 0.005, and 0.13 for face, hand, and leg and trunk body parts, respectively).
Functional connectivity data analysis and MRI acquisition
Thirty-three participants who did not participate in the previous experiments participated in this experiment. A dataset of spontaneous BOLD fluctuations for the investigation of intrinsic (rest state; Biswal et al., 1995) functional connectivity was collected while the subjects lay supine in the scanner without any external stimulation or task (data in-plane matrix size, 64 × 64; FOV, 24 × 24 cm; TR = 3000 ms; flip angle, 90°; TE = 30 ms). To obtain full coverage of the subjects' brains, 29–46 slices of 4 mm thickness were used. The number of whole-brain images in each functional scan varied, and were all cropped to 180 images. The first two images of each scan were excluded from the analysis because of nonsteady-state magnetization. The ventricles and white matter signals were sampled using a grow-region function embedded in the Brain Voyager from a seed in each individual brain. Using Matlab, ventricles and white matter time courses were regressed out of the data and the resulting time course was filtered to a frequency band-width of 0.1–0.01 Hz (in which typical spontaneous BOLD fluctuations occur). The data were not spatially smoothed to avoid “leakage” of information from one hemisphere to the other, especially at the medial regions. In the separate group of subjects who participated in the periodic experiments, seed ROIs were then defined in each region separately and in each hemisphere separately as group peak activations of leg, hand, and face body parts from these experiments. Individual time courses from these seed ROIs were sampled from each of the subjects who participated in the rest scans, z-normalized, and used as individual predictors in whole-brain connectivity analysis and in between-ROI connectivity analyses.
In the whole-brain analysis (Figs. 4 and 6), a partial correlation analysis was calculated in the following manner: for each seed, the time course was used as an individual predictor in a separate group analysis using GLM in a hierarchical random-effects analysis, while regressing out the time courses of the nonsomatotopic ROIs from the same homunculus and hemisphere to discard the shared variance so that only the unique variance attributed to the seed remained. For example, when the functional connectivity from the legs ROI in the left hemisphere of the putamen was examined, the time courses of the hands and face ROIs from the left hemisphere of the putamen were regressed out both from the legs ROI time course and from the time courses of all the other voxels in the brain. This analysis results in a separate group map for each of the ROIs. The minimum significance level of the results was set to p < 0.05, and was corrected for multiple comparisons, using the Monte Carlo simulation approach (Forman et al., 1995) included in the BrainVoyager plug-in. The peak connectivity of each seed across the whole brain (in the case of the putamen, CCZ, and RCZ) and across a 3D reconstruction of the basal ganglia (in the case of the globus pallidus) are shown.
Figure 4.

Functional connectivity analysis reveals interhemispheric somatotopic functional connectivity in the basal ganglia. Group (n = 33), RFX, corrected for multiple comparisons, functional connectivity results. A, Left, Seed ROIs for face, hand, and leg peak activations from the periodic experiments are visible in the putamen in the left hemisphere. The corresponding peak functional connectivity across the entire brain for each of the three ROIs is evident in the putamen in the right hemisphere, forming a somatotopic map. Right, Same as left, but the seeds are in the right hemisphere. B, Same as in A, on an inflated reconstruction of the basal ganglia. C, Left, Seed ROIs for face, hand, and leg peak activations from the periodic experiments are visible in the globus pallidus in the left hemisphere. The corresponding peak functional connectivity in the basal ganglia for each of the three ROIs is evident in the globus pallidus in the right hemisphere, forming a somatotopic map. Right, Same as left, but the seeds are in the right hemisphere RH, Right hemisphere; LH, left hemisphere.
Figure 6.

Whole-brain functional connectivity analysis reveals interhemispheric somatotopic functional connectivity in the medial wall. Group (n = 33), RFX, corrected for multiple comparisons, functional connectivity results. A, Left, Seed ROIs for face (red), hands (green), and leg (blue) peak activations from the periodic experiments are visible in the CCZ in the left hemisphere. The corresponding peak functional connectivity across the entire brain for each of the three ROIs is evident in the CCZ in the right hemisphere, forming a somatotopic map. Right, Same as left, but the seeds are in the right hemisphere. B, Same as in A, in the RCZ.
In the between-ROI connectivity analysis (see Fig. 8), we conducted a partial connectivity analysis between all pairs of ROIs across hemispheres (e.g., one ROI was in the right hemisphere and one ROI was in the left hemisphere). The ROIs were taken from the 11 gradients (the new and the known ones) described in this study. We examined both somatotopic (face–face, hands–hands, or legs–legs) connections and nonsomatotopic (face–hands, hands–legs, and legs–face) connections. The correlations were performed while regressing out the time courses of the nonsomatotopic ROIs in the same homunculus and hemisphere of the seed ROIs. For example, when calculating the partial correlation between the time course of the legs ROI in the left hemisphere in the putamen and the time course of the hands ROI in the right hemisphere in the CCZ, the time courses of the hands and face ROIs in the left hemisphere in the putamen and the time courses of the face and legs ROIs in the right hemisphere in the CCZ were regressed out.
Figure 8.
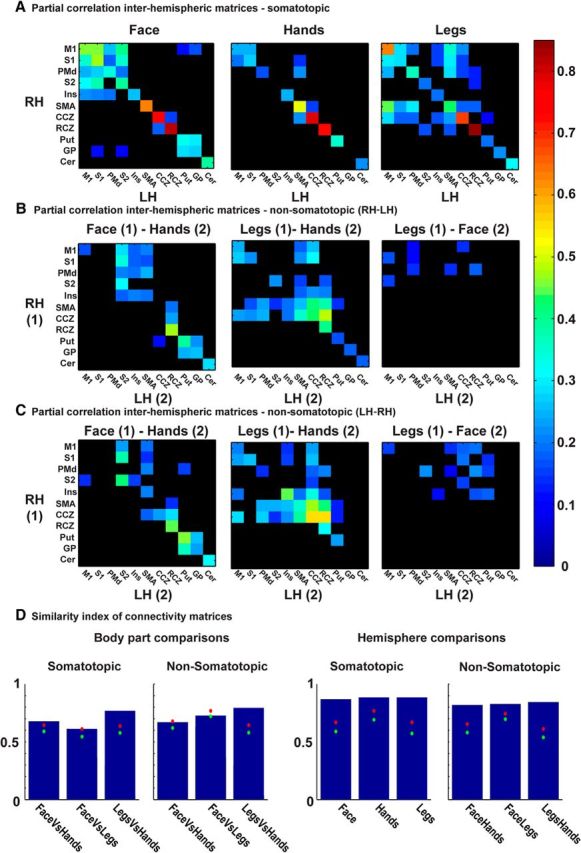
Somatotopic and nonsomatotopic interhemispheric connections in motor homunculi. A, Partial correlation results using time courses derived from seed ROIs in 11 homunculi. The ROIs were defined as peak activation of face (left), hands (middle), and legs (right) in the right (rows) and left (columns) hemispheres. The diagonal indicates interhemispheric somatotopic connections. B, C, Same as in A, but here nonsomatotopic functional connections of face–hands (left), legs–hands (middle), and legs–face (right) in the different homunculi are presented. The diagonal indicates nonsomatotopic connections within the left and right hemisphere in the same homunculi. Interhemispheric nonsomatotopic connections are usually weaker than the interhemispheric somatotopic connections, and face–legs connections are almost absent. D, Similarity index (see Materials and Methods) indicates the similarity of connectivity patterns. 1, Full similarity; green dot, mean of permutation test; red dot, 95th percentile of permutation test. Body-part comparisons, somatotopic: the somatotopic connectivity patterns from A are similar across body parts (e.g., the somatotopic connections of face are similar to the somatotopic connections of hands). Body-part comparisons, nonsomatotopic: the nonsomatotopic connectivity patterns from B and C are similar when comparing legs and hands, but not for face and legs and face and hands. Hemisphere comparisons, somatotopic: the somatotopic connections in the right hemisphere (RH) are similar to the somatotopic connections in the left hemisphere (LH) for each of the three body parts. Hemisphere comparisons, nonsomatotopic: the nonsomatotopic connections are similar across hemispheres (e.g., the connectivity pattern of face LH–legs RH is similar to the connectivity pattern of face RH–legs LH); RH, Right hemisphere; LH, left hemisphere.
Similarity index
A similarity index (see Fig. 8) was used to compare sets of connections (e.g., somatotopic connections of the face were compared with somatotopic connections of hands in all the homunculi, or somatotopic connections of the face from the right hemisphere in all the homunculi were compared with somatotopic connections of the face from the left hemisphere in all the homunculi). For each pair of sets of connections, the percentage of identical significant and nonsignificant connections out of the overall possible connections was calculated (e.g., if a connection between two ROIs was significant for both the face and hands or nonsignificant for both of them, this increases the similarity index; if this same connection was significant for the face but nonsignificant for hands or vice versa, this decreases the similarity index). Overall, a value of 0 represents no similarity between the two sets of connections, and a value of 1 indicates full similarity. Since the number of significant and nonsignificant connections within each set of connections was not identical, the random value of the similarity index was not necessarily 0.5. To address this issue and to evaluate the significance of the results, we conducted a permutation test for 1000 iterations for each pair, in which the significant and nonsignificant connections of each set were permutated and the similarity index was then calculated, resulting in a distribution of similarity indices in which the mean corresponds to the chance levels of similarity given the ratio of significant/nonsignificant connections in each set. The actual similarity index was only considered to be significant if it was above the 95th percentile of this distribution.
Results
Sensory-motor gradients in the human brain were assessed using spectral analysis and linear regression analysis (see Materials and Methods), and by inspecting the results at both the group and the single-subject levels. Complementary MVPA (see Materials and Methods) and functional connectivity analysis were also conducted.
During the periodic experiments (see Materials and Methods), subjects were asked to move 20 body parts separately and consecutively in a fixed order (Fig. 1A). All movements were synchronized in-phase bilateral movements. The continuous cyclic design of these experiments allowed us to analyze the BOLD signal in every voxel using spectral analysis (Fig. 1B--D), which is optimal for detecting topographic maps that contain gradual representations (Engel et al., 1994, 1997; Sereno and Huang, 2006; Hertz and Amedi, 2010; Engel, 2012; Besle et al., 2013; see Materials and Methods).
In addition to the spectral analysis, we also conducted MVPA in each of the gradients found (Fig. 1F,G). Somatotopic information, if present, might allow the prediction of the identity of the moving body part. For this purpose, we conducted another experiment (Fig. 1E), in which the 20 body parts from the periodic experiments were moved in an event-related paradigm (see Materials and Methods). Then, based on the activation patterns in the various homunculi, we attempted to predict the identity of the moving body part from a group of nearby body parts (i.e., face body parts, hands body parts, or legs and trunk body parts; see Materials and Methods).
We first inspected the results of the spectral analysis in the putamen. The mapping at the single-subject level reflected a bilateral dorsal-to-ventral, toes-to-tongue gradient. This gradient was evident both when using spatially smoothed and the raw, unsmoothed data in which no spatial smoothing was applied (see Fig. 2A for the right hemisphere; results for the left hemisphere are comparable). This analysis ruled out the possibility that the gradient was a result of spatial smoothing.
It could be argued that the gradient was not the result of a gradual representation of different body parts, but rather emerged due to order effects. For example, one side of the gradient might contain a representation of the beginning of a movement (at the start of the movement cycle), and the other side a representation of the cessation of movement (at the end of the movement cycle). This eventuality needed to be ruled out since the results shown in Figure 2A were averaged across both directions. However, to further demonstrate the independency of the topography from order effects, we inspected each direction—toes to tongue and tongue to toes—separately. The results of this analysis at the group level are shown in Figure 2B, top, for the right hemisphere (the results for the left hemisphere are comparable). In this figure it is clear that the somatotopic gradient stayed the same regardless of whether the movement cycle started with the toes and ended with the tongue or vice versa. Similar results were obtained for all the other gradients found in this study. In the following maps, we present the average phase values for both directions—toes to tongue and tongue to toes. For this purpose, we first flipped the phase values of the tongue-to-toes direction (Fig. 2B, left, bottom) and then averaged the phase values for both directions (Fig. 2B, right, bottom).
When averaging across subjects and directions of the experiments, the group results of the spectral analysis also revealed a bilateral topographic gradient in the putamen both in slices (Fig. 2C) and in a 3D reconstruction of the basal ganglia comprised of the putamen, globus pallidus, and the head of the caudate (Fig. 2D). As illustrated in the previous stages of analysis, this gradient was a dorsal-to-ventral, toes-to-tongue gradient (marked by an arrow).
The existence and directionality of the gradient was further assessed using linear regression analysis with the phase values as the dependent variable and the Talairach coordinates in each axis separately as the independent variable (Table 1; see Materials and Methods). As expected, the gradient was only significant along the z-axis and not along the x-axis and y-axis. As the sign of the correlation coefficient was negative and the values of the z-axis are organized such that lower z values are more ventral compared with higher z values, the gradient was found to progress along the dorsal-to-ventral, toes-to-tongue direction, as expected.
An additional gradient, which to the best of our knowledge has not been mapped noninvasively before, was seen in the globus pallidus. See Figure 3A for the gradient in a medial view of an inflated reconstruction. An oblique cut through the inflated reconstruction enabled the visibility of the gradients in both the putamen and the globus pallidus (Fig. 3B). Figure 3C further illustrates the globus pallidus gradient in axial slices, with an anatomical mask of the globus pallidus. This somatotopic gradient progressed in the medial-to-lateral, anterior-to-posterior, dorsal-to-ventral directions for the toes-to-tongue representations.
As can be seen in Figure 3C, the organization of the gradient in the globus pallidus might comprise two separate gradients, one in globus pallidus externus and one in the globus pallidus internus, but this could not be verified due to insufficient spatial resolution. The spectral analysis yielded similar results in the globus pallidus when inspecting each direction of movement (toes to tongue and tongue to toes) separately. However, due to its small size, it was hard to observe the somatotopic gradient in the globus pallidus in single subjects, and this analysis, which is crucial for DBS, may also require a higher resolution.
A linear regression analysis (Table 1) revealed a significant medial-to-lateral, toes-to-tongue gradient along the x-axis. The gradient along the y-axis progressed in an anterior-to-posterior, toes-to-tongue direction, which was significant in the right hemisphere but not in the left hemisphere. Along the z-axis, the results did not reach significance in either hemisphere. This is probably due to the fact that lower (toe-related) phase values appear both in dorsal slices of the globus pallidus and in more ventral slices (Fig. 3C). Although higher (face-related) phase values appear only in the more ventral slices, and therefore establish a gradient, this gradient did not reach significance in the linear regression analysis. The lack of significant gradient might also be affected by the lower resolution along this axis. The results in the right hemisphere do show a nonsignificant trend toward the expected dorsal-to-ventral, toes-to-tongue directionality (r = −0.18). The results in the left hemisphere were reversed, but the correlation coefficient was nearly zero (r = 0.08).
Figures 2D and 3A,B also illustrate the dissociation between the sensory-motor, topographically organized areas in the putamen and the globus pallidus and the lack of responsiveness to movement and lack of topographic organization in the caudate, which is thought to process information from the associative cortices (Romanelli et al., 2005; Nambu, 2011; Choi et al., 2012).
To further evaluate this dissociation and to determine whether the gradients found in the putamen and the globus pallidus indeed contained somatotopic information, we conducted a MVPA analysis (Fig. 3D). We defined the ROIs for the purpose of classification as the individual anatomical locations of the putamen and the globus pallidus, masked with areas in which significant group activations for either face, hand, or leg body parts from the periodic experiments occurred. An additional ROI was also defined at the anatomical location of the head of caudate, where the spectral analysis did not reveal any topographic somatotopic organization.
Figure 3D illustrates the group average classification results for the group of face (right), hand (middle), and leg and trunk (left) body parts. The results show that for each of the body-part groups, a significant classification and prediction of the moving body part above the 95th percentile of the random permutation test were possible using data from the putamen and globus pallidus, but not for data derived from the head of caudate. Two-tailed t tests showed that the classification was significantly higher in the putamen (p < 4.5 × 10⁻⁴, p < 0.002, p < 0.025 for face, hand, and leg and trunk body parts respectively) and the globus pallidus (p < 0.047, p < 0.011, p < 0.004) compared with the classification in the head of the caudate. These results show the dissociation between sensory-motor and association areas in the basal ganglia, and suggest that the somatotopic gradients observed by spectral analysis in the basal ganglia indeed contain somatotopic information, thus enabling the prediction of different moving body parts.
As the existence of somatotopic connections is considered in the literature as a landmark for the existence of somatotopy, and also to further investigate the connectivity pattern for these homunculi, we conducted a functional connectivity analysis of rest data, in which a separate group of subjects performed no task (see Materials and Methods). For this purpose, we defined three seed ROIs in the putamen and in the globus pallidus in each hemisphere separately. The seed ROIs were defined as peak group activations of legs, hands, or face body parts derived from the periodic experiments within each region and hemisphere. We then used the time courses from each of these seed ROIs separately as predictors in a group random-effect GLM analysis, while regressing out the time courses of the other seed ROIs from the same region and hemisphere (see Materials and Methods).
Figure 4A, left, illustrates the seeds ROIs from the leg (blue), hand (green), and face (red) areas at the left putamen. Each one of these ROIs served as a seed for the whole-brain connectivity analysis. The peak connectivity map of each one of these ROIs was found to be in the right-hemisphere putamen (and not, for example, in M1, SMA, the thalamus, or the globus pallidus of the same hemisphere). It is evident that the peak connectivity of these three ROIs reproduces the somatotopy from the left hemisphere in the right hemisphere, therefore showing a pattern of interhemispheric somatotopic connections. Figure 4A, right, shows the same trend when the ROIs were selected from the right hemisphere. Figure 4B illustrates the same phenomenon on 3D reconstructions of the basal ganglia. The pattern of interhemispheric somatotopic connectivity is also visible when using seed ROIs from the globus pallidus (Fig. 4C). In this case, the connectivity peak across the whole brain was not found in the corresponding globus pallidus, but the connectivity peak in the 3D reconstruction was located in the globus pallidus of the opposite hemisphere, and was somatotopically organized. The possible functional source of these surprising results is discussed below.
Somatotopic gradients were also evident in the medial wall. In contrast to the vast body of knowledge on homunculi in the lateral wall [e.g., M1, S1, and premotor cortex (PMd)], the information regarding the medial wall is less clear. As shown previously using spectral analysis (Zeharia et al., 2012) and other methods (Arienzo et al., 2006; Cauda et al., 2011), a posterior-to-anterior, toes-to-tongue gradient was found in BA 6, at the location of the SMA (Fig. 5A, 1).
In addition to this gradient, two other somatotopic gradients were also found in the medial wall (Fig. 5A). The first gradient (2) was located largely in BA 24 and possibly corresponds to the CCZ. This gradient was oriented in the dorsal-to-ventral, slightly posterior-to-anterior, toes-to-tongue direction. The second gradient (3) was largely confined to BA 32 and possibly corresponds to the RCZ. This gradient was also oriented in the dorsal-to-ventral, posterior-to-anterior, toes-to-tongue direction. The separation of these gradients was determined using the separate domains of the last, face-related, response in BA 24 and 32, and based on the literature on topographic organization in the medial wall (Picard and Strick, 1996; see Discussion). The posterior-to-anterior directionality in the CCZ and the posterior-to-anterior, dorsal-to-ventral directionality in the RCZ were supported by the linear regression analysis (Table 1).
All the gradients in the medial wall were also found at the single-subject level, in both the spatially smoothed and unsmoothed data (Fig. 5B). In addition, the existence of somatotopic information was assessed using MVPA in the CCZ and the RCZ (Fig. 5C). For the MVPA analysis in the SMA, see Zeharia et al. (2012).
Using the same methods as for the basal ganglia, we tested the functional connectivity from seed ROIs in the CCZ (Fig. 6A) and RCZ (Fig. 6B). Similarly, we found that the peaks of connectivity from the CCZ in the left hemisphere were organized somatotopically at the CCZ in the right hemisphere, and vice versa. A similar pattern was found in the RCZ.
Spectral analysis also revealed somatotopic gradients in the lateral surface. These gradients are known from previous studies, but are illustrated here to strengthen the validity of spectral analysis in mapping motor and sensory-proprioceptive somatotopic gradients, as well as to extend existing knowledge regarding these gradients.
The gradients at Penfield's homunculi S1 (1) and M1 (2) as well as at the PMd (3) are shown on coronal slices (the gradients themselves are somewhat at an angle to the coronal slices; Fig. 7A) and a lateral view of the inflated brain (Fig. 7B). The gradient lines are based on anatomy and Brodmann's areas (M1 in BA 4; S1 in BA 1, 2, and 3; and PMd in BA 6), since the lack of mirror symmetry prevented any other form of separation. The known (Penfield and Boldrey, 1937; Godschalk et al., 1995; Kawashima et al., 1996; Fink et al., 1997; Rijntjes et al., 1999; Schieber, 2001; Raos et al., 2003; Meier et al., 2008) dorsal-to-ventral, medial-to-lateral, toes-to-tongue whole-body organization at the bilateral S1, M1, and PMd is evident; see Penfield's homunculus in Figure 7A for comparison (the spectral analysis results in M1 were demonstrated previously by our group; Zeharia et al., 2012).
Figure 7.

Spectral analysis confirms and extends known somatotopic gradients in the lateral wall. Group, RFX, corrected for multiple comparisons. No anatomical masks were applied. A, Results of spectral analysis in the lateral surface, shown on coronal slices. The Penfield homunculus is illustrated for comparison (Penfield and Boldrey, 1937). B, The same results, illustrated on an inflated surface in a lateral view (no anatomical mask was applied). The results in A and B show the known dorsal-to-ventral, toes-to-tongue gradients at S1 (1), M1 (2), and the dorsal premotor (3) areas, in the left and right hemisphere. No somatotopic gradient was found in the ventral premotor cortex. C, Results of spectral analysis on axial (top) and sagittal (bottom) slices showing the parietal operculum and the posterior insula. D, The same results, depicted on an inflated surface in a lateral-ventral view (no anatomical mask was applied). The results in C and D illustrate the known posterior-to-anterior, medial-to-lateral, toes-to-tongue gradient at the parietal operculum and the posterior-to-anterior, toes-to-tongue gradient at the posterior dorsal insula, in the left and right hemispheres. Ant, Anterior; Pos, posterior; H, homunculus; RH, right hemisphere; LH, left hemisphere.
In line with the literature (Godschalk et al., 1995; Rijntjes et al., 1999), no gradient was found in the ventral premotor cortex. The gradients in the insula (4) and the parietal operculum (5) are illustrated in sagittal and transverse slices, respectively, in Figure 7C, and on a lateral-ventral view of the inflated brain (Fig. 7D). The gradient in the parietal operculum probably corresponds to the secondary somatosensory cortex (S2) homunculus, and was oriented in the posterior-to-anterior, medial-to-lateral, toes-to-tongue direction. The gradient in the posterior dorsal insula was oriented in the posterior-to-anterior, toes-to-tongue direction.
We further checked the connectivity between all the seed ROIs of leg, hand, and face areas for all the 11 homunculi discussed, in the left and right hemisphere (see Materials and Methods). We first examined the somatotopic connections (i.e., only between face ROIs, or only between hand ROIs, or only between leg ROIs), across the two hemispheres. Figure 8A shows the partial correlation connectivity matrices between the right (rows) and left (columns) hemispheres for face (left), hand (middle), and leg (right) seed ROIs. The diagonal of each matrix indicates the interhemispheric somatotopic connections within the same homunculus. As can be seen, such interhemispheric somatotopic connections were found in virtually all body parts and homunculi (e.g., the face ROI in the left putamen is connected to the face ROI in the right putamen). With the exception of the hand ROIs in S2 and the globus pallidus, all other ROIs were found to be somatotopically connected. Other between-homunculi (off-diagonal) connections were also found, especially for the face and leg ROIs.
Figure 8B,C shows nonsomatotopic interhemispheric connections between face and hand ROIs (left), leg and hand ROIs (middle), and leg and face ROIs (right). In each matrix, the first of the pair is located in one hemisphere (Fig. 8B, right; Fig. 8C, left; see the rows of each matrix), and the second of the pair is located in the other hemisphere (Fig. 8B, left; Fig. 8C, right; see the columns of each matrix). Again, the diagonal of each hemisphere illustrates the interhemispheric connections within the same homunculus, but this time these are nonsomatotopic connections. As is evident, both within-homunculi and between-homunculi nonsomatotopic connections were found between face–hand and hand–leg ROIs, although they were considerably weaker than the somatotopic connections. Most of these connections were also found in the four new gradients. In contrast, the face–legs connectivity was weaker and was almost exclusively nondiagonal (between homunculi).
To further support the reliability of the results and to compare different connectivity patterns, we calculated a similarity index (see Materials and Methods) between the different patterns (Fig. 8D).
In Figure 8D, left, we compare the somatotopic and nonsomatotopic connectivity in different body parts. In the left-most graph, it can be seen that the pattern of somatotopic connections of, for instance, the face and hands (which are taken from the left and middle matrices in Fig. 8A, respectively) are similar, and that this similarity is above the significance levels, which were derived from a permutation test (red dot). Therefore, the somatotopic connectivity pattern of face ROIs was similar to the somatotopic connectivity pattern of hand ROIs. The same emerges when comparing the somatotopic connectivity patterns of face and leg ROIs, or leg and hand ROIs.
When comparing nonsomatotopic patterns, the nonsomatotopic connections of hands and legs were similar, but in contrast, the nonsomatotopic connections of face were not significantly similar to either the nonsomatotopic connections of hands or of legs.
In Figure 8D, right, the comparison is between the connectivity patterns in different hemispheres. In the left graph it can be seen, for instance, that the somatotopic connections of face in the right hemisphere were significantly similar to the somatotopic connections of face in the left hemisphere. The same was true for hands and for legs.
The rightmost graph compares for instance the nonsomatotopic connections from face to hand ROIs when the face was in the right hemisphere and the hands were in the left hemisphere (Fig. 8B, left), to when the face was in the left hemisphere and the hands were in the right hemisphere (Fig. 8C, left). These connections, as well as the face–legs and legs–hands connections were found to be similar.
The similarity of the somatotopic and nonsomatotopic connections across body parts and hemispheres therefore strengthens and validates the results of the between-ROI connectivity analysis.
Discussion
In this study we showed that using a cyclic experimental design and phase-locked analysis methods of the BOLD signal enabled efficient noninvasive mapping of new previously unmapped somatosensory-motor homunculi or mappings that were partial or contradictory. This method provides the first noninvasive demonstration of a somatotopic gradient in the globus pallidus that is consistent with a homunculus that has only been identified in humans using invasive methods in patients (Baker et al., 2010). Other gradients in the putamen, CCZ, and RCZ may shed light on unclear and conflicting results in the literature. The results are largely in agreement with homunculi found in animal studies, and were also mostly supported in this study by additional linear regression analyses that enabled their quantification, MVPA, and functional connectivity.
Furthermore, the spectral-analysis method also enabled the mapping of seven other known homunculi. The somatotopic and nonsomatotopic interhemispheric connectivity patterns of all homunculi were examined, and the interhemispheric somatotopic connections as well as the interhemispheric nonsomatotopic hands–legs and hands–face connections were found in almost all the homunculi (van den Heuvel and Hulshoff, 2010; Long et al., 2014).
The importance of reliable whole-body somatosensory-motor mapping cannot be underestimated. Topographical organization has computational advantages (Aflalo and Graziano, 2006; Graziano and Aflalo, 2007) and appears to be a general feature of organization in the brain (Engel et al., 1994; Sereno and Huang, 2006; Orlov et al., 2010; Mancini et al., 2012; Besle et al., 2013; Sánchez-Panchuelo et al., 2014). In addition, as is done in retinotopic mapping, somatotopic gradients can be used to define brain areas and their boundaries. Finally, it is important as a basis for further scientific research in such fields as plasticity and connectivity as well as for medical purposes (e.g., brain–machine interface applications, guiding DBS, etc.; Ruescher et al., 2013).
Our results demonstrate that spectral analysis provides a powerful and sensitive tool for the mapping of whole-body sensory-motor gradients, similar to its efficiency in mapping retinotopic (Engel et al., 1994, 1997), tonotopic (Striem-Amit et al., 2011), and partial sensory-tactile (Sereno and Huang, 2006; Besle et al., 2013) gradients. Furthermore, the periodic experimental design requires a relatively short scanning time compared with other experimental designs and thus allows for rapid mapping of a large number of body parts. These advantages, as well as the sensitivity of the method for detecting gradients at the single-subject level, should make this method the standard for detecting sensory-motor gradients.
The comparison of our results with previous somatotopy data is also revealing. Animal studies have suggested that the dorsal-to-ventral, legs-to-face somatotopic representation can be found in the sensory-motor part of the putamen (Flaherty and Graybiel, 1993; Graziano and Gross, 1993; Bingel et al., 2004; Romanelli et al., 2005; Nambu, 2011). Brain-mapping studies have yielded contradictory results, with some studies suggesting that the somatotopic organization in humans differs from that in primates (Maillard et al., 2000), whereas others have reported a similar organization of a limited number of body parts (Gerardin et al., 2003; Choi et al., 2012). Our results (Figs. 2, 3; Table 1) strengthen the suggestion that the whole-body somatotopic gradient in the putamen in humans is similar to that found in monkeys, and is oriented in the dorsal-to-ventral, toes-to-tongue direction.
The somatotopic gradients in the globus pallidus have been found in animals to be oriented along several axes, with an anterior-to-posterior, medial-to-lateral and dorsal-to-ventral, legs-to-face orientation in both the globus pallidus externus and globus pallidus internus (DeLong et al., 1985; Romanelli et al., 2005; Nambu, 2011). The results from invasive studies in patients vary substantially (Yelnik et al., 2000; Chang et al., 2007; Baker et al., 2010). Our results (Fig. 3) show a somatotopic organization with similar orientations along the three axes, which were partially supported using linear regression (Table 1), on data collected here noninvasively in healthy subjects.
Somatotopic gradients were also found in this study in the medial wall (Figs. 5, 6; Table 1). Studies in monkeys suggest that several motor areas can be found in the medial wall, including the SMA, pre-SMA, the dorsal cingulate motor area (CMAd), the ventral cingulate motor area (CMAv), and the rostral cingulate motor area (CMAr). The somatotopic organization in the motor areas in the cingulate sulcus is much less clear than that in the SMA. Woosley and colleagues (1952) suggested that a partial somatotopic map is located in the caudal portion of the cingulate sulcus and is organized in a dorsal-to-ventral, hindlimb-to-forelimb orientation, whereas the hindlimb representation of this homunculus is located just below the hindlimb representation in the SMA. Another study suggested that somatotopic organization is more clear-cut in the CMAd and CMAv than in the CMAr (Luppino et al., 1991) and is organized in a dorsal-to-ventral, anterior-to-posterior, hindlimb-to-forelimb orientation. However, other studies have reported somatotopy in the CMAr as well; for instance Wu et al. (2000) found a posterior-to-anterior, hindlimb-to-forelimb representation in the CMAr.
Our results provide evidence for two gradients, which are located in BA 24 (mostly a dorsal-to-ventral, slightly posterior-to-anterior, toes-to-tongue orientation) and in BA 32 (a dorsal-to-ventral, posterior-to-anterior, toes-to-tongue orientation). These two gradients probably correspond to the CCZ and RCZ, respectively. The mostly dorsal-to-ventral orientation of the gradient in the CCZ corresponds to the homunculus found by Woosley et al. (1952) and by Luppino and colleagues (1991). The gradient found in the RCZ suggests the existence of a somatotopic organization in the RCZ in humans that may follow the same orientation as was found previously in animals (Wu et al., 2000).
Given that the results from human studies in these areas have yielded contradictory and incomplete results (Grafton et al., 1993; Paus et al., 1993; Picard and Strick, 1996; Fink et al., 1997; Arienzo et al., 2006), we suggest that the sensitivity of phase-locked analysis enables somatotopic mapping in CCZ and RCZ.
The results of spectral analysis were also supported by MVPA (Figs. 3, 5) of data derived from a separate event-related experiment. This additional MVPA revealed that somatotopic information enabling the prediction of the moving body part could be found for all the somatotopic gradients. Furthermore, this analysis supported the dissociation between the sensory-motor and association areas in the basal ganglia (Nambu et al., 2002), which was also found using spectral analysis.
Somatotopically organized projections are often brought as evidence for the existence of somatotopy in certain brain areas (Cauda et al., 2011; Nambu, 2011). We also showed that the somatotopy in each of the gradients could be reproduced when inspecting the pattern of interhemispheric connectivity (Figs. 4, 6, 8A). This conclusion extends previous work showing similar somatotopic interhemispheric functional connectivity in M1 in humans (van den Heuvel and Hulshoff, 2010; Long et al., 2014).
It is important to note that the interhemispheric somatotopically organized correlations within a certain gradient do not necessarily arise from direct interhemispheric somatotopic projections, but rather indicate that they share functional connectivity. While in the case of CCZ and RCZ direct projections through the corpus callosum are a plausible explanation of the results, in the case of the basal ganglia, it is more likely that the functional connectivity is a result of a common somatotopic input to both hemispheres, via for instance corticostriatal or nigrostriatal projections (Lieu and Subramanian, 2012). However, the results in the medial wall should be considered with caution, since the proximity of these regions across both hemispheres might result in signal bleeding, despite the fact that the data were not spatially smoothed. Higher-resolution experiments might be needed to resolve this ambiguity.
Some of the results presented here could be usefully extended by studies that target specific homunculi, which will enable higher spatial resolution (Besle et al., 2013; van der Zwaag et al., 2013). In this study we chose to inspect the entire brain, and therefore the resolution was insufficient for differentiating the globus pallidus externus from the globus pallidus internus, or the sensory-motor and the associative areas within the putamen and the globus pallidus (DeLong et al., 1985; Nambu et al., 2002; Romanelli et al., 2005).
To summarize, using a periodic experimental design and spectral analysis, as well as other converging experimental design and analyses, new sensory-motor gradients were found in cortical and subcortical structures, and conflicting results in the literature were resolved. This analysis therefore paves the way for further scientific research as well as medical applications.
Footnotes
This work was supported by the I-CORE Program of the Planning and Budgeting Committee, the Israel Science Foundation [Grant #51/11 (to T.F.) and Grant #1684/08], the Moross Laboratory (to T.F.), The European Research Council (Grant #310809), the Charitable Gatsby Foundation, the James S. McDonnell Foundation (Scholar Award #220020284; to A.A.), the Edmond and Lily Safra Center for Brain Sciences, and the European Commission (Grants FP7-ICT-2009-C-Tango and FP7-ICT-2009-C-Vere; to T.F.). T.F. is the incumbent of the Dr. Hymie Moross Professorial chair. We also thank the Maratier family for its generosity and support to this research. We thank Dr. Edna Furman-Haran, Mr. Nachum Stern, and Mrs. Fanny Attar for assistance with the experiments.
The authors declare no competing financial interests.
References
- Aflalo TN, Graziano MS. Possible origins of the complex topographic organization of motor cortex: reduction of a multidimensional space onto a two-dimensional array. J Neurosci. 2006;26:6288–6297. doi: 10.1523/JNEUROSCI.0768-06.2006. [DOI] [PMC free article] [PubMed] [Google Scholar]
- Arienzo D, Babiloni C, Ferretti A, Caulo M, Del Gratta C, Tartaro A, Rossini PM, Romani GL. Somatotopy of anterior cingulate cortex (ACC) and supplementary motor area (SMA) for electric stimulation of the median and tibial nerves: an fMRI study. Neuroimage. 2006;33:700–705. doi: 10.1016/j.neuroimage.2006.06.030. [DOI] [PubMed] [Google Scholar]
- Baker KB, Lee JY, Mavinkurve G, Russo GS, Walter B, DeLong MR, Bakay RA, Vitek JL. Somatotopic organization in the internal segment of the globus pallidus in Parkinson's disease. Exp Neurol. 2010;222:219–225. doi: 10.1016/j.expneurol.2009.12.030. [DOI] [PMC free article] [PubMed] [Google Scholar]
- Besle J, Sánchez-Panchuelo RM, Bowtell R, Francis S, Schluppeck D. Single-subject fMRI mapping at 7 T of the representation of fingertips in S1: a comparison of event-related and phase-encoding designs. J Neurophysiol. 2013;109:2293–2305. doi: 10.1152/jn.00499.2012. [DOI] [PMC free article] [PubMed] [Google Scholar]
- Bingel U, Gläscher J, Weiller C, Büchel C. Somatotopic representation of nociceptive information in the putamen: an event-related fMRI study. Cereb Cortex. 2004;14:1340–1345. doi: 10.1093/cercor/bhh094. [DOI] [PubMed] [Google Scholar]
- Biswal B, Yetkin FZ, Haughton VM, Hyde JS. Functional connectivity in the motor cortex of resting human brain using echo-planar MRI. Magn Reson Med. 1995;34:537–541. doi: 10.1002/mrm.1910340409. [DOI] [PubMed] [Google Scholar]
- Cauda F, Giuliano G, Federico D, Sergio D, Katiuscia S. Discovering the somatotopic organization of the motor areas of the medial wall using low-frequency bold fluctuations. Hum Brain Mapp. 2011;32:1566–1579. doi: 10.1002/hbm.21132. [DOI] [PMC free article] [PubMed] [Google Scholar]
- Chang EF, Turner RS, Ostrem JL, Davis VR, Starr PA. Neuronal responses to passive movement in the globus pallidus internus in primary dystonia. J Neurophysiol. 2007;98:3696–3707. doi: 10.1152/jn.00594.2007. [DOI] [PubMed] [Google Scholar]
- Choi EY, Yeo BT, Buckner RL. The organization of the human striatum estimated by intrinsic functional connectivity. J Neurophysiol. 2012;108:2242–2263. doi: 10.1152/jn.00270.2012. [DOI] [PMC free article] [PubMed] [Google Scholar]
- DeLong MR, Crutcher MD, Georgopoulos AP. Primate globus pallidus and subthalamic nucleus: functional organization. J Neurophysiol. 1985;53:530–543. doi: 10.1152/jn.1985.53.2.530. [DOI] [PubMed] [Google Scholar]
- Engel SA. The development and use of phase-encoded functional MRI designs. Neuroimage. 2012;62:1195–1200. doi: 10.1016/j.neuroimage.2011.09.059. [DOI] [PubMed] [Google Scholar]
- Engel SA, Rumelhart DE, Wandell BA, Lee AT. fMRI of human visual cortex. Nature. 1994;369:525. doi: 10.1038/369525a0. [DOI] [PubMed] [Google Scholar]
- Engel SA, Glover GH, Wandell BA. Retinotopic organization in human visual cortex and the spatial precision of functional MRI. Cereb Cortex. 1997;7:181–192. doi: 10.1093/cercor/7.2.181. [DOI] [PubMed] [Google Scholar]
- Fink GR, Frackowiak RS, Pietrzyk U, Passingham RE. Multiple nonprimary motor areas in the human cortex. J Neurophysiol. 1997;77:2164–2174. doi: 10.1152/jn.1997.77.4.2164. [DOI] [PubMed] [Google Scholar]
- Flaherty AW, Graybiel AM. Two input systems for body representations in the primate striatal matrix: experimental evidence in the squirrel monkey. J Neurosci. 1993;13:1120–1137. doi: 10.1523/JNEUROSCI.13-03-01120.1993. [DOI] [PMC free article] [PubMed] [Google Scholar]
- Forman SD, Cohen JD, Fitzgerald M, Eddy WF, Mintun MA, Noll DC. Improved assessment of significant activation in functional magnetic resonance imaging (fMRI): use of a cluster-size threshold. Magn Res Med. 1995;33:636–647. doi: 10.1002/mrm.1910330508. [DOI] [PubMed] [Google Scholar]
- Gerardin E, Lehéricy S, Pochon JB, Tézenas du Montcel S, Mangin JF, Poupon F, Agid Y, Le Bihan D, Marsault C. Foot, hand, face and eye representation in the human striatum. Cereb Cortex. 2003;13:162–169. doi: 10.1093/cercor/13.2.162. [DOI] [PubMed] [Google Scholar]
- Godschalk M, Mitz AR, van Duin B, van der Burg H. Somatotopy of monkey premotor cortex examined with microstimulation. Neurosci Res. 1995;23:269–279. doi: 10.1016/0168-0102(95)00950-7. [DOI] [PubMed] [Google Scholar]
- Grafton ST, Woods RP, Mazziotta JC. Within-arm somatotopy in human motor areas determined by positron emission tomography imaging of cerebral blood flow. Exp Brain Res. 1993;95:172–176. doi: 10.1007/BF00229666. [DOI] [PubMed] [Google Scholar]
- Graziano MS, Aflalo TN. Mapping behavioral repertoire onto the cortex. Neuron. 2007;56:239–251. doi: 10.1016/j.neuron.2007.09.013. [DOI] [PubMed] [Google Scholar]
- Graziano MS, Gross CG. A bimodal map of space: somatosensory receptive fields in the macaque putamen with corresponding visual receptive fields. Exp Brain Res. 1993;97:96–109. doi: 10.1007/BF00228820. [DOI] [PubMed] [Google Scholar]
- Hertz U, Amedi A. Disentangling unisensory and multisensory components in audiovisual integration using a novel multifrequency fMRI spectral analysis. Neuroimage. 2010;52:617–632. doi: 10.1016/j.neuroimage.2010.04.186. [DOI] [PubMed] [Google Scholar]
- Kawashima R, Itoh H, Ono S, Satoh K, Furumoto S, Gotoh R, Koyama M, Yoshioka S, Takahashi T, Takahashi K, Yanagisawa T, Fukuda H. Changes in regional cerebral blood flow during self-paced arm and finger movements. A PET study. Brain Res. 1996;716:141–148. doi: 10.1016/0006-8993(96)00032-7. [DOI] [PubMed] [Google Scholar]
- Lieu CA, Subramanian T. The interhemispheric connections of the striatum: implications for Parkinson's disease and drug-induced dyskinesias. Brain Res Bull. 2012;87:1–9. doi: 10.1016/j.brainresbull.2011.09.013. [DOI] [PMC free article] [PubMed] [Google Scholar]
- Long X, Goltz D, Margulies DS, Nierhaus T, Villringer A. Functional connectivity-based parcellation of the human sensorimotor cortex. Eur J Neurosci. 2014;39:1332–1342. doi: 10.1111/ejn.12473. [DOI] [PubMed] [Google Scholar]
- Luppino G, Matelli M, Camarda RM, Gallese V, Rizzolatti G. Multiple representations of body movements in mesial area 6 and the adjacent cingulate cortex: an intracortical microstimulation study in the macaque monkey. J Comp Neurol. 1991;311:463–482. doi: 10.1002/cne.903110403. [DOI] [PubMed] [Google Scholar]
- Maillard L, Ishii K, Bushara K, Waldvogel D, Schulman AE, Hallett M. Mapping the basal ganglia fMRI evidence for somatotopic representation of face, hand, and foot. Neurology. 2000;55:377–383. doi: 10.1212/WNL.55.3.377. [DOI] [PubMed] [Google Scholar]
- Mancini F, Haggard P, Iannetti GD, Longo MR, Sereno MI. Fine-grained nociceptive maps in primary somatosensory cortex. J Neurosci. 2012;32:17155–17162. doi: 10.1523/JNEUROSCI.3059-12.2012. [DOI] [PMC free article] [PubMed] [Google Scholar]
- Meier JD, Aflalo TN, Kastner S, Graziano MS. Complex organization of human primary motor cortex: a high-resolution fMRI study. J Neurophysiol. 2008;100:1800–1812. doi: 10.1152/jn.90531.2008. [DOI] [PMC free article] [PubMed] [Google Scholar]
- Mitz AR, Wise SP. The somatotopic organization of the supplementary motor area: intracortical microstimulation mapping. J Neurosci. 1987;7:1010–1021. doi: 10.1523/JNEUROSCI.07-04-01010.1987. [DOI] [PMC free article] [PubMed] [Google Scholar]
- Nambu A. Somatotopic organization of the primate basal ganglia. Front Neuroanat. 2011;5:26. doi: 10.3389/fnana.2011.00026. [DOI] [PMC free article] [PubMed] [Google Scholar]
- Nambu A, Kaneda K, Tokuno H, Takada M. Organization of corticostriatal motor inputs in monkey putamen. J Neurophysiol. 2002;88:1830–1842. doi: 10.1152/jn.2002.88.4.1830. [DOI] [PubMed] [Google Scholar]
- Orlov T, Makin TR, Zohary E. Topographic representation of the human body in the occipitotemporal cortex. Neuron. 2010;68:586–600. doi: 10.1016/j.neuron.2010.09.032. [DOI] [PubMed] [Google Scholar]
- Paus T, Petrides M, Evans AC, Meyer E. Role of the human anterior cingulate cortex in the control of oculomotor, manual, and speech responses: a positron emission tomography study. J Neurophysiol. 1993;70:453–469. doi: 10.1152/jn.1993.70.2.453. [DOI] [PubMed] [Google Scholar]
- Penfield W, Boldrey E. Somatic motor and sensory representation in the cerebral cortex of man as studied by electrical stimulation. Paper presented at the American Neurological Association meeting; June; Atlantic City, NJ. 1937. [Google Scholar]
- Picard N, Strick PL. Motor areas of the medial wall: a review of their location and functional activation. Cereb Cortex. 1996;6:342–353. doi: 10.1093/cercor/6.3.342. [DOI] [PubMed] [Google Scholar]
- Raos V, Franchi G, Gallese V, Fogassi L. Somatotopic organization of the lateral part of area F2 (dorsal premotor cortex) of the macaque monkey. J Neurophysiol. 2003;89:1503–1518. doi: 10.1152/jn.00661.2002. [DOI] [PubMed] [Google Scholar]
- Rijntjes M, Dettmers C, Büchel C, Kiebel S, Frackowiak RS, Weiller C. A blueprint for movement: functional and anatomical representations in the human motor system. J Neurosci. 1999;19:8043–8048. doi: 10.1523/JNEUROSCI.19-18-08043.1999. [DOI] [PMC free article] [PubMed] [Google Scholar]
- Romanelli P, Esposito V, Schaal DW, Heit G. Somatotopy in the basal ganglia: experimental and clinical evidence for segregated sensorimotor channels. Brain Res Rev. 2005;48:112–128. doi: 10.1016/j.brainresrev.2004.09.008. [DOI] [PubMed] [Google Scholar]
- Ruescher J, Iljina O, Altenmüller DM, Aertsen A, Schulze-Bonhage A, Ball T. Somatotopic mapping of natural upper- and lower-extremity movements and speech production with high gamma electrocorticography. Neuroimage. 2013;81:164–177. doi: 10.1016/j.neuroimage.2013.04.102. [DOI] [PubMed] [Google Scholar]
- Sánchez-Panchuelo RM, Besle J, Mougin O, Gowland P, Bowtell R, Schluppeck D, Francis S. Regional structural differences across functionally parcellated Brodmann areas of human primary somatosensory cortex. Neuroimage. 2014;93:221–230. doi: 10.1016/j.neuroimage.2013.03.044. [DOI] [PubMed] [Google Scholar]
- Schieber MH. Constraints on somatotopic organization in the primary motor cortex. J Neurophysiol. 2001;86:2125–2143. doi: 10.1152/jn.2001.86.5.2125. [DOI] [PubMed] [Google Scholar]
- Sereno MI, Huang RS. A human parietal face area contains aligned head-centered visual and tactile maps. Nat Neurosci. 2006;9:1337–1343. doi: 10.1038/nn1777. [DOI] [PubMed] [Google Scholar]
- Striem-Amit E, Hertz U, Amedi A. Extensive cochleotopic mapping of human auditory cortical fields obtained with phase-encoding FMRI. PloS One. 2011;6:e17832. doi: 10.1371/journal.pone.0017832. [DOI] [PMC free article] [PubMed] [Google Scholar]
- Talairach J, Tournoux P. New York: Thieme Medical Publishers; 1988. Co-planar stereotaxic atlas of the human brain. 3-Dimensional proportional system: an approach to cerebral imaging. [Google Scholar]
- van den Heuvel MP, Hulshoff Pol HE. Specific somatotopic organization of functional connections of the primary motor network during resting state. Hum Brain Mapp. 2010;31:631–644. doi: 10.1002/hbm.20893. [DOI] [PMC free article] [PubMed] [Google Scholar]
- van der Zwaag W, Kusters R, Magill A, Gruetter R, Martuzzi R, Blanke O, Marques JP. Digit somatotopy in the human cerebellum: A 7T fMRI study. Neuroimage. 2013;67:354–362. doi: 10.1016/j.neuroimage.2012.11.041. [DOI] [PubMed] [Google Scholar]
- Woolsey CN, Settlage PH, Meyer DR, Sencer W, Pinto Hamuy T, Travis AM. Patterns of localization in precentral and“ supplementary” motor areas and their relation to the concept of a premotor area. Research publications-Association for Research in Nervous and Mental Disease. 1952;30:238–264. [PubMed] [Google Scholar]
- Wu CW, Bichot NP, Kaas JH. Converging evidence from microstimulation, architecture, and connections for multiple motor areas in the frontal and cingulate cortex of prosimian primates. J Comp Neurol. 2000;423:140–177. doi: 10.1002/1096-9861(20000717)423:1<140::AID-CNE12>3.0.CO;2-3. [DOI] [PubMed] [Google Scholar]
- Yelnik J, Damier P, Bejjani BP, Francois C, Gervais D, Dormont D, Arnulf I, M Bonnet A, Cornu P, Pidoux B, Agid Y. Functional mapping of the human globus pallidus: contrasting effect of stimulation in the internal and external pallidum in Parkinson's disease. Neuroscience. 2000;101:77–87. doi: 10.1016/S0306-4522(00)00364-X. [DOI] [PubMed] [Google Scholar]
- Zeharia N, Hertz U, Flash T, Amedi A. Negative blood oxygenation level-dependent homunculus and somatotopic information in primary motor cortex and supplementary motor area. Proc Natl Acad Sci U S A. 2012;109:18565–18570. doi: 10.1073/pnas.1119125109. [DOI] [PMC free article] [PubMed] [Google Scholar]