Abstract
Background/aims: Circulating cell-free DNA (cfDNA) contains tumor-specific alterations and could potentially serve as “liquid biopsy”. The study was to identify a novel panel of hepatocellular carcinoma (HCC)-specific mutations in plasma cfDNA and to assess its value in the diagnosis of HCC.
Materials and methods: 33 HCC tissue, 37 blood, and 37 swab specimens were collected from HCC patients and control individuals. Genomic DNA was subjected to next-generation sequencing. The selected mutations in the plasma cfDNA in the HCC versus control groups were compared, and the diagnostic performance of cfDNA mutations was evaluated.
Results: A majority of selected mutations in the HCC tissue DNA, ranging from 52% to 84%, was detected in the matched plasma cfDNA. For the selected mutations, receiver operating characteristic (ROC) analysis revealed an area under the ROC curve (AUC) of 0.92, sensitivity of 65%, and specificity of 100% for the diagnosis of HCC regardless of alpha-fetoprotein (AFP) status. Detection of the selected mutations in cfDNA in combination with AFP exhibited better diagnosis performance, with AUC of 0.96, sensitivity of 73%, and specificity of 100% for AFP-negative patients, whereas the AUC was 0.86 with sensitivity of 53% and specificity of 100% for AFP-positive patients. Furthermore, the rates of the selected mutations were significantly greater in recurrent HCC than in non-recurrent HCC (P<0.05).
Conclusions: This study has identified a novel panel of somatic mutations, and detection of the mutations in plasma cfDNA shows good diagnostic performance. Therefore, this approach holds promise as a novel tool for diagnosing HCC.
Keywords: cell-free DNA, hepatocellular carcinoma, next-generation sequencing, alpha-fetoprotein, somatic mutation
Introduction
Hepatocellular carcinoma (HCC) is the most common primary liver cancer and also the leading cause of cancer-related deaths worldwide.1,2 The mortality of HCC remains high, mainly because a majority of HCC patients are diagnosed after their cancer has reached an advanced stage. The diagnostic methods for HCC include imaging such as magnetic resonance imaging (MRI), a liver biopsy for histological examination to reach a definitive diagnosis, and measurement of non-invasive serum biomarkers [eg, alpha-fetoprotein (AFP), α L-fucosidase, γ-glutamyltranspeptidase isoenzymes II, and acidic isoferritin].3 However, a number of limitations were identified in relation to these biomarkers, in particular, for AFP in the diagnosis and prediction of recurrence and prognosis of HCC. For instance, the false-negative rate for AFP remains high at approximately 30%.4 In addition, for both asymptomatic individuals and patients with symptoms of liver disease, imaging methods usually fail to rapidly assess the changes. The limited availability of liver tissue has created another need for a non-invasive access route to the hepatic tissue for diagnosis, treatment response monitoring, prognosis, etc. Thus, a better non-invasive approach is urgently needed.
Cell-free DNA (cfDNA) in the blood, which was first described several decades ago,5 represents extracellular residing DNA molecules that are likely released from apoptotic or necrotic cells or tissues.6 Extensive studies have demonstrated that cfDNAs in cancer patients harbor tumor-specific genetic alterations and thus could potentially serve as a minimally invasive “liquid biopsy” in the diagnosis of HCC and monitoring of treatment response in real time.7–15 Furthermore, recently developed next-generation sequencing (NGS) of cfDNA allows for sequencing of cancer-specific genes, and broad detection of their genetic variations or mutations16–18 has facilitated research exploring cfDNAs as biomarkers. Over the past decade, high-throughput DNA sequencing technology has empowered us to better understand the cancer genetics, resulting in the revolutionary discovery of mutational signatures for human cancers, including somatic mutations. In fact, the link between somatic mutation and human cancer has been established. It has also been widely accepted that, during the transformation of normal cells into cancer, cells have acquired the hallmarks of cancer through somatic mutation.19
In this study, we aimed to identify a novel panel of HCC-specific somatic mutations in plasma cfDNA and to assess its value in the diagnosis of HCC via a simple blood test.
Materials and methods
Study subjects
Patients who were diagnosed with primary HCC and underwent surgical procedures for treatment between July 2015 and February 2016 at the Zhongshan hospital Xiamen University were enrolled in this study. The diagnosis and confirmation of primary HCC were made on the basis of pathohistological evaluations following the guidelines on the diagnosis and treatment of primary liver cancer.20 We excluded individuals who had received a recent blood transfusion within 3 months, primarily due to a possible effect of the blood sampling on plasma cfDNAs. A total of 33 HCC tissue specimens, 37 peripheral blood samples, and 37 swab samples were collected from the primary HCC patients. The tissue samples were stored in a liquid nitrogen container, while 10 mL blood samples were collected in cell-free DNA blood collection tubes (STRECK, USA) and processed for plasma separation. The demographic, biochemical, and clinical characteristics of the study population are summarized in Table S1.
The study protocol was reviewed and approved by the Ethics Committee of the Zhongshan Hospital of Xiamen University. The research studies involving human subjects have been carried out in accordance with the World Medical Association Declaration of Helsinki. A written informed consent was obtained from each participant prior to enrollment in this study.
Isolation and quantification of genomic DNA from plasma and liver cancer specimens
Tissue genomic DNA was isolated from the resected HCC specimens using the DNeasy Tissue Kit (Qiagen), whereas cell-free genomic DNA was extracted from the plasma samples using the DNeasy Blood Kit (Qiagen) according to the manufacturer’s manuals. All DNA samples were purified following the manufacturer’s instructions and stored in a −80°C freezer until subsequent use. The concentration of the prepared genomic DNA was quantified using the Qubit dsDNA Assay (Invitrogen, Waltham, MA, USA).
Selection of a panel of HCC-specific mutations
To select a panel of HCC-specific mutations for further analysis of plasma cfDNA, the following modified approach was used as described previously.21 Recurrence Index (RI) refers to the number of HCC patients with somatic variant calls (SNVs) that occur within a given kilobase of exonic sequence (ie, the number of patients with mutations/exon length in kb).21 RI thus can be used to measure patient-level recurrence frequency at the exon level, while simultaneously normalizing for gene or exon size. As a source of somatic mutation data uniformly genotyped across a large cohort of patients, in phases 2–4, we analyzed non-silent SNVs identified in TCGA whole exome sequencing data from 178 patients in the HCC dataset (TCGA query dated March 20, 2015).
Phase 1 (Known drivers)
Initial seed genes were chosen based on their frequency of mutation in HCCs. Analysis of COSMIC (V72) identified known driver genes that are recurrently mutated in ≥5% of HCC (denominator ≥100 cases).22 The seed list also included genes with mutations that occurred at low frequency but had strong evidence for being driver mutations in HCC and other cancers.
Phase 2 (Max. coverage)
For each exon with an RI ≥20 and with SNVs covering ≥3 patients in HCC, we identified the exon that would result in the largest reduction in patients with only 1 SNV. To break ties among equally best exons, the exon with highest RI was chosen. This was repeated until no additional exons satisfied these criteria.
Phase 3
Same procedure as phase 3, but using RI≥5.
Phase 4
For each remaining exon with SNVs covering ≥2 patients in HCC, we identified the exon that would result in the largest reduction in patients with only 1 SNV. To break ties among equally best exons, the exon with highest RI was chosen. This was repeated until no additional exons satisfied these criteria.
Phase 5 (Predicted drivers)
COSMIC liver cancer data excepted for Phase I.
Phase 6 (Add fusions)
For recurrent rearrangements in HCC and other cancers involving ALK, ROS1, RET, PDGFR, FGFR1, BRAF, PRKACA and LBP2, the introns most frequently implicated in the fusion event and the flanking exons were included.
These genomic regions that were obtained through the above processes were taken together and a total of 360 genes and 6,859 genomic regions covering 1.45 Mb in length were selected as a panel of HCC-specific mutations for further analysis of plasma cfDNA (Table S2).
Next-generation sequencing
Indexed Illumina NGS libraries were generated with the genomic DNA samples prepared from the resected HCC tissue and plasma samples. For the plasma cfDNA, 7–32 ng of DNA were used for construction of the NGS libraries without further fragmentation, while for the HCC tissue or germline genomic DNA samples, 200 ng of DNA were subject to shearing prior to construction of NGS libraries on a Bioruptor plus UCD-300 with the recommended settings of fragments 200 bp in length. The construction of the NGS DNA libraries was performed using the NEXTflex® Cell Free DNA-Seq Kit (BIOO,USA) with all reagents to be used for the end-repair of the circulating cfDNA fragments, adapter ligation, A-tailing, and amplification of ligated fragments from the High-Fidelity PCR Master Mix. The NGS RNA libraries were prepared using the NEXTflex® Rapid Directional RNA-Seq Library Prep Kit (BIOO) following the manufacturer’s instructions.
Hybrid selection was conducted using a custom SureSelect from Agilent (Santa Clara, CA, USA) with the NGS libraries designed using the SureDesign Custom Design Tool. After the hybrid selection was completed, the captured DNA fragments were subsequently amplified with 18 cycles of PCR using 1× KAPA HiFi Hot Start Ready Mix. The multiplexed libraries described above were sequenced on an Illumina HiSeq X10 using 150-bp paired-end runs in accordance with the manufacturer’s instructions.
Paired-end reads were mapped to the hg19 reference genome with BWA 0.7.17 as described previously23 (default parameters), as well as sorted and indexed using SAMtools according to methods reported by Li and colleagues.23,24 Quality control (QC) was evaluated using a custom Perl script to collect a variety of statistics, including characteristics of mapping, read quality, and selector on-target rate (ie, the number of unique reads that intersected the selector space divided by all aligned reads), generated, respectively, by SAMtools flagstat, FastQC, and BEDTools coverage Bed. Plots of fragment length distribution, sequence depth and coverage were automatically produced for a visual assessment of QC. In addition, we restricted analyses not involving fusions to properly paired reads to mitigate the impact of sequencing errors, and therefore, the bases that had Phred quality scores ≥30 (≤0.1% probability of a sequencing error) were further analyzed.
Bioinformatics and statistical analyses
We assessed the base-level background distribution of the selected regions using all 43 plasma DNA samples collected from HCC and healthy individuals analyzed in this work. For each background base in selector positions having ≥500x overall sequencing depth, the outlier-corrected mean across all circulating DNA samples was calculated. To restrict our analysis to background bases, each patient sample was pre-filtered to remove germline, str contraction, panel of normals, and/or SNVsmade by MuTect2.
For detection of somatic SNV and insertion/deletion events, we employed MuTect2. Variant annotation was performed by ANNOVAR. SNVs or indel was pre-filtered to alt_allele_in_normal, clustered_events, germline_risk, homologous_mapping_event, multi_event_alt_allele_in_normal, panel_of_normals, str_contraction, t_lod_fstar, and triallelic_site.Additionally, we excluded SNVs in the top 99th percentile of global background (>0.36% sample-wide background rate). Finally, we excluded any SNVs which were not located in the exonic region and predicted as synonymous/Tolerated SNV.
Putative molecular pathways for the genes harboring the somatic SNVs were performed using the Kyoto Encyclopedia of Genes and Genomes (KEGG or Gene Ontology) canonical pathways. P-values were calculated based upon the hypergeometric distribution with false discovery rate correction using the Benjamini and Hochberg method as previously reported.25 GOTERM BP FAT enrichment analysis was carried out using the Database for Annotation, Visualization and Integrated Discovery (DAVID) bioinformatics resources as described previously.26
To determine the significance of observed mutations within each gene, the method described previously by Youn and colleagues was applied,27 and both the mutation frequency and functional impact were taken into consideration. The functional impact was defined by mutation scores assigned in the following order: missense < inframe indel < mutation in splice sites < frameshift indel = nonsense. Different types of missense mutations were also given different scores on the basis of the BLOSUM80 matrix.
Results
Performance assessment of deep sequencing
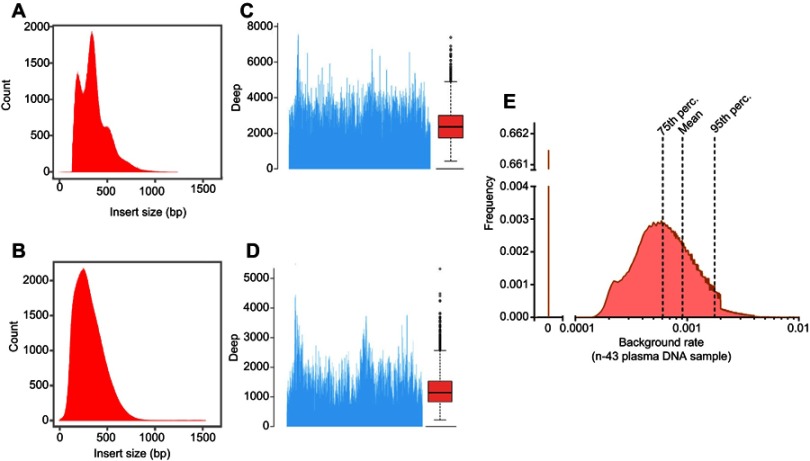
We initially conducted deep sequencing of a total of 107 DNA samples, including those prepared from 33 HCC tissue specimens, 37 peripheral blood samples, and 37 matched swab samples. To assess the performance, we analyzed the parameters of the data and the results are displayed in Figure 1. The sequenced fragments of the plasma cfDNA samples showed three main peaks for nucleotide length: 160 bp, 320 bp, and 480 bp (Figure 1A) at the average sequencing depth of ≥2000x (Figure 1C), which closely corresponded to the characteristic lengths of plasma cfDNA (Figure 1A and C). For the sequenced fragments of the DNA samples derived from the HCC tissue specimens, the average read length was approximately 300 bp (Figure 1B) at the average sequencing depth of ≥1000x (Figure 1D), which was in consistence with the average length of chromosomal DNA in somatic cells (Figure 1B and D).26 As the detection limit of the deep sequencing was influenced PCR during the library construction or sequencing errors, we also evaluated these parameters. After we eliminated somatic SNVs and germline single nucleotide polymorphisms (SNPs) that may negatively impact the sensitivity, the mean background rate reached 0.09% with a considerably low median background rate of <0.0001% (Figure 1E).
Figure 1.
Deep sequencing performance. 107 DNA samples derived from 33 HCC tissue specimens, 37 peripheral blood samples, and matched 37 swab samples were subject to deep sequencing, and the performance was evaluated. (A) The distribution of the sequenced fragments of the plasma cfDNA. Three main peaks with lengths of 160 bp, 320 bp, and 480 bp were identified. (B) The distribution of the sequenced fragments of the DNA samples from the HCC tissue specimens. The average read length was approximately 300 bp. The sequencing depths for (C) the plasma cfDNA and (D) the HCC tissue DNA. (E) The background rates. SNVs and germline SNPs were excluded, and the mean and median background rates were calculated.
Abbreviation: HCC, hepatocellular carcinoma.
Defining the mutations significantly associated with HCC
To define and select HCC-associated genetic variants to be used as a panel of somatic mutations for the subsequent analysis of plasma cfDNA in this study, we analyzed the frequency of mutations in each gene using a previously reported method.27 Six genes (TP53, CTNNB1, AXIN1, JAK1, EPS15, and CACNA2D4) that were recognized as the most significantly mutated genes in HCC28 and five genes (ARID1A, FLCN, SETD2, PTEN, and BUB1B) that were well-known to be frequently mutated in other cancer types were selected as candidate genes (Table 1).
Table 1.
Selected candidate genes for mutation frequency analysis among the included HCC patients
| Gene | Descriptiion | Mutation frequency | #Snv/Kbp | No. COSMIC matched | No. recurrence | P value | False discovery rate |
|---|---|---|---|---|---|---|---|
| TP53* | Tumor protein p53 | 64% (21) | 7.31 | 15 | 3 | 0 | 0 |
| ARID1A | AT rich interactive domain 1A (Tumor-suppressor) | 24% (8) | 0.68 | 3 | 1 | 0 | 0 |
| FLCN | Folliculin | 9.1% (3) | 8.4 | 1 | 0 | 0 | 0.01 |
| SETD2 | SET domain containing 2 (Tumor-suppressor) | 9.1% (3) | 0.52 | 0 | 0 | 0 | 0.055 |
| PTEN | Phosphatase and tensin homolog (Tumor-suppressor) | 12.1% (4) | 1.43 | 0 | 0 | 0 | 0.2 |
| BUB1B | Budding uninhibited by benzimidazoles 1 homolog beta (Tumor-suppressor) |
9.1% (3) | 4.05 | 0 | 0 | 0 | 0.2 |
| CTNNB1* | Catenin (cadherin-associated protein), beta 1, 88kDa | 6.1% (2) | 4.36 | 2 | 0 | 0.019 | 1 |
| JAK1* | Janus kinase 1 | 9.1% (3) | 7.28 | 1 | 0 | 0.193 | 1 |
| AXIN1* | Axin 1 | 21.2% (7) | 1.59 | 2 | 0 | 0.426 | 1 |
| EPS15* | Epidermal growth factor receptor pathway substrate 15 | 6.1% (2) | 6.01 | 1 | 0 | 0.61 | 1 |
| CACNA2D4* | Calcium channel, voltage-dependent, alpha 2/delta subunit 4 | 9.1% (3) | 9.4 | 0 | 0 | 0.003 | 1 |
Note: TP53, CTNNB1, AXIN1, JAK1, EPS15, and CACNA2D4 were recognized as significantly mutated genes in HCC. *ARID1A, FLCN, SETD2, PTEN, and BUB1B were well known to be frequently mutated in other types of cancer.
Abbreviations: HCC, hepatocellularcarcinoma; No., number.
Detection of somatic mutations in the selected panel in plasma cfDNA
To assess the feasibility of detecting the somatic mutations of the selected genes in the panel (TP53, AXIN1, JAK1, CTNNB1, BRAF, EGFR, CDKN2A, PTEN, FGFR2, KDR, LONP1, MAP2K2, and SMAD2) in plasma cfDNA, we compared the sequencing data for HCC tissue and plasma DNA samples from HCC patients. The percentages of the selected somatic mutations in each specimen (plasma or tissue) for each of the 32 HCC patients were calculated and are presented in Table 2. We detected a majority of the selected mutations in the HCC tissue DNA samples in the matched plasma cfDNA samples (range, 52–84%).
Table 2.
Comparison of mutation detection rates in the plasma cfDNA and tissue DNA samples of the HCC patients
| Aample_id | Overlap_snp_in_plasma | Overlap_snp_in_tissue |
|---|---|---|
| R1-1 | 16.37% | 66.29% |
| R1-2 | 25.75% | 59.51% |
| R1-3 | 40.15% | 73.34% |
| R1-6 | 27.15% | 75.24% |
| R1-7 | 12.90% | 67.05% |
| R1-9 | 11.64% | 64.33% |
| R1-15 | 16.67% | 56.22% |
| R1-16 | 15.63% | 54.63% |
| R1-17 | 27.93% | 56.40% |
| R1-19 | 19.23% | 59.90% |
| R1-20 | 50.48% | 64.79% |
| R1-25 | 28.72% | 52.27% |
| R1-26 | 22.41% | 61.02% |
| R1-30 | 26.35% | 60.99% |
| R1-33 | 26.52% | 62.09% |
| R1-42 | 47.14% | 72.97% |
| R1-44 | 11.67% | 55.19% |
| R1-45 | 37.27% | 54.17% |
| R1-46 | 22.56% | 60.64% |
| R1-47 | 18.52% | 75.25% |
| R1-57 | 23.16% | 63.66% |
| R1-60 | 32.04% | 71.21% |
| R1-63 | 19.09% | 84.75% |
| R1-67 | 18.60% | 56.99% |
| R1-74 | 24.79% | 60.99% |
| R1-76 | 49.29% | 60.10% |
| R1-80 | 27.78% | 65.10% |
| R1-84 | 16.03% | 62.88% |
| R1-85 | 31.98% | 83.28% |
| R1-87 | 43.21% | 61.27% |
| R1-88 | 39.04% | 60.22% |
| R1-89 | 25.81% | 61.31% |
| R1-93 | 20.77% | 58.65% |
Abbreviations: HCC, hepatocellularcarcinoma.
Somatic mutations in the plasma cfDNA in the diagnosis of HCC
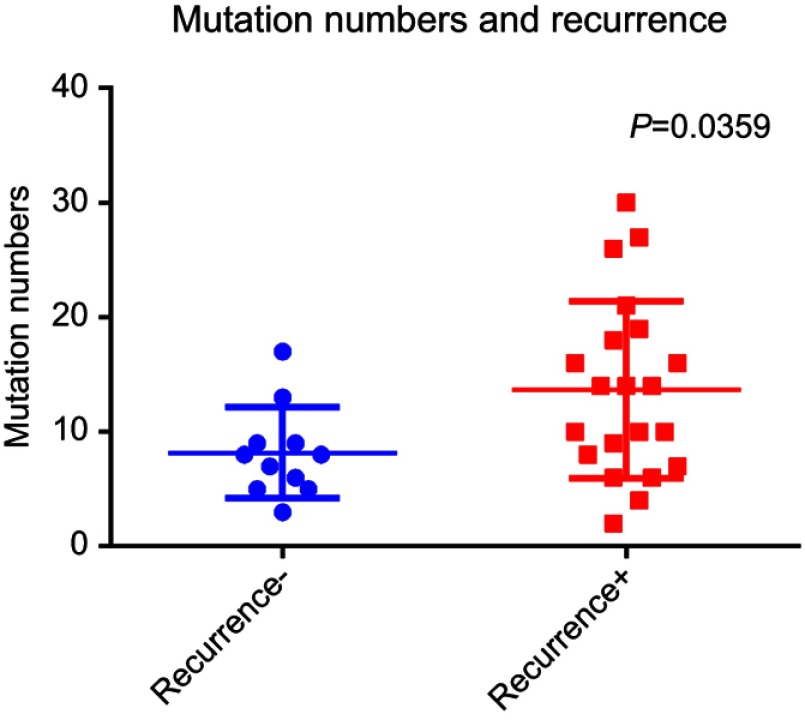
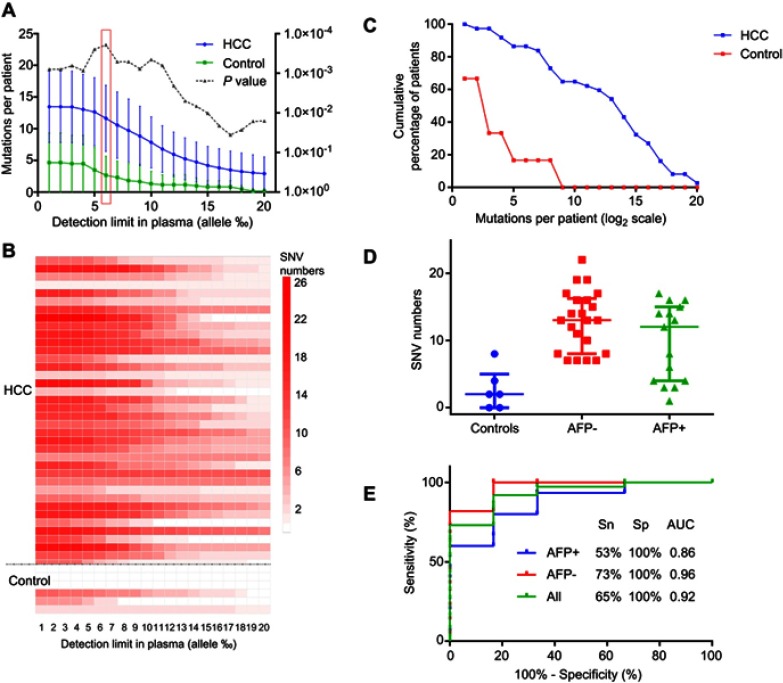
We next sought to obtain an optimal cutoff value for plasma cfDNA mutation detection in the diagnosis of HCC. We sequenced and analyzed the targeted somatic mutations in the plasma cfDNA samples extracted from the 37 HCC patients and 6 healthy individuals as control. As shown in Figure 3, we compared the numbers of mutations detected in the plasma cfDNA samples in the HCC and control groups at different detection limits in a range of 0.1–2% (allele). We found that the difference in the mutations between the HCC and control groups reached a peak at the detection limit of 0.6% (allele), and this was statistically significant. Thus, this optimal cutoff value was used in the study. Furthermore, the 37 HCC study subjects were divided to two subgroups according to the status of serum AFP, and receiver operating characteristic (ROC) curve analysis was performed for the mutations in the HCC and control plasma cfDNA samples. When we applied the detection of the somatic mutations in the plasma cfDNA in the ROC analysis, the area under the ROC curve (AUC) was 0.92, with a sensitivity of 65% and specificity 100% for the diagnosis of HCC. When the detection of the somatic mutations in the plasma cfDNA was combined with AFP detection, the AUC was 0.96 with a sensitivity of 73% and specificity of 100% for HCC patients negative for AFP, and the AUC value was 0.86 with a sensitivity of 53% and a specificity of 100% for HCC patients positive for AFP. These results suggested that detection of the somatic mutations in the plasma cfDNA in combination with the status of serum AFP offered better performance in the diagnosis of HCC than that of AFP alone (Figure 2A–E).
Figure 3.
Analysis of the mutation frequency in HCC patients with and without recurrence. The mutation frequencies of the selected candidate genes were examined in the studied HCC patients and were compared between those with and without HCC recurrence. The mutation frequency was significantly greater in the patients with recurrent HCC than in those with non-recurrent HCC.
Abbreviation: HCC, hepatocellular carcinoma.
Figure 2.
Detection of the somatic mutations in plasma cfDNA and their performance for the diagnosis of HCC. The selected somatic mutations were examined in plasma cfDNA samples derived from HCC patients (n=37) and healthy individuals (n=6) as controls. (A–C) The numbers of mutations per patient detected in the plasma cfDNA samples in the HCC and control groups. The numbers of mutations reached a peak value at the detection limit of 0.6% (allele), and this was considered as a cutoff value in the subsequent analysis. (D) Comparison of the mutation numbers detected in the AFP-positive group and AFP-negative group with the cutoff value of 0.6% (allele). Based upon the status of AFP, the 37 HCC patients were classified into two subgroups: AFP-negative group (AFP <400, n=22) and AFP-positive group (AFP ≥400, n=15), (E) ROC analysis of the mutations in the HCC and control plasma cfDNA samples. The sensitivity and specificity at the cutoff value of 0.6% were calculated. The AUC was 0.92, with a sensitivity (Sn) of 65% and specificity of 100% for the diagnosis of HCC. The AUC was 0.96 with a sensitivity of 73% and specificity of 100% for HCC patients who were negative for AFP. The AUC value was 0.86 with a sensitivity of 53% and specificity of 100% for HCC patients who were positive for AFP.
Abbreviation: HCC, hepatocellular carcinoma.
Somatic mutations of selected panel in relation to HCC recurrence
The studied HCC patients were further stratified into a recurrent HCC group and a non-recurrent HCC group, and the frequencies of the selected mutations in the panel were examined in the two groups. As shown in Figure 3, the mutation frequency was significantly higher in the patients with recurrent HCC than in those without HCC recurrence. For the mutation frequency of an individual gene, such as TP53, we found that a majority of the HCC patients (21/33, 64%) showed mutations, with the highest prevalence of mutations identified in the HCC study cohort and a prevalence greater than that previously reported in HCC studies.28,29 In addition, we observed that the frequencies of the ARID1A and CTNNB1 mutations were 24% and 6.1%, respectively, in the HCC patients, in which the mutation frequency was defined as a percentage of tumors with a protein-altering somatic mutation, and the known cancer mutations were selected by comparing with somatic mutations in the COSMIC database as previously reported.22 The numbers of mutations with matching genomic coordinates were presented.
Mutations of selected genes in the cell cycle, RTK/RAS/PI(3)K, and Wnt signaling pathways in relation to HCC recurrence
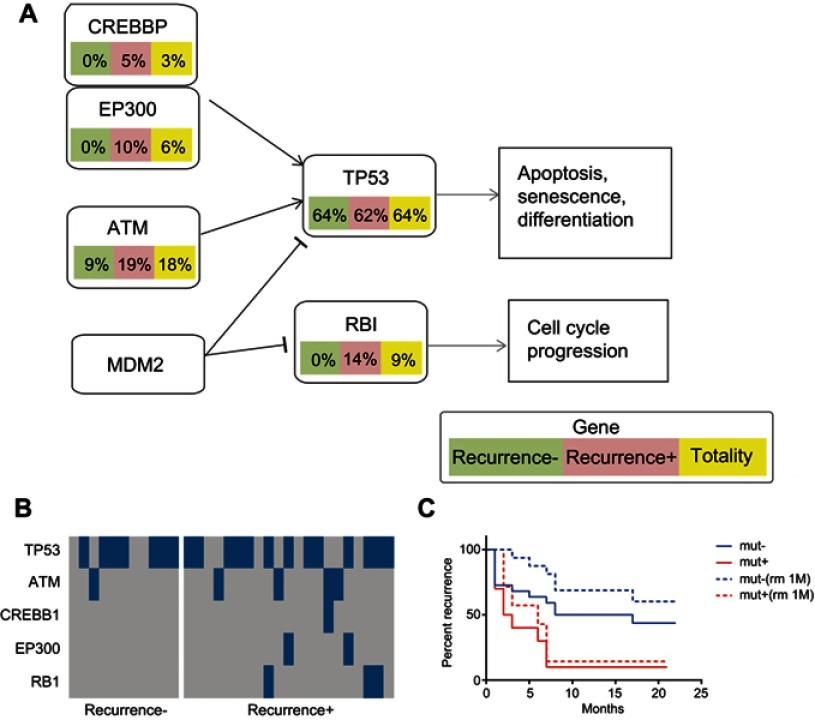
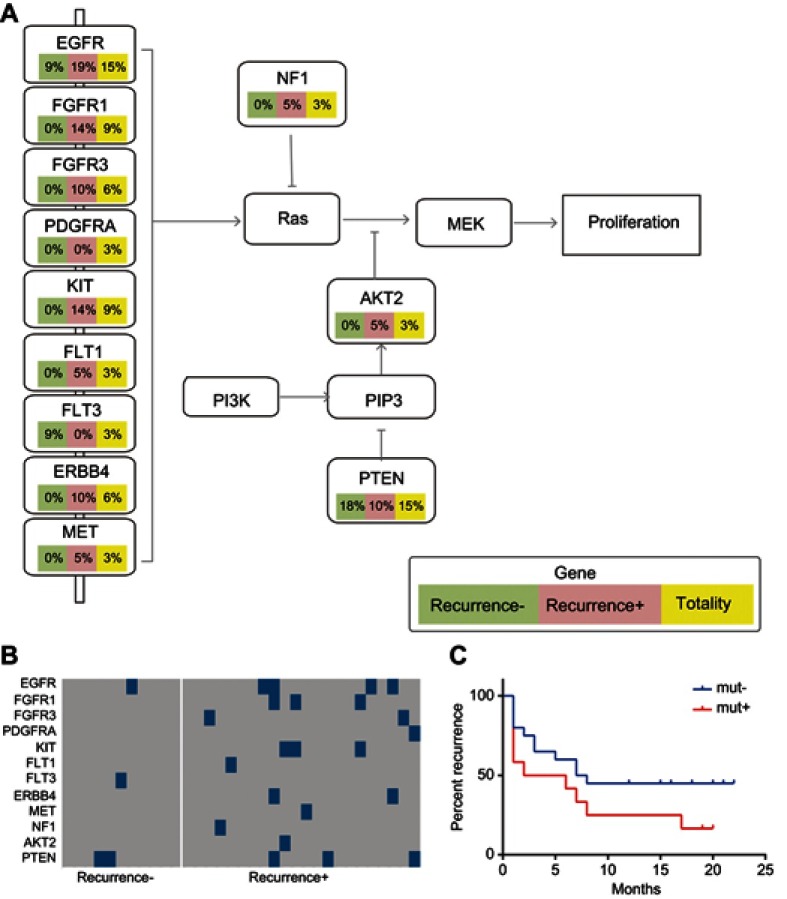
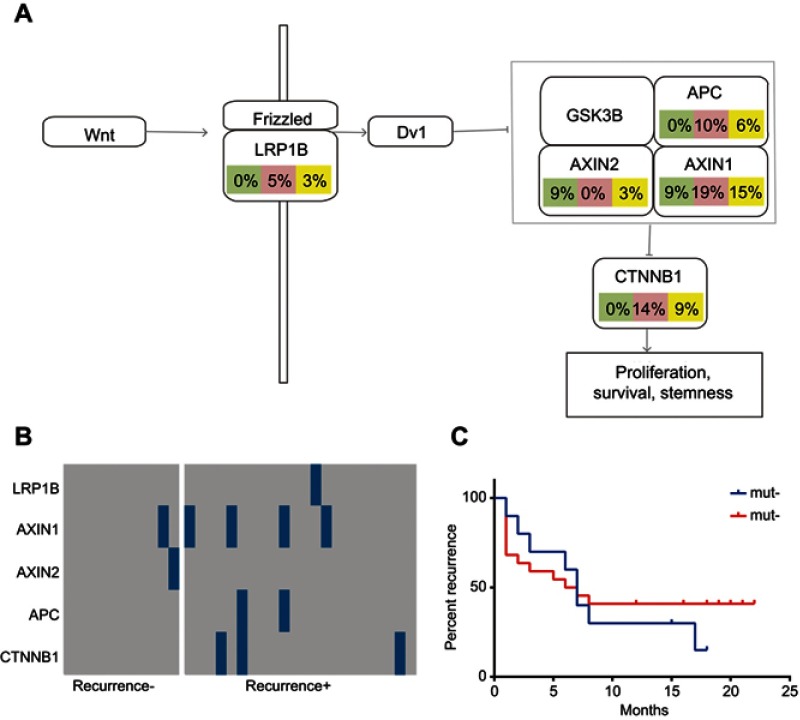
As the cell cycle, RTK/RAS/PI(3)K, and Wnt signaling pathways are associated with the pathogenesis of primary and recurrent cancer, the mutation frequencies of the selected genes involved in the three signaling pathways were determined and compared among all HCC cases, recurrent HCC cases, and non-recurrent cases. We found that the recurrent HCC group exhibited higher mutation frequencies of the selected genes in the cell cycle, RTK/RAS/PI(3)K, and Wnt signaling pathways in contrast to the non-recurrent HCC groups (Figures 4A and B, 5A and B, 6A and B). Furthermore, recurrent HCC was more likely to occur in the mutated groups than in the non-mutated groups (Figures 4C, 5C, 6C).
Figure 4.
Mutations of the selected panel of genes involved in the cell cycle pathway. The HCC patients were classified into a recurrent HCC group and non-recurrent or naïve HCC group. The mutation frequencies of the selected genes involved in the cell cycle pathway were examined and compared in all HCC cases, cases of recurrent HCC, and cases of non-recurrent HCC. (A) The frequencies of mutations of the genes involved in the cell cycle pathway. (B) Kaplan–Meier recurrence plot for the mutated group and non-mutated group of the selected genes, including ATM, CREBBP, EP300, and RB1 in the cell cycle pathway. (C) Comparative analysis of the profiles of the selected genes in the recurrent versus non-recurrent HCC groups.
Abbreviation: HCC, hepatocellular carcinoma.
Figure 5.
Mutations of the selected panel of genes in the RTK/RAS/PI(3)K signaling pathway. The HCC patients were classified into a recurrent HCC group and non-recurrent or naïve HCC group. The mutation frequencies of the selected genes in the RTK/RAS/PI(3)K signaling pathway were assessed and compared in all HCC cases, cases of recurrent HCC, and cases of non-recurrent HCC. (A) Frequency of mutations in the genes in the RTK/RAS/PI(3)K pathway. (B) Kaplan–Meier recurrence plot for the mutated group and non-mutated group for the selected genes in RTK/RAS/PI(3)K pathway. (C) Comparison of profiles of the selected genes in the RTK/RAS/PI(3)K pathway between the recurrent and non-recurrent HCC groups.
Abbreviation: HCC, hepatocellular carcinoma.
Figure 6.
Mutations of the selected panel of genes in the Wnt signaling pathways. The mutation frequencies of the genes (LRP1B, AXIN1, AXIN2, APC, and CTNNB1) in the Wnt signaling pathways were examined and compared in all HCC cases, case of recurrent HCC, and cases of non-recurrent HCC. (A) Frequency of mutations of the selected genes participating in the Wnt signaling pathway. (B) Kaplan–Meier recurrence plot for the mutated group and non-mutated group for the selected genes in the Wnt signaling pathways. (C) Comparison of profiles of the LRP1B, AXIN1, AXIN2, APC, and CTNNB1 genes in the recurrent HCC group versus the non-recurrent HCC group.
Abbreviation: HCC, hepatocellular carcinoma.
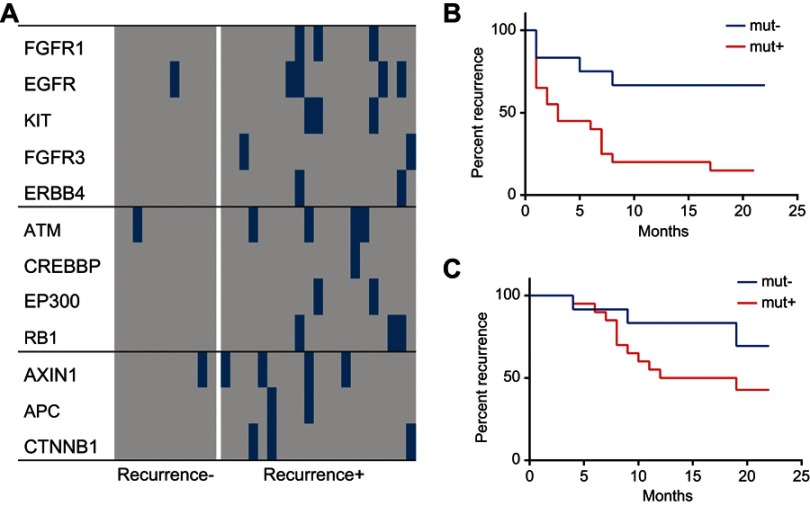
We also compared the profiles of the significantly altered genes in the cell cycle, RTK/RAS/PI(3)K, and Wnt signaling pathways in the recurrent HCC group and non-recurrent or naïve HCC group. As shown in Figure 7, survival plots revealed that the non-mutated group had significantly longer survival than the group with mutations in the selected genes in the cell cycle, RTK/RAS/PI(3)K, and Wnt signaling pathways, while the mutated group had a higher risk of HCC recurrence (Figure 7A–C). These findings suggest that the mutations of the selected genes involved in the cell cycle, RTK/RAS/PI(3)K, and Wnt signaling pathways were associated with the clinical outcomes of HCC.
Figure 7.
Profiles of the selected panel of genes in the cell cycle, RTK/RAS/PI(3)K, and Wnt signaling pathways and their relationship to survival and recurrence of HCC. The profiles of the significantly altered genes in the cell cycle, RTK/RAS/PI(3)K, and Wnt signaling pathways were compared between the recurrent HCC group and the non-recurrent or naïve HCC group. (A) Comparison of profiles of the significantly altered genes in the cell cycle, RTK/RAS/PI(3)K, and Wnt signaling pathways between the recurrent and non-recurrent HCC groups. (B) Survival plots for the mutated group and non-mutated group for the selected genes in the cell cycle, RTK/RAS/PI(3)K, and Wnt signaling pathways. (C) Recurrence plot for the mutated group and non-mutated group for the selected genes in the cell cycle, RTK/RAS/PI(3)K, and Wnt signaling pathways.
Abbreviation: HCC, hepatocellular carcinoma.
Discussion
Non-invasive serological markers have particular clinical significance in the diagnosis of HCC. This study of HCC patients had the following main novel findings: (1) a novel panel of somatic mutations was selected, and a majority of these mutations in HCC tissue DNA was detected in the matched plasma cfDNA; (2) assay of the mutations in plasma cfDNA showed good performance, with a specificity of 100% and sensitivity of 65% for the diagnosis of HCC regardless of the AFP status; (3) the detection of the selected mutations in plasma cfDNA combined with AFP exhibited better diagnostic accuracy, with a specificity of 100% and sensitivity of 73% for the diagnosis of HCC in AFP-negative cases; and (4) the rates of the selected mutations were significantly greater in recurrent HCC than in non-recurrent HCC (P<0.05). Our results indicated that the selected panel of mutations in cfDNA can be used to better detect HCC, especially in cases that are negative for AFP.
Much effort has been devoted to the search for non-invasive serum markers for HCC, and AFP is recognized as the most common biomarker for the detection and diagnosis of HCC. In addition, examination of serum AFP is also used to evaluate treatment in real time, as well as to predict prognosis and recurrence of HCC. However, serum AFP is associated with a high false-negative rate, missing as many as 40% of HCC cases.4,30 False-positive results for serum AFP have also been found in a proportion of pregnant women and patients with non-malignant clinical conditions, such as liver cirrhosis, chronic hepatitis B, and chronic hepatitis C. Additionally, it has been noticed that tests for serum AFP can be positive in some types of cancers other than HCC, including testicular cancer, gastric cancer, teratoma, and pancreatic cancer, indicating the relatively low specificity of AFP for HCC. The above limitations have posed challenges in the use of AFP as a non-serum marker for HCC.
In recent years, an emerging role has been realized for serum cfDNA in the diagnosis of malignancies, including HCC. In fact, a number of previous studies have demonstrated an association between cfDNA and HCC, suggesting that cfDNA is inversely correlated with prognosis of HCC and that cfDNA can be used as a serum marker for the diagnosis and prognosis prediction of HBV- and HCV-related HCC.31–34 However, our understanding of cfDNA in the diagnosis of HCC is still in its infancy. In the present study, we selected a panel of somatic mutations and tested the feasibility and value of detection of these mutations in plasma cfDNA in the diagnosis of HCC. As we expected, a majority of the selected mutations in the HCC tissue DNA (52–84%) was detected in the matched plasma cfDNA, which is in support of the concept that plasma cfDNA can serve as a non-invasive “liquid biopsy” for the purposes of diagnosis and tracking of treatment response in real time. In an evaluation of the mutations in plasma cfDNA for the diagnosis of HCC, we found that this approach showed good performance with a specificity of 100% and sensitivity of 65% in the diagnosis of HCC, independent of the AFP status. Interestingly, its diagnostic ability was improved when integrated with AFP status, with a specificity of 100% and sensitivity of 73% for the diagnosis of HCC in AFP-negative cases.
Our study has a few potential limitations. First, among the HCC subjects, a low proportion of cases was categorized as recurrent HCC, with the majority of HCC cases being naïve or non-recurrent HCC. A large sample size of recurrent HCC cases may be needed in future studies. Second, a wide range of chronic liver diseases, such as chronic viral hepatitis, liver hemangioma, cirrhosis, fatty liver, and intrahepatic cholestasis are linked to HCC; in particular, chronic hepatitis B is a leading causative factor for HCC in Chinese HCC patients. Thus, additional control diseases and HBV-related HCC should be included in future studies.
In conclusion, this study identified a novel panel of somatic mutations, and the assay of the mutations in plasma cfDNA demonstrated good diagnostic performance for HCC. Therefore, this study may add important serological markers for the diagnosis of HCC. Moreover, detection of the mutations in cfDNA along with detection of AFP offers better diagnostic accuracy, and thus, the identified panel of somatic mutations may complement AFP in the diagnosis of HCC.
Acknowledgments
This study was supported by the National Natural Science Foundation of China (Nos. 81672418 and 81871961 to Zhen-Yu Yin)
Disclosure
The authors report no conflicts of interest in this work.
References
- 1.Torre LA, Bray F, Siegel RL, Ferlay J, Lortet-Tieulent J, Jemal A. Global cancer statistics, 2012. CA Cancer J Clin. 2015;65(2):87–108. doi: 10.3322/caac.21262 [DOI] [PubMed] [Google Scholar]
- 2.Parkin DM. Global cancer statistics in the year 2000. Lancet Oncol. 2001;2(9):533–543. doi: 10.1016/S1470-2045(01)00486-7 [DOI] [PubMed] [Google Scholar]
- 3.Yao DF, Dong ZZ, Yao M. Specific molecular markers in hepatocellular carcinoma. Hepatobiliary Pancreat Dis Int. 2007;6(3):241–247. [PubMed] [Google Scholar]
- 4.Lok AS, Sterling RK, Everhart JE, et al. Des-gamma-carboxy prothrombin and alpha-fetoprotein as biomarkers for the early detection of hepatocellular carcinoma. Gastroenterology. 2010;138(2):493–502. doi: 10.1053/j.gastro.2009.10.031 [DOI] [PMC free article] [PubMed] [Google Scholar]
- 5.Mandel P, Metais P. Les acides nucléiques du plasma sanguin chez l’Homme [Nucleic acids of blood plasma in humans]. C R Seances Soc Biol Fil. 1948;142(3–4):241–243. [PubMed] [Google Scholar]
- 6.Fleischhacker M, Schmidt B. Circulating nucleic acids (CNAs) and cancer – a survey. Biochim Biophys Acta. 2007;1775(1):181–232. doi: 10.1016/j.bbcan.2006.10.001 [DOI] [PubMed] [Google Scholar]
- 7.Shaw JA, Page K, Blighe K, et al. Genomic analysis of circulating cell-free DNA infers breast cancer dormancy. Genome Res. 2012;22(2):220–231. doi: 10.1101/gr.123497.111 [DOI] [PMC free article] [PubMed] [Google Scholar]
- 8.Jung K, Fleischhacker M, Rabien A. Cell-free DNA in the blood as a solid tumor biomarker – a critical appraisal of the literature. Clin Chim Acta. 2010;411(21–22):1611–1624. doi: 10.1016/j.cca.2010.07.032 [DOI] [PubMed] [Google Scholar]
- 9.Murtaza M, Dawson SJ, Tsui DW, et al. Non-invasive analysis of acquired resistance to cancer therapy by sequencing of plasma DNA. Nature. 2013;497(7447):108–112. doi: 10.1038/nature12065 [DOI] [PubMed] [Google Scholar]
- 10.Bettegowda C, Sausen M, Leary RJ, et al. Detection of circulating tumor DNA in early- and late-stage human malignancies. Sci Transl Med. 2014;6(224):224ra224. doi: 10.1126/scitranslmed.3007094 [DOI] [PMC free article] [PubMed] [Google Scholar]
- 11.Frenel JS, Carreira S, Goodall J, et al. Serial next-generation sequencing of circulating cell-free DNA evaluating tumor clone response to molecularly targeted drug administration. Clin Cancer Res. 2015;21(20):4586–4596. doi: 10.1158/1078-0432.CCR-15-0584 [DOI] [PMC free article] [PubMed] [Google Scholar]
- 12.Maheswaran S, Sequist LV, Nagrath S, et al. Detection of mutations in EGFR in circulating lung-cancer cells. N Engl J Med. 2008;359(4):366–377. doi: 10.1056/NEJMoa0800668 [DOI] [PMC free article] [PubMed] [Google Scholar]
- 13.Scher HI, Heller G, Molina A, et al. Circulating tumor cell biomarker panel as an individual-level surrogate for survival in metastatic castration-resistant prostate cancer. J Clin Oncol. 2015;33(12):1348–1355. doi: 10.1200/JCO.2014.55.3487 [DOI] [PMC free article] [PubMed] [Google Scholar]
- 14.Schwarzenbach H, Alix-Panabieres C, Muller I, et al. Cell-free tumor DNA in blood plasma as a marker for circulating tumor cells in prostate cancer. Clin Cancer Res. 2009;15(3):1032–1038. doi: 10.1158/1078-0432.CCR-08-1910 [DOI] [PubMed] [Google Scholar]
- 15.Thierry AR, Mouliere F, El Messaoudi S, et al. Clinical validation of the detection of KRAS and BRAF mutations from circulating tumor DNA. Nat Med. 2014;20(4):430–435. doi: 10.1038/nm.3511 [DOI] [PubMed] [Google Scholar]
- 16.Thompson JC, Yee SS, Troxel AB, et al. Detection of therapeutically targetable driver and resistance mutations in lung cancer patients by next-generation sequencing of cell-free circulating tumor DNA. Clin Cancer Res. 2016;22(23):5772–5782. doi: 10.1158/1078-0432.CCR-16-1231 [DOI] [PMC free article] [PubMed] [Google Scholar]
- 17.Schwaederle MC, Patel SP, Husain H, et al. Utility of genomic assessment of blood-derived circulating tumor DNA (ctDNA) in patients with advanced lung adenocarcinoma. Clin Cancer Res. 2017;23(17):5101–5111. doi: 10.1158/1078-0432.CCR-16-2497 [DOI] [PMC free article] [PubMed] [Google Scholar]
- 18.Paweletz CP, Sacher AG, Raymond CK, et al. Bias-corrected targeted next-generation sequencing for rapid, multiplexed detection of actionable alterations in cell-free DNA from advanced lung cancer patients. Clin Cancer Res. 2016;22(4):915–922. doi: 10.1158/1078-0432.CCR-15-1627-T [DOI] [PMC free article] [PubMed] [Google Scholar]
- 19.Martincorena I, Campbell PJ. Somatic mutation in cancer and normal cells. Science. 2015;349:1483–1490. doi: 10.1126/science.aab4082 [DOI] [PubMed] [Google Scholar]
- 20.Primary Liver Cancer Diagnosis and Treatment Expert Panel of the Chinese Ministry of Health. Guidelines on the diagnosis and treatment of primary liver cancer (2011 edition). Chin Clin Oncol. 2012;1:10. [DOI] [PubMed] [Google Scholar]
- 21.Newman AM, Bratman SV, To J, et al. An ultrasensitive method for quantitating circulating tumor DNA with broad patient coverage. Nat Med. 2014;20(5):548–554. doi: 10.1038/nm.3519 [DOI] [PMC free article] [PubMed] [Google Scholar]
- 22.Forbes SA, Bindal N, Bamford S, et al. COSMIC: mining complete cancer genomes in the Catalogue of Somatic Mutations in Cancer. Nucleic Acids Res. 2011;39(Database issue):D945–950. doi: 10.1093/nar/gkq929 [DOI] [PMC free article] [PubMed] [Google Scholar]
- 23.Li H, Durbin R. Fast and accurate short read alignment with Burrows-Wheeler transform. Bioinformatics. 2009;25(14):1754–1760. doi: 10.1093/bioinformatics/btp324 [DOI] [PMC free article] [PubMed] [Google Scholar]
- 24.Li H. A statistical framework for SNP calling, mutation discovery, association mapping and population genetical parameter estimation from sequencing data. Bioinformatics. 2011;27(21):2987–2993. doi: 10.1093/bioinformatics/btr509 [DOI] [PMC free article] [PubMed] [Google Scholar]
- 25.Hochberg Y, Benjamini Y. More powerful procedures for multiple significance testing. Stat Med. 1990;9(7):811–818. [DOI] [PubMed] [Google Scholar]
- 26.Dennis G Jr, Sherman BT, Hosack DA, et al. DAVID: database for annotation, visualization, and integrated discovery. Genome Biol. 2003;4(5):P3. doi: 10.1186/gb-2003-4-5-p3 [DOI] [PubMed] [Google Scholar]
- 27.Youn A, Simon R. Identifying cancer driver genes in tumor genome sequencing studies. Bioinformatics. 2011;27(2):175–181. doi: 10.1093/bioinformatics/btq630 [DOI] [PMC free article] [PubMed] [Google Scholar]
- 28.Kan Z, Zheng H, Liu X, et al. Whole-genome sequencing identifies recurrent mutations in hepatocellular carcinoma. Genome Res. 2013;23(9):1422–1433. doi: 10.1101/gr.154492.113 [DOI] [PMC free article] [PubMed] [Google Scholar]
- 29.Neuveut C, Wei Y, Buendia MA. Mechanisms of HBV-related hepatocarcinogenesis. J Hepatol. 2010;52(4):594–604. doi: 10.1016/j.jhep.2009.10.033 [DOI] [PubMed] [Google Scholar]
- 30.Marrero JA. Screening tests for hepatocellular carcinoma. Clin Liver Dis. 2005;9(2):235–251, vi. doi: 10.1016/j.cld.2004.12.006 [DOI] [PubMed] [Google Scholar]
- 31.Chen H, Sun LY, Zheng HQ, Zhang QF, Jin XM. Total serum DNA and DNA integrity: diagnostic value in patients with hepatitis B virus-related hepatocellular carcinoma. Pathology. 2012;44(4):318–324. doi: 10.1097/PAT.0b013e328353a24c [DOI] [PubMed] [Google Scholar]
- 32.Ren N, Qin LX, Tu H, Liu YK, Zhang BH, Tang ZY. The prognostic value of circulating plasma DNA level and its allelic imbalance on chromosome 8p in patients with hepatocellular carcinoma. J Cancer Res Clin Oncol. 2006;132(6):399–407. doi: 10.1007/s00432-005-0049-5 [DOI] [PMC free article] [PubMed] [Google Scholar]
- 33.Zhou J, Shi YH, Fan J. Circulating cell-free nucleic acids: promising biomarkers of hepatocellular carcinoma. Semin Oncol. 2012;39(4):440–448. doi: 10.1053/j.seminoncol.2012.05.013 [DOI] [PubMed] [Google Scholar]
- 34.Tokuhisa Y, Iizuka N, Sakaida I, et al. Circulating cell-free DNA as a predictive marker for distant metastasis of hepatitis C virus-related hepatocellular carcinoma. Br J Cancer. 2007;97(10):1399–1403. doi: 10.1038/sj.bjc.6604034 [DOI] [PMC free article] [PubMed] [Google Scholar]


