

ABSTRACT
In the U.S., pneumococcal polysaccharide vaccine (PPSV23) uptake among high-risk adults aged <65 years is consistently low and improvement is needed. One barrier to improved vaccine coverage is the complexity of the adult vaccination schedule. This exploratory analysis compared the cost-effectiveness of strategies to increase pneumococcal vaccine uptake in high-risk adults aged 50–64 years. We used a Markov model to compare strategies for non-immunocompromised 50–64 year olds: 1) current pneumococcal polysaccharide vaccine (PPSV23) recommendations; 2) current recommendations enhanced by an intervention; 3) PPSV23 plus pneumococcal conjugate vaccine (PCV13) for high-risk patients with no intervention; or 4) both vaccines for all 50-year-olds with no intervention. Parameters included CDC data and other US data, varied extensively in sensitivity analyses. In the analysis, vaccinating high-risk individuals with PPSV23/PCV13 was the least costly strategy, with total costs of $424/person. Vaccinating all 50 year olds with PPSV23/PCV13 cost $40 more and gained 0.00068 quality-adjusted life years (QALY), or $57,786/QALY gained. Current recommendations with or without an intervention program were more expensive and less effective than other strategies. In multi-way sensitivity analyses, the current recommendations/intervention program strategy was favored at a $100,000/QALY threshold only if non-bacteremic pneumococcal pneumonia rate or PCV13 serotype coverage were substantially lower than base case values. Thus, an intervention program to improve pneumococcal vaccine uptake among high-risk 50–64 year-olds was not cost-effective in most scenarios. High-risk individuals receiving both PCV13 and PPSV23 could be economically favorable, and vaccinating all 50-year-olds with both vaccines could be considered.
Keywords: Adult pneumococcal vaccination, decision analysis, cost-effectiveness analyses, implementation programs
Background
Current U.S. Advisory Committee for Immunization Practices (ACIP) adult pneumococcal vaccination recommendations are based on age and the presence of certain underlying health conditions. For example, ACIP recommendations for adults aged ≥65 years include both the 23-valent pneumococcal polysaccharide vaccine (PPSV23) and the 13-valent pneumococcal conjugate vaccine (PCV13).1 Adults aged 19–64 years with immunocompromising conditions receive both PCV13 and PPSV23 as well, while individuals of this age with high risk, non-immunocompromising, comorbid conditions only receive PPSV23.1
Universal routine childhood pneumococcal vaccination and the resulting shift in adult pneumococcal disease epidemiology have caused some uncertainty regarding the optimally protective adult vaccination regimen. Indirect effects of routine childhood PCV13 immunization (which began in 2010) have been observed in adults; however, the full impact in unvaccinated adults is still being determined.2 Thus, the most effective single vaccine or combination of vaccines for any given adult subgroup is unknown.
U.S. pneumococcal vaccine uptake has been consistently low among high risk adults aged 19–64 years (20.3% in 2014) and among adults aged ≥65 years (61.3% in 2014),3 below Healthy People 2020 target levels of 60% and 90%, respectively. Multiple factors contribute to this gap between recommendations and uptake, including lack of patient awareness, fear of side effects, and complexity of vaccine recommendations.
Approaches to improve adult pneumococcal vaccination rates have included standing order protocols and single- or multi-strategy interventions.4,5 However, standing order protocols allowing non-physicians to vaccinate may not be readily adopted because of recommendation complexity, and intervention programs require time and resources that may not be available.5 Thus, it is unclear if improvements in pneumococcal vaccination rates could be more easily and effectively accomplished using a less complex but perhaps more expensive, age-based universal pneumococcal vaccination recommendation than by a practice-based intervention to improve implementation of current vaccination recommendations.
This study was an exploratory analysis to compare the public health effects and cost-effectiveness (CE) of intervention programs to improve pneumococcal vaccination uptake in high risk adults aged 50–64 years, compared to simplifying the current US ACIP and Centers for Disease Control and Prevention (CDC) adult pneumococcal vaccination recommendations. The aim of this exploratory analysis was to identify circumstances where policies that simplify pneumococcal vaccination recommendations might be favored compared to interventions that improve uptake of current recommendations. To this end, we used a relatively simple model, with simplifying assumptions that consistently favored current CDC recommendations for pneumococcal vaccination, where only high-risk individuals are recommended for vaccination within the 50–64 year-old age group. Given these assumptions that do not favor broader, perhaps easier to implement, pneumococcal vaccination recommendations, the case for these broader strategies could be strengthened under circumstances where they were favored in the analysis.
Results
Public health effects
Table 1 summarizes the public health effects of the vaccination strategies. For the entire U.S. 50–64 year old population (63,187,232 in 2015)6 with current ACIP recommendations in place, there were, in 50–64 year olds, 139,254 invasive pneumococcal disease (IPD) cases, 962,341 nonbacteremic pneumococcal pneumonia (NBP) cases, and total pneumococcal disease deaths (IPD and NBP) were 112,334. Adding an intervention program to increase PPSV23 uptake among high-risk patients decreased IPD incidence and mortality by 4.8%. Adding PCV13 for high risk 50 year olds resulted in 1504 fewer pneumococcal disease deaths compared to the intervention program. Recommending both PPSV23 and PCV13 for all adults ≥50 years, regardless of high-risk conditions, resulted in the lowest risk for both IPD and NBP. Decreasing the PCV13 serotype coverage to 24.5% increased the number of NBP cases and deaths in all strategies, relative to the PCV13 serotype coverage of 30.7%, and had no effect on IPD outcomes. The greatest increase in NBP outcomes was in the strategy giving both vaccines to all adults ≥50 years; a 1% increase in both cases and deaths. This strategy still resulted in the lowest risk overall for IPD and NBP.
Table 1.
Results: Pneumococcal morbidity and mortality in the U.S. 50–64 year-old population by strategy.
| Strategy | IPD |
Pneumonia |
||
|---|---|---|---|---|
| Cases | Deaths | Cases | Deaths | |
| Current ACIP | 139,254 | 14,204 | 962,341 | 98,130 |
| Intervention | 132,609 | 13,526 | 962,341 | 98,130 |
| High risk PCV13 + PPSV23 | 137,970 | 14,073 | 947,316 | 96,626 |
| All PCV13 + PPSV23 | 130,969 | 13,359 | 929,897 | 94,849 |
Cost-effectiveness analysis
Cost-effectiveness (CE) analysis results (Table 2) are presented as incremental CE ratios with strategies ordered by cost. The total per-person cost of pneumococcal vaccination and disease when persons with comorbid conditions received both PCV13 and PPSV23 (High Risk PCV13 + PPSV23) and with current recommendations without an intervention program (Current ACIP) were each almost $424, the lowest cost strategies examined (this circumstance is examined further in the Supplemental Material). Giving both PCV13 and PPSV23 to all individuals aged ≥50 years (All PCV13 + PPSV23) cost about $39 more while gaining 0.00068 QALY more than High Risk PCV13 + PPSV23, resulting in a cost of $57,786/QALY gained. Decreasing PCV13 serotype coverage to 24.5% increased the cost-effectiveness ratio of All PCV13 + PPSV23 to $67,532/QALY gained. Despite Current ACIP having nearly the same cost as High Risk PCV13 + PPSV23, this strategy and Intervention strategy both had lower effectiveness and higher costs than other modeled strategies and were therefore dominated in this analysis.
Table 2.
Cost-effectiveness analysis results of modeled pneumococcal vaccination strategies in adults 50–64 years of age.
| Strategy | Cost | Incremental Cost | Effectiveness (QALY) | Incremental Effectiveness (QALY) | ICER ($/QALY) |
|---|---|---|---|---|---|
| High risk PCV13 + PPSV23 | $423.66 | - | 17.2719 | - | - |
| Current ACIP | $423.98 | $0.32 | 17.2715 | −0.00043 | Dominated |
| Intervention | $430.46 | $6.80 | 17.2717 | −0.00023 | Dominated |
| All PCV13 + PPSV23 | $462.82 | $39.16 | 17.2726 | 0.00068 | $57,786 |
All model parameters were varied individually in one-way sensitivity analyses. In these analyses, only individual variation of PCV13 serotype coverage, PCV effectiveness, or NBP probability caused the Intervention strategy to no longer be dominated and become favored at a $100,000/QALY gained threshold, while the Current ACIP strategy was never favored under these criteria. The Intervention strategy was favored at a $100,000/QALY gained threshold when NBP risk was <29/100,000 (base case 100.2/100,000), PCV13 serotype coverage was <11.0% (base case 30.7%), or if PCV13 effectiveness was near the lower end of its range as listed in Table 3.
Table 3.
Parameter values examined in model.
| Parameter | Value | Range | Source |
|---|---|---|---|
| Probability of vaccination | |||
| No program | 20.3% | 3 | |
| Program (peak after 10 yr) | 50% | 30–50% | Estimate |
| PCV13 serotype coverage | 30.7% | 0–40% | 7 |
| PPSV23 serotype coverage | 67.6% | 63.9–71.2% | 7 |
| Vaccine effectiveness | |||
| PPSV23 vs IPD | Table 5 | ||
| PCV13 vs IPD | Table 5 | ||
| PCV13 vs pneumonia | Table 5 | ||
| Vaccine adverse events | |||
| Probability per vaccine | 13% | 3–15% | 8 |
| Probability of comorbidity indication | 15.8% | 15.8–26.5% | 9 |
| Illness relative risk – comorbidity vs average risk | 4.26 | 2.99–4.26 | ABCs 2007−2008 |
| IPD yearly probability | |||
| Total population | 15.0/100,000 | 10%-20% | 10 |
| Comorbid conditions | 42.2/100,000 | 10, ABCs 2007−2008 | |
| Average risk | 9.90/100,000 | 10, ABCs 2007−2008 | |
| IPD case fatality | 10.2% | 5.1%-15.3% | 10 |
| Disability post IPD | 7.1% | 3.6%-10.7% | 10 |
| Non-bacteremic pneumonia yearly risk | |||
| Total population | 100.2/100,000 | 0–200/100,000 | 11,12 |
| Comorbid conditions | 281.8/100,000 | 11,12, ABCs 2007−2008 | |
| Average risk | 66.1/100,000 | 11,12, ABCs 2007−2008 | |
| Pneumonia case fatality | 10.2% | 5.1%-15.3% | 10 |
| Disability post pneumonia | 3.53% | 1.8%-5.35% | Estimated |
| Excess mortality due todisability | 0.1 | 0–1 | Estimated |
| Costs | |||
| Vaccine | |||
| PPSV23 | $78.90 | $26.15-$131.65 | 13 |
| PCV13 | $159.60 | $95.56-$223.64 | 13 |
| Administration | $25.08 | $25-$30 | 14 |
| Vaccination program (per pt/yr) |
$4.12 | $1.03-$4.12 | 4 (Low range estimate for high intensity program) |
| Vaccine side effects (per occurrence) |
$0.76 | $0-$2 | Estimate |
| IPD-discharged alive | $28,837 | $11,535-$54,790 | 15,16 |
| IPD-death | $39,726 | $15,891-$75,480 | 15,16 |
| Pneumonia- discharged alive |
$22,812 | $9,125-$43,342 | 15,16 |
| Pneumonia-death | $41,643 | $16,657-$79,123 | 15,16 |
| Initial treatment of symptoms for IPD |
$5 | $0-$10 | |
| Disability (per yr) | $14,917 | $5,967-$28,341 | 17 |
| Utility weights | |||
| Disability | 0.4 | 0.2–0.6 | Estimate18 |
| Hospitalization | 0.2 | 0.1–0.5 | 19,20 |
| Vaccine side effects | 0.855 | 0.8–0.99 | Estimate18 |
| Well | 0.88 | 0.72–0.88 | 19 |
| Illness durations (days) | |||
| IPD | 34 | 17–51 | 19,20 |
| Hospitalized pneumonia | 34 | 17–51 | 19,20 |
| Vaccine side effects | 3 | 1–8 | 8 |
We also performed analyses simultaneously varying PCV13 serotype coverage, NBP probability, and intervention program costs, using $50,000/QALY and $100,000/QALY gained thresholds (Figure 1). At the base case program cost of $4.12/eligible person (left), Intervention was favored at a $50,000/QALY gained threshold when NBP probability (moving the blue “X” to the left in the figure) was <24/100,000 or PCV13 serotype coverage (moving the blue “X” down) was <9.2%. (The white symbol in all figures denotes the lower PCV13 serotype coverage of 24.5%). At a $100,000/QALY threshold (as outlined in the above paragraph), the Intervention was favored when NBP was <29/100,000 or PCV13 serotype coverage was <11.0%. Decreasing program costs to $1.03/eligible person (Figure 1, right) increases the area where the Intervention is favored. For example, at a $100,000/QALY threshold (Figure 1, bottom right), the intervention was favored when NBP probability was <36/100,000 or PCV13 serotype coverage was <13.7%. In another related analysis, we also varied the heightened vaccine uptake afforded by the Intervention strategy. Decreasing that probability from 50% to 40% or 30% at the lower $1.03/eligible patient program cost (Supplemental Figure 1), decreased the range of values where the Intervention strategy would be favored when a $100,000/QALY threshold is used; at the higher program cost ($4.12), the Intervention strategy’s favorability was decreased further at lower vaccination rates (not shown).
Figure 1.
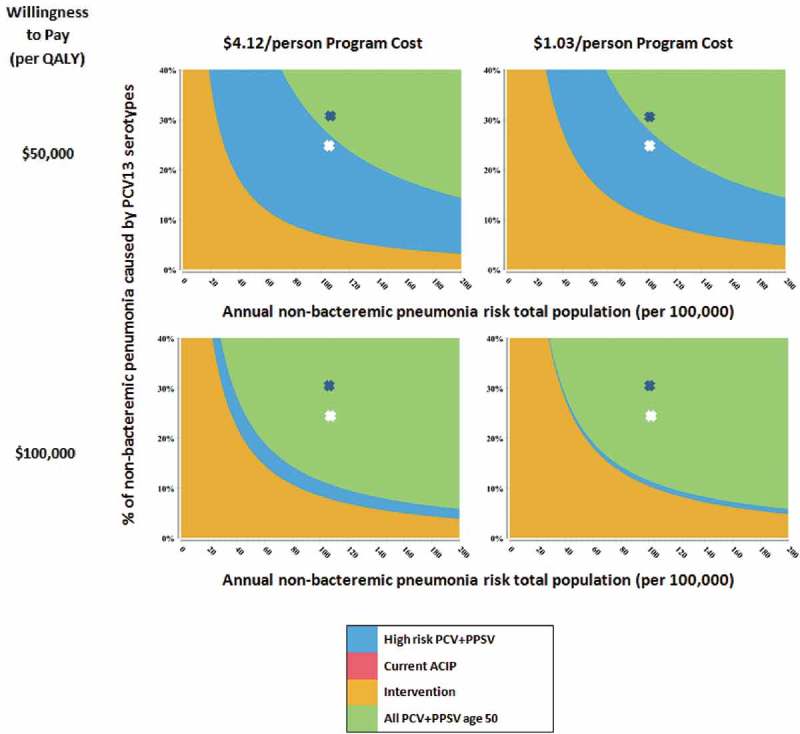
Title of data: Multi-way sensitivity analysis when an intervention program improves vaccination uptake to 50%.
Description of data: Panels depict areas where strategies are favored while varying non-bacteremic pneumonia risk (x-axis), pneumococcal conjugate vaccine (PCV) serotype coverage (y-axis), per person intervention program cost (columns) and cost-effectiveness threshold (columns). The blue depicts base case values for pneumonia risk and PCV serotype coverage. In all 4 graphs, All PCV13 + PPSV23 was favored at base case values with the Intervention becoming favorable with lower pneumonia rates and serotype coverage.
Varying all parameters simultaneously over distributions 5000 times in a probabilistic sensitivity analysis, shows the likelihood that strategies would be favored over a range of cost-effectiveness willingness-to-pay thresholds, as depicted in an acceptability curve (Figure 2). At a $50,000/QALY gained threshold, High Risk PCV13 + PPSV23 was favored in 60.3% of model iterations, and in 14.8% at a $100,000/QALY threshold, while All PCV13 + PPSV23 was favored in 37% at $50,000/QALY and in 82.9% at $100,000/QALY gained. The Intervention strategy had very low favorability over the entire range, favored in 2.3% of model iterations at a $100,000/QALY threshold. Figure 2(b) shows the acceptability curve for the decreased PCV13 serotype coverage of 24.5%, which slightly increased the favorability of High Risk PCV13 + PPSV23 (69.1% at $50,000/QALY and 22.3% at $100,000/QALY) and slightly decreased the favorability of All PCV13 + PPSV23 (24.1% at $50,000/QALY and 70.5% at $100,000/QALY gained).
Figure 2.
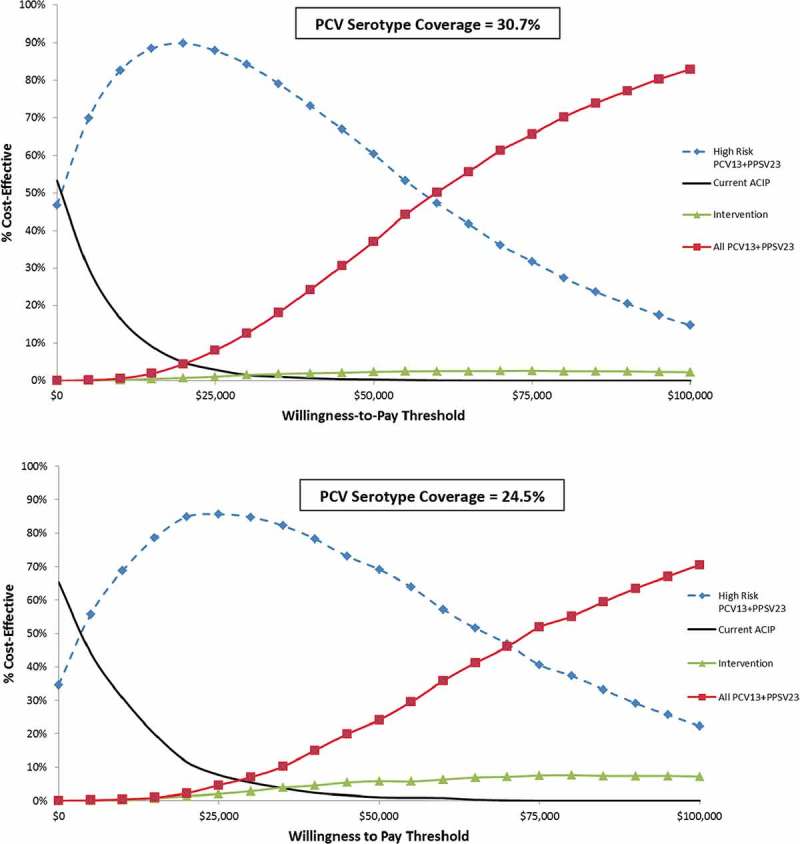
Title of data: Probabilistic sensitivity analysis for non-immunocompromised adult pneumococcal vaccination strategies.
Description of data: Results shown as a cost-effectiveness acceptability curve. The y-axis shows the likelihood strategies would be cost-effective at a given willingness to pay threshold.
In separate sensitivity analyses, detailed in the Supplemental Material, we examined 1) the effects of relaxing the assumption of PPSV23 ineffectiveness against NBP, 2) the potential increased vaccine uptake effects of the less complex, but more expensive, strategy where all 50 year olds are recommended to receive both vaccines, 3) relaxing the assumption of equal mortality between average- and high-risk groups, 4) varying high-risk health state membership likelihood, and 5) varying vaccine effectiveness assumptions. When PPSV23 is assumed effective against NBP, then Intervention is the preferred strategy in most scenarios. For example, the Intervention is favored at a $100,000/QALY threshold unless PPSV23 relative effectiveness vs. NBP was <27.2% of PCV13 vs. NBP; similar results occur when PPSV effectiveness vs. NBP is set to levels suggested by Suzuki et al in their trial of 65+-year-olds.21 On the other hand, when All PCV13 + PPSV23 increases vaccine uptake by 5 and 10 percentage points, that strategy became more economically favorable. When non-pneumococcal disease mortality is greater in high risk groups, giving all 50 year olds both vaccines remains the favored strategy. Increasing high-risk health state membership leads to ICERs of $2,800/QALY for giving both vaccines to the high risk group and $75,100/QALY for giving all 50 year olds both vaccines. Alternative PPSV effectiveness assumptions, where its effectiveness against IPD is decreased or shortened in duration, further favors giving both vaccines to all 50 year olds, as do decreased PPSV serotype likelihood assumptions.
Discussion
In this analysis, offering both PCV13 and PPSV23 to high risk patients aged ≥50 years was the least costly strategy examined. In addition, offering both vaccines to all 50 year-olds resulted in the lowest disease and mortality burden, reducing pneumococcal disease deaths by 4,126 compared to current recommendations, while potentially being an economically reasonable option. However, an intervention program to increase PPSV23 uptake in adults with high risk indications was not favorable economically unless: its costs were low, NBP risk and PCV13 serotype coverage were substantially less than base case values, or PPSV23 is substantially effective in preventing NBP. These results occurred despite the intervention program increasing vaccine uptake substantially more (from 20.3% to 50%) in high risk subgroups than typically seen. In addition, in a probabilistic sensitivity analysis, the intervention program was unlikely to be favored compared to the other strategies. Conversely, a more modest increase in vaccination uptake due to the less complex strategy of vaccinating everyone at age 50 with both vaccines would likely result in greater upfront costs, but could make this strategy more economically acceptable.
A recent review of the pneumococcal vaccine schedule recommendations in the context of changing pneumococcal disease epidemiology has highlighted the need for a continual assessment of the effectiveness and CE of strategies in adult sub-populations based on age, comorbidities, race, access to care, and socioeconomic status.22 Our results have delineated some parameter bounds for the CE of improved implementation of existing vaccination recommendations compared with other strategies. Moreover, these results have ascertained areas of uncertainty needing further exploration.
This study shows a reduction in pneumococcal disease when adding PCV13 to the regimen, similar to another analysis comparing current recommendations with PCV13 recommendation for high risk patients; however cost outcomes are not comparable because that study did not examine a strategy of vaccinating everyone aged 50–64, regardless of comorbidity status.23 A CE analysis evaluating PCV13 vaccination in healthy adults with no high risk conditions over 50 years in Belgium compared to PPSV23 vaccination and both vaccines combined resulted in a higher ICER for PCV13 than that seen in our study. When comparing PCV13 with PPSV23, the cost and effectiveness of each were similar, with the higher price of PCV13 being the driving factor in a higher ICER for PCV13.24
Few analyses have focused on the CE of providing vaccines for all adults under 65 and fewer have examined CE in programs to increase vaccination uptake in this population. In a review of PCV13 economic evaluations in adults, 10 evaluations met review criteria and of these, 4 were in adults aged ≥65, 2 evaluated immunocompromised patients only, and 2 examined PCV13 recommendations for high risk patients.25 Of the remaining 2, one is an analysis15 conducted by the authors of this paper and the other used all-cause pneumonia rates, instead of those specific to S. pneumoniae.26
Strengths and limitations
This study was an exploratory analysis, subject to several limitations. Indirect effects from childhood and adult vaccination, which could reduce the value of PCV13 in adults, were incorporated into disease rates in the model. CDC data suggest that invasive pneumococci disease due to vaccine serotypes may have stabilized over the last few years,2,27 however further herd immunity effects in unvaccinated adults could still occur, reducing the value of PCV13 in adults. Sensitivity analyses examined the possible indirect effects of childhood vaccination, such as decreasing adult pneumococcal disease and decreased vaccine serotype coverage in adults. In these analyses, as summarized in Figure 2, decreases in NBP rates and PCV13 serotype coverage due to herd immunity would need to go to very low levels before the Intervention strategy, which uses PPSV23 alone, was favored. Only hospitalized NBP was considered in the model, possibly making modeling assumptions unfavorable toward PCV13, as approximately 5–16% of NBP cases are hospitalized.28 Ranges for all parameters varied in sensitivity analysis and in probabilistic sensitivity analysis,29 were largely based on estimates of uncertainty, particularly regarding adult pneumococcal disease risk and the indirect effects of childhood vaccination.
Pneumococcal vaccine effectiveness continues to be controversial, particularly regarding PPSV23 effectiveness in preventing NBP.30,31 In scenarios where PPSV23 prevents NBP, heightened implementation of current recommendations was favored over other strategies if PPSV23 effectiveness approached that of PCV13, but was not favored if NBP effectiveness for PPSV23 was ≤27.2% of that of PCV13.
A major limitation is uncertainty regarding NBP incidence. In this analysis, we used a base case estimate of 100.2 NBP cases/100,000 in the entire 50–64 year old population,15 based on National Hospital Discharge Survey data showing a 334/100,000 all-cause pneumonia hospitalization rate11 and assuming 30% of these cases are NBP.12 Grijalva et al. projected a similar all-cause pneumonia rate in this age group of 328.1/100,000.32 More recently, Weycker et al. estimated hospitalized NBP as 193/100,000 in 50–64 year-olds.33 In their 2016 CE analysis of adult pneumococcal vaccination strategies, Stoecker et al.23 used Simonsen et al.’s all-cause pneumonia rate, 258.2/100,00034 and estimated that 10% of that rate was due to PCV13 serotype NBP, or 25.8/100,000. Our corresponding PCV13 serotype NBP rate is 30.8/100,000. Stoecker et al. do not estimate NBP rates for all pneumococcal serotypes.23 At the other end of the spectrum, Jain et al., in a surveillance-based study, found all-cause pneumonia hospitalization rates in 50–64 year-olds to be 263/100,000 with S. pneumoniae detected in 5% or 13/100,000.35 However, this study detected no pathogen in 64% of cases, a 194/100,000 population likelihood of hospitalized pneumonia with no pathogen detected in this age range,35 leaving open the question of what the true likelihood of NBP is, given the difficulty of establishing this diagnosis. If NBP rates are truly this low, greatly improved intervention programs for current recommendations are favored. If NBP rates are more in line with other estimates, then intervention programs may not be favored. The CDC Active Bacterial Core surveillance team has an ongoing study examining NBP incidence (Lee H. Harrison, MD, personal communication); its findings should clarify this issue.
Policy implications
To make US immunization policy recommendations, the ACIP uses an explicit evidence-based method, the Grading of Recommendations, Assessment, Development and Evaluation (GRADE) approach and the Evidence to Recommendations (EtR) framework.36,37 Cost-effectiveness modeling and public health impact, which we address in this paper, are two components of the EtR. Other EtR considerations include the certainty of the evidence base, acceptability to key stakeholders, and feasibility. We found that the most cost-effective strategy is vaccinating all with 50 year-olds with both PCV13 and PPSV23, costing $57,786 per QALY and saving 786 deaths due to IPD and 3,052 deaths due to pneumonia in the population of 50–64 year-olds. Should the other EtR considerations be addressed and the evidence base, including the percentage of pneumonia due to PCV13 serotypes, effectiveness of PCV13 and of PPSV23 in this age group, be better understood, then ACIP should consider formally evaluating routine vaccination at age 50. Of note, FDA has licensed both PCV13 and PPSV23 in 50–64 year-olds.
This exploratory analysis supports extending PCV13 vaccination in conjunction with PPSV23 in high risk adults aged 50–64 years with some potential for consideration of simplified pneumococcal vaccination recommendations for all adults aged ≥50. It also provides an initial framework of pertinent parameters for implementing a cost-effective program aimed at increasing vaccination rates but found that such an intervention program was not favored in most scenarios. These conclusions are sensitive to assumptions regarding NBP incidence and PCV13 serotype coverage of adult pneumococcal disease.
Materials and methods
Using a Markov state-transition model, we examined 4 vaccination strategies (Table 4) in non-immunocompromised persons aged 50–64 years: 1) current ACIP recommendations for PPSV23 for adults with high-risk conditions (referred to as Current ACIP); 2) current ACIP recommendations enhanced by an intervention program to increase high-risk uptake to 50% over 10 years and remaining at that level thereafter (Intervention); 3) PPSV23 plus PCV13 for high-risk patients, expanding current recommendations, with no intervention (High Risk PCV13 + PPSV23); or 4) both vaccines for all 50 year-olds, with no intervention (All PCV13 + PPSV23). For each of the four strategies, individuals were placed into one of two subgroups – those with high-risk comorbid conditions and those without (referred to as average risk) – based on National Health Interview Survey (NHIS) data.9 High-risk non-immunocompromising conditions per CDC definitions were: chronic heart disease (including congestive heart failure and cardiomyopathies); chronic lung disease (including chronic obstructive lung disease, emphysema, and asthma); chronic liver disease (including cirrhosis); alcoholism; diabetes mellitus; and smoking.38 A third party payer perspective and a 3% discount rate for future costs and benefits were used. Costs were converted to 2015 U.S. dollars. Quality of life was modeled using health state utility weights, with 0 equaling death and 1 denoting perfect health. The effectiveness term was quality- adjusted life years (QALY), the product of the health state utilities and the length of time in health states. The Markov model cycle length was 1 year.
Table 4.
Modeled vaccination strategies based on presence or absence of comorbid conditions*.
| Strategy | Risk Group |
|
|---|---|---|
| No comorbid conditions | Comorbid conditions | |
| Current ACIP | None | PPSV23 |
| Intervention | None | PPSV23 + intervention |
| High Risk PCV13 + PPSV23 | None | PCV13 + PPSV23 |
| All PCV13 + PPSV23 | PCV13 + PPSV23 | PCV13 + PPSV23 |
*Comorbid conditions are: chronic heart disease including congestive heart failure and cardiomyopathies; chronic lung disease including chronic obstructive lung disease, emphysema, and asthma; chronic liver disease including cirrhosis; alcoholism; diabetes mellitus; and smoking.
Figure 3 is a schematic depiction of the model. Individuals in each of the two subgroups, high-risk and average risk, could experience one of four possible outcomes: 1) stay in their respective state; 2) get invasive pneumococcal disease (IPD); 3) get non-bacteremic pneumococcal pneumonia (NBP); or 4) die from causes unrelated to pneumococcal disease. Those with pneumococcal disease (IPD or NBP) had probabilities of recovering and moving back to their original health state, becoming disabled, or dying from the disease. As the model progressed, disabled individuals could either stay disabled or die. The cohorts began the model at 50 years of age with a 50-year time horizon. In this exploratory analysis, we modeled average cohort membership in the high-risk group from ages 50–64 years as a constant value and varied that value in sensitivity analyses based on the relative likelihood of qualifying high-risk conditions at ages 50 and 65 years. Pneumococcal vaccination and disease costs and effects were followed for 15 years, based on the assumption that, when the cohort was 65 years of age or older, pneumococcal disease likelihood would be unaffected by the modeled strategy and thus equal for all study arms. Costs and utility losses due to pneumococcal disease-related disability and death continued to be tracked throughout the lifetime of the cohort.
Figure 3.
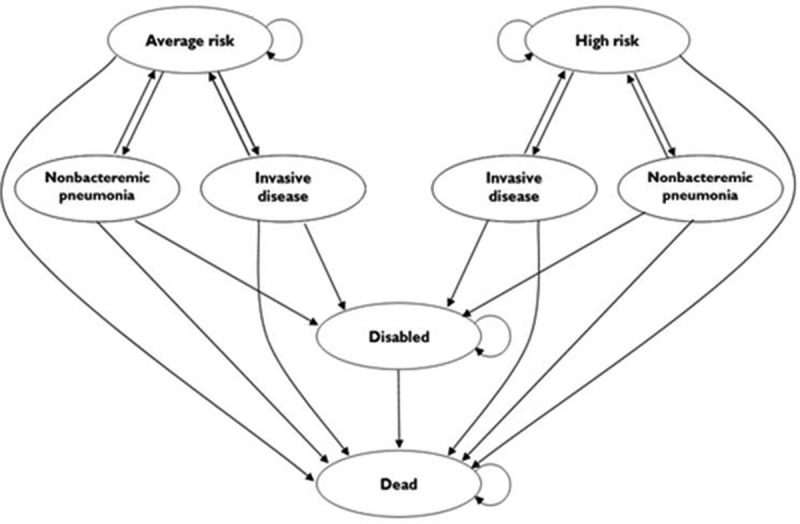
Title of data: Schematic depiction of the Markov model.
In the model, pneumococcal disease occurred based on population incidences of IPD and NBP. High-risk individuals had 4.3 times the relative risk of infection compared to average risk individuals, based on IPD rates calculated from 2007–2008 CDC Active Bacterial Core surveillance (ABCs) data (unpublished data). In the first year during which pneumococcal vaccine would be indicated the probability of receiving vaccine without an intervention program was 20.3%, the current vaccination rate in high-risk individuals aged <65 years. In our simplified model, vaccination occurred at age 50 for all groups eligible for vaccination in a given strategy.
A Delphi expert panel estimated age-specific PCV13 effectiveness against both IPD and NBP and PPSV23 effectiveness against IPD.15 PCV13 effectiveness against NBP was estimated to be 18% lower than its effectiveness against IPD and PPSV23 was determined to have no effect on NBP (Table 5). In sensitivity analyses, we examined scenarios, based on clinical trials,40–44 where PPSV23 effectiveness against IPD was less than expert estimates and the duration of its effectiveness shortened, and also where PPSV23 effectiveness against NBP was assumed. PCV13 effectiveness estimates against NBP were adjusted using Community-Acquired Pneumonia immunization Trial in Adults (CAPITA) trial observations in 65+ year-olds over a mean of 4 years, so that PCV13 short-term effectiveness matched that seen in the trial and waning calculated based on those initial CAPITA trial effectiveness values.39 In the model, each vaccine’s effectiveness was a function of these estimates and of pneumococcal illness serotype coverage, set at 30.7% for PCV13 and 67.6% for PPSV23,7 with those values decreased in sensitivity analyses. As part of the sensitivity analysis, we focused on a secondary baseline value of 24.5% for PCV13 pneumococcal illness serotype coverage likelihood, based on updated CDC serotype likelihood data (2015–2016, unpublished data), slightly lower than values in a recent CDC analysis (24.8–26.75%).23 Death due to non-pneumococcal causes was modeled using U.S. mortality data.45 In the base case analysis, equal non-pneumococcal mortality risk was assumed in average- and high-risk health states, thus making model assumptions more favorable toward strategies where only high-risk patients are vaccinated; this assumption was tested in sensitivity analyses, where the effects of higher mortality in high-risk patients were examined. Probabilities of IPD illness, disability, and mortality were derived, from IPD case, meningitis, and death rates, respectively from 2015 CDC ABCs data.10 All-cause pneumonia hospitalization rates came from National Hospital Discharge Survey data11 and NBP rates were calculated as 30% of this rate.12 The relative likelihood of NBP among age and comorbidity groups was similar to the likelihood determined from 2007–2008 ABCs data for IPD. The case-fatality rate for hospitalized NBP was estimated to be the same as that for IPD. Disability frequency from NBP was assumed to be 50% of IPD disability.15
Table 5.
Expert panel estimates of vaccine effectiveness in preventing vaccine serotype pneumococcal disease.
| Effectiveness (%) in Preventing Vaccine Serotype Invasive Pneumococcal Disease |
Effectiveness (%) in Preventing Vaccine Serotype Non-bacteremic Pneumococcal Pneumonia* |
||||||
|---|---|---|---|---|---|---|---|
| Years post vaccination | PPSV23 | Range | PCV13 | Range | PCV13 | Range | Source |
| 1 | 0.93 | 0.80–0.95 | 0.90 | 0.70–1.00 | 0.74 | 0.28–0.90 | Expert panel 15 |
| 3 | 0.89 | 0.74–94.5 | 0.80 | 0.55–0.95 | 0.66 | 0.22–0.86 | |
| 5 | 0.85 | 0.66–0.90 | 0.70 | 0.50–0.90 | 0.57 | 0.2–0.81 | |
| 7 | 0.60 | 0.40–0.75 | - | - | – | - | |
| 10 | 0.20 | 0.00–0.30 | 0.50 | 0.40–0.80 | 0.41 | 0.16–0.72 | |
| 15 | 0.00 | 0.00–0.20 | 0.45 | 0.00–0.60 | 0.37 | 0.00–0.54 | |
*First 5 years based on CAPITA trial observations, subsequent years adjusted based on initial CAPITA trial observed effectiveness39
To estimate costs of a program to increase vaccine uptake, we used prior estimates for a program that included patient reminders, standing vaccination orders in medical practices, audit and feedback, and a practice-based vaccination champion to spearhead the effort.4 To make model assumptions favoring an intervention program, we used a low range estimate for these costs, $4.12/patient eligible for the program,4 and decreased this value further in sensitivity analyses. To similarly have the analysis favor the intervention program, we assumed a perhaps overoptimistic absolute increase in vaccine uptake of 29.7% (from 20.3% to 50%), based on estimates from the same analysis.4 We assumed that this increase in vaccine uptake occurred when the model begins at age 50, again making the analysis tend to favor the intervention strategy.
Table 3 depicts model parameter values. Parameters were varied individually in 1-way sensitivity analyses and simultaneously in probabilistic sensitivity analysis. Selected parameters were also examined in a 3-way sensitivity analysis with $50,000 and $100,000/QALY-gained thresholds, commonly cited U.S. benchmarks46,47.
Funding Statement
Supported by the National Institute of Allergy and Infectious Diseases (R01AI116575). The funder had no role in study design, or in collection, analysis, or interpretation of the data, or in writing the manuscript.
Declarations
Ethics approval and consent to participate
Only publically available and/or published data were used in this analysis, making it exempt from ethics review in the US. https://www.hhs.gov/ohrp/regulations-and-policy/regulations/45-cfr-46/index.html#46.101
Consent for publication
not applicable
Availability of data and material
The datasets used and/or analyzed during the current study are available from the corresponding author on reasonable request
Competing interests
Dr. Zimmerman and Dr. Lin have active research grants from Sanofi Pasteur, Merck & Co., Inc., and Pfizer Inc. Dr. Nowalk has received or currently receives grant funding from Merck & Co., Inc., Pfizer, Inc., and MedImmune, LLC. Dr. Schaffner is a member of data safety monitoring boards for Merck and Pfizer, and has served as a consultant for Dynavax, Novavax, GSK, Sanofi-Pasteur and Seqirus. Dr. Harrison is on a scientific advisory board for GSK. All other authors have no competing interests to disclose.
Abbreviations
- ABCs
Active Bacterial Core surveillance
- ACIP
Advisory Committee for Immunization Practices
- CAPITA
Community-Acquired Pneumonia Immunization Trial in Adults
- CDC
Centers for Disease Control and Prevention
- CE
cost-effectiveness
- IPD
invasive pneumococcal disease
- NBP
non-bacteremic pneumococcal pneumonia
- PCV13
13-valent pneumococcal conjugate vaccine
- PPSV23
23-valent pneumococcal polysaccharide vaccine
- QALY
quality- adjusted life year
Authors’ contributions
ARW and KJS performed the analysis, based on a model they built with input from RKZ, MPN, CJL, LHH, and WS. ARW and KJS drafted the manuscript with critical revision by RKZ, MPN, CJL, LHH, and WS. All authors read and approved the final manuscript.
Supplementary material
Supplemental data for this article can be accessed on the publisher’s website
Disclosure of potential conflicts of interest
No potential conflict of interest was reported by the authors.
References
- 1.Tomczyk S, Bennett NM, Stoecker C, Gierke R, Moore MR, Whitney CG, Hadler S, Pilishvili T.. Use of 13-Valent pneumococcal conjugate vaccine and 23-valent pneumococcal polysaccharide vaccine among adults aged ≥ 65 years: recommendations of the Advisory Committee on Immunization Practices (ACIP). Morb Mortality Wkly Rep. 2014;63:822–25. [PMC free article] [PubMed] [Google Scholar]
- 2.Pilishvili T. Changes in Invasive Pneumococcal Disease (IPD) following 5 years of 13-valent pneumococcal conjugate vaccine use in the U.S. advisory committee on immunization practices: october 2016 meeting. National Center for Immunization and Respiratory Diseases; 2016. [Google Scholar]
- 3.Williams WW, Lu P-J, O’Halloran A, Kim DK, Grohskopf LA, Pilishvili T, Skoff TH, Nelson NP, Harpaz R, Markowitz LE, et al. Surveillance of vaccination coverage among adult populations- United States, 2014. MMWR Surveillance Summary. 2016;65(1):1–40. doi: 10.15585/mmwr.ss6501a1. [DOI] [PubMed] [Google Scholar]
- 4.Michaelidis CI, Zimmerman RK, Nowalk MP, Smith KJ. Cost-effectiveness of programs to eliminate disparities in elderly vaccination rates in the United States. BMC Public Health. 2014;14(718):1–10. doi: 10.1186/1471-2458-14-1. [DOI] [PMC free article] [PubMed] [Google Scholar]
- 5.Smith KJ, Zimmerman RK, Nowalk MP, Lin CJ. Cost-effectiveness of the 4 pillars practice transformation program to improve vaccination of adults aged 65 and older. J Am Geriatr Soc. 2017;65(4):763–68. doi: 10.1111/jgs.14588. [DOI] [PMC free article] [PubMed] [Google Scholar]
- 6.United States Census Bureau 2015: ACS 1-year estimates detailed tables. [accessed 2018. December 3] https://data.census.gov/cedsci/results/tables.
- 7.Moore MR, Link-Gelles R, Schaffner W, Lynfield R, Lexau C, Bennett NM, Petit S, Zansky SM, Harrison LH, Reingold A, et al. Effect of use of 13-valent pneumococcal conjugate vaccine in children on invasive pneumococcal disease in children and adults in the USA: analysis of multisite, population-based surveillance. Lancet Infect Dis. 2015;15:301–09. doi: 10.1016/S1473-3099(14)71081-3. [DOI] [PMC free article] [PubMed] [Google Scholar]
- 8.Jackson LA, Benson P, Sneller V-P, Butler JC, Thompson RS, Chen RT, Lewis LS, Carlone G, DeStefano F, Holder P, et al. Safety of revaccination with pneumococcal polysaccharide vaccine. J Am Med Assoc. 1999;281:243–48. [DOI] [PubMed] [Google Scholar]
- 9.Blackwell DL, Lucas JW, Clarke TC. Summary health statistics for U.S. adults: national health interview survey, 2012. National Center Health Stat Vital Health Stat. 2014;10:1–171. [PubMed] [Google Scholar]
- 10.Centers for Disease Control and Prevention Active bacterial core surveillance report, emerging infections program network, Streptococcus pneumoniae. 2015. [accessed 2018 Dec 3]. https://www.cdc.gov/abcs/reports-findings/survreports/spneu15.pdf.
- 11.American Lung Association Reseach and program services. Epidemiology and statistics unit. Trends in Pneumonia and Influenza Morbidity and Mortality. 2010. p. 1–39.
- 12.Metersky ML, Dransfield MT, Jackson LA. Determining the optimal pneumococcal vaccination strategy for adults: is there a role for the pneumococcal conjugate vaccine? Chest. 2010;138(3):486–90. doi: 10.1378/chest.10-0738. [DOI] [PubMed] [Google Scholar]
- 13.CDC Vaccine Price List Centers for disease control and prevention. [accessed 2018. May 26]. http://www.cdc.gov/vaccines/programs/vfc/awardees/vaccine-management/price-list/.
- 14.Medicare Physician Fee Schedule [accessed 2018 Dec 3]. https://www.cms.gov/apps/physician-fee-schedule/.
- 15.Smith KJ, Wateska AR, Nowalk MP, Raymund M, Nuorti JP, Zimmerman RK. Cost-effectiveness of adult vaccination strategies using pneumococcal conjugate vaccine compared with pneumococcal polysaccharide vaccine. J Am Med Assoc. 2012;307(8):804–12. doi: 10.1001/jama.2012.169. [DOI] [PMC free article] [PubMed] [Google Scholar]
- 16.Agency for Healthcare Research and Quality Healthcare Cost and Utilization Project (HCUP). [accessed 2018 Dec 3]. www.ahrq.gov/research/data/hcup/index.html. [PubMed]
- 17.Anderson WL, Armour BS, Finkelstein EA, Wiener JM. Estimates of state-level health-care expenditures associated with disability. Public Health Rep. 2010;125(1):44–51. doi: 10.1177/003335491012500107. [DOI] [PMC free article] [PubMed] [Google Scholar]
- 18.Gold MR, Franks P, McCoy K, Fryback DG. Toward consistency in cost-utility analyses: using national measures to create condition-specific values. Med Care. 1998;36:778–92. [DOI] [PubMed] [Google Scholar]
- 19.Sisk JE, Whang W, Butler JC, Sneller V-P, Whitney CG. Cost-effectiveness of vaccination against invasive pneumococcal disease among people 50 through 64 years of age: role of comorbid conditions and race. Ann Intern Med. 2003;138:960–68. [DOI] [PubMed] [Google Scholar]
- 20.Mangen MJ, Huijts SM, Bonten MJ, de Wit GA. The impact of community-acquired pneumonia on the health-related quality-of-life in elderly. BMC Infect Dis. 2017;17(1):208. doi: 10.1186/s12879-017-2757-2. [DOI] [PMC free article] [PubMed] [Google Scholar]
- 21.Suzuki M, Dhoubhadel BG, Ishifuji T, Yasunami M, Yaegashi M, Asoh N, Ishida M, Hamaguchi S, Aoshima M, Ariyoshi K, et al. Serotype-specific effectiveness of 23-valent pneumococcal polysaccharide vaccine against pneumococcal pneumonia in adults aged 65 years or older: a multicentre, prospective, test-negative design study. Lancet Infect Dis. 2017;17(3):313–21. doi: 10.1016/S1473-3099(17)30049-X. [DOI] [PubMed] [Google Scholar]
- 22.Berical AC, Harris D, Dela Cruz CS, Possick JD. Pneumococcal vaccination strategies: an update and perspective. Ann Am Thorac Soc. 2016;13(6):933–44. doi: 10.1513/AnnalsATS.201511-778FR. [DOI] [PMC free article] [PubMed] [Google Scholar]
- 23.Stoecker C, Kim L, Gierke R, Pilishvili T. Incremental cost-effectiveness of 13-valent pneumococcal conjugate vaccine for adults age 50 years and older in the United States. J Gen Intern Med. 2016;31(8):901–08. doi: 10.1007/s11606-016-3651-0. [DOI] [PMC free article] [PubMed] [Google Scholar]
- 24.Blommaert A, Bilcke J, Willem L, Verhaegen J, Goossens H, Beutels P. The cost-effectiveness of pneumococcal vaccination in healthy adults over 50: an exploration of influential factors for Belgium. Vaccine. 2016;34:2106–12. doi: 10.1016/j.vaccine.2016.03.003. [DOI] [PubMed] [Google Scholar]
- 25.Dirmesropian S, Wood J, MacIntyre C, Newall A. A review of economic evaluations of 13-valent Pneumococcal conjugate Vaccine (PCV13) in adults and the elderly. Hum Vaccin Immunother. 2015;11(4):818–25. doi: 10.1080/21645515.2015.1011954. [DOI] [PMC free article] [PubMed] [Google Scholar]
- 26.Weycker D, Sato R, Strutton D, Edelsberg J, Atwood M, Jackson LA. Public health and economic impact of 13-valent pneumococcal conjugate vaccine in US adults aged ≥ 50 years. Vaccine. 2012;30:5437–44. doi: 10.1016/j.vaccine.2012.05.076. [DOI] [PubMed] [Google Scholar]
- 27.Matanock A. Invasive pneumococcal disease in the U.S.—2008–2016. [accessed 2018 Dec 3]. https://www.cdc.gov/vaccines/acip/meetings/downloads/slides-2017-10/pneumo-04-matanock.pdf.
- 28.Bochud P-Y, Moser F, Erard P, Verdon F, Studer JP, Villard G, Cosendai A, Cotting M, Heim F, Tissot J, et al. Community-acquired pneumonia. A prospective outpatient study. Medicine (Baltimore). 2001;80:75–87. [DOI] [PubMed] [Google Scholar]
- 29.Claxton K, Sculpher M, McCabe C, Briggs A, Akehurst R, Buxton M, Brazier J, O’Hagan T. Probabilistic sensitivity analysis for NICE technology assessment: not an optional extra. Health Econ. 2005;14:339–47. doi: 10.1002/hec.985. [DOI] [PubMed] [Google Scholar]
- 30.Grabenstein JD, Manoff SB. Pneumococcal vaccines in adults: assessing the evolving evidence. Vaccine. 2011;29(37):6149–54. doi: 10.1016/j.vaccine.2011.06.116. [DOI] [PubMed] [Google Scholar]
- 31.Musher DM. Should committees that write guidelines and recommendations publish dissenting opinions? Mayo Clinic Proc. 2016;91(5):634–39. doi: 10.1016/j.mayocp.2016.01.018. [DOI] [PubMed] [Google Scholar]
- 32.Grijalva CG, Nuorti JP, Arbogast PG, Martin SW, Edwards KM, Griffin MR. Decline in pneumonia admissions after routine childhood immunisation with pneumococcal conjugate vaccine in the USA: a time-series analysis. Lancet. 2007;369(9568):1179–86. doi: 10.1016/S0140-6736(07)60564-9. [DOI] [PubMed] [Google Scholar]
- 33.Weycker D, Strutton D, Edelsberg J, Sato R, Jackson LA. Clinical and economic burden of pneumococcal disease in older US adults. Vaccine. 2010;28(31):4955–60. doi: 10.1016/j.vaccine.2010.05.030. [DOI] [PubMed] [Google Scholar]
- 34.Simonsen L, Taylor RJ, Schuck-Paim C, Lustig R, Haber M, Klugman KP. Effect of 13-valent pneumococcal conjugate vaccine on admissions to hospital 2 years after its introduction in the USA: a time series analysis. Lancet Respir Med. 2014;2(5):387–94. doi: 10.1016/S2213-2600(14)70032-3. [DOI] [PubMed] [Google Scholar]
- 35.Jain S, Self WH, Wunderink RG, Fakhran S, Balk R, Bramley AM, Reed C, Grijalva CG, Anderson EJ, Courtney DM, et al. Community-acquired pneumonia requiring hospitalization among U.S. Adults. N Engl J Med. 2015;373(3):415–27. doi: 10.1056/NEJMoa1500245. [DOI] [PMC free article] [PubMed] [Google Scholar]
- 36.CDC Evidence-based recommendations - GRADE. [accessed 2018 Dec 3]. https://www.cdc.gov/vaccines/acip/recs/grade/about-grade.html.
- 37.Ahmed F, Temte JL, Campos-Outcalt D, Schünemann HJ. Methods for developing evidence-based recommendations by the Advisory Committee on Immunization Practices (ACIP) of the U.S. Centers for Disease Control and Prevention (CDC). Vaccine. 2011;29(49):9171–76. doi: 10.1016/j.vaccine.2011.08.005. [DOI] [PubMed] [Google Scholar]
- 38.Centers for Disease Contol and Prevention (CDC) Adult conditions immunization schedule. National center for immunization and respiratory diseases. 2016. [accessed 2016 June 15]. http://www.cdc.gov/vaccines/schedules/hcp/imz/adult-conditions.html.
- 39.Bonten MJM, Huijts SM, Bolkenbaas M, Webber C, Patterson S, Gault S, van Werkhoven CH, van Deursen AMM, Sanders EAM, Verheij TJM, et al. Polysaccharide conjugate vaccine against pneumococcal pneumonia in adults. N Engl J Med. 2015;372:1114–25. doi: 10.1056/NEJMoa1408544. [DOI] [PubMed] [Google Scholar]
- 40.Falkenhorst G, Remschmidt C, Harder T, Hummers-Pradier E, Wichmann O, Bogdan C. Effectiveness of the 23-Valent Pneumococcal Polysaccharide Vaccine (PPV23) against pneumococcal disease in the elderly: systematic review and meta-analysis. PLoS One. 2017;12(1):e0169368. doi: 10.1371/journal.pone.0169368. [DOI] [PMC free article] [PubMed] [Google Scholar]
- 41.Moberley S, Holden J, Tatham DP, Andrews RM. Vaccines for preventing pneumococcal infection in adults. Cochrane Database Syst Rev. 2013 Jan 31;1:CD000422. [DOI] [PMC free article] [PubMed] [Google Scholar]
- 42.Rudnick W, Liu Z, Shigayeva A, Low DE, Green K, Plevneshi A, Devlin R, Downey J, Katz K, Kitai I, et al. Pneumococcal vaccination programs and the burden of invasive pneumococcal disease in Ontario, Canada, 1995–2011. Vaccine. 2013;31(49):5863–71. doi: 10.1016/j.vaccine.2013.09.049. [DOI] [PubMed] [Google Scholar]
- 43.Gutiérrez Rodríguez MA, Ordobás Gavín MA, García-Comas L, Sanz Moreno JC, Córdoba Deorador E, Lasheras Carbajo MD, Taveira Jiménez JA, Martín Martínez F, Iniesta Fornies D, Arce Arnaez A. Effectiveness of 23-valent pneumococcal polysaccharide vaccine in adults aged 60 years and over in the region of Madrid, Spain, 2008–2011. Eurosurveillance. 2014;19(40):20922. doi: 10.2807/1560-7917.ES2014.19.40.20922. [DOI] [PubMed] [Google Scholar]
- 44.Andrews NJ, Waight PA, George RC, Slack MPE, Miller E. Impact and effectiveness of 23-valent pneumococcal polysaccharide vaccine against invasive pneumococcal disease in the elderly in England and Wales. Vaccine. 2012;30(48):6802–08. doi: 10.1016/j.vaccine.2012.09.019. [DOI] [PubMed] [Google Scholar]
- 45.Arias E. United States life tables, 2011. National Vital Stat Rep. 2015;64:1–63. [PubMed] [Google Scholar]
- 46.Braithwaite RS, Meltzer DO, King JTJ, Leslie D, Roberts MS. What does the value of modern medicine say about the $50,000 per quality-adjusted life-year decision rule? Med Care. 2008;46(4):349–56. doi: 10.1097/MLR.0b013e31815c31a7. [DOI] [PubMed] [Google Scholar]
- 47.Ubel PA, Hirth RA, Chernew ME, Fendrick A. What is the price of life and why doesn’t it increase at the rate of inflation? Arch Intern Med. 2003;163(14):1637–41. doi: 10.1001/archinte.163.14.1637. [DOI] [PubMed] [Google Scholar]
Associated Data
This section collects any data citations, data availability statements, or supplementary materials included in this article.
Supplementary Materials
Data Availability Statement
The datasets used and/or analyzed during the current study are available from the corresponding author on reasonable request