

ABSTRACT
Human beta-defensin-1 (hBD-1) is one of a number of small cationic host-defense peptides. Besides its well-known broad-spectrum antimicrobial function, hBD-1 has recently been identified as a chromosome 8p tumor-suppressor gene. The role of hBD-1 in modulating the host immune response to oncogenesis, associated with cell signaling and potential therapeutic applications, has become increasingly appreciated over time. In this study, multiple approaches were used to illustrate hBD-1 anti-tumor activities. Results demonstrate that hBD-1 peptide alters human epidermal growth factor receptor 2 (HER2) signal transduction and represses retroviral-mediated transgene expression in cancer cells. Loss of orthologous murine defense-1 (mBD1) in mice enhances nickel sulfate-induced leiomyosarcoma and causes mouse kidney cells to exhibit increased susceptibility to HPV-16 E6/7-induced neoplastic transformation. Furthermore, for the first time, a novel function of the urine-derived hBD-1 peptide was discovered to suppress bladder cancer growth and this may lead to future applications in the treatment of malignancy.
KEYWORDS: Host defense, human defensins, tumor inhibitors, tumor therapeutics, tumor-associated macrophages (TAMs), bladder cancer, gene expression, HER2
Introduction
Human beta-defensin-1 (hBD-1) belongs to a group of cationic host-defense peptides that are well-known for their antimicrobial activity and plays a crucial role in the innate host defense system.1 HBD-1 was first associated with renal and prostate cancers through global transcriptome analysis of human tumor tissues.2 Immuno-histochemical studies confirmed that cancer-specific hBD-1loss was found in 90% of the renal clear-cell carcinomas and 82% of the human prostate cancers.2 The hBD-1 gene is located at chromosome 8p23, an area that has been found repeatedly to undergo tumor-associated loss of heterozygosity. Consequently, it has been proposed as one of the “missing” chromosome 8p tumor suppressor genes. As a tumor suppressor, over-expression of hBD-1 was found to induce apoptosis in human renal cancer cells (SW-156) and the prostate cancer cell lines DU-145 and PC-3.3,4 The synthetic hBD-1 peptide was shown to inhibit proliferation of the TSU-Pr1 human bladder cancer cells.3 HBD-1 expression in epithelial cells is altered in multiple human cancers. In oral squamous cell cancer (OSCC), hBD-1 mRNA expression is deficient and the cytotoxic surface effects of hBD-1destroy tumor cells.5 OSCC patients with no expression of hBD-1 have a greater chance of metastasis to lymph node.6,7 The genetic variation observed in OSCC suggests that the difference in the expression of defensins is associated with carcinogenesis and can be a tumor marker for OSCC.6 As a secreted peptide, hBD-1 is highly concentrated at the surface of epithelial cells.8 However, in malignant salivary gland tumors, the intracellular location of hBD-1 peptide shifts from the cytoplasm to the nucleus; this intracellular translocation is believed to be associated with oncogenesis and a sign of tumor recurrence.9,10
As antimicrobial peptides, defensins make HPV and HIV inactive directly and suppress viral replication by altering target cells.11 To promote adaptive immune responses, defensins recruit dendritic cells and T lymphocytes to the viral invasion site; the initial response to viral infection is to increase hBD-1 expression in epithelial cells and plasmacytoid dendritic cells (PDCs).12 In vitro, simplex virus-1 (HSV-1)-induction of hBD-1 mRNA and peptide expression in PDCs occurs as early as 2 h post-HSV-1 exposure.12 In respiratory papillomas increased hBD-1, −2, and −3 expressions were detected in tumor tissue suggesting that hBDs target human papillomavirus-induced epithelial lesions.13 HBD3 has been inducing human Langerhans cell-like DCs activation, migration, and polarization.14 HBD3 also amplifies the signaling response to the viral mimic polyI:C through MDA5/IFIH1 in primary bone marrow or monocyte-derived macrophages from mouse or human.15 Furthermore, hBD-1, −2 and −3- all have anti-HIV-1 activity both in vitro and in vivo.13 A single polymorphism in the hBD-1 gene was found to be associated with HIV-1 infection in a population of children; hBDs secreted in the oral cavity and breast milk may be responsible for protection from HIV-1 transmission.16
Human β-defensins (HBDs) are produced by a wide range of cells throughout the body and influence multiple signaling pathways that are involved in inflammation and immunity.17 HBD-1 is constitutively expressed in respiratory, intestinal, and urogenital tract epithelia and presents in high concentrations at the cell surface, indicating that the peptide plays an important role in epithelial host defense.8 Human epidermal growth factor receptor 2 (HER2) coexists with hBD-1 at the epithelial cell surface. HER2 has no known direct activating ligand. Heterodimerization of the receptor with other family members such as HER1 and HER3 results in autophosphorylation of tyrosine residues within the cytoplasmic domain of the receptors and initiates a variety of signaling pathways leading to cell proliferation and tumorigenesis. HER2 overexpression has been seen in multiple cancers such as breast, ovary, endometrium, bladder, lung, colon, and head and neck.18 Currently targeted therapy reagents for HER2-positive breast cancer are man-made monoclonal antibody and kinase inhibitors.19 Among the identified hBDs, hBD-3 was found to compete with stromal-derived factor 1 (SDF-1), the natural ligand for CXCR4, for cellular binding and blocks SDF-1-induced calcium flux, ERK-1/2 phosphorylation.20 HBD2 and hBD3 along with their mouse orthologous, hBD4 and 14, bind to the chemokine receptor, CCR2, expressed by monocytes, macrophages, and neutrophils. By binding with CCR2 hBD-2 and hBD-3 exhibit chemotactic activity for human peripheral blood monocytes, and mouse peritoneal exudate cells.21 HBDs play multi-functional roles in the innate immune system and adaptive immunity. Yet the underlying mechanisms are still not well understood. As a coexisting neighbor with HER2, the roles of hBD-1 in receptor-triggered events or local interactions with other molecules are incompletely defined.
In this study, we found the tumor-suppressing effect of hBD-1 is associated with its ability to modulate EGFR/HER2-associated signaling pathways; hBD-1 deficiency leads to increased carcinogenesis in mice and renders primary mouse kidney cells more susceptible to HPV-16 E6/7-induced oncogenic transformation. We demonstrate hBD-1 is an inhibitor of retroviral-based gene transduction. Furthermore, hBD-1peptide, isolated from human urine, inhibits bladder cancer cell growth. Future applications might involve using the patient’s own concentrated and heat activated hBD-1 peptide as an autologous treatment for bladder cancer.
Results
hBD-1 targets HER2-mediated cell signaling
We previously reported that hBD-1 induces Caspase-3-mediated apoptosis in SW156 human renal cancer cells, but the same effect was not observed in other tested cell lines.3 HBD-1 anti-tumor activity could be occurring by multiple possible mechanisms.
To define the potential interaction between hBD-1peptide and specific cell-surface receptors, we interrogated HER2, a member of the human epidermal growth factor receptor family that co-exists with hBD-1 at the epithelial cell surface. We selected TSU-Pr1, a human bladder cancer cell line, as it expresses both detectable levels of hBD-1 and HER2. To determine whether hBD-1 regulates HER2 expression we performed a co-culture experiment. TSU-Pr1 bladder cancer cells were co-cultured with TSU-Pr1 cells that were transiently transfected with hBD-1gene (TSU-Pr1/hBD-1). Protein analysis revealed that levels of HER2 expression were significantly reduced in the co-cultured TUS-Pr1cells after 48 hours incubation with TSU-Pr1/hBD-1 cells in hBD-1 peptide-rich medium while the expressions of LacZ controls were increased to parental levels (Figure 1A, 1B). A corresponding decrease in phospho-AKT was also observed (Figure 1A, 1C). To further determine the interaction between the hBD-1 peptide and HER2 receptors, the hBD-1/HER2 protein complex was analyzed in a mixture of BT474 human breast cancer cell lysates and purified human urine hBD-1 peptides. BT474 is known to express a high level of HER2 protein. When a polyclonal hBD-1 antibody was used to pull down target proteins, the HER2 signal was detected with monoclonal HER2 antibody (Figure 2A, 2B). Conversely, the hBD-1 protein was also captured by a HER2 polyclonal antibody in the same protein mixture (Figure 2C). This finding indicates that hBD-1 peptide interacts directly with the HER2 receptor and plays a role in modulating HER2 signaling.
Figure 1.
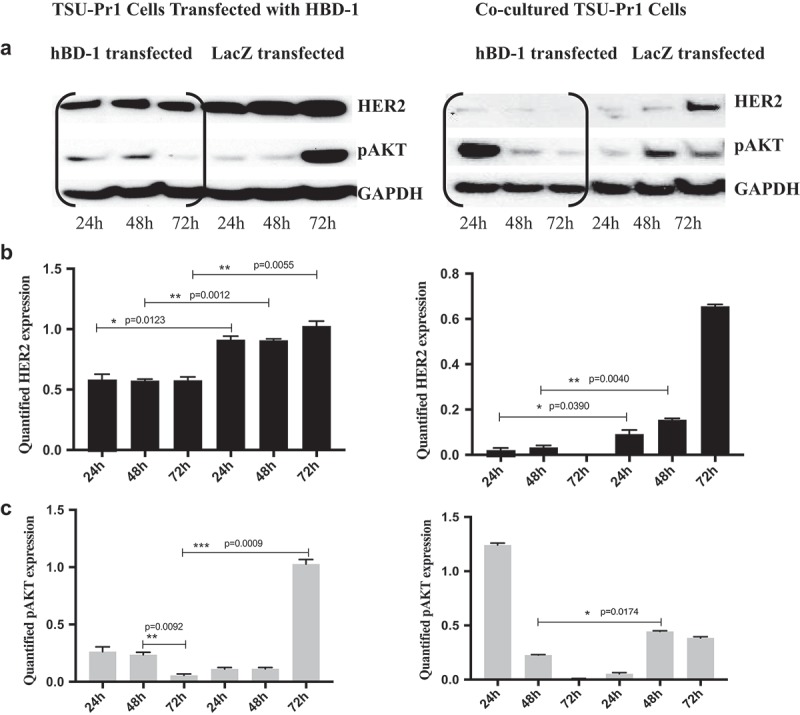
Over-Expression of hBD-1 Inhibits HER2 and AKT signals in TSU-Pr1 Cells a. The protein expression of HER2 and pAKT was analyzed in hBD-1 transfected TSU-Pr1 cells (left) and co-cultured TSU-Pr1 cells (right) at 24, 48, 72 h. Co-culture with hBD-1 rich medium resulted in decreasing both HER2 and pAKT protein expression after 24 h compared with LacZ transfected cells which increased in both HER2 and pAKT protein expressions after 24 h. b. & c. The intensity of HER2 and pAKT expression levels were quantified using ImageJ. Data were normalized to GAPDH expression.
Figure 2.
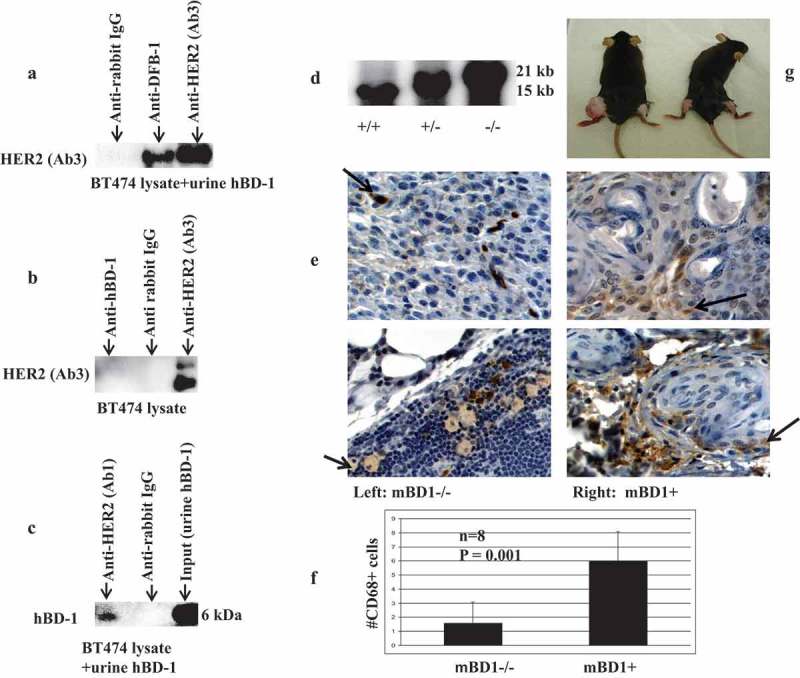
Western analysis of immunoprecipitated HER2 and hBD-1proteins a. HER2 was immunoprecipitated using an hBD-1 antibody as described in methods. The HER2 protein expression was analyzed when anti-hBD-1, anti-rabbit IgG (negative control), and anti-HER2 antibodies (positive control) were used to bait in the mixture of BT474 protein lysate and urine hBD-1peptide. b. The HER2 expression in BT474 protein lysate alone when using anti-hBD-1, anti-rabbit IgG, and anti-HER2 to bait. c. HBD-1 protein expression was analyzed when the anti-HER2 (Ab1) was used to bait in the mixture of BT474 protein lysate and urine hBD-1peptide. Purified urine hBD-1 peptide (input) was used as a positive control. Elution hBD-1peptide from binding antibodies was proceeded with 2x SDS-PAGE loading buffer incubating at 50ºC for 10 min. The acid level in each sample was adjusted with sodium hydroxide; 4–12% NuPAGE Novex Bis-Tris Gel was used for Western blot. d. Genotyping of mBD1 knockout mice: Southern blot was used to identify the genotypes. Radioisotope p32 labeled probe detects both 15 kb wild-type endogenous mBD1 allele and 21kb targeted knockout allele. e. IHC staining of mBD1-/- and mBD1+ tumor tissue sections with anti-CD68. Brown Stained cells present tumor-infiltrating macrophages, monocytes, neutrophils, basophils, and large lymphocytes (activated lymphocytes or NK cells). f. To quantify the CD68+ cells, brown stain cells were counted in four random high power fields in each section. Total of two 5-µm tumor paraffin tissue sections and eight fields in each group were counted. The number of brown stained cells is presented as the ±SEM per high power field. g. Nickel Sulfate induced sarcoma in mBD1-/- mice. Nickel Sulfate was intramuscularly injected into the left leg; dilution vehicle alone was injected into the right leg of each mouse. Photo shows 7 months post-injection. The tumor was formed in the left leg of mBD1-/- mouse. No visible tumors were observed in wild-type control mouse.
Loss of mBD1 promotes nickel sulfate-induced carcinogenesis in mice
To investigate the association between mBD1 deficiency and tumor formation, we induced soft tissue sarcoma in mice by injecting nickel sulfate, a heavy-metal environmental carcinogen.22 We used mBD1 knockout mice.23 which were made from 129/Ola ES cells and backcrossed to C57BL/6. Mice genomes were verified with Southern Blot (2D). Both C57BL/6 and l29/Ola wild-type mice were used as controls. A dose of nickel sulfate, 1.7 mg per mouse, was injected intramuscularly into the left legs of mBD1-/- mice; the right legs were injected with dilution vehicle alone. In wild-type control groups, mice were injected under the same conditions. The results revealed that two out of seven mBD1-/- mice developed sarcomas 7 months post-injection, 90 days earlier than C57BL/6/mBD1 wild-type and 210 days earlier than 129/Ola/mBD1 wild-type mice. The rest of mBD1-/- mice died of unknown causes within the period of 30 days post-injection before visible tumors formed. Tumors were poorly induced in mBD1 wild-type mice; only one out of five C57BL/6 mice developed a small tumor 10 months post-injection. In 129/Ola wild-type group, four out of seven eventually showed tumors at 1.5-year post-injection, 2.5 times longer than tumor development in the mBD1 knockout mice. These results suggest that loss of the mBD1 enhances nickel sulfate-induced carcinogenesis and affects the tumor latency period (Figure 2G).
Loss of mBD1 modulates host anti-tumor immune response
The effect of nickel sulfide is proportional to the amount of Ni particles that are phagocytized by cells. Chronic inflammation induced by nickel sulfide is a major contribution to tumorigenesis and progression.24 Tumor-associated macrophages (TAMs) are major players in cancer-related inflammation. TAMs together with myeloid-derived suppressor cells (MDSC) characterized by suppressing T cell function in tumor-bearing hosts have an important impact on disease progression.25 To understand mBD1mediated cell response to tumor-related inflammation, the nickel sulfide induced tumor tissue was combined and examined for cell surface markers, growth factors, and common cytokines using tissue oligo arrays (Supplemental Data Figure 1, 2). Selected genes involved in MDSC recruitment, markers of M2-polarized TAMs, and cytokines linked to macrophage subset-specific functions were analyzed by real-time RT-PCR and Western blot. Compared to wild-type, mBD1null tumor tissue exhibited increased expression of markers of cytokine colony stimulating factor 1 (CSF-1R), CD206, F4/80, CD163, S100A8, and S100A9 in macrophages, CD80 in B cells, CD34 in stromal cells, and decreased expression of CD94 in natural killer T cell (Figure 3A). Among these upregulated factors, CSF-1R, CD206, CD163, and F4/80 are markers to distinguish TAM subsets that behave more aggressively in migration/penetration function, angiogenesis, and survival time.26 In the same tumor tissue, inflammatory cytokines, such as TNF-a, IL-10, IL-1β, IL-1ra, and vascular endothelial growth factor (VEGF), were all enhanced in expression compared to the wild type, indicating the cellular environment was in favor of MDSCs recruitment, TAM-M2 phenotype differentiation, and promoting tumor cells to develop metastasis.27 The wild-type tumor, by contrast, expressed higher in STAT1and IFNγ produced predominantly by natural killer (NK) and natural killer T (NKT) (Figure 3B). Moreover, the tumor with null mBD1 peptide showed higher protein levels of inducible nitric oxide synthase (iNOS) and phosphorylated epidermal growth factor receptor (EGFR/pEGFR) suggesting loss of mBD1 increases cell sensitivity to tyrosine kinase-mediated cellular proliferation, survival, and angiogenesis (Figure 3C, 3D). To further compare host response to the chronic inflammation and tumor, immunochemical staining of CD-68 in tumor sections was performed and positively stained cells were counted. Induction of CD68, a member of scavenger receptors, targets activated neutrophils and macrophages in an inflammatory response. The brown cytoplasmic stained cells were counted at four random high power fields in each section; a total of two 5-µm paraffin tissue sections and eight fields in each tumor were quantified. As the photos showed in the wild-type mouse tumor, the CD68+ cells were predominantly seen and more frequently infiltrated into the neoplastic lesions; in mBD1-/- mouse tumor, the scattered CD 68+ cells were mostly noted at the tumor capsule area (Figure 2E, 2F). Overall these data suggest that loss of mBD1 allows evasion of host immune response by decreasing the number of tumor-infiltrating macrophages, neutrophils, and natural killer cells meanwhile increasing pro-inflammatory cytokines and the population of M2-like TAMs characterized by poor antigen-presenting capability and tumor promotion.
Figure 3.
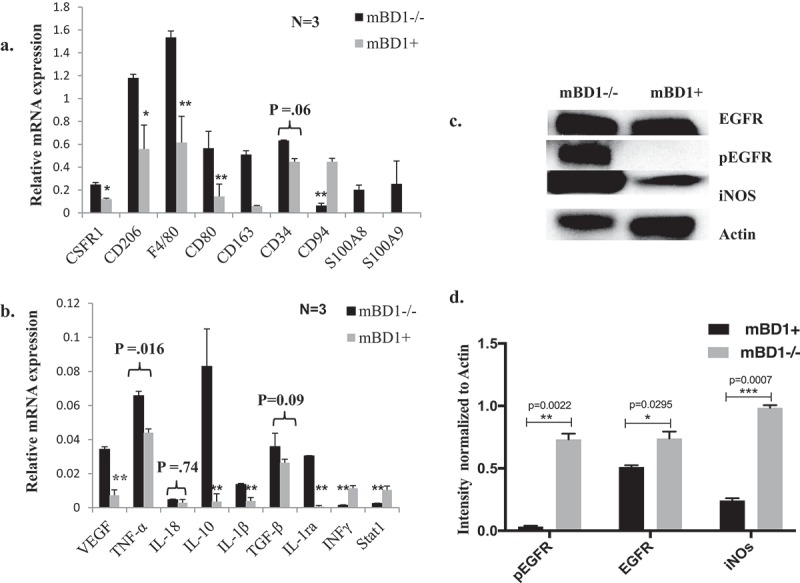
Gene Expressions in Nickel sulfate induced tumors. a & b. Genes that are associated with TAM and pro-tumor inflammatory mediators were analyzed by quantified RT-PCR compared to wild-type controls. Samples were triplicates in each group. Results represent mean ± SD of triplicates in two separate experiments. Paired t-test was performed to compare the means of the data from two related groups. Real p-values are reported for some samples. The rest samples are labeled as *p < 0.05 and **p < 0.01. c. Protein lysates of Nickel sulfate induced tumors were analyzed by Western blot. The expression of EGFR, pEGFR, and iNOS was analyzed in mBD1-/- tumor tissue and wild-type control. d. The Western signals were quantified using ImageJ and normalized to Actin.
Loss of mBD1 enhances E6/E7 induced cellular transformation
To test whether the loss of mBD1 affects cellular response to viral carcinogens, mouse kidney mBD1-/- cells were infected with the amphotropic retrovirus LXSN16E6E7 (ATCC). As expected, transduction of the E6/E7 oncogene efficiently transformed mBD1 -/- cells. Protein analysis of cell lysates at day 7 post-transduction showed an increased expression of HER2, HRAS, and pERK (Figure 4A). In contrast, wild-type mouse kidney cells were not transformed by the same viral titer and became growth arrested. Eventually, all wild-type cells died after one subculture in selection medium. To determine that the loss of mBD1 was responsible for the altered gene expression, the mBD1 gene was re-expressed in the transformed mBD1-/- mouse kidney cells by lipofectamine mediated gene transfection. The expression of mBD1 mRNA was verified using RT-PCR (Figure 4B). The protein expressions of HER2, pERK, and pSP-6 were decreased while the mBD1-/- mouse kidney cells were re-expressing mBD1 (Figure 4C). The results suggest the loss of mBD1 weakens resistance to transformation through the activation of oncogenic signaling pathways.
Figure 4.
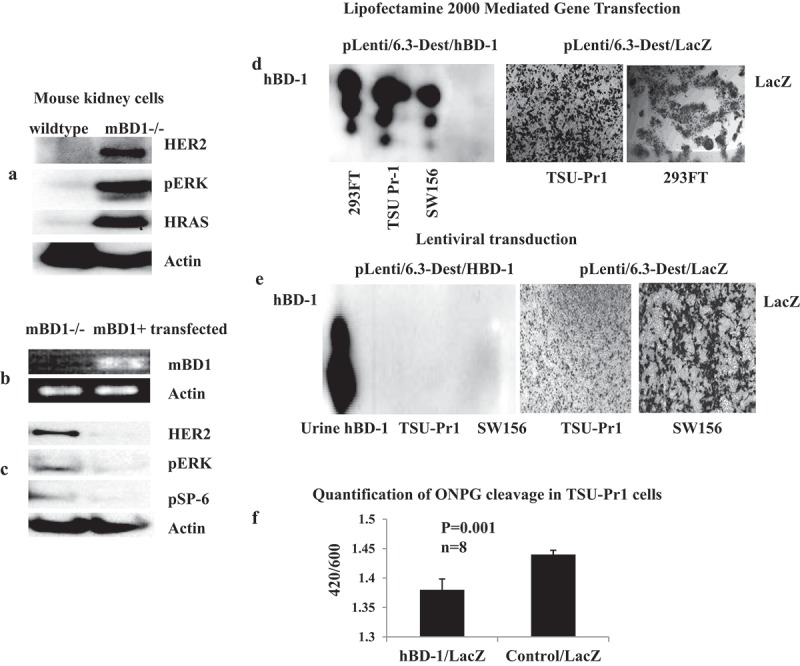
HBD-1 modulates HER2-ERK pathway and inhibits retroviral transgene expression. a. The mBD1-/- mouse kidney cells were infected with amphotropic retrovirus LXSN16E6E7. Protein was analyzed by Western blot for HER2-RAS-ERK pathway signals at the 7th day of post-infection. b. The hBD-1 coding sequence, pLenti6.3/hBD-1, was transfected into the transformed mBD1-/- mouse kidney cells. Gene expression was verified by RT-PCR. c. After hBD-1 gene was transfected, protein lysates from hBD-1 transfected mouse kidney cells were analyzed to compare the expressions of HER2, pERK, and pSP-6 with the mBD1-/- mouse kidney cells that were not transfected. d. Lentiviral vector contained hBD-1 coding sequence (pLenti6.3/hBD-1) was transfected into 293FT package cells, TSU-Pr1, and SW156 mediated with Lipofectamine 2000. At 48 h post-transfection protein was harvested from culture medium with Carboxymethyl beads and analyzed by Western blot for hBD-1 protein expression; the gene LacZ expression was a control for transfection efficiency and detected by x-gal staining. e. Target cells, TUS-Pr1 and SW156 were infected with Lenti/hBD-1 and control Lenti/LacZ recombined viruses produced with ViraPower HiPerform Lentiviral Expression Systems (Invitrogen, Grand Island, NY). The levels of protein expression were analyzed at day 7 post-infection by Western blot for hBD-1and x-gal staining for LacZ. f. TSU-Pr1 cells were previously transfected with pcDNA3.1/hBD-1 or pcDNA3.1 empty vector and then infected with pLenti6.3/LacZ viral particles. The beta-Galactosidase function was measured at 24 h post-infection by quantification of ONPG cleavage. The pcDNA3.1 empty vector was used as a control. Abs420 is the absorbance of the yellow o-nitrophenol, Abs600 reflects cell density.
HBD-1 inhibits transgene expression via recombinant lenti-associated vectors
Defensins, such as alpha-defensin-1, beta-defensin-2 and rhesus θ−defensin-1 were previously reported to inhibit HIV-1 replication at physiological concentrations.11 Here we investigated HIV-1-based Lentiviral vector system mediated hBD-1 transduction and protein expression. The vector pLenti/6.3-Dest (Invitrogen, Grand Island, NY) constructed with the hBD-1 coding sequence and verified hBD-1 protein expression demonstrated via gene transfection in 293FT package cells, TSU-PR1, and SW156 cells (Figure 4D). The same construct was used to produce recombinant virus in package cells with the third generation Lentiviral packaging system, pMDL g/p RRE + pRSV-Rev + pMD2G + pLV vectors, in which Tat is eliminated, and the 5ʹLTR U3 enhancer is replaced by an RSV promoter (Invitrogen, Grand Island, NY). Additionally, the secondary generation Lentiviral packaging system, PCMVR8.91 + PMD-G vectors, that contains Tat protein (trans-activator of transcription) and is driven by wild-type HIV 5ʹLTR U3 (Clontech, Mountain View, CA) was tested as well. On day 4 post-co-transfection of the packaging vectors, the viral particles were harvested from the culture medium and used to infect to target cells, TSU-PR1, SW156, and mouse kidney mBD1-/- cells. The level of protein expression was then measured at day 7 by Western blot for hBD-1 and X-gal staining for LacZ controls. The result demonstrates that hBD-1 protein was absent in the medium of all infected cell lines, while the LacZ control showed robust signal (Figure 4E). Five repeated experiments mediated by either the second or third generations of Lentiviral packaging systems showed lack of hBD-1 protein translation in all transduced cell lines suggesting that this phenomenon is associated with hBD-1 interruption of viral transgene expression and independent of Tat transactivation (Table 1). In mBD1-/- mouse kidney cells that have no endogenous mBD1 peptide, several transduced clones formed and showed mBD1 mRNA transcription but protein translation was undetectable (data not shown). To further determine the role of hBD-1 in inhibition of gene transduction, the efficiency of LacZ gene expression in the presence of hBD-1 peptide was evaluated in transduced cells. The level of beta-galactosidase production in TSU-Pr1 cells that were infected with Lenti/LacZ viral particles was measured at 24 h post infection. Compared to the TSU-Pr1 cells that were previously transfected with an empty vector, beta-galactosidase activity was reduced by 40% in the cells that had over-expressed hBD-1peptide (Figure 4F).28 These results suggest both endogenous and exogenous hBD-1 peptides that endure in tissue culture medium play a role in interrupting lentiviral transgene expression.
Table 1.
Over-expression hBD-1 protein in cancer cells.
| Name | Cell Type | pcDNA3.1/hBD1 Transfection with Lipofectamin 2000 or FuGENE6 |
pLenti6.3/hBD1 Transfection with Lipofectamin2000 or FuGENE6 |
pLenti6.3/hBD1 Lentiviral transduction |
|---|---|---|---|---|
| PC-3 | Human prostate cancer | - | - | - |
| DU145 | Human prostate cancer | + | + | - |
| SW156 | Human hypernephroma | + | + | - |
| TSU-Pr1 | Human bladder cancer | + | + | - |
| mBD1-/- Cells | mouse kidney | - | - | - |
| 3LL | mouse lung cancer | - | - | - |
| BT474 | Human breast cancer | - | - | - |
| Hela | Human cervical cancer | - | - | - |
| SKOV3 | Human ovarian cancer | - | - | - |
| RAG | mouse kidney adenocarcinoma | - | + | - |
| 293FT | Lentivirus packaging cells | + | + | n/a |
(+) = hBD1 protein was detectable in the cultural medium by Western blot
(-) = hBD1 protein was not detectable in the cultural medium by Western blot
Urinary hBD-1: a natural bladder cancer inhibitor
Over-expression of hBD-1 kills human kidney cancer cells SW156; synthetic hBD-1 peptide inhibits bladder cancer cells TSU-Pr1 growth.3 In this study, with sustained hBD-1 expression, cell death was observed in mouse kidney cancer cells RAG within 3 weeks while the vector controls were forming robust foci. The hBD-1 transfected RAG cells appeared healthy initially and formed colonies, once cell death was initiated, colonies were completely destroyed within hours (Figure 5H, 5I). Human kidney produces the most hBD-1 of any organ; the concentration of purified hBD-1 peptides in voided urine varies from 10 −100 µg/liter.8 The effects of the variable hBD-1 levels and the influence in controlling viral infection or local tumor incidences remain unknown. To determine the role that urine-derived hBD-1 peptide plays in relation to urinary tract malignancies, we treated bladder cancer cells TSU-Pr1 with purified urine hBD-1 peptide at concentrations of 3.125–6.25 µg/ml (0.8 µM −1.6 µM) q.d. in heat activated and non-heat activated forms. According to a previous study, hBD-1 plasma concentration in healthy population was 8.85 ng/mL, 7.46–9.69, p < 0.001 measured using ELISA29 The cellular proliferation rate and protein levels in the treated cells were analyzed at multiple time points (Figure 5A, 5B). The heat activated peptide inhibited cell growth at 24 and 48 h in a dose-dependent manner (Figure 5A). Compared to BSA controls, cells treated with the higher dose of 6.25 µg/ml achieved up to 35% of the growth inhibition at 48 h (Figure 5A). Protein analysis indicated that HER2 epidermal growth factor receptor was significantly downregulated at this period of time (Figure 5B, 5C). Cell death and morphological changes were observed in culture (Figure 5F, 5G). Non-heat activated peptide showed a similar effect on TSU-Pr1 cells but required a 2–3 fold longer treatment time (data not shown). A cell viability assay was performed on TSU-Pr1 cells; the value of LC50 measured at 48 h post-treatment was 0.364 µM (Supplemental Date Figure 3).
Figure 5.
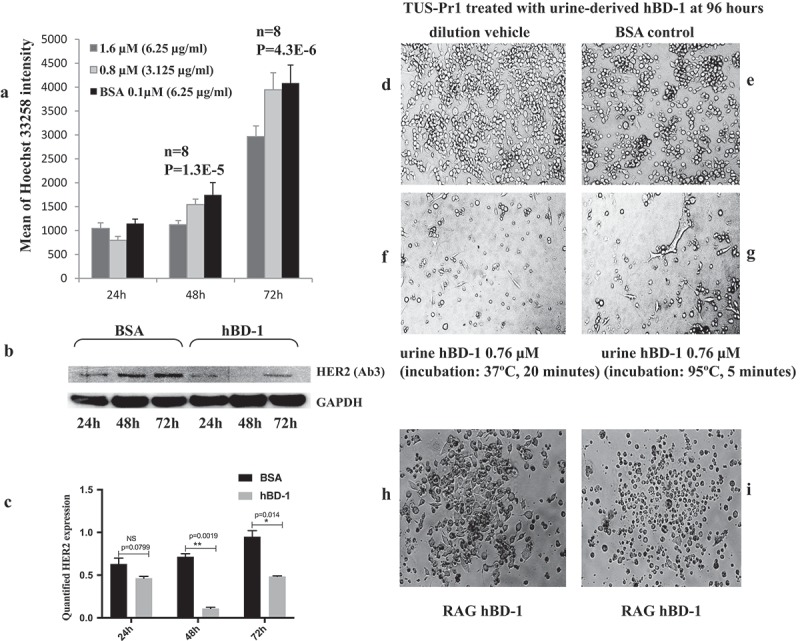
HBD-1 peptide kills Cancer Cells a. TSU-Pr1 cells were treated with urine-derived hBD-1peptide at 0.8 µM (3.125μg/ml) and 1.6 µM (6.25µg/ml) daily. Cell proliferation was measured by Hoechst binding to dsDNA at 24, 48, and 72 h post-treatment. BSA was used as a control. b. The protein from the1.6 µM (6.25µg/ml) treated cells was analyzed using Western blot for HER2 and GAPDH expressions. c. HER2 expression at different time points was quantified using ImageJ and normalized by GAPDH. d. TSU-Pr1 cells growing in dilution media at 96 h. e. TSU-Pr1 cells treated with 3µg/ml of BSA in dilution media q.d. at 96 h. f. TUS-Pr1 cells treated with urine-derived hBD-1 peptide 3µg/ml (0.76 µM), q.d. at 96 h. The peptides were incubated at 37ºC for 20 min prior to treatment. g. TSU-Pr1 cells treated with urine-derived hBD-1 peptide 3µg/ml (0.76 µM), q.d. at 96 h. The peptides were incubated at 95ºC for 5 min prior to treatment. h. RAG mouse kidney cancer cells were transfected with pLenti6.3/hBD-1 followed by selection with Blasticidin 10 µg/ml. A cell colony was formed by day 14 post- transfection. i. The same RAG cell colony showed cell death overnight on day 21 post-transfection.
Discussion
To investigate hBD-1 anti-tumor mechanisms, we compared the effects of carcinogen-induced neoplasm in mBD1 null animals to wild-type controls. The findings of enhanced tumor induction by nickel sulfide in mBD1 null mice demonstrate that mBD1 is a natural host carcinogenic barrier in vivo. Tumor tissue analysis uncovered the details of tumor progression and macrophage-mediated host defense in the mBD1 null tumor microenvironment. The lower number of tumor-infiltrating macrophages and CD94+ NK cells observed in the mBD1 null tumors support the hypothesis that hBD-1 may function as a cytokine for antigen-presenting cells, especially macrophages and dendritic cells to regulate their tumor infiltration, both directly and indirectly through the other cytokines.30,31 Most important, the presence of mBD1peptide is critical in regulating macrophage differentiation. Although the detection on the basis of CD68 did not allow us to identify the macrophage subsets of M1 or M2, three other currently used M2 markers, CD206, CD163, F4/80, were increased in mBD1 null tumor tissue, indicating that tumor-associated macrophages M2 (TAMs-M2) were present, predominantly in mBD1 null tumors.32 In tumor development, high levels of TGF-β produced in TAMs and MDSCs favor tumor growth, metastasis, and immune escape.33 TGF-β demonstrated to promote macrophage polarization toward an M2-like phenotype characterized by increased expression of the anti-inflammatory cytokine IL-10 and mannose receptor CD206 in macrophages.34 Our findings in mBD1 null tumors support this theory, though with slight increases TGF-β expression. The role of TGF-β is mainly regulated by the level of activation rather than the amount of inactive TGF-β to be transcribed.35 Tumor without hBD-1 grows faster with more severe inflammatory events, that can trigger the activation of TGF-β in vivo and add more factors to impair T and NK cell functions contributing to the level of immunoparalysis.35 To evaluate whether this is TGF-β-dependent regulation, two TGF-β negative regulators, IL-12/IL-18, were examined as well. The expression of IL-12/IL-12p40 was low or undetectable in both mBD1null tumor tissue and wild-type (data not shown); the mean gene expression of IL-18 was not significantly different between these two tested groups (Figure 3B). This suggests that mBD1 involved TGF-β/IL-10/IL-12/IL-18 paradigmatic regulation in the development and differentiation of T helper cells subsets is affected dynamically by more factors. In addition, the enhanced expression of CSF1R along with increased CSF1peptides (Supplemental Data Figure 2), VEGF, cytotoxic mediators such as TNF-α, IL-1RA, IL-1β, IL-10, S100A8/A9, and iNOS, constitute a pro-tumor inflammatory reaction and favor the adoption of TAMs-M2 towards carcinogenesis.36 Typically, M2-like population presents antigen less efficiently, displays little tumoricidal activity, produces angiogenic factors, and promotes tumor development.37 The CD68+CD206+ M2 TAMs in human lung cancers were found to be significantly associated with p-TNM staging, lymph node metastasis, and poor prognosis.38 Loss of mBD1 upregulated the expression of pEGFR, VEGF, and iNOS, suggesting this small peptide plays a role in modulating EGFR-VEGF(R) pathways.39,40 One of the host defense mechanisms of mBD1 could be acting as EGFR kinase inhibitor to directly block the EGFR/HER activation on the cell surface and/or indirectly via inhibiting the differentiation of M2-like TAMs to attenuate the positive feedback cycle between TAM-derived epidermal growth factor (EGF) and tumor-derived colony-stimulating factor (CSF)-1.25,37 Besides the classical membrane-associated EGFR/HER activation, loss of mBD1 peptide may intensify HER-family member translocation to the nucleus where they regulate transcription via EGFR and STAT3 interactions. This process tends to produce inducible nitric oxide synthase (iNOS) which, in turn, leads to increased cellular nitric oxide (NO) and mediates angiogenesis.41 Overall, enhanced expression of TAM-associated factors in the mBD1null tumors, such as GM-CSF, IL-10, TGF-β, and IL-1β, along with increased iNOS and VEGF, contributes to MDSCs recruitment, intensifies their immune suppressive activities, and is associated with poor prognosis.38,42,43
In this study, increased expression of CD34 in stromal cells, as well as high CSF-1, was observed in the mBD1null tumors. CD34+ stromal cells, also called CD34+ dendritic interstitial cells, are precursors of mature macrophages.44 In the presence of high CSF-1, CD34+ cells could be promoted to differentiate to immature DC/macrophages via generating CD14+ antigen-presenting cells (APCs) (Supplemental Data Figure 2).45,46 Similar to the functionally polarized M2-like TAM, immature macrophages play a key role in promoting tumor growth.47 To date, multiple types of CD34 over-expressing sarcomas have been reported in the locations where hBD-1 is normally in high concentrations, such as alveolar soft tissue sarcoma, gastrointestinal stromal tumors, granulocytic sarcoma, Kaposi’s sarcoma, and myofibrosarcoma of the breast.48 Further investigation is crucial to determine whether loss of hBD-1 is associated with a high CD34+ sarcoma formation in these locations.
Our study demonstrates that:
Both transfected and urine-derived hBD-1 peptides inhibit cancer cell proliferation as well as altering HER2 expression and phosphorylation of AKT and ERK.
Chronic inflammation induced mBD1 null tumors to enhance pEGFR compared to the wild-type.
HPV-16E6E7 transduced mBD1 null mouse kidney cells upregulate HER2, KRAS and phosphorylated ERK.
Re-expression of mBD1 was able to successfully reduce the expression of HER2, pERK, and pSP-6.
These data support the hypothesis that hBD-1 contributes to cancer suppression via regulation of the HER2/EGFR pathway. The decreased HER2 expression in TSU-Pr1 cells, while in co-culture with hBD-1 peptide-rich medium, and the co-immunoprecipitation of hBD-1 and HER2, suggest a direct interaction between these two molecules.
The question remains whether hBD-1’s anti-tumor function is independent of its anti-microbial function. Our data demonstrate that loss of mBD1 in mouse kidney cells leads to an increased susceptibility to retrovirus LXSN16E6E7 infection, resulting in spontaneous cell transformation with enhanced HRAS and p-ERK expression. Lentiviral vector-carrying hBD-1 coding sequences were silenced in their protein translation following transduction and integration in target cells. The decreased LacZ gene expression in the presence of hBD-1 peptide suggests that the efficiency of recombinant retrovirus infection and DNA integration may be interrupted as well. Loss of hBD-1 altered HER2 and p-ERK expression, suggesting that HER2 enhances the retroviral transduction efficiency while hBD-1 protects cells from retrovirus-mediated transformation.
Finally, we found that heat-activated urine hBD-1 peptide kills bladder cancer cells and slows their proliferation. Urine is a convenient resource for large amounts of hBD-1 and could contribute to a new treatment for bladder cancer using the patient’s own concentrated and heat-activated hBD-1 peptide as an autologous local drug for intra-vesical installation. This unique and novel approach could be beneficial in avoiding deleterious side effects of other intra-vesical therapies, including toxic and immune responses while reducing cost.
Methods and materials
Cell culture
Human prostate cancer cell lines DU145 and PC-3, human kidney cancer cell line SW156 and mouse kidney cancer cell line RAG were purchased from ATCC. Bladder cancer cell line TSU-Pr-1 was obtained from Dr. Guang-Zhe Wu (Emory University); lung cancer cell line 3LL, breast cancer cell line BT-474, and human ovarian cancer cell line SK-OV-3 were obtained from Dr. Lily Yang (Emory University). The primary mBD1 null kidney cells and wild-type control cells were isolated from the kidneys of 7 −14 day-old pups of mBD1-/- and mBD1+ mice using a published protocol.49 Mouse kidney cell colonies were selected using E-Cadherin expression as a marker of kidney epithelial cells.50 All cells were maintained in RPMI 1640 culture media with 10% fetal bovine serum (FBS). For stable transfection and transduction selection, the medium was supplemented with 800 μg-1000μg/ml of G418 (Invitrogen, Carlsbad, CA). Mycoplasma test for all cell lines was performed every six months.
Plasmids
The hBD-1 coding sequence was removed from the commercial hBD-1 expression vector pINCY (Incyte, Wilmington, DE) by digesting with restriction enzymes EcoRI and NotI. The sequence was then ligated into vectors of pcDNA 3.1(+) and pLenti6.3 (Invitrogen, Carlsbad, CA). The sequence was verified through bidirectional sequencing with HITACHI 3100 Genetic Analyzer (Applied Biosystems). To express the hBD-1 protein, cells were 60% to 70% confluent in a six-well plate and incubated at 37°C overnight. Plasmids were then transfected with Fugene 6 or Lipofectamine 2000 according to the published protocols (Invitrogen, Carlsbad, CA). For retro-/lentiviral gene transduction, the 2nd generation Lentiviral packaging vectors, pCMV-ΔR8.91 and pMD.G (Clonetech, Mountain View, CA) and the 3rd generation Lentiviral package vectors (Invitrogen, Carlsbad, CA) were co-transfected with a plasmid of pLenti6.3/hBD-1 into 293FT cells (Invitrogen, Carlsbad, CA). Viral particles were harvested and purified at day 4 or day 5 post transfection and used to infect target cells as described in the published protocols.
Tumorigenesis in mice
Mouse Beta Defensin1 (mBD1) knockout mice were originally made in Dr. Julia Dorin laboratory (MRC Human Genetics Unit, Western General Hospital, Scotland). The mBD1 knockout mice were generated by inserting a 1.1 Kb neo fragment into mBD1 exon 2. Founder mice were then bred with C57BL/6 mice.23 The genotype was verified by Southern blot using genomic DNA extracted from the spleen. Mice were housed under standard-care conditions in micro-isolators. Experiments were performed using an IACUC approved protocol. Nickel sulfate was obtained from Dr. Jack Arbiser (Emory University). Nickel sulfate was dissolved in DMEM (Life Technologies, Grand Island, NY) to a final concentration 17mg/ml. According to Emory IACUC approved protocol, 100 µl of nickel sulfate solution was injected intramuscularly into the left legs of 6-week-old male and female mBD1-/- mice and control mice. The dilution vehicle was injected in the right legs. The injection was performed only once; tumor growth was monitored weekly for 1.5 years.
Tissue microarray and RT-PCR
The array membranes of mouse cell surface markers and mouse common cytokines were purchased from SuperArray Bioscience (Frederick, MD). Theprotocol was performed per manufacturer instruction. The steps include RNA extraction from combined tumor tissue, cDNA synthesis from the extracted RNA, cRNA synthesis from the cDNA. Purified cRNA was used to hybridize with the membranes. Data were normalized by the gene GAPDH. The expression intensity was quantified using ImageJ. Selected genes were validated by real-time RT-PCR using a BIO-RAD iCycler. Mouse tumor cDNA was transcribed with TaqMan reverse transcript reagents from Applied Biosystems (Branchburg, New Jersey, USA). Samples were run in triplicate in qPCR using 2x Power Sybr Green PCR master Mix from Applied Biosystems (Branchburg, New Jersey, USA). Primer sequences are listed in the supplemental table.
Immunohistochemistry
Tumor tissue from both mBD1-/- and wild-type mice were fixed overnight at 4°C in 10% formalin and embedded in paraffin. 5-µm sections were dewaxed by standard techniques. A high-pressure Decloaking Chamber was used for tissue antigens retrieval. Monoclonal mouse Anti-CD68 (Dako Cytomation, Carpinteria, CA) was 1:100 diluted for staining. DAKO LSAB/HRP kit was used for visualization.
Co-culture
TSU-PR1 cells were seeded in a 6-well plate and incubated at 37°C overnight. The plasmid pLenti6.3/hBD-1 and pLenti6.3/LacZ were transfected into the cells using the standard protocol with Lipofectamine 2000 (Invitrogen, Carlsbad, CA). On the same day of transfection, TSU-PR1 cells were seeded in pre-soaked 0.45 µm co-culture inserts (Millipore, Billerica, MA), incubated overnight, and then transferred into the 6-well plate that contained the cells previously transfected with hBD-1 gene or LacZ gene as controls. The bottom of each insert was sliced 2 x 1 cm openings at the edge with a sterile scalpel for better interaction between two compartments. Western blot analysis was performed with cell lysates from both transfected and co-cultured TSU-PR1 cells at the 24, 48, and 72 h after co-incubation.
HPV16E6E7 production and infection
Retrovirus pLXSN16E6E7 was produced in PA317 packaging cells (ATCC, Manassas, VA) by culturing the cells in RPMI 1640 with 10% FBS. The culture medium was harvested at 48–72 hours and filtered by a 0.45µC filter before infecting the passage-2 mouse kidney cells. The cells were seeded in a 6-well plate at 80% confluent overnight and then incubated with 1 ml undiluted viral medium at 37ºC for 4–6 hours followed by adding more culture medium to 4 ml per well. Transduced cells were selected with 800µg/ml G418. The mRNA and protein from transduced cells were analyzed by RT-PCR and Western blot at the 7th day post-transduction.
Quantification of LacZ gene expression
Lentiviral-mediated gene transduction was quantified using a LacZ reporter. TSU-PR1 cells were seeded at a density of 1 × 10⁵ cells per well and transfected with pDNA3.1/hBD-1 and empty vector 48 hours prior to the infection with Lenti6.3/LacZ recombinant virus. LacZ activity was determined from cell lysate at 24 h postviral infection by adding ortho-Nitrophenyl-β-galactoside (ONPG) substrate. The intensity of ortho-Nitrophenyl (ONP) in cell lysate was measured at 420/600 nm absorbance at different time points. The 600 nm absorbance was used to reflect cell density in each well.28 The experiments were performed multiple times at 8–10 wells in each group.
Purification urine-derived hBD-1 peptide
Macro-Prep Carboxymethyl (CM) beads (Bio-Rad, Hercules, CA) were equilibrated with 25 mM ammonium acetate (pH 6.8–7.2). Human urine or culture medium was collected and centrifuged at 1000 rpm for 5 min to discard cells and precipitation. The equilibrated CM beads were added into urine or cell medium at the ratio 1:10 and stirred overnight at 4°C. Next day, the mixture was centrifuged at 1000 rpm for 3 min; the supernatant was discarded, and the beads were washed twice with 0.25 mM ammonium acetate (pH 8). To elute hBD-1protein, two CM bead volumes of 5% acetic acid were added and shaken at room temperature 5 to 10 min.8
Immunoprecipitation and western blot analysis
Whole-cell extracts were obtained by lysing cells with lysis buffer containing 50 mmol/L Tris base, 5 mmol/L EGTA, 150 mmol/L NaCl, and 1% Triton X-100 (pH 7.4). One tablet of protease inhibitor (Roche Diagnostics, South San Francisco, CA) was dissolved in 7 mL of lysis buffer. Total protein (30–50 μg/well) was loaded in 4–12% gradient NuPAGE MES SDS gel or 12.5% acid-urea page gel.8; the gel was then transferred into Immun-Blot polyvinylidene difluoride membrane. The anti-hBD-1 antibody was a gift from Dr. Thomas Ganz (University of California, Los Angeles, CA). The other primary antibodies were purchased from Cell Signaling (pERK, HRAS, pAKT, pSP-6, and GAPDH) (Danvers, MA), Calbiochem (HER2 Ab-3) (Billerica, MA), Santa Cruz Biotechnology, Inc. (Neu C-18, pEGFR) (Dallas, TX), Sigma-Aldrich (beta-Actin) (St. Louis, MO). Immunodetection was completed by using the corresponding secondary horseradish peroxidase (HRP)–conjugated antibodies. HRP activity was detected using enhanced chemiluminescence from the ECL Western blotting Analysis System (Thermo Scientific, Rockford, IL). Data was normalized by β-Actin or GAPDH; the intensity was quantified with ImageJ. For immunoprecipitation, 100–500 µg of BT474 total cell lysate was mixed with 50 µg urine-derived hBDF-1 peptides and incubated at 4ºC overnight. Antibody conjugated Dynabeads Protein G (Life technologies, Billerica, MA) was immobilized with 20 mM dimethyl pimelimidate x 2HCl (DMP) and then added into the protein mixture for 6 h at 4ºC. Before elution, the beads were cross-linked with 5mM of BS3 (Thermo Scientific, Rockford, IL) and washed three times with PBS with 0.1% Tween-20 as described in a manufacturing protocol. Elution proceeded with 0.1 mM citrate acid or SDS sample buffer. The acid level in each sample that contained acetic acid or citrate acid was adjusted with sodium hydroxide; the protein loading dye was used as a chlorimetric pH indicator. Proteins were analyzed in 4–12% of SDS-NuPAGE gel (Invitrogen, Carlsbad, CA) and 10% of Tris/Glycine gel (BIO-RAD, Hercules, CA).
Cell proliferation assay/cell viability assay
Bladder cancer cells TSU-Pr1were seeded in a 96-well plate at 40–50% confluent and incubated at 37°C overnight. The culture medium was changed daily with different concentrations of urine-derived hDB-1 peptides and BSA controls. The peptides were prepared in different pre-treatment conditions, such as incubation at 95ºC, 5 min, 37ºC, 20 min and no incubation. To lyse the cells, the culture plate was frozen at −80°C and thawed at 37°C thrice. The dsDNA in each well was quantified by adding 100 μL of aqueous Hoechst 33258 in TNE buffer per well (Molecular Probes, Eugene, OR). The fluorescence intensity was measured by a Microplate Fluorescence Reader, BioTek FL600 (Winooski, VT). For cell viability assay: 10 µl of WST-1 reagent (Roche, REF 11644807001, Mannheim, Germany) was added into each well followed by incubating at 37ºC for 45 min to 1 h. The plate was read at 450 nm and 690 nm. Data was analyzed by subtracting the average of the media only wells from each the differences between A450-A690 for treated cells and controls.
Statistical analysis
In this study, Western blots were repeated multiple times, some more than 5 times. The films of each experiment were exposed for different periods of time. To avoid detection interference, we quantified the films that represented the resulting signals within the linear range of detection. The optical intensity of each band was captured multiple times using ImageJ and then repeated with Adobe Photoshop for comparable reference. The data were normalized for the background and internal controls. The quantification reflected a ratio of each signal relative to the loading control and housekeeping genes. Paired t-test was performed to compare the means of two related groups; p-values were reported on certain bar graphs that showed significant differences between the two experimental groups.
Funding Statement
This work was supported by the Emory University Urology Department and the Medical Research Council, UK.
Supplementary data
Supplemental data for this article can be accessed on the publisher’s website.
Acknowledgments
We thank Dr. Thomas Ganz, Dr. Erika V. Valore, Dr. Lily Yang, Dr. Guan-Zhe Wu, and Dr. Jack Arbiser for the generous gifts of hBD-1 antibody, BT474 breast cancer cells, TSU-Pr1 bladder cancer cells, nickel sulfate compound, and unlimited technical support. This study was supported by JRD funded by Medical Research Council UK.
References
- 1.Findlay F, Proudfoot L, Stevens C, Barlow PG.. Cationic host defense peptides; novel antimicrobial therapeutics against category A pathogens and emerging infections. Pathog Glob Health. 2016;110(4–5):137–147. doi: 10.1080/20477724.2016.1195036. [DOI] [PMC free article] [PubMed] [Google Scholar]
- 2.Donald CD, Sun CQ, Lim SD, Macoska J, Cohen C, Amin MB, Young AN, Ganz TA, Marshall FF, Petros JA.. Cancer-specific loss of beta-defensin 1 in renal and prostatic carcinomas. Lab Invest. 2003;83(4):501–505. doi: 10.1097/01.LAB.0000063929.61760.F6. [DOI] [PubMed] [Google Scholar]
- 3.C Q S, Arnold R, Petros JA, Parrish AB, Almekinder T, He J, Ho S-M, Svoboda P, Pohl J, Marshall FF, et al. Human beta-defensin-1, a potential chromosome 8p tumor suppressor: control of transcription and induction of apoptosis in renal cell carcinoma. Cancer Res. 2006;66(17):8542–8549. doi: 10.1158/0008-5472.CAN-06-0294. [DOI] [PubMed] [Google Scholar]
- 4.Bullard R, Gibson W, Bose S, Keane TE, Donald CD. Functional analysis of the host defense peptide human beta Defensin-1: new insight into its potential role in cancer. Mol Immunol. 2008;45(3):839–848. doi: 10.1016/j.molimm.2006.11.026. [DOI] [PMC free article] [PubMed] [Google Scholar]
- 5.Winter J, Pantelis A, Reich R, Wenghoefer M. Human Beta-Defensin-1, −2, and −3 exhibit opposite effects on oral squamous cell carcinoma cell proliferation. Cancer Invest. 2011;29:196–201. doi: 10.3109/07357907.2010.543210. [DOI] [PubMed] [Google Scholar]
- 6.Joly S, Guthmiller JM, Pujol C, Kurago ZB, Guthmiller JM. Loss of human beta-defensin 1, 2, and 3 expression in oral squamous cell carcinoma. Oral Microbiol Immunol. 2009;24(5):353–360. doi: 10.1111/j.1399-302X.2009.00512.x. [DOI] [PubMed] [Google Scholar]
- 7.Han Q, Wang R, Sun C, Jin X, Liu D, Zhao X, Wang L, Ji N, Li J, Zhou Y, et al. Human beta-Defensin-1 suppresses tumor migration and invasion and is an independent predictor for survival of oral squamous cell carcinoma patients. PLOS. 2014; doi: 10.1371/journal.pone.0091867. [DOI] [PMC free article] [PubMed] [Google Scholar]
- 8.Valore EV, Ganz T, Caimano MJ, Norgard MV, Radolf JD. Human b-Defensin-1: an antimicrobial peptide of urogenital tissues. J Clin Invest. 1998;101(8):1633–1642. doi: 10.1172/JCI1861. [DOI] [PMC free article] [PubMed] [Google Scholar]
- 9.Shestakova T, Pogrebnoy P, Bolgova L, Alekseenko O, Soldatkina M, Pogrebnoy P. Expression of human beta-defensins-1, 2 and 4 mRNA in human lung tumor tissue: a pilot study. Exp Oncol. 2008;30(2):153–156 http://exp-oncology.com.ua/wp/wp-content/uploads/magazine/689 [PubMed] [Google Scholar]
- 10.Wenghoefer M, Novak N, Winter J, Malandsmo GM. Nuclear hBD-1 accumulation in malignant salivary gland tumours. BMC Cancer. 2008;8:.290. doi: 10.1186/1471-2407-8-290. [DOI] [PMC free article] [PubMed] [Google Scholar]
- 11.Sun L, Garzino-Demo A, Kish-Catalone T, Blumenthal R, Garzino-Demo P, La Terra Maggiore GM, Berrone S, Kleinman C, Wu Z, Abdelwahab S, et al. Human beta-Defensins suppress human immunodeficiency virus infection: potential role in mucosal protection. J Virol. 2005;79(22):14318–14329. doi: 10.1128/JVI.79.22.14318-14329. [DOI] [PMC free article] [PubMed] [Google Scholar]
- 12.Ryan LK, Fitzgerald-Bocarsly P, Yin Z, Megjugorac N, Uhlhorn V, Yim S, Schwartz KD, Abrahams JM, Diamond G, Fitzgerald-Bocarsly P. Modulation of human beta-defensin-1 (hBD-1) in plasmacytoid dendritic cells (PDC), monocytes, and epithelial cells by influenza virus, Herpes simplex virus, and Sendai virus and its possible role in innate immunity. J Leukoc Biol. 2011;90(2):343–356. doi: 10.1189/jlb.0209079. [DOI] [PMC free article] [PubMed] [Google Scholar]
- 13.Chong KT, Xi LFA, Schweinfurth JM, Lotz ZE, Kahn D. High level expression of human epithelial β-defensins (hBD-1, 2 and 3) in papillomavirus induced lesions. Virol J. 2006;3:.75. doi: 10.1186/1743-422X-3-75. [DOI] [PMC free article] [PubMed] [Google Scholar]
- 14.Ferris LK, Mlburu YK, Mathers AR, Falo LD Jr.. Human Beta Defensin 3 induces maturation of human langerhans cell like dendritic cells: an antimicrobial peptide that functions as an endogenous adjuvant. J Invest Dermatol. 2013;133(2):460–468. doi: 10.1038/jid.2012.319. [DOI] [PMC free article] [PubMed] [Google Scholar]
- 15.Semple F, MacPherson H, Webb S, Dorin JR. Human β-D-3 Exacerbates MDA5 but suppresses TLR3 responses to the viral molecular pattern mimic polyinosinic: polycytidylicacid. PLoS Genet. 2015;2(1):e1005801. doi: 10.1371/journal.pgen.1005673. [DOI] [PMC free article] [PubMed] [Google Scholar]
- 16.Seidel A, Camerini D, de Armas LR, Soto M, Yarosh W, Marcsisin RA, Tran D, Selsted ME, Camerini D, Unutmaz D. Cyclic and acyclic defensins inhibit human immunodeficiency virus type-1 replication by different mechanisms. PLoS One. 2010;5(3):9737. doi: 10.1371/journal.pone.0009737. [DOI] [PMC free article] [PubMed] [Google Scholar]
- 17.Hancock RE, Haney EF, Gill EE. The immunology of host defence peptides: beyond antimicrobial activity. Nat Rev Immunol. 2016;16(5):321–334. doi: 10.1038/nri.2016.29. [DOI] [PubMed] [Google Scholar]
- 18.Iqbal N, Iqbal N, Human epidermal growth factor receptor 2 (HER2) in cancers: overexpression and therapeutic implications. Mol Biol Int. 2014; Article ID 852748, 9. doi: 10.1155/2014/852748. [DOI] [PMC free article] [PubMed] [Google Scholar]
- 19.Targeted Therapy for Breast Cancer : Targeted therapy for HER2-positive breast cancer. American Cancer Society; https://www.cancer.org/cancer/breast-cancer/treatment/targeted-therapy-for-breast-cancer.html [Google Scholar]
- 20.Feng Z, Dubyak GR, Ledrman MM, Cutting Edge: WA, Defensin H. 3—A novel antagonist of the HIV-1 Coreceptor CXCR4. J Immunol. 2006;177(2):782–786. doi: 10.4049/jimmunol.177.2.782. [DOI] [PubMed] [Google Scholar]
- 21.Röhrl J, Yang D, J J O, Human HT. β-Defensin 2 and 3 and their mouse orthologs induce chemotaxis through interaction with CCR2. J Immunol. 2010;184(12):6688–6694. doi: 10.4049/jimmunol.0903984. [DOI] [PMC free article] [PubMed] [Google Scholar]
- 22.Govindarajan B, J L A, Miller MS, Mansur C, Mizesko M, Bai X, LaMontagne K, Arbiser JL. Reactive oxygen-induced carcinogenesis causes hypermethylation of p16 (Lnk4a) and activation of MAP kinase. Mol Med. 2002;8(1):1–8 https://www.ncbi.nlm.nih.gov/pmc/articles/PMC2039931/pdf/11984000.pdf [PMC free article] [PubMed] [Google Scholar]
- 23.Morrison G, Kilanowski F, Davidson D, Dorin J. Characterization of the Mouse Beta Defensin 1, Defb1, mutant mouse model. Infect Immun. 2002;70(6):3053–3060. doi: 10.1128/IAI.70.6.3053-3060. [DOI] [PMC free article] [PubMed] [Google Scholar]
- 24.Costa M, Yan Y, Daoji Z, Salnikow K. Molecular mechanisms of nickel carcinogenesis: gene silencing by nickel delivery to the nucleus and gene activation/inactivation by nickel-induced cell signaling. J Environ Monit. 2003;5:.222–223. doi: 10.1039/B210260A. [DOI] [PubMed] [Google Scholar]
- 25.Solinas G, Allavena P, Mantovani A, Allavena P. Tumor-associated macrophages (TAM) as major players of the cancer-related inflammation. J Leukocyte Biology. 2009;86(5):1065–1073. doi: 10.1189/jlb.0609385. [DOI] [PubMed] [Google Scholar]
- 26.Gabrilovich DI, Ostrand-Rosenberg S, Bronte V. Coordinated regulation of myeloid cells by tumours. Nat Rev Immunol. 2012;12(4):253–268. doi: 10.1038/nri3175. [DOI] [PMC free article] [PubMed] [Google Scholar]
- 27.Engblom C, Pfirschke C, Pittet MJ. The role of myeloid cells in cancer therapies. Nat Rev Cancer. 2016;16(7):447–462. doi: 10.1038/nrc.2016.54. [DOI] [PubMed] [Google Scholar]
- 28.Beta-Galactosidase Assay (A better Miller) Protocols. OpenWetWare. 2012. http://www.openwetware.org/wiki/Beta-Galactosidase_Assay
- 29.Kaltsa G, Bamias G, Siakavellas SI, Goukos D, Karagiannakis D, Zampeli E, Vlachogiannakos J, Michopoulos S, Vafiadi I, Daikos GL, et al. Systemic levels of human β-defensin 1 are elevated in patients with cirrhosis. Ann Gastroenterol. 2016;29(1):63–70 https://www.ncbi.nlm.nih.gov/pmc/articles/PMC4700849 [PMC free article] [PubMed] [Google Scholar]
- 30.Xu B, Chen L, Li J, Zheng X, Shi L, Wu C, Jiang J. Prognostic value of tumor infiltrating NK cells and macrophages in stage II+III esophageal cancer patients. Oncotarget. 2016;7(46):74904–74916. doi: 10.18632/oncotarget.12484. [DOI] [PMC free article] [PubMed] [Google Scholar]
- 31.Becker JC, Vetter CS, Schrama D, Brocker E-B, and Straten P. Differential expression of CD28 and CD94/NKG2 on T cells with identical TCR beta variable regions in primary melanoma and sentinel lymph node. Eur J Immunol. 2000; 30(12): 3699–3706.doi: 10.1002/1521-4141. [DOI] [PubMed] [Google Scholar]
- 32.Yeung OW, Lo CM, Man K, Qi X, Geng W, Li C-X, Ng KTP, Forbes SJ, Guan X-Y, Poon RTP, et al. Alternatively activated (M2) macrophages promoted tumor growth and metastasis in hepatocellular carcinoma. J Hepatol. 2015;62(3):607–616. doi: 10.1016/j.jhep.2014.10.029. [DOI] [PubMed] [Google Scholar]
- 33.Sica A, Larghi P, Mancino A, Rubino L, Porta C, Totaro MG, Rimoldi M, Biswas SK. Allavena P and Mantovani A. Macrophage polarization in tumour progression. Semin in Cancer Biol. 2008;18(5):349–355. doi: 10.1016/j.semcancer.2008.03.004. [DOI] [PubMed] [Google Scholar]
- 34.Zhang F, Wang RH, Wang XF, Jiang G, Liu H, G Z, H W, Fang R, Bu XZ, Cai SH, et al. TGF-β induces M2-like macrophage polarization via SNAIL-mediated suppression of a pro-inflammatory phenotype. Oncotarget. 2016;7(32):52294–52306. doi: 10.18632/oncotarget.10561. [DOI] [PMC free article] [PubMed] [Google Scholar]
- 35.Schröder M, Meisel C, Buhl K, Profanter N, Sievert N, Volk H-D, Gerald Grütz G. Different modes of IL-10 and TGF-β to inhibit cytokine-dependent IFN-γ production: consequences for reversal of lipopolysaccharide desensitization. J Immunol. 2003;170(10):5260–5267. doi: 10.4049/jimmunol.170.10.52605260. [DOI] [PubMed] [Google Scholar]
- 36.Merad M, Sathe P, Helft J, Miller J, Mortha A. The dendritic cell lineage: ontogeny and function of dendritic cells and their subsets in the steady state and the inflamed setting. Annu Rev Immunol. 2013;31:.563–604. doi: 10.1146/annurev-immunol-020711-074950. [DOI] [PMC free article] [PubMed] [Google Scholar]
- 37.Zarei S, Mach N, Luy P, Aurrand-Lions M, Morel P, Kopf M, Dranoff G, Mach N. Role of GM-CSF signaling in cell-based tumor immunization. Blood. 2009;113(26):6658–6668. doi: 10.1182/blood-2008-06-161075. [DOI] [PMC free article] [PubMed] [Google Scholar]
- 38.Quatromoni JG, Eruslanov E. Tumor-associated macrophages: function, phenotype, and link to prognosis in human lung cancer. Am J of Transl Res. 2012;4(4):376–389 https://www.ncbi.nlm.nih.gov/pmc/articles/PMC3493031/pdf [PMC free article] [PubMed] [Google Scholar]
- 39.LarsenAK, Ouaret D, EI Ouadrani K, Petitprez A. Targeting EGFR and VEGF(R) pathway cross-talk in tumor survival and angiogenesis. J Pharmthera. 2011; 131(1): 80–90.doi: 10.1016/j.pharmthera.2011.03.012. [DOI] [PubMed] [Google Scholar]
- 40.Schmid CM, Varner AJ. Myeloid cells in the tumor microenvironment: modulation of tumor angiogenesis and tumor inflammation. J Oncol. 2010;2010(26). doi: 10.1155/2010/201026 [DOI] [PMC free article] [PubMed] [Google Scholar]
- 41.Y-N W, M-C H, Navarro M, Bravo A, Ramírez A, Page A, Jorcano JL, Fernández-Aceñero MJ, Casanova ML. Nuclear trafficking of the epidermal growth factor receptor family membrane proteins. Oncogene. 2010;29(28):3997–4006. doi: 10.1038/onc.2010.157. [DOI] [PMC free article] [PubMed] [Google Scholar]
- 42.Jayaraman P, Sikora GA, Lopez-Rivera E, Hailemichael Y, Clark A, Ma G, Cannan D, Ramacher M, Kato M, Overwijk WW, et al. Tumor-expressed iNOS controls induction of functional myeloid derived suppressor cells (MDSC) through modulation of VEGF release. J Immunol. 2012;188(11):5365–5376. doi: 10.4049/jimmunol.1103553. [DOI] [PMC free article] [PubMed] [Google Scholar]
- 43.Umemura N, Takami T, Suwa T, Kitoh Y, Bai J, Nonaka K, Ouyang G-F, Okada M, Balazs M, Adany R, et al. Tumor-infiltrating myeloid-derived suppressor cells are pleiotropic-inflamed monocytes/macrophages that bear M1- and M2-type characteristics. J Leuko Biol. 2008;83(5):1136–1144. doi: 10.1189/jlb.0907611. [DOI] [PubMed] [Google Scholar]
- 44.Santegoets SJ, Gruijl TD, van der Sluis PC, Lougheed SM, Fluitsma DM, van Den Eertwegh AJM, Pinedo HM, Scheper RJ, de Gruijl TD. A CD34+ human cell line model of myeloid dendritic cell differentiation: evidence for a CD14+ CD11b+ Langerhans cell precursor. J Leuko Biol. 2006;80(6):1337–1344. doi: 10.1189/jlb.0206111. [DOI] [PubMed] [Google Scholar]
- 45.Kwan WH, Mueller CG, Marañón C, Barbaroux J-B, Hosmalin A, Harris E, Fridman WH, Mueller CGF. Dendritic cell precursors are permissive to dengue virus and human immunodeficiency virus infection. J Virol. 2005;79(12):7291–7299. doi: 10.1128/JVI.79.12.7291-7299. [DOI] [PMC free article] [PubMed] [Google Scholar]
- 46.Ginhoux F, Merad M, Angeli V, Bogunovic M, Loubeau M, Dai X-M, Stanley ER, Randolph GJ, Merad M. Langerhans cells arise from monocytes in vivo. Nat Immunol. 2006;7:.265–273. doi: 10.1038/ni1307. [DOI] [PMC free article] [PubMed] [Google Scholar]
- 47.Mantovani A, Sica A, Biswas SK, Marchesi F, Allavena P, Sica A. Tumor-associated macrophages and dendritic cells as prototypic type II polarized myeloid populations. Tumori. 2003;89(5):459–468. doi: 10.1177/030089160308900501. [DOI] [PubMed] [Google Scholar]
- 48.Fisher C. Low grade sarcomas with CD34 positive fibroblasts and low grade myofibroblastic sarcomas. Ultrastruct Pathol. 2004;28:.291–305. doi: 10.1080/019131290882187. [DOI] [PubMed] [Google Scholar]
- 49.Cl B, Hs T, Cr S. Initiation and characterization of primary mouse kidney epithelial cultures. In vitro cellular & developmental biology. Springer. 1988;24(7):683–695 https://link.springer.com/article/10.1007/BF02623606 [DOI] [PubMed] [Google Scholar]
- 50.Keller C, Kroening S, Zuehlke J, Kunath F, Krueger B. Distinct mesenchymal alterations in N-Cadherin and E-cadherin positive primary renal epithelial cells. J Pone. 2012:004358. doi: 10.1371/journal.pone.0043584. [DOI] [PMC free article] [PubMed] [Google Scholar]
Associated Data
This section collects any data citations, data availability statements, or supplementary materials included in this article.