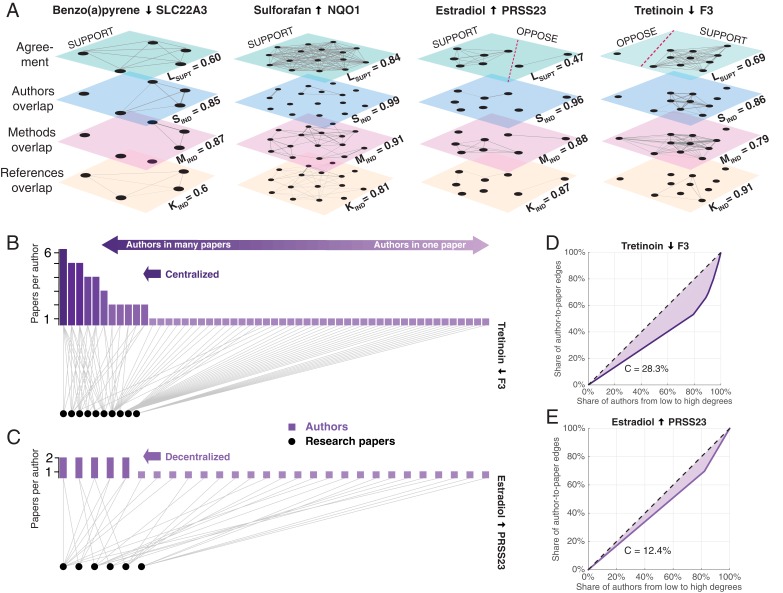
Figure 3. Exemplary networks comprising social, methodological, and references dependences and centralization patterns in scientific communities.
(A) Multilayer networks for four of the claims shown in Figure 2A. The nodes in each layer are scientific papers. Pairs of papers are connected by an unweighted edge in the top layer if they agree on the effect direction, and by a weighted edge in the other layers if there is an overlap of authors (second layer), methodologies (third layer) or references to prior publications (fourth layer): the thickness of the weighted edges is proportional to the overlap (Jaccard coefficient; JC); for clarity, we only plot edges above the mean JC value in the third layer. Dashed red lines in the top layer separate supporting and opposing findings. Each layer is associated with a score: support in the literature Lsupt, social independence Sind, methodological independence Mind, and knowledge independence Kind (see ‘Network dependencies and centralization’ in Methods and materials). Figures plotted with Pymnet (Kivelä, 2017). (B) Bipartite network with edges connecting authors (rectangles) to the papers they published (circles) for the 10 papers that support the claim shown in the fourth panel of Figure 3A. A small group of investigators author most of these papers, while most investigators author only one paper, making this a centralized network. The Gini coefficient (see Materials and methods) for this network is 28.3%. (C) Bipartite network for the six papers that support the claim shown in the third panel of Figure 3A. Here all investigators author relatively comparable numbers of papers: this decentralized network has a Gini coefficient of 12.4%. (D, E) Lorenz curves for the examples shown in B and C.


