

ABSTRACT
Long noncoding RNAs are widely acknowledged as a group of regulatory factors in various diseases, especially in cancers. KCNQ1 overlapping transcript 1 (KCNQ1OT1) has been reported as oncogene in human cancers. However, the role of KCNQ1OT1 in colorectal cancer (CRC) has not been fully explained. Based on the database analysis, KCNQ1OT1 was highly expressed in CRC samples and predicted the poor prognosis for CRC patients. Functional experiments revealed that KCNQ1OT1 knockdown negatively affected the proliferation, migration and epithelial-mesenchymal transition (EMT) in CRC cells. Moreover, we identified the cytoplasmic localization of KCNQ1OT1 in CRC cells, indicating the post-transcriptional regulation of KCNQ1OT1 on gene expression. Mechanism experiments including RNA Immunoprecipitation (RIP) assay and dual luciferase reporter assays verified that KCNQ1OT1 acted as a competing endogenous RNA (ceRNA) in CRC by sponging microRNA-217 (miR-217) to up-regulate the expression of zinc finger E-box binding homeobox 1 (ZEB1). Further mechanism investigation revealed that ZEB1 enhanced the transcription activity of KCNQ1OT1 by acting as a transcription activator. Finally, rescue assays were designed to demonstrate the effect of KCNQ1OT1-miR-217-ZEB1 feedback loop on proliferation, migration, and EMT of CRC cells. In brief, our research findings revealed that ZEB1-induced upregulation of KCNQ1OT1 improved the proliferation, migration and EMT formation of CRC cells via regulation of miR-217/ZEB1 axis.
KEYWORDS: KCNQ1OT1, miR-217, ZEB1, colorectal cancer, migration
Introduction
In the past decades, malignant tumors in the digestive system have been studied because it is one of the leading causes of cancer-related deaths1. As a kind of digestive malignancies, colorectal cancer (CRC) has become one of the most frequent cancers all over the world2. CRC is becoming more and more prevalent in the world, especially in developing countries3. The incidence is always elevating with the development of economy and technology4. The aberrant gene expressions and epigenetic alternations are regarded as major factors in the progression of CRC5. Accordingly, exploring the novel molecular markers is essential for the diagnosis and treatment for CRC patients.
Long noncoding RNAs (lncRNAs) have been widely reported as the biomarkers in many types of cancers. They are molecules that exert the oncogenic or tumor-suppressive function in the development of human cancers6,7. The function of lncRNAs in tumors has been reported many times. For example, lncRNA HOX transcript antisense RNA (HOTAIR) accelerates tumorigenesis in hepatocellular carcinoma (HCC)8, squamous cell carcinoma9, renal cell carcinoma10, and non-small cell lung cancer11. LncRNA cancer susceptibility 15 (CASC15) has also been reported to be up-regulated in HCC and facilitates its progression12. Moreover, more and more lncRNAs have been reported in CRC13-15. In this study, lncRNA KCNQ1 overlapping transcript 1 (KCNQ1OT1) was chosen to do the research subject due to its association with the prognosis of CRC patients. KCNQ1OT1 is the lncRNA gene found in the KCNQ1 locus whose length in 91 kb. KCNQ1OT1 is a kind of long chromatin-interacting lncRNA that silences multiple genes in the Kcnq1 domain through constructing a special chromatin structure. This process is finished through recruiting chromatin and DNA-modifying proteins16,17. As a tumor promoter, KCNQ1OT1 has been reported in some types of cancers18-20. This study firstly investigated the biological role and molecular mechanism by which KCNQ1OT1 affects CRC progression. The role of KCNQ1OT1 in CRC was identified by performing loss-of-function assay.
Mechanistically, lncRNAs can act as competing endogenous RNAs (ceRNAs) by sponging miRNAs to upregulate mRNAs21-23. In the present study, we investigated whether KCNQ1OT1 exerted functions in this manner. Zinc finger E-box binding homeobox 1 (ZEB1) can promote cell migration and epithelial-mesenchymal transition (EMT)24-26. In the present study, we found that post-transcriptional regulation of KCNQ1OT1 on ZEB1. Bioinformatics analysis and mechanism experiments revealed that microRNA-217 (miR-217) could bind with both KCNQ1OT1 and ZEB1. Furthermore, the upstream mechanism of KCNQ1OT1 was analyzed. ZEB1, also known as a transcription factor27,28. In the present study, we analyzed whether ZEB1 affected the transcription of KCNQ1OT1. At last, rescue assays were conducted to detect the biological role of KCNQ1OT1-miR-217-ZEB1 feedback loop in CRC.
Materials and methods
Cell lines
Four CRC cell lines (HT-29, HCT116, SW480, and DLD1) and two normal cell lines (FHC, NCM460) were purchased from the Institute of Biochemistry and Cell Biology of the Chinese Academy of Sciences (Shanghai, China). The CRC cells were cultured in RPMI 1640, while the normal cells were cultured in DMEM (GIBCO-BRL) medium (10% of FBS+100 U/ml penicillin+100 mg/ml streptomycin) (Invitrogen, Carlsbad, CA, USA). All cells were maintained at a condition of 37°C with 5% of CO2.
Lentiviral construction, plasmid construction and cell transfection
DLD1 and SW480 cell lines were placed into six-well plates and maintained in a humid incubator with 5% CO2 at 37°C until reached 70% cell attachment rate. After washing and replacing culture medium, cell transfection was performed. The short hairpin RNAs (shRNAs) specific to KCNQ1OT1 (sh-KCNQ1OT1#1 and sh-KCNQ1OT1#2, GenePharma, Shanghai, China) and the nonspecific shRNAs (sh-NC, GenePharma) were separately transfected into DLD1 and SW480 cells in line with the guidebook of Lipofectamine2000 (Invitrogen, Carlsbad, CA, USA) for 48 h. The pcDNA3.1 vector targeting KCNQ1OT1 (pcDNA-KCNQ1OT1) and an empty vector were purchased from GeneCopoecia (Guangzhou, China), followed by 48 h of incubation with cells. To knock down or overexpress ZEB1 expression, the shRNAs against ZEB1 (sh-ZEB1, GenePharma) and the ZEB1-specific pcDNA3.1 vector (GeneCopoecia) together with their relative controls (sh-NC and NC) were constructed and incubated with cells using Lipofectamine2000 for 2 d. Interference sequences were as follows: sh-KCNQ1OT1#1: CTAAGACGGCCCCATTAGGCGTAGCACC; sh-KCNQ1OT1#2: TCCGTCTTGCCAGCTCAAGAAAGAAATG; sh-ZEB1: CTTGAGTGAAGGGTGAGAATGGACCAGA. Overexpression or silencing of miR-217 in DLD1 and SW480 cells were achieved via Lipofectamine2000 mediated-transfection with miR-217 mimics or miR-217 inhibitors (GenePharma) for 48 h. Finally, DLD1 and SW480 cells were reaped for subsequent experiments.
Quantitative real-time PCR
Based on the user’s guide, TRizol reagent (Invitrogen) was utilized for the isolation of total RNA. Reverse transcription was performed with PrimeScriptTM RTMaster Mix (TaKaRa, Dalian, China). For the execution of real-time PCR, a standard SYBR Green PCR kit (TaKaRa, Dalian, China) was used in the 7300 Real-Time PCR system (Applied Biosystems). All these results were normalized to the expression of GAPDH. Each sample was prepared for experiments in triplicate. The relative expressions of genes were calculated according to the comparative threshold cycle method. The relative fold change of expression was measured by means of the 2−ΔΔCt method where ΔCt = Ct (detected gene)–Ct (GAPDH) and Ct indicated the cycle number of threshold.
Cell viability assay
After the required transfection, DLD1 and SW480 cells were separately reseeded into a 96-well plate at a density of 2,500 cells per well. MTT was used to measure cell viability at several different time points (0 h, 24 h, 48 h, 72 h, 96 h). In short, each well was added with MTT solution (0.5 mg/ml) (Sigma) and cells were incubated for 4 h at 37°C. After the removal of medium, the formazan crystal was dissolved by adding 100 μl DMSO solution. At a wavelength of 570 nm, the absorbance was detected with a microplate reader (Molecular Devices, Sunnyvale, CA, USA). All experiments were carried out at least three times.
Colony formation assay
For detection of cell proliferation in CRC, colony formation assay was put into use after the required transfection. In a word, cells (600 cells per well) were seeded into six-well plates and cultured for about two weeks to form colonies. Then, colonies were fixed by using 4% of paraformaldehyde for 5 min and then were stained with 1% of crystal violet for 30 s. The results were photographed, and the number of colonies was counted by ourselves.
Western blot analysis
Cells were washed twice with PBS and then were lysed by using RIPA protein extraction reagent (Beyotime, Beijing, China) in which a protease inhibitor cocktail (Roche, CA, USA) and phenylmethylsulfonyl fluoride (Roche) were added. The Bio-Rad protein assay kit was used for assessing the concentration of proteins. Equivalent proteins (30 µg) were loaded and separated by electrophoresis (50 V, 3 h) on 10% of SDS-PAGE gels. Next, they were transferred to nitrocellulose membranes (Sigma) and incubated with necessary antibodies. ECL chromogenic substrate was utilized for visualizing the bands. The intensity of the bands was quantified by densitometry (Quantity One software; Bio-Rad). GAPDH was regarded as an internal control. Antibodies (1:1000 dilution) against E-cadherin (1:1000, Cat#: ab1416), β-catenin (1:1000, Cat#: ab32572), Vimentin (1:1000, Cat#: ab8978) and N-cadherin (1:1000, Cat#: ab18203) were purchased from Abcam (Cambridge, UK).
Transwell migration assay
The migratory capacity of cells was measured by using transwell Chamber Cell Culture (10-μm pore membrane, BD Biosciences). A total of 1 × 10⁵ cells in 100 μl of serum-free medium were added to the top chamber of 24-well plates. The bottom well contained growth medium with 20% FBS. Transwell chambers were placed at 37°C for 48 h. Cells in chamber were fixed with methanol for half an hour and then were stained with crystal violet for 15 min. Cells were finally observed under a microscope and the number was counted within randomly nine fields for each experiment.
Immunofluorescence
For immunofluorescence assay, cells were put on glass slices to grow and fixed in 4% of formaldehyde for about 10 min, and permeation of cells was finished with 0.3% of Triton X-100. Then, the goat serum was used for blocking slices for 15 min at 37°C. Then, they were incubated overnight at 4°C with anti-E-cadherin (1:80, Bioworld, MN, USA) and anti-N-cadherin (1:80, Bioworld, MN, USA). Samples were washed three times before the incubation of goat TRITC labeled secondary antibody (1:70, Bioworld, MN, USA) (37°C and 1 h). DAPI (Genview Inc, Shanghai, China) was used for staining. Finally, fluorescence was visualized with a microscope whose magnification was ×400.
Subcellular fractionation assay
The cytoplasmic and nuclear extracts were extracted from DLD1 and SW480 cells with NE-PER Nuclear and Cytoplasmic Extraction Reagents (Thermo Scientific, Waltham, MA, USA). RNAs isolated from nucleus or cytoplasm were analyzed with RT-qPCR analysis, normalizing to nuclear control (U6) and cytoplasmic control (GAPDH).
RIP assays
RIP assays were performed using a Magna RIP RNA-Binding Protein Immunoprecipitation Kit (Millipore) on the basis of the manufacturer’s advice. Antibodies for RIP assays of Ago2 (Cat#: ab32381) were obtained from Abcam. RT-PCR was used to detect the co-precipitated RNAs.
RNA pull-down assay
MiR-217, miR-217-Mut, and miR-217-NC were separately biotinylated to be bio-miR-217-wt, bio-miR-217-mut, and bio-NC by GenePharma Company (Shanghai, China). Next, they were transfected into DLD1 and SW480 cells. Forty-eight hours later, cells were collected and lysed. Afterward, cells were incubated with Dynabeads M-280 Streptavidin (Invitrogen, CA) for 10 min and washed with buffer. The bound RNAs were quantified with qRT-PCR.
Dual luciferase reporter assay
The wild-type pmirGLO-KCNQ1OT1 and the mutant pmirGLO-KCNQ1OT1 were purchased from GenePharma Co., Ltd. Cells were transfected with miR-217 mimic or NC by means of Lipofectamine 2000 reagent. Based on the user’s guide, luciferase activities were continuously detected within 48 h after transfection by using Dual-Luciferase Reporter assays (Promega Corporation, Madison, WI, USA). The firefly luciferase activities were normalized to the Renilla luciferase activities. All experiments were carried out more than three times.
Luciferase reporter assay
For KCNQ1OT1 promoter luciferase reporter assay, cells were cultured in 24-well plates with medium at 37°C until attachment. According to the top four binding sites between KCNQ1OT1 promoter and ZEB1, the KCNQ1OT1 promoter was divided into four junctions (−2000~-1000, −2000~-600, −2000~-300, −2000~-200). Then, these four fragments were amplified by PCR and cloned into the downstream of the firefly luciferase plasmids in pGL3-Basic luciferase reporter vectors (Promega, Madison, WI, USA). These recombinant plasmids were transfected into cells using Lipofectamine2000 (Invitrogen, Carlsbad, CA, USA). An empty pGL3-Basic plasmid vector was taken as the negative control. The relative luciferase activities were determined 48-hour post-transfection using the commercial available Bright-Glo Luciferase Reporter System (Promega, USA) in accordance with the user manual. Experimental results were normalized to Renilla luciferase activity.
Chromatin immunoprecipitation (ChIP) assay
Based on the protocol of manufacturers, the Magna ChIP Kit (Millipore, Bedford, MA, USA) was utilized to perform ChIP assay. DLD1 and SW480 cells were treated with formaldehyde, thus generating the DNA-protein cross-links. Next, the cell lysates were sonicated so as to generate the chromatin fragments. IgG was used as control, the cell lysates were then immunoprecipitated with specific antibodies. Finally, qPCR was applied to measure the precipitated chromatin DNA.
Statistical analysis
All data are displayed as the mean ± SD from more than three independent experiments. Data were analyzed by the SPSS software version 17.0. Student’s t-test was applied to compare two groups, and one-way ANOVA was used for the comparison for more than two groups. All data were two-sided. Overall survival probability was analyzed on the basis of TCGA database. P value less than 0.05 was considered statistically significant.
Results
High expression of KCNQ1OT1 was a poor prognostic factor for CRC patients
According to the data of The Cancer Genome Atlas (TCGA) database (https://cancergenome.nih.gov/), KCNQ1OT1 was highly expressed in CRC tissue samples (Figure 1(a)). Based on the TCGA data, Kaplan Meier survival analysis revealed that high expression of KCNQ1OT1 indicated poor overall survival of CRC patients (Figure 1(b)). Furthermore, we applied qRT-PCR to examine the expression condition of KCNQ1OT1 in four CRC cell lines (HT-29, HCT116, SW480, DLD1) and two normal cell lines (FHC, NCM460). According to the results shown in Figure 1(c), KCNQ1OT1 was significantly upregulated in CRC cell lines, especially in DLD1 and SW480 cell lines.
Figure 1.
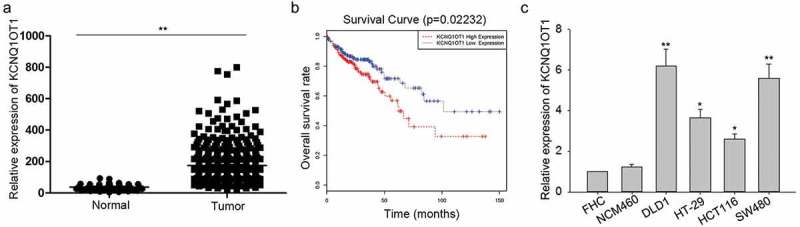
High expression of KCNQ1OT1 was a poor prognostic factor for CRC patients.
(a) Based on TCGA analysis, KCNQ1OT1 was upregulated in CRC samples than that in normal samples. (b) According to the data of TCGA database, the correlation between KCNQ1OT1 expression and overall survival of CRC patients was analyzed with Kaplan Meier method. (c) qRT-PCR determined the expression level of KCNQ1OT1 in CRC cells (HT-29, HCT116, SW480, DLD1) and normal cells (FHC, NCM460). *P < 0.05, **P < 0.01 vs. control group.
Knockdown of KCNQ1OT1 suppressed CRC cell proliferation
In order to conduct loss-of function assays, we first interfered the expression of KCNQ1OT1 in two CRC cells by transfecting with specific shRNAs (sh-KCNQ1OT1#1, sh-KCNQ1OT1#2). Meanwhile, control shRNA (sh-NC) was transfected into DLD1 and SW480 cells. The optimal transfection efficiency was obtained after 48 hours (Figure 2(a)). To analyze the biological effects of KCNQ1OT1 on CRC cell proliferation, MTT assay and colony formation assay were separately carried out in DLD1 and SW480 cells. The results revealed that the proliferation abilities of CRC cells were impaired by the transfection of KCNQ1OT1-specific shRNAs (Figure 2(b,c)). Therefore, we concluded that knockdown of KCNQ1OT1 negatively affected the proliferation of CRC cells.
Figure 2.
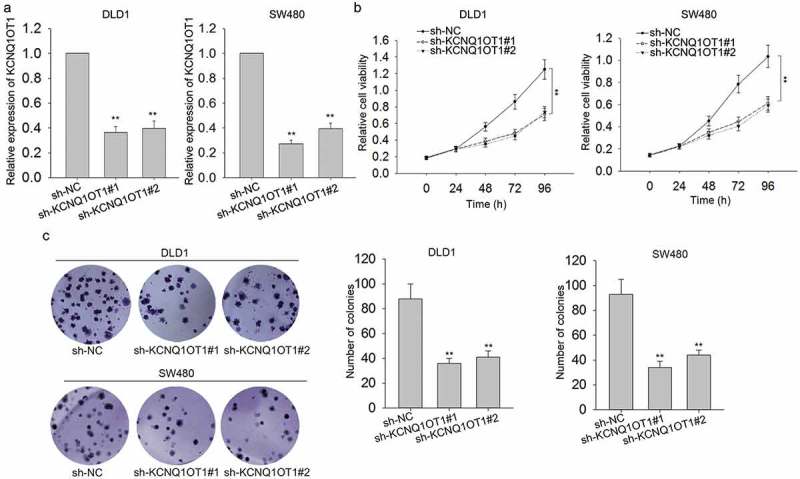
Knockdown of KCNQ1OT1 suppressed CRC cell proliferation.
(a) The expression of KCNQ1OT1 was silenced in DLD1 and SW480 cells by transfecting with specific shRNAs. The optimal transfection efficiency was obtained after 48 h. (b,c) MTT assay disclosed that the proliferative ability of DLD1 and SW480 cells which were transfected with KCNQ1OT1-specific shRNAs was reduced. **P < 0.01 vs. control group.
Silencing of KCNQ1OT1 negatively regulated the migration and EMT progress of CRC cells
Here, we further detected the function of KCNQ1OT1 in CRC cell migration. Transwell assays exposed that the migratory ability of CRC cells was suppressed by KCNQ1OT1 knockdown (Figure 3(a)). Epithelial-mesenchymal transition is an important biological process in the formation of the malignant phenotype of cancer. qRT-PCR and western blotting were conducted to examine the mRNA and protein levels of EMT markers. As expected, the levels of epithelial markers (E-cadherin, β-catenin) were increased, while the levels of mesenchymal markers (N-cadherin, Vimentin) were decreased (Figure 3(b,c)). The results of immunofluorescence assays were consistent with that of qRT-PCR and western blotting (Figure 3(d)). Therefore, we confirmed that KCNQ1OT1 improved cell migration and reversed EMT to MET.
Figure 3.
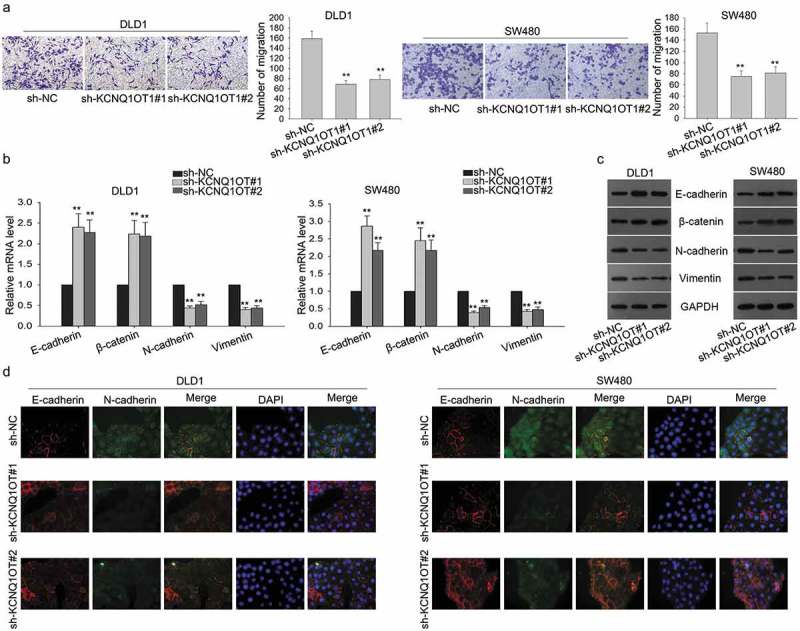
Silencing of KCNQ1OT1 negatively regulated the migration and EMT progress of CRC cells.
(a) Transwell assays revealed that the migration of CRC cells after KCNQ1OT1 was silenced. (b,c) The mRNA and protein levels of EMT markers (E-cadherin, β-catenin, N-cadherin, Vimentin) were measured by qRT-PCR and western blot assays. (d) Immunofluorescence assays were used to detect the expressions of E-cadherin and N-cadherin. **P < 0.01 vs. control group.
ZEB1 was upregulated by KCNQ1OT1 in CRC cells
Since ZEB1 is a critical regulator in modulating the EMT process and has been documented to be involved in the regulation of cell proliferation and migration of many types of cancers29-31. We hypothesized that ZEB1 might be involved in the function mediated by KCNQ1OT1. To confirm our hypothesis, we detected the expression of ZEB1 with qRT-PCR and discovered that it was intensely expressed in CRC cells in contrast to normal cells (Figure 4(a)). Subsequently, we found the positive relevance between KCNQ1OT1 and ZEB1 (Figure 4(b)). Then, we evaluated the effect of KCNQ1OT1 knockdown on the expression level of ZEB1. It was found that silenced KCNQ1OT1 could obviously reduce the level of ZEB1 both at mRNA and protein levels (Figure 4(c,d)), indicating that KCNQ1OT1 could modulate the expression of ZEB1. To probe the regulatory mechanism of KCNQ1OT1 on ZEB1, we first tested whether KCNQ1OT1 could regulate the mRNA transactivation of ZEB1. Luciferase assays demonstrated that KCNQ1OT1 did not impact the transactivation of ZEB1 promoter (Figure 4(e)), suggesting that KCNQ1OT1 might modulate ZEB1 mRNA at post-transcriptional level.
Figure 4.
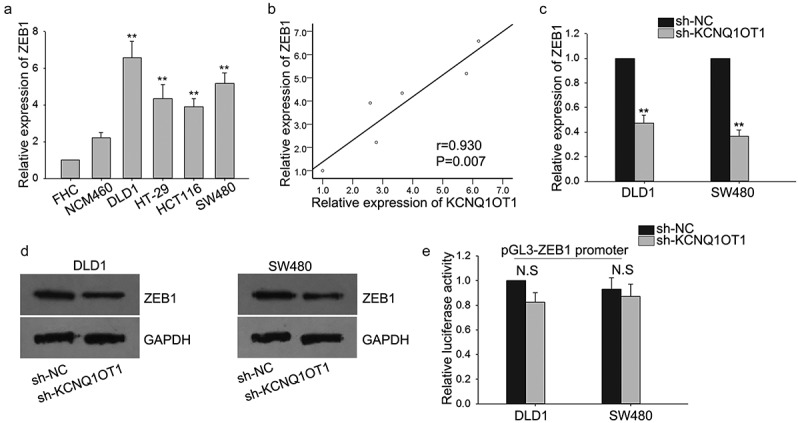
ZEB1 was upregulated by KCNQ1OT1 in CRC cells.
(a) The levels of ZEB1 in CRC cells and normal cells were measured by qRT-PCR. (b) The correlation between ZEB1 and KCNQ1OT1 was analyzed. (c,d) The mRNA and protein levels of ZEB1 in response to the knockdown of KCNQ1OT1 were measured by qRT-PCR and western blot. (e) Luciferase reporter assays were utilized to determine the effect of KCNQ1OT1 on the promoter activity of ZEB1. N.S: no significant, **P < 0.01 vs. control group.
KCNQ1OT1 positively modulated the expression of ZEB1 through sponging miR-217
Recently, a new regulatory network has been identified in which the crosstalk between lncRNAs and mRNAs was occurred by competitively sharing the same microRNAs. Firstly, the localization of KCNQ1OT1 was identified. It was uncovered that KCNQ1OT1 was mainly distributed in the cytoplasm (Figure 5(a)). By searching from bioinformatics websites (PITASites and miRandaSites), we found seven miRNAs which potentially targeted to ZEB1 (Figure 5(b)). To validate whether these seven miRNAs can bind with KCNQ1OT1, MS2-RIP assay was designed and carried out (Figure 5(c)). The results of RIP assay manifested that only miR-217 was enriched in MS2 beads containing KCNQ1OT1 (Figure 5(d)). Subsequently, Ago2-RIP assay further validated the interaction between KCNQ1OT1 and miR-217 (Figure 5(e)). Furthermore, pull-down assay revealed that KCNQ1OT1 was enriched in wild type biotin-labeled miR-217, but not in NC-Bio or mutant type biotinylated miR-217 (miR-217-Bio-MUT) (Figure 5(f)). Based on the bioinformatics analysis (http://carolina.imis.athena-innovation.gr/diana_tools/web/index.php?r=lncbasev2%2Findex-predicted), we proposed that miR-217 harbored the binding sites for KCNQ1OT1 (Figure 5(g)). Dual luciferase reporter assay was also applied to verify the combination. As illustrated in Figure 5(h), after the transfection of miR-217 mimics in DLD1 and SW480 cell lines, the luciferase activity of the wild-type KCNQ1OT1 was cut down, while this kind of change was not found in the luciferase activity of mutant-type KCNQ1OT1.
Figure 5.
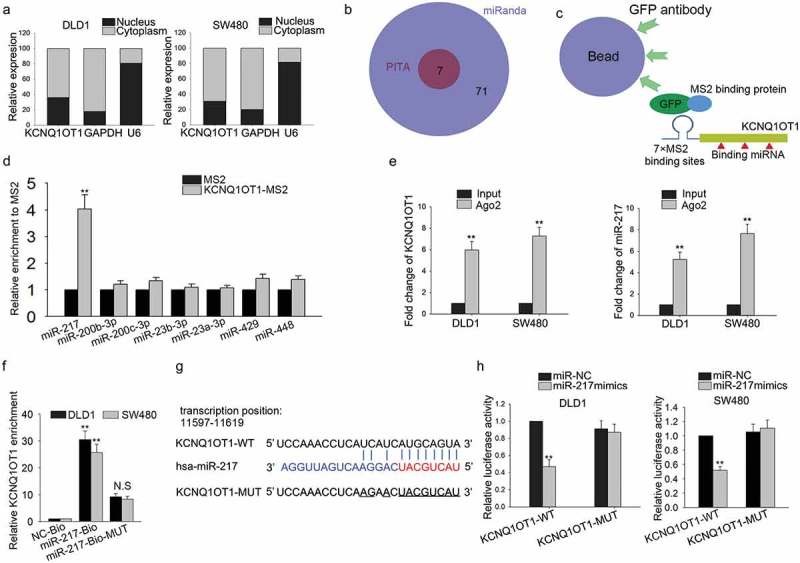
KCNQ1OT1 positively modulated the expression of ZEB1 through sponging miR-217.
(a) Nuclear separation experiment was used to determine the location of KCNQ1OT1 in cytoplasm and nucleus. (b) Seven miRNAs bound with ZEB1 were found through searching from bioinformatics websites (PITASites and miRandaSites). (c,d) MS2-RIP assay was performed to validate the interaction between these seven miRNAs and KCNQ1OT1. (e) Ago2-RIP assay further validated the interaction between KCNQ1OT1 and miR-217. (f) Pull down assay was further applied to demonstrate the interaction between KCNQ1OT1 and miR-217. (g) The binding sites harboring the miR-217 for KCNQ1OT1 were obtained from online bioinformatics analysis. (h) Luciferase activity reporter assays were applied to determine the interaction between KCNQ1OT1 and miR-217. N.S: no significance, **P < 0.01 vs. control group.
ZEB1 is a target of miR-217 in CRC cells
Based on above, ZEB1 was a potential target of miR-217. Here, we designed and conducted mechanism experiments to demonstrate the combination between miR-217 and ZEB1. Pull-down assay revealed that ZEB1 was efficiently pulled down by wild type biotinylated miR-217 (miR-217-Bio) but not NC-Bio or miR-217-Bio-MUT (Figure 6(a)). Similarly, the binding sites between miR-217 and ZEB1 were predicted and obtained using bioinformatics analysis (Figure 6(b)). Dual luciferase reporter assay was utilized to validate the interaction between miR-217 and ZEB1. As shown in Figure 6(c), the luciferase activity of wild type ZEB1 (ZEB1-WT) was markedly decreased in DLD1 and SW480 cells in which miR-217 was upregulated; the luciferase activity of mutant type ZEB1 had no obvious change. Furthermore, after HEK-293T cell was co-transfected with miR-217 mimics and pcDNA-KCNQ1OT1, the decreased luciferase activity of the wild-type ZEB1 caused by miR-217 mimics was reversed by the supplement of pcDNA-KCNQ1OT1 (Figure 6(d)). Finally, qRT-PCR and western blot analysis were conducted in two CRC cells to confirm the correlations among KCNQ1OT1, miR-217, and ZEB1. MiR-217-mediated suppression of ZEB1 could be rescued by the introduction of KCNQ1OT1 (Figure 6(e,f)). In summary, KCNQ1OT1 upregulated the level of ZEB1 through sponging miR-217.
Figure 6.
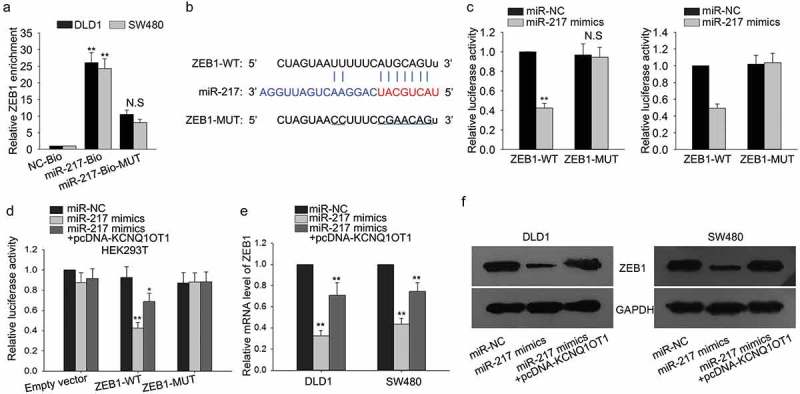
ZEB1 is a target of miR-217 in CRC cells.
(a) Pull-down assay was used to validate whether ZEB1 can be efficiently pulled down by biotin-labeled miR-217. (b) The binding sites between miR-217 and ZEB1 were predicted and obtained using bioinformatics analysis. (c) Dual luciferase reporter assay was applied to demonstrate the binding of KCNQ1OT1 to miR-217. (d) ZEB1-WT vector and empty vector were inserted into HEK-293T cell by co-transfecting with miR-NC, miR-217 mimics or miR-217 mimics + pcDNA-KCNQ1OT1. (e,f) qRT-PCR and western blot assays were performed to test the levels of EMT markers in DLD1 and SW480 cells which were transfected with miR-217 mimics or co-transfected with miR-217 mimics and pcDNA-KCNQ1OT1. N.S: no significance, *P < 0.05, **P < 0.01 vs. control group.
ZEB1 transcriptionally activated KCNQ1OT1 in CRC cells
According to previous reports, we knew that ZEB1 can act as a transcription factor to modulate gene expression. Here, we investigated whether ZEB1 could regulate the transcription of KCNQ1OT1, thereby regulating the expression of KCNQ1OT1. At first, the binding sequences of ZEB1 to the promoter region of KCNQ1OT1 were predicted from JASPAR (http://jaspar.genereg.net/). The schematic diagram is shown in Figure 7(a). Subsequently, luciferase reporter vectors containing serial truncations of KCNQ1OT1 promoter were constructed and transfected into HEK-293T cells. The luciferase activity of these plasmids was measured. The result suggested the site 4 (−310 bp to −300 bp) on the KCNQ1OT1 promoter was responsible for ZEB1-induced transcription activation (Figure 7(b)). Furthermore, ChIP assay demonstrated the direct affinity of ZEB1 to the promoter region of KCNQ1OT1 in two CRC cells (Figure 7(c)). Subsequently, ZEB1 was efficiently silenced or overexpressed in DLD1 and SW480 cells by transfecting with sh-ZEB1 and ZEB1 expression vector (Figure 7(d)). According to qRT-PCR analysis, the expression level of KCNQ1OT1 was positively regulated by ZEB1 (Figure 7(e,f)). All these experimental results validated that ZEB1 promoted KCNQ1OT1 transcription, thereby forming a KCNQ1OT1-miR-217-ZEB1 feedback loop in CRC cells.
Figure 7.
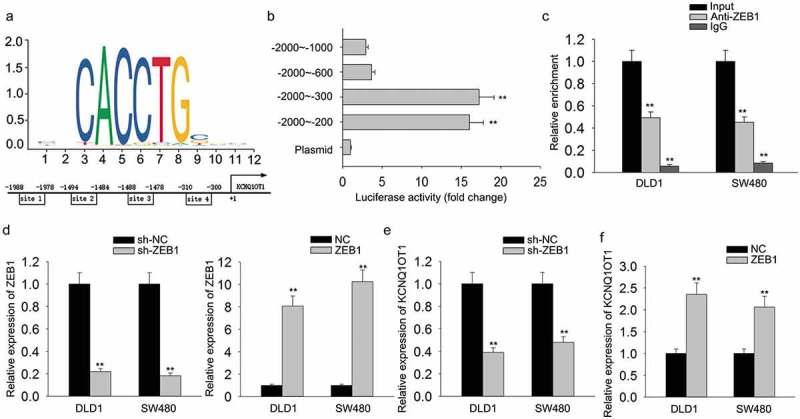
ZEB1 transcriptionally activated KCNQ1OT1 in CRC cells.
(a) The binding sequences of ZEB1 to the promoter region of KCNQ1OT1 were predicted from JASPAR. (b) Luciferase reporter vectors containing serial truncations of KCNQ1OT1 promoter were constructed and transfected into HEK-293T cells. The luciferase activity of these plasmids was measured. (c) ChIP assay was performed to demonstrate the direct affinity of ZEB1 to the promoter region of KCNQ1OT1 in two CRC cells. (d) ZEB1 was efficiently overexpressed or silenced in DLD1 and SW480 cells by transfecting with sh-ZEB1 and ZEB1 expression vector. (e,f) The expression level of KCNQ1OT1 in DLD1 and SW480 cells was examined in response to the knockdown or overexpression of ZEB1. *P < 0.05, **P < 0.01 vs. control group.
Kcnq1ot1-miR-217-ZEB1 feedback loop regulated the proliferation, migration and EMT formation of CRC cells
Rescue assays were carried out to do the further exploration. In this section, all assays were conducted in DLD1 cells that had been stably transfected with sh-KCNQ1OT1. MTT assay and colony formation assay reflected that the decreased proliferation of KCNQ1OT1-downregulated DLD1 cells was promoted by transfection with miR-217 inhibitors, while this reversal effect was attenuated again by transfecting with sh-ZEB1 (Figure 8(a,b)). Next, results of transwell assays were consistent with that of MTT and colony formation assays (Figure 8(c)). After DLD1/sh-KCNQ1OT1 cell was transfected with miR-217 inhibitors, the decreased protein levels of epithelial markers and increased protein levels of mesenchymal markers were observed, while this tendency was reversed by co-transfection of sh-ZEB1 (Figure 8(d)).
Figure 8.
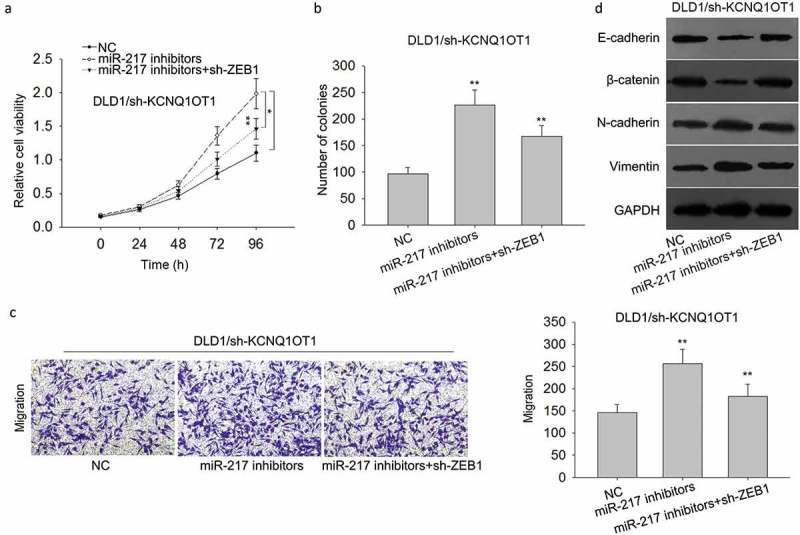
KCNQ1OT1-miR-217-ZEB1 feedback loop regulated the proliferation, migration and EMT formation of CRC cells.
(a,b) MTT assay and colony formation assay were carried out to detect the proliferation ability of DLD1/sh-KCNQ1OT1 cells after transfection with miR-217 inhibitors or co-transfection with miR-217 inhibitors + sh-ZEB1. (c) Transwell assay revealed the metastatic ability of DLD1/sh-KCNQ1OT1 cells after transfection with miR-217 inhibitors or co-transfection with miR-217 inhibitors + sh-ZEB1. (d) The levels of EMT markers were examined in indicated DLD1 cells after transfections. **P < 0.01 vs. control group.
Discussion
Colorectal cancer (CRC), a significant part of digestive system neoplasms, has been proved to be one of the major causes for human cancer-related deaths. Therefore, it is very important to do researches on CRC. LncRNAs have been regarded as transcriptions noise or clonal artifacts for decades32. With the development of molecular biology technology, more and more researches have demonstrated that lncRNAs have a close association with biological processes33,34. It is worth mentioning that lncRNAs can act as suppressors or motivators in tumors35-39. In our study, lncRNA KCNQ1OT1 was chosen to be studied thoroughly. KCNQ1OT1 has been found to be an important biomarker in some kinds of tumors40. The specific function of it in CRC is still not fully elaborated. Therefore, this study aims to evaluate the prognostic value and biological role of KCNQ1OT1 in CRC.
The high expression and prognostic value of KCNQ1OT1 were found in accordance with the data of TCGA database. Based on the analysis of TCGA data, we identified the research value of KCNQ1OT1 in colorectal cancer. Thereafter, functional assays were carried out. Down-regulation of KCNQ1OT1 was verified to be able to weaken the proliferation, invasion and EMT formation in CRC cells. Furthermore, ZEB1 was found out to be a potential target gene of KCNQ1OT1, and was highly expressed in CRC cells. The positive relationship between KCNQ1OT1 and ZEB1 was figured out in CRC cells.
It has been widely reported that miRNAs can participate in the progression of cancers through modulating its downstream target genes41-43. From this point, we discovered that miR-217 harbored the binding sites for both KCNQ1OT1 and ZEB1. The combination among the three RNA genes was certified by means of RIP and dual luciferase reporter assays. Also, it was determined that ZEB1 was positively related to KCNQ1OT1 and negatively related to miR-217. Considering the specific effect of ZEB1 on gene transcription, we hypothesized that ZEB1 might act as a transcription activator to promote the expression of KCNQ1OT1. The binding sites between ZEB1 and the KCNQ1OT1 promoter were predicted from JASPAR. Luciferase reporter assay and ChIP assay further demonstrated the affinity of ZEB1 to the promoter region of KCNQ1OT1. Furthermore, the expression of KCNQ1OT1 was actually enhanced by ZEB1. All these findings suggested the transcription activation of ZEB1 on KCNQ1OT1 in CRC cells. Later, we performed a series of rescue assays to determine the effects of the expression changes of these three genes on the proliferation, migration and EMT process of CRC cells. Finally, it was confirmed that KCNQ1OT1 was activated by ZEB1 and regulated the progression of CRC through sponging miR-217 to improve the expression of ZEB1. All our findings revealed the role of a novel feedback loop in CRC. It was expected that all these findings in our study will help to make progress in diagnosing and curing colorectal cancer.
Supplementary Material
Funding Statement
This work was supported by grant BK20161107 from the Provincial Natural Science Foundation of Jiangsu and grant H2017042 from the Jiangsu Provincial Commission of Health and Family Planning Development Project.
Acknowledgments
The authors thank all lab members.
Disclosure of Potential Conflicts of Interest
The authors declare that they have no competing interests, and all authors should confirm its accuracy.
References
- 1.Jemal A, Bray F, Center MM, Ferlay J, Ward E, Forman D.. Global cancer statistics. CA Cancer J Clin. 2011;61:69–90. doi: 10.3322/caac.20107. [DOI] [PubMed] [Google Scholar]
- 2.Torre LA, Bray F, Siegel RL, Ferlay J, Lortet-Tieulent J, Jemal A.. Global cancer statistics, 2012. CA Cancer J Clin. 2015;65:87–108. doi: 10.3322/caac.21262. [DOI] [PubMed] [Google Scholar]
- 3.Du LB, Li HZ, Wang XH, Zhu C, Liu QM, Li QL.. Analysis of cancer incidence in Zhejiang cancer registry in China during 2000 to 2009. Asian Pac J Cancer Prev. 2014;15:5839–5843. [DOI] [PubMed] [Google Scholar]
- 4.Liu F, Dear K, Huang L, Liu L, Shi Y, Nie S.. Association between microRNA-27a rs895819 polymorphism and risk of colorectal cancer: A meta-analysis. Cancer Genet. 2016;209:388–394. doi: 10.1016/j.cancergen.2016.08.003. [DOI] [PubMed] [Google Scholar]
- 5.Cheetham SW, Gruhl F, Mattick JS, Dinger ME. Long noncoding RNAs and the genetics of cancer. Br J Cancer. 2013;108:2419–2425. doi: 10.1038/bjc.2013.233. [DOI] [PMC free article] [PubMed] [Google Scholar]
- 6.Prensner JR, Chinnaiyan AM. The emergence of lncRNAs in cancer biology. Cancer Discov. 2011;1:391–407. doi: 10.1158/2159-8290.CD-11-0209. [DOI] [PMC free article] [PubMed] [Google Scholar]
- 7.Gutschner T, Diederichs S. The hallmarks of cancer: a long non-coding RNA point of view. RNA Biol. 2012;9:703–719. doi: 10.4161/rna.20481. [DOI] [PMC free article] [PubMed] [Google Scholar]
- 8.Wu Y, Xiong Q, Li S, Yang X, Ge F. Integrated proteomic and transcriptomic analysis reveals long noncoding RNA HOTAIR promotes hepatocellular carcinoma cell proliferation by regulating opioid growth factor receptor (OGFr). Mol Cell Proteomics. 2017;17:146–159. [DOI] [PMC free article] [PubMed] [Google Scholar]
- 9.Troiano G, Caponio VCA, Boldrup L, Gu X, Muzio LL, Sgaramella N.. Expression of the long non-coding RNA HOTAIR as a prognostic factor in squamous cell carcinoma of the head and neck: a systematic review and meta-analysis. Oncotarget. 2017;8:73029–73036. doi: 10.18632/oncotarget.20373. [DOI] [PMC free article] [PubMed] [Google Scholar]
- 10.Katayama H, Tamai K, Shibuya R, Nakamura M, Mochizuki M, Yamaguchi K.. Long non-coding RNA HOTAIR promotes cell migration by upregulating insulin growth factor-binding protein 2 in renal cell carcinoma. Sci Rep. 2017;7:12016. [DOI] [PMC free article] [PubMed] [Google Scholar]
- 11.Tan N, Li L, Bai L, Zhao K. Expression of Serum LncRNA HOTAIR in non-small cell lung cancer and its clinical significance. Zhongguo fei ai za zhi = Chin J Lung Cancer. 2017;20:402–406. doi: 10.3779/j.issn.1009-3419.2017.06.06. [DOI] [PMC free article] [PubMed] [Google Scholar]
- 12.He T, Zhang L, Kong Y, Huang Y, Zhang Y, Zhou D.. Long non-coding RNA CASC15 is upregulated in hepatocellular carcinoma and facilitates hepatocarcinogenesis. Int J Oncol. 2017. doi: 10.3892/ijo.2017.4175. [DOI] [PMC free article] [PubMed] [Google Scholar]
- 13.Cui C, Zhai D, Cai L, Duan Q, Xie L, Yu J. Long noncoding RNA HEIH promotes colorectal cancer tumorigenesis via counteracting miR-939Mediated transcriptional repression of Bcl-xL. Cancer Res Treat. 2017;50:992–1008. [DOI] [PMC free article] [PubMed] [Google Scholar]
- 14.Chen D, Sun Q, Zhang L, Zhou X, Cheng X, Zhou D.. The lncRNA HOXA11-AS functions as a competing endogenous RNA to regulate PADI2 expression by sponging miR-125a-5p in liver metastasis of colorectal cancer. Oncotarget. 2017;8:70642–70652. doi: 10.18632/oncotarget.19956. [DOI] [PMC free article] [PubMed] [Google Scholar]
- 15.Chen Z, Chen X, Chen P, Yu S, Nie F, Lu B.. Long non-coding RNA SNHG20 promotes non-small cell lung cancer cell proliferation and migration by epigenetically silencing of P21 expression. Cell Death Dis. 2017;8:e3092. doi: 10.1038/cddis.2017.484. [DOI] [PMC free article] [PubMed] [Google Scholar]
- 16.Kanduri C. Kcnq1ot1: a chromatin regulatory RNA. Semin Cell Dev Biol. 2011;22:343–350. doi: 10.1016/j.semcdb.2011.02.020. [DOI] [PubMed] [Google Scholar]
- 17.Ren K, Xu R, Huang J, Zhao J, Shi W. Knockdown of long non-coding RNA KCNQ1OT1 depressed chemoresistance to paclitaxel in lung adenocarcinoma. Cancer Chemother Pharmacol. 2017;80:243–250. doi: 10.1007/s00280-017-3356-z. [DOI] [PubMed] [Google Scholar]
- 18.Sun X, Xin Y, Wang M, Li S, Miao S, Xuan Y.. Overexpression of long non-coding RNA KCNQ1OT1 is related to good prognosis via inhibiting cell proliferation in non-small cell lung cancer. Thoracic Cancer. 2018;9:523–531. doi: 10.1111/1759-7714.12599. [DOI] [PMC free article] [PubMed] [Google Scholar]
- 19.Sunamura N, Ohira T, Kataoka M, Inaoka D, Tanabe H, Nakayama Y.. Regulation of functional KCNQ1OT1 lncRNA by β-catenin. Sci Rep. 2016;6:20690. doi: 10.1038/srep20690. [DOI] [PMC free article] [PubMed] [Google Scholar]
- 20.Zhang S, Ma H, Zhang D, Xie S, Wang W, Li Q.. LncRNA KCNQ1OT1 regulates proliferation and cisplatin resistance in tongue cancer via miR-211-5p mediated Ezrin/Fak/Src signaling. Cell Death Dis. 2018;9:742. doi: 10.1038/s41419-018-0793-5. [DOI] [PMC free article] [PubMed] [Google Scholar]
- 21.Yan X, Zhang D, Wu W, Wu S, Qian J, Hao Y.. Mesenchymal stem cells promote hepatocarcinogenesis via lncRNA-MUF interaction with ANXA2 and miR-34a. Cancer Res. 2017. doi: 10.1158/0008-5472.CAN-17-1915. [DOI] [PubMed] [Google Scholar]
- 22.Chen X, Chen Z, Yu S, Nie F, Yan S, Ma P.. Long noncoding RNA LINC01234 functions as a competing endogenous RNA to regulate CBFB expression by sponging miR-204-5p in gastric cancer. Clin Cancer Res. 2018;24:2002–2014. [DOI] [PubMed] [Google Scholar]
- 23.Chen DL, Lu YX, Zhang JX, Wei XL, Wang F, Zeng ZL.. Long non-coding RNA UICLM promotes colorectal cancer liver metastasis by acting as a ceRNA for microRNA-215 to regulate ZEB2 expression. Theranostics. 2017;7:4836–4849. doi: 10.7150/thno.20942. [DOI] [PMC free article] [PubMed] [Google Scholar]
- 24.Lee JY, Park MK, Park JH, Lee HJ, Shin DH, Kang Y.. Loss of the polycomb protein Mel-18 enhances the epithelial-mesenchymal transition by ZEB1 and ZEB2 expression through the downregulation of miR-205 in breast cancer. Oncogene. 2014;33:1325–1335. doi: 10.1038/onc.2013.53. [DOI] [PubMed] [Google Scholar]
- 25.Smit MA, Peeper DS. Zeb1 is required for TrkB-induced epithelial-mesenchymal transition, anoikis resistance and metastasis. Oncogene. 2011;30:3735–3744. doi: 10.1038/onc.2011.96. [DOI] [PubMed] [Google Scholar]
- 26.Graham TR, Zhau HE, Odero-Marah VA, Osunkoya AO, Kimbro KS, Tighiouart M.. Insulin-like growth factor-I-dependent up-regulation of ZEB1 drives epithelial-to-mesenchymal transition in human prostate cancer cells. Cancer Res. 2008;68:2479–2488. doi: 10.1158/0008-5472.CAN-07-2559. [DOI] [PubMed] [Google Scholar]
- 27.Yu Y, Luo W, Yang ZJ, Chi JR, Li YR, Ding Y.. miR-190 suppresses breast cancer metastasis by regulation of TGF-β-induced epithelial-mesenchymal transition. Mol Cancer. 2018;17:70. doi: 10.1186/s12943-018-0818-9. [DOI] [PMC free article] [PubMed] [Google Scholar]
- 28.Qu R, Chen X, Zhang C. LncRNA ZEB1-AS1/miR-409-3p/ZEB1 feedback loop is involved in the progression of non-small cell lung cancer. Biochem Biophys Res Commun. 2018. doi: 10.1016/j.bbrc.2018.11.059. [DOI] [PubMed] [Google Scholar]
- 29.Hou P, Li L, Chen F, Chen Y, Liu H, Li J.. PTBP3-mediated regulation of ZEB1 mRNA stability promotes epithelial-mesenchymal transition in breast cancer. Cancer Res. 2017;78:387–398. [DOI] [PubMed] [Google Scholar]
- 30.Zhang LL, Zhang LF, Guo XH, Zhang DZ, Yang F, Fan YY. Downregulation of miR-335-5p by long noncoding RNA ZEB1-AS1 in gastric cancer promotes tumor proliferation and invasion. DNA Cell Biol. 2017;37:46–52. [DOI] [PubMed] [Google Scholar]
- 31.Zhu H, Zeng Y, Zhou CC, Ye W. SNHG16/miR-216-5p/ZEB1 signal pathway contributes to the tumorigenesis of cervical cancer cells. Arch Biochem Biophys. 2017;637:1–8. doi: 10.1016/j.abb.2017.11.003. [DOI] [PubMed] [Google Scholar]
- 32.Yamashita A, Shichino Y, Yamamoto M. The long non-coding RNA world in yeasts. Biochim Biophys Acta. 2016;1859:147–154. doi: 10.1016/j.bbagrm.2015.08.003. [DOI] [PubMed] [Google Scholar]
- 33.Malek E, Jagannathan S, Driscoll JJ. Correlation of long non-coding RNA expression with metastasis, drug resistance and clinical outcome in cancer. Oncotarget. 2014;5:8027–8038. doi: 10.18632/oncotarget.2469. [DOI] [PMC free article] [PubMed] [Google Scholar]
- 34.Li Y, Chen H, Pan T, Jiang C, Zhao Z, Wang Z.. LncRNA ontology: inferring lncRNA functions based on chromatin states and expression patterns. Oncotarget. 2015;6:39793–39805. doi: 10.18632/oncotarget.5794. [DOI] [PMC free article] [PubMed] [Google Scholar]
- 35.Li H, An J, Wu M, Zheng Q, Gui X, Li T.. LncRNA HOTAIR promotes human liver cancer stem cell malignant growth through downregulation of SETD2. Oncotarget. 2015;6:27847–27864. doi: 10.18632/oncotarget.4443. [DOI] [PMC free article] [PubMed] [Google Scholar]
- 36.Liang WC, Fu WM, Wong CW, Wang Y, Wang WM, Hu GX.. The lncRNA H19 promotes epithelial to mesenchymal transition by functioning as miRNA sponges in colorectal cancer. Oncotarget. 2015;6:22513–22525. doi: 10.18632/oncotarget.4154. [DOI] [PMC free article] [PubMed] [Google Scholar]
- 37.Tian ZZ, Guo XJ, Zhao YM, Fang Y. Decreased expression of long non-coding RNA MEG3 acts as a potential predictor biomarker in progression and poor prognosis of osteosarcoma. Int J Clin Exp Pathol. 2015;8:15138–15142. [PMC free article] [PubMed] [Google Scholar]
- 38.Wang Z, Jin Y, Ren H, Ma X, Wang B, Wang Y. Downregulation of the long non-coding RNA TUSC7 promotes NSCLC cell proliferation and correlates with poor prognosis. Am J Transl Res. 2016;8:680–687. [PMC free article] [PubMed] [Google Scholar]
- 39.Wang S, Wang Z. Prognostic value of long noncoding RNA HOTAIR in digestive system malignancies. J Gastroenterol Hepatol. 2015;30:1123–1133. doi: 10.1111/jgh.12940. [DOI] [PubMed] [Google Scholar]
- 40.Yoshizawa S, Fujiwara K, Sugito K, Uekusa S, Kawashima H, Hoshi R.. Pyrrole-imidazole polyamide-mediated silencing of KCNQ1OT1 expression induces cell death in Wilms’ tumor cells. Int J Oncol. 2015;47:115–121. doi: 10.3892/ijo.2015.3018. [DOI] [PubMed] [Google Scholar]
- 41.Yang H, Zhang H, Ge S, Ning T, Bai M, Li J.. Exosome-derived miR-130a activates angiogenesis in gastric cancer by targeting C-MYB in vascular endothelial cells. Mol Ther. 2018. doi: 10.1016/j.ymthe.2018.07.023. [DOI] [PMC free article] [PubMed] [Google Scholar] [Retracted]
- 42.Wang Y, Zhang CY, Xia RH, Han J, Sun B, Sun SY.. The MYB/miR-130a/NDRG2 axis modulates tumor proliferation and metastatic potential in salivary adenoid cystic carcinoma. Cell Death Dis. 2018;9:917. doi: 10.1038/s41419-018-0966-2. [DOI] [PMC free article] [PubMed] [Google Scholar]
- 43.Park G, Son B, Kang J, Lee S, Jeon J, Kim JH.. LDR-induced miR-30a and miR-30b target the PAI-1 pathway to control adverse effects of NSCLC radiotherapy. Mol Ther. 2018;27:342–354. [DOI] [PMC free article] [PubMed] [Google Scholar]
Associated Data
This section collects any data citations, data availability statements, or supplementary materials included in this article.