Abstract
We develop an agent-based computational simulation to investigate the complex behavior exhibited by an initially regularly spaced train of immiscible droplets passing through a simple two-branch microfluidic network wherein a channel splits into two asymmetric branches that reconnect downstream. As observed by Fuerstman et al. (M. J. Fuerstman, P. Garstecki and G. M. Whitesides, Science, 2007, 315, 828–832), variations in the flow rates within each segment induced by the droplets cause complex droplet spacing patterns to occur in the outlet, leading to periodic and aperiodic behavior. Our model utilizes a highly efficient agent-based modeling approach, where the flow-rates in each section of the network are determined using fundamental concepts of viscous and interfacial flows. Simulations spanned physical parameter space that includes variation in droplet spacing, surface tension, viscosity, and geometry. These simulations demonstrate qualitative agreement with the findings of Fuerstman et al1, including the prediction of interspersed periodic and aperiodic domains. We predict that decreasing droplet contribution to the overall pressure drop (reducing the tube radius or surface tension, increasing the viscosity) would result in increased complexity. The geometric configuration of the system is also critical to pattern formation; a greater disparity in branch length generally results in higher-order periodicities in the outflow channel. The aperiodic results indicate the likelihood of chaotic behavior arising from this purely deterministic system. The consideration of fundamental fluid mechanical principles coupled to the agent-based simulation technique may provide a highly efficient means for the design and analysis of more complex systems.
Introduction and Background
In recent years droplets have been employed in microfluidic devices to contain reactions on a sub-picoliter scale, allowing the precise control of composition and reaction times for applications including PCR2, 3, cellular screening4, and protein crystallization5. Such systems offer high-throughput, low-cost alternatives to full-scale experimentation because droplets provide an ideal environment for compartmentalizing precisely metered quantities of reagents in a tightly-controlled environment. An enormous variety of applications exist for droplet-based systems, as described in ref.6–9. Since the efficacy of these designs depends upon the careful control of the fluid mechanics within the system, it is important to establish accurate and efficient simulation approaches for evaluating design characteristics.
In this paper, we develop and analyze an agent-based theoretical model of droplet motion through a microfluidic network. Our algorithm builds on the work of Jousse et al10, Schindler and Ajdari11, and Sessoms et al12. We extend these studies by exploring pattern formation in the outflow channel and offer a comprehensive discussion of the mechanisms responsible for this nonlinear behavior. We use this approach to simulate the experiments of Fuerstman et al1, who explored the complex behavior that can result when a train of immiscible drops migrates through a two-branch network wherein a channel splits into two asymmetric branches that reconnect downstream.
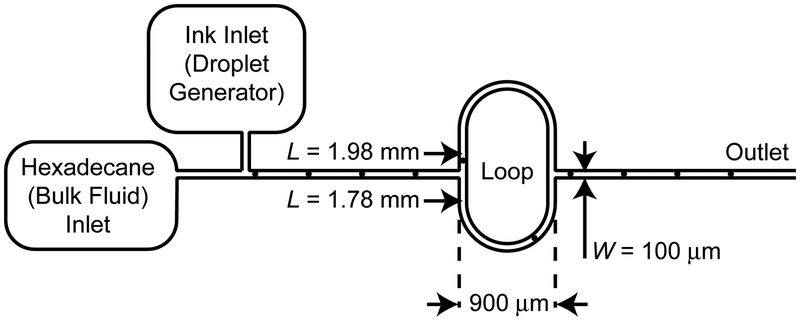
Fuerstman’s experimental apparatus, shown in Figure 1, consists of interconnecting microchannels of width W = 100 μm. The bulk fluid, driven by a constant pressure, consists of hexadecane and 3% mass Span-80 (a non-ionic surfactant), which maintains a low constant surface tension interface that promotes droplet stability. Downstream of the hexadecane inlet, the first T-intersection (labeled ‘Droplet Generator’) provides the input location wherein droplets of ink are introduced at equal time intervals. From this point the bulk fluid and immiscible droplet mixture travels through the inlet to an asymmetric loop that reunites to form the outlet channel.
Figure 1:
Experimental apparatus employed by Fuerstman et al1 to investigate the behavior of a train of immiscible droplets in a microfluidic channel.
Interesting fluid mechanical phenomena are observed due to the asymmetry of the loop structure (L1 = 1.98 mm, L2 = 1.78 mm). As each droplet reaches the up-stream loop T-junction it migrates through the segment with the lowest fluidic resistance (and hence greatest flow rate). This modifies the relative resistances to flow in each segment of the system. As droplets travel through the loop the resistances in each segment evolve dynamically to compensate for the population and distribution of droplets that exist in the system. As a result, even though droplets enter the system at fixed intervals, the droplets exiting the flow loop may emerge with unequal spacing
Fuerstman et al1 found that despite the regular spacing of the droplets in the inlet, fascinating higher-level periodic and aperiodic trains of droplets were observed to exist in the outlet leg. This occurs because of nonlinear flow relationships that arise from temporal variations in the fluidic resistance in each segment of the loop due to the distribution of droplets throughout the network. Hence, each droplet modifies the flow rates in the entire system, influencing the path decisions of subsequent droplets as they enter the upstream loop T-junction. By conservation of mass, this flow alteration also causes variation in the droplet spacing in the outlet channel. For this reason, sequential droplets may reside in each segment of the flow loop for varying time intervals depending upon the distribution of droplets within the network.
This paper has two goals: 1) to develop an efficient computational algorithm based upon fundamental fluid mechanical principles that can accurately simulate the complex pattern formation of droplets emanating in the outflow channel of the microfluidic network of Fuerstman et al1, and 2) to use this computational approach to provide insights into the parameters that govern pattern formation in that system. We believe that an understanding the contributions of these parameters to the dynamic behavior of the system is critical to improving the design and implementation of more complex microfluidic systems. Furthermore, it is expected that the approach developed herein may be generalized for the analysis of more complex systems of microfluidic and biological relevance.
Model Formulation
Conceptual Framework
We have developed a continuous and spatially explicit agent-based model with mobility in which pressure-flow relations for the different segments of the network are solved simultaneously. The resulting flow rates are used to determine droplet velocities in each of the segments using fundamental principles of fluid mechanics and droplet motion. Updating of droplet position occurs very efficiently using large variable-duration time-steps that resolve the transition from one network droplet distribution to another. This approach is similar to the works of Jousse et al10, Schindler and Ajdari11, and Sessoms et al12, utilizing the same time-stepping technique while employing a different set of governing equations. Such droplet-tracking models10–12 fundamentally differ from earlier average-viscosity investigations13, 14 by providing a detailed description of individual particle trajectories. We first validate the capabilities of this technique by modeling the experiments of Fuerstman et al1. Next, we explore the effects experimental parameters such as channel radius R, surface tension γ, viscosity μ, and the ratio of the length of the legs in the flow loop (α = LShort/LLong) on droplet periodicity in the outlet channel.
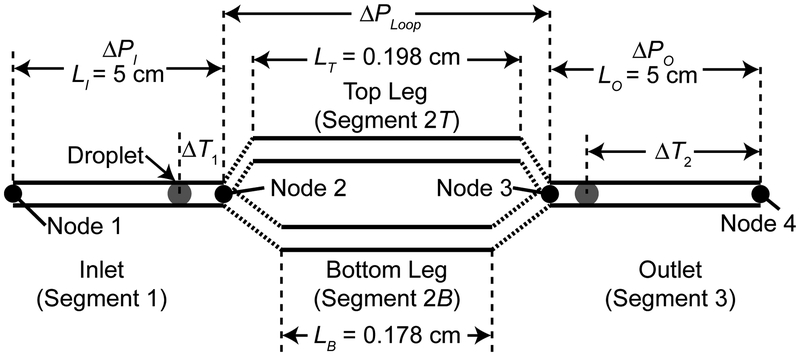
In order to model this system we calculate the pressures and flow rates in each of the segments in our model domain (Figure 2), which is an idealization of the experimental apparatus employed by Fuerstman et al (Figure 1). The flow system is pressure-driven; therefore, the pressure differential between Node 1 and Node 4 is held constant. Although the total pressure drop is held constant, as detailed below, the number of droplets in each segment determines the time-dependent pressure drop (and hence the flow distribution) in each segment of the network. From a global perspective, the sum of the flows in the longer top leg (QT) and shorter bottom leg (QB) of the flow loop must equal the flow rate in the inflow and outflow channels (Q). The pressure drop across the short and long legs of the flow loop (between Nodes 2 and 3) must be equal; however, the flow-rates in each segment are not equal because of the variable droplet-distribution-dependent resistance that exists within each leg. As droplets migrate from segment 1 (the inlet channel) to the flow loop bifurcation, a ‘decision’ is made to travel down the flow segment with the least resistance (higher flow rate). In this process, the pressure drop in each segment changes dynamically, affecting the motion of subsequent droplets.
Figure 2:
Model domain, consisting of an inlet segment leading to a bifurcation where the flow is divided into two legs of unequal length. The flow loop then reunites in the outlet channel, where pattern formation is observed.
This approach is considered to be ‘agent-based’ because each droplet (agent) operates independently, directed by environmental constraints determined by all members of the agent population. Specifically, each droplet (the agent) satisfies the criteria for weak agency described by Wooldridge and Jennings15:
Autonomy – Agents operate without direct intervention. In our model the droplets operate according to deterministic governing equations and pre-established decision rules at the channel intersections.
Social Ability – Agents interact via an agent-communication language. In this study the agent-communication language is fluid velocity, droplets communicate by modifying the flow rate.
Reactivity – Agents perceive their environment and respond to changes. The droplets react to changing environmental conditions, specifically the local flow rate, by altering their velocity w.r.t. the fluid and the laboratory coordinate system. Furthermore, environmental conditions at the bifurcation affect the droplet decision to travel down the short or long leg of the flow loop.
Pro-activeness – Agents do not simply act in response to their environment, they are able to exhibit goal-directed behavior. The droplets do not simply modulate their velocity in accordance with the flow rate; the decisions made at the bifurcation pro-actively reduce the time necessary for an individual droplet to traverse the domain.
Below, we formalize our modeling technique and present an efficient ‘agent-based’ algorithm that is used to explore the non-linear interactions that exist in the idealized system.
Modeling Assumptions
We make a number of assumptions to facilitate the modeling of this complex system. First, the system is modeled as a microfluidic network of tubes with circular cross-sections instead of the rectangular geometry used in Fuerstman’s experiments. We also assume that the droplets do not split as they enter into a bifurcation; instead each droplet will travel down the leg of the flow loop with the greater flow rate, no matter how small the difference in fluidic resistance may be.
In the experimental investigation, a hexadecane/Span-80 mixture carries aqueous droplets, providing an interfacial tension γ = 3.6 dyn cm−1 (16). Additionally, the viscosity of the bulk fluid μ = 0.0295 g cm sec is significantly greater than the viscosity of the droplets μD = 0.01 g cm−1 sec−1. Hodges et al17 showed the behavior of a low-viscosity drop may be approximated by that of a gas bubble if λ << Ca−1/3, where λ = μD/μ, Ca = μU/γ and U is the mean fluid velocity. Since the velocity of the droplets is approximately 0.3 cm sec−1, in the system under investigation λ = 0.34 and Ca−1/3 ≈ 8. As such, we represent the low-viscosity droplets as bubbles of air. Corrections for viscous droplets could be incorporated using the relationships described by Jousse et al14. Furthermore, we consider the droplets to have a volume V > 4πR3/3, an assumption that allows the use of established pressure drop representations for semi-infinite bubbles18.
The Reynolds number Re = ρUR/μB ≈ 10−4 << 1, where ρ is the density and R is the tube radius, indicates that inertial forces play a minor role in comparison to the viscous effects. Because of the extremely low Reynolds number and because the tube radius is significantly smaller than the radius of curvature of the flow loop (RC) the Dean number De = Re(R/RC)1/2 ≈ 5×10⁻⁵, indicating that channel curvature plays an insignificant role in determining the fluid velocity. Furthermore R/Rc ≈ 0.1, which suggests that channel curvature will not significantly alter the relationship between bulk fluid and droplet velocities19. Finally, we assume Poiseuille flow in the bulk fluid between droplets; as such, we do not consider interactions between adjacent droplets.
Governing Equations
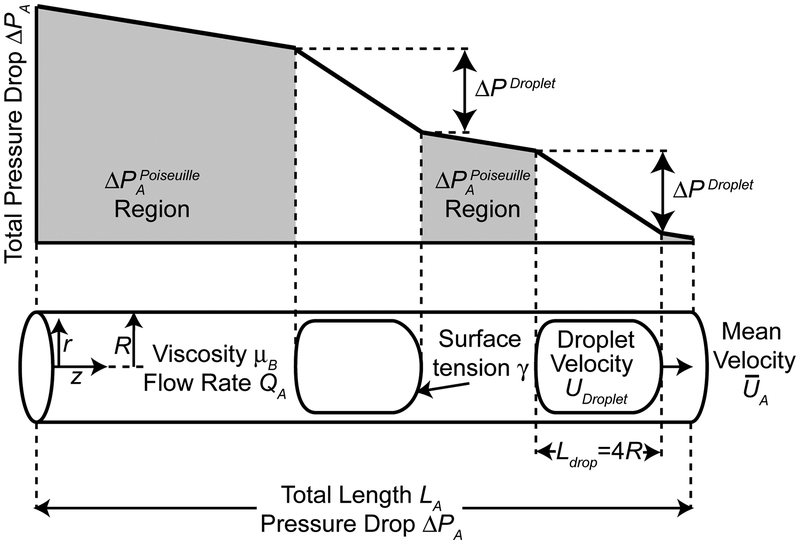
We first consider the pressure-flow relationship occurring in any portion of the model system, shown in Figure 3. Equation (1) describes the pressure drop (ΔPA) across the length (LA) of an arbitrary channel A (denoted with the subscript A) as the combination of the Poiseuille pressure drop in the bulk fluid () and the pressure drop across each of the N droplets (, obtained from Ratulowski and Chang18),
| (1) |
Figure 3:
Pressure drop occurring across an arbitrary section A of the model. The total pressure drop is equal to the sum of the droplet and Poiseuille pressure drops , where N is the number of droplets.
At low Re, the single-phase pressure drop is a function of the flow rate QA, the effective length , viscosity μ, and tube radius R:
| (2) |
In a channel of length LA containing N droplets we apply the Poiseuille pressure drop over the bulk fluid region and reduce the length of the Poiseuille region by assuming that each droplet has a length 4R so that .
The pressure drop across a single isolated droplet is represented as the pressure drop due to a semi-infinite bubble because the bulk fluid is significantly more viscous than the droplets and the volume of the droplet is sufficiently large. We describe the droplet pressure drop with Ratulowski & Chang’s18 result
| (3) |
shown here in dimensionless form. We dimensionalize this relationship with the pressure scale γ/R and :
| (4) |
Substituting (4) and (2) into (1) yields the pressure-flow relationship for an arbitrary section of tube containing N droplets:
| (5) |
Next, we consider the specific geometry used in our simulations, show in Figure 2. The top and bottom legs of the flow loop connect nodes 2 and 3; because of this connectivity the pressure drop across these segments is identical. The pressure drop across the flow loop is
| (6) |
| (7) |
where the subscripts T and B indicate the top and bottom legs of the flow loop, respectively. Because the model fluid is incompressible, the flow in the inlet and outlet channels (Q) is equal to the sum of the flow rates in top and bottom legs of the loop (QB = Q - QT). This relationship allows the elimination of QB, yielding one of the two equations solved at each time step:
| (8) |
The pressure drop from Node 1 to Node 4 is defined as , where the subscripts I and O demarcate the inlet and outlet channels. We apply the equation (5) and simplify to obtain the second equation describing the system:
| (9) |
Solving equations (8) and (9) simultaneously yields the instantaneous flow rate in each segment of the model for a given ΔPTotal and the number of droplets N in each segment. Because of the thin film between the droplet and the wall, the velocity of the droplet (UDrop) will always be greater than the mean velocity in the channel (U). For Ca < 3×10⁻³, we use Bretherton’s 1961 relationship to compute the droplet velocity:
| (10) |
However, this relationship is not valid for higher Ca > 3×10⁻³, in this regime we employ values of UDroplet obtained from the boundary element computations described in Smith and Gaver20, interpolating with cubic splines as necessary. This is a novel feature of our implementation, previous investigations10–12 have employed fixed relationships between bulk fluid and droplet velocities.
Agent-Based Algorithm
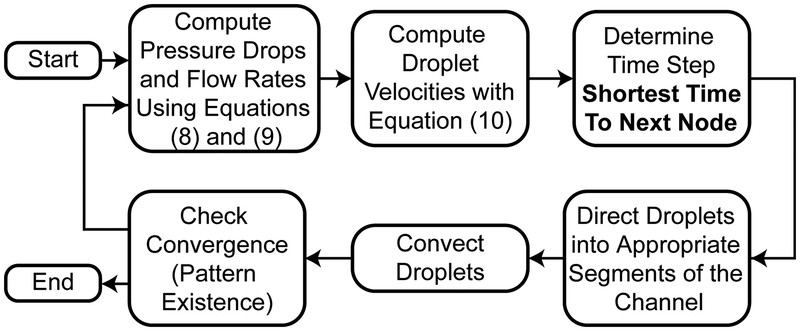
Here we describe our agent-based algorithm (Figure 4) for simulating the flow system, the beauty of which lies in its simplicity, computational economy, and ease of implementation. First, the flow rates in each segment of the model are computed from equations (8) and (9). We then solve equation (10) to determine the droplet velocity in each segment of the network. Each time-step is chosen explicitly as the time increment associated with a redistribution of droplets from one segment to another within the system. As such, the time-step is chosen as the minimum duration necessary for either a droplet to intersect a node or a new droplet to be injected into the system. This time-step is used to convect each droplet in the system according to their local velocities, a concept described in previous studies of droplet motion10–12.
Figure 4:
Agent-based program structure
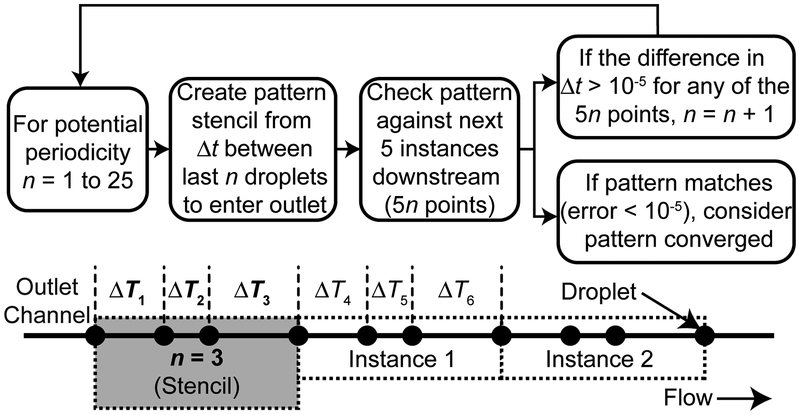
To identify the periodicity (pn, where n is the level of periodicity) in the outlet channel we employ the algorithm shown in Figure 5, which iteratively searches for repeating time increments between droplets in the outlet channel over the range n = 1 to 25. We consider patterns longer than 25 droplets to be aperiodic. To determine the existence of a periodic output of level n, first, a stencil of the time increment (Δt) between the first n droplets in the outlet channel is created. This is the first ‘instance’ of pn, composed of a family of n droplets. This stencil is then applied to the next 5 downstream instances of the potential pattern (5n droplets). If the pattern of Δt repeats for each of the 5 instances at a tolerance of 10−5, we consider the pattern converged. As each droplet exits the system, this approach is used for n = 1 to 25, thereby capturing a wide range of periodicities.
Figure 5:
Pattern recognition subroutine which is used to determine pattern convergence.
Our computational technique, although simple in concept, is formulated to provide fast, accurate resolution of the pattern dynamics in the outlet channel. A multitude of methods are currently employed for simulating two-phase flows, the numerical techniques applicable to LOC applications are discussed in ref.21, 22. These methods, such as finite element23, 24 and boundary element20, 25, 26, discretize both the spatial and temporal domain at high resolution and provide a detailed description of the flow-field throughout the entire domain. However, the complete description comes at a steep computational price. Since our interest lies in the outlet channel periodicities, we employ an agent-based particle tracking technique, solving for the bulk fluid and droplet velocities based on the fixed driving pressure and the number of droplets currently in the system. This highly efficient approach allows us to capture the complex pattern dynamics occurring in the outlet channel without solving for the flow-field in the entire system. Furthermore, more complete CFD analyses must resolve the flow-field in temporal regions that are bypassed with our agent-based technique. By neglecting the microscale flow-field and interim time-steps, our technique operates at rates that are orders of magnitude faster than complete CFD approaches while capturing the complex pattern dynamics in the outlet channel.
Results and Discussion
We first describe the behavior of the system with a baseline parameter set derived from the experiments of Fuerstman et al1, as shown in Table 1. Here, we detail the sequence of events leading to the development of complex outflow patterns. In the ‘Parameter Variation’ sections, we consider the effects of altering the fluid properties (γ and μ) and model geometry (R and α) under conditions of I) fixed driving pressure, and II) fixed transition region inlet spacing from period-1 to higher-order periodicity (we term this ‘fixed ‘). Finally, we discuss the importance of the transition regions and describe the limitations of our model.
Table 1:
Parameter values employed in simulations. The length of the long (top) leg of the flow loop LLong = 1.98 mm. The driving pressure ΔP is chosen so that the transition from period-1 to higher orders of periodicity occurs at = 1.04 sec, as in Fuerstman’s1 experimental investigation.
| Bulk Fluid Viscosity μ (g cm−1 sec −1) |
Surface Tension γ (dyn cm−1) |
Fixed Tin Driving Pressure ΔP (dyn cm−2) |
Fixed ΔP p1 Transition Time (sec) |
Radius R (μm) |
Leg Length Ratio α LShort/LLong |
|
|---|---|---|---|---|---|---|
| Baseline | 0.0295 | 3.6 | 32547 | 1.03 | 50 | 0.9 |
| Low γ | 0.0295 | 1.8 | 19400 | 0.525 | 50 | 0.9 |
| High μ | 0.059 | 3.6 | 38800 | 2.18 | 50 | 0.9 |
| Low R | 0.0295 | 3.6 | 73800 | 4.50 | 25 | 0.9 |
| Low α | 0.0295 | 3.6 | 18600 | 0.415 | 50 | 0.75 |
| High α | 0.0295 | 3.6 | 38600 | 1.25 | 50 | 0.98 |
Baseline Case Behavior
In this section we qualitatively describe the dynamics of the system over a range of incoming droplet spacing (Tin) for the baseline parameter set shown in Table 1. To facilitate this explanation, we first define a nomenclature providing a kinematic snapshot of the system-state at the instant when a droplet enters the flow loop. This description has four components:
the droplet number within the pattern. For example, in a pn case the droplets are labeled as D1 through Dn. So, D3 would refer to the third droplet in the pattern;
the leg that the droplet enters in the loop (S=short, L=long);
the number of droplets already occupying the long leg at the instant the droplet enters the loop (e.g. L2 represents two droplets in the long leg);
the number of droplets already occupying the short leg at the instant the droplet enters the loop (e.g. S1 represents one droplet in the short leg).
So, D3S-L2S1 refers to the third drop of a sequence entering the Short leg at the moment when two droplets are in the Long leg and one droplet exists in the Short leg.
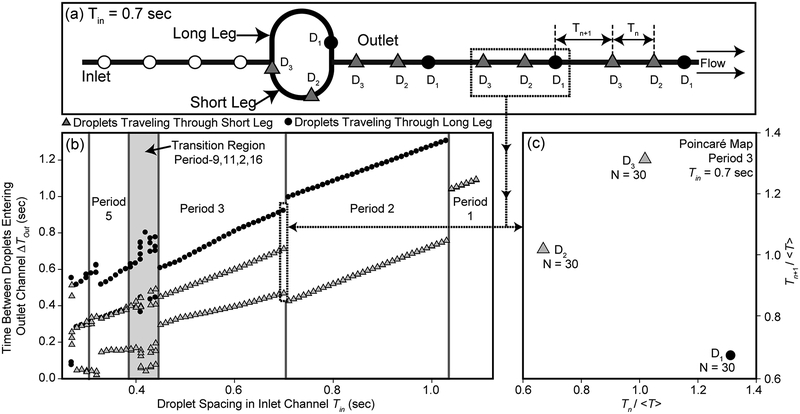
The simplest behavior occurs when droplets are introduced at large time intervals (Tin ≥ 1.04 sec). In this period-1 (p1) mode droplets traveling down the inlet arrive at the flow loop after the previous droplet has passed through the short leg and into the outlet (D1S-L0S0), shown schematically in Figure 6a and categorized in state-space in Figure 7b. Because the flow loop is devoid of droplets, the short leg will always have a lower resistance at the time when subsequent droplets arrive at the bifurcation. Therefore, all droplets follow the same short-leg route, yielding the p1 behavior represented in Figure 7b (Tin ≥ 1.04 sec).
Figure 6:
Graphical representation of the system behavior for p1 (a) and p2 (b).
Figure 7:
Bifurcation (b) and Poincaré maps (c) for the baseline case (μ = 0.0295 g/cm sec, γ = 3.6 dyn/cm, R = 50 μm, α = 0.9, and ΔP = 32547 dyn/cm2). The Poincaré map shows overlaying inter-droplet time-spacing for many instances of p3 behavior occurring at Tin = 0.7 sec, as shown in (a).
As droplet spacing in the inlet channel is reduced (0.70 < Tin < 1.04 sec), the system evolves from p1 into a p2 regime (Figure 7b). In this mode one or more droplets always occupy the flow loop (Figure 6b). The first droplet in an instance (D1L-L0S1) begins to travel down the long leg while D2 from the previous instance remains in the short leg of the flow loop. Subsequently, D2 arrives before D1 has cleared the long leg and will travel down the short leg (D2S-L1S0). Clearly, as this nomenclature demonstrates, all droplets have exited the short leg prior to the arrival of D2, and droplets alternate between the short and long legs in a simple p2 pattern.
Reducing the inlet spacing to 0.44 < Tin ≤ 0.70 sec introduces p3 behavior; however, within this range three distinct droplet patterns are predicted. For 0.60 < Tin ≤ 0.70 sec, the pattern commences with only one droplet from the previous instance (D3) in the short leg. Droplet 1 then enters the long leg of the flow loop (D1L-L0S1); the following droplet satisfies D2S-L1S0. Subsequently, D3S-L1S1 comes to the bifurcation to find one droplet in each branch of the loop and therefore D3 travels down the short leg, as depicted in Figure 7a. This comes in contrast to the p2 case discussed above where this droplet (D3S-L1S1) would have been D1L-L0S1. This difference occurs because the reduced inlet spacing causes the droplet to arrive before a previous droplet has exited the long leg.
As Tin is decreased further within the p3 mode, the transient behavior is changed without altering the outflow periodicity. For 0.48 < Tin ≤ 0.60 sec the sequence of droplets is D1L-L0S2, D2S-L1S1, and D3S-L1S1. Finally, for 0.44 < Tin ≤ 0.47 sec the droplet sequence has changed to D1L-L1S2, D2S-L1S1, and D3S-L1S1. We have included this information to demonstrate the degree of complexity present within state-spaces which appear stable when considering the outlet channel periodicity.
For even more closely spaced incoming droplets (0.40 < Tin ≤ 0.44) the system enters what we refer to as a ‘transition region’, highlighted in gray in Figure 7b. These regions are ranges of Tin where higher-order periodicities (p9, p11, p16) separate larger regions of lower-order behavior (in this case p3 and p5). Because of the complex nature of these patterns we will not include a detailed description of the sequence; it will suffice to say that the rapid increase in periodicity comes from D3L-L1S2 entering the long leg (as opposed to D3S-L1S1 in p3), instigating a chain of flow-rate alterations that yield p9.
Comparison to Experimental Results
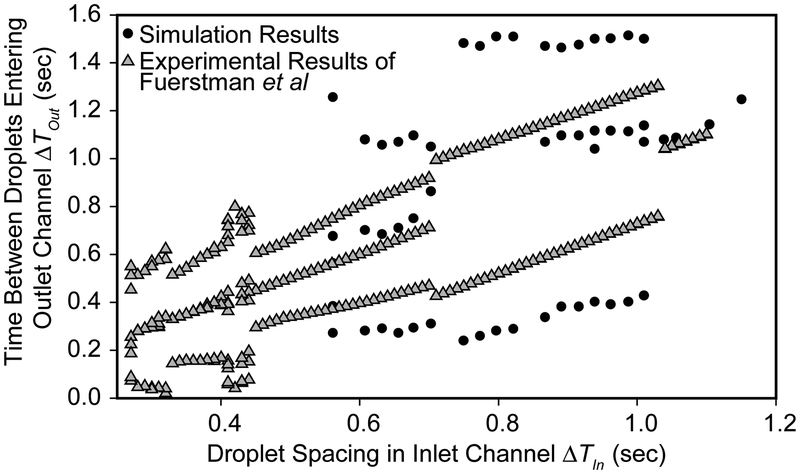
Figure 8 demonstrates the qualitative similarities between our simulation results and the experimental results of Fuerstman et al1, it is evident that our model reproduces the complex patterns in the outlet. Both systems operate in p1 for large inlet droplet spacing and move into higher-order regimes for Tin < 1.04 -- the total pressure drop across our model is defined to match this experimental observation. For 0.70 < Tin < 1.04, the experimental findings show transitions from low-order to higher-order periodicities, and vice-versa. In comparison, our simulations indicate a stable p2 regime. The transition to a stable region of p3 behavior occurs in both the computational experimental models at Tin = 0.70 sec, which finds then models in good agreement down to the minimum Tin experimentally investigated.
Figure 8:
Bifurcation map comparing baseline case simulation results (μ = 0.0295 g cm−1 sec−1, γ = 3.6 dyn cm−1, R = 50 μm, α = 0.9, and ΔP = 32547 dyn cm−2) to Fuerstman’s1 experimental results. The simulation parameters are defined so that the transition from p1 to p3 occurs at an identical Tin to the experiments.
Parameter Variation I (Fixed ΔP)
The surface tension (γ), viscosity (μ), and tube radius (R) play a critical role in determining the behavior of the system. In this section, we consider the effect of these parameters (as detailed in Table 1) on the outlet periodicity when the driving pressure ΔP is held constant. We consider the effect of these parameters on the fluidic resistance of the system Ω = ΔP/Q (evaluated in the inlet channel) and the droplet pressure drop ΔPDroplet (4) which, in turn, changes the inlet time spacing at which the outflow behavior transitions from p1 to higher orders (). The changes in Ω and ΔPDroplet occurring in the cases investigated are detailed in Table 2.
Table 2:
Parameter ratios w.r.t. the baseline case highlighting the important differences between the fixed and fixed ΔP cases.
| Fluidic Resistance Ω | ΔPDroplet (Fix ΔP) |
ΔPDroplet (Fix ) |
Ca (Fix ΔP) |
Ca (Fix ) |
|
|---|---|---|---|---|---|
| Baseline | 1 | 1 | 1 | 1 | 1 |
| Low γ | 16 | 0.91 | 1.45 | 0.25 | 0.57 |
| High μ | 2 | 1 | 1.10 | 1 | 1.19 |
| Low R | 1 | 0.71 | 0.55 | 2 | 1.19 |
| Low α | 1 | 1.00 | 0.74 | 1.00 | 0.57 |
| High α | 1 | 0.99 | 1.09 | 0.99 | 1.19 |
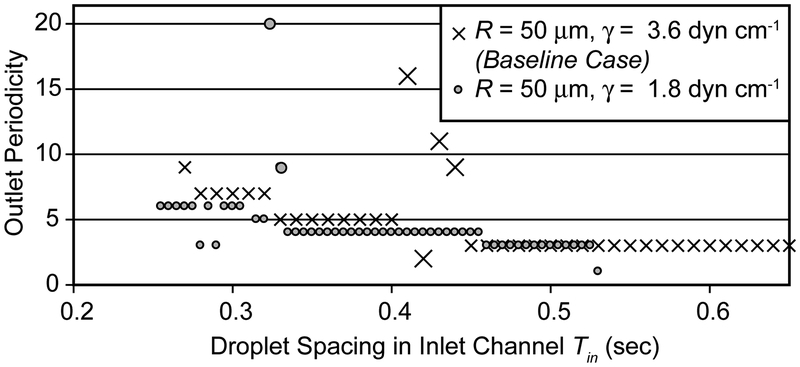
Decreasing the surface tension γ (Figure 9) is a logical place to begin our explanation as the droplet pressure drop (4) is reduced without altering the fluidic resistance in the Poiseuille regions (2), as shown in Table 2. For the system to transition from period-1 (p1) to higher-order periodicities the combined droplet pressure drop in the short leg must be sufficient to overcome the flow differential resulting from length differences between the legs. In the baseline case described above, a single droplet provides a sufficient pressure drop to cause the transition in outlet behavior. However, in the reduced surface tension case the associated reduction in ΔPDroplet necessitates that two droplets be present in the short leg in order for a transition to higher order outputs to exist (at the prescribed ΔP). Because of this, the inlet spacing must be reduced to Tin = 0.525 sec (from 1.04 sec in the baseline case) to cause the transition from p1 to higher orders.
Figure 9:
Outlet channel periodicity for the baseline (R = 50 μm, γ = 3.6 dyn cm−1) and low γ (R = 50 μm, γ = 1.8 dyn cm−1) cases with the driving pressure fixed at ΔP = 32547 dyn cm−2. The onset of higher-order periodicities () for the low γ case occurs at Tin = 0.525 sec, compared to Tin = 1.04 sec for the baseline. Large symbols indicate transition region points.
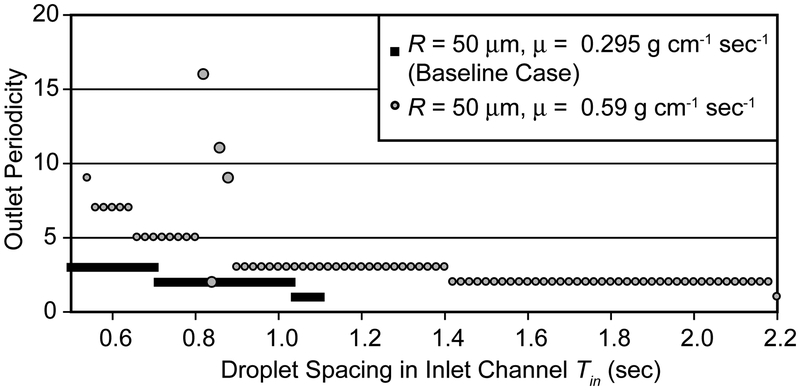
In contrast to the low-γ case, the high-μ case (Figure 10) does not alter ΔPDroplet, despite the presence of viscosity in the formulation shown in Eq. (4). This occurs because the increased viscosity causes a corresponding decrease in the flow-rate - these two factors cancel so that ΔPDroplet remains unchanged. However, because the driving pressure remains unchanged while the flow-rate has been halved, Ω in the high-μ case is twice that of the baseline. Furthermore, the decreased fluid velocity yields a corresponding 50% drop in the droplet velocity. Because the droplets are introduced at regular time intervals and the droplet velocity has decreased, the transition to higher-order outflows occurs at Tin = 2.18 sec. This is primarily a result of increasing the Poiseuille resistance while holding and ΔP fixed.
Figure 10:
Outlet channel periodicity for the baseline (R = 50 μm, μ = 0.295 g cm−1 sec−1) and high μ (R = 50 μm, μ = 0.59 g cm−1 sec−1) cases with the driving pressure fixed at ΔP = 32547 dyn cm−2. The onset of higher-order periodicities () for the high μ case occurs at Tin = 2.18 sec, compared to Tin = 1.04 sec for the baseline. Large symbols indicate transition region points.
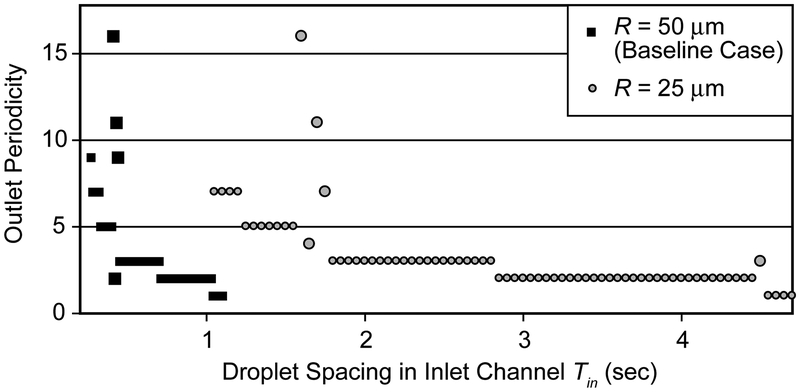
We next consider the R = 25 μm case (Figure 11), the 50% reduction in radius affects both the viscous and droplet contributions to the total pressure drop in the system. The result is that the transition to higher-order periodicity increases to = 4.50 sec. This large value occurs because the droplet velocity is 0.24 times that of the baseline case. Because the disparity in flow rates hinders comparison, in the next section we consider the behavior of the system when varying parameters and holding the inlet droplet spacing at
Figure 11:
Outlet periodicity for tube radii R = 50 μm (baseline case) and R = 25 μm for μ = 0.0295 g cm−1 sec−1, γ = 3.6 dyn cm−1, and α = 0.9. In both cases the driving pressure is identical (ΔP = 32547 dyn cm−2), the increased fluidic resistance resulting by the decreased radius causes the transition from p1 to higher orders to occur at a much larger Tin = 4.5 sec. Large symbols indicate transition region points.
which the system transition to higher orders constant at = 1.04 sec.
Parameter Variation II (Fixed )
In this section, we discuss the influence of γ, R, μ and α on the behavior of the system when the driving pressure ΔP is simultaneously adjusted so that the transition from p1 behavior to higher orders occurs at= 1.04 sec. Defining the pressure in this manner provides further insight into the basic mechanisms responsible for the highly non-linear outlet behavior inherent to the system. We explore the range of parameters shown in Table 1 and consider the fundamental principles dictating the degree of outflow complexity, namely the relative influence of individual droplets. Additionally, we consider the ramifications of parameter variation on the relative positioning of droplets in the outlet channel and droplet reordering, wherein droplets exit the flow loop in a different order than introduced.
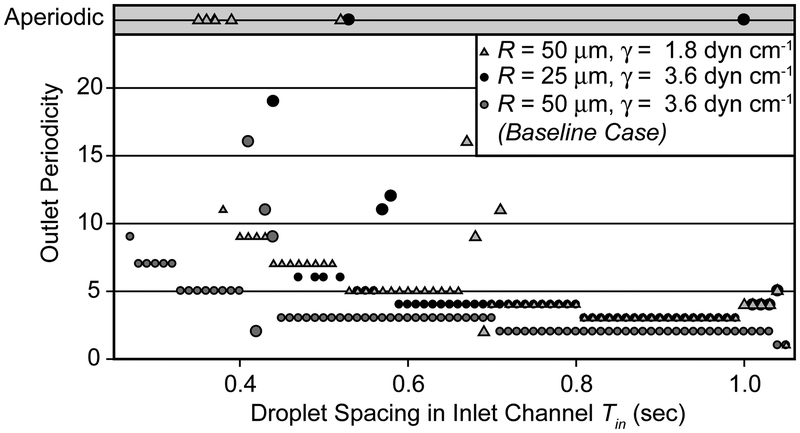
The surface tension γ plays a critical role defining ΔPDroplet (4) as well as the relative speed of the droplet w.r.t. the bulk fluid velocity (10). The surface tension obviously has no effect on the Poiseuille pressure drop (2); therefore decreasing the surface tension will reduce the net effect of each droplet. The outlet periodicities for the baseline (R = 50 μm, γ = 3.6 dyn cm−1), low surface tension (γ = 1.8 dyn cm−1), and reduced radius (R = 25 μm) cases are presented in the bifurcation map shown in Figure 12. Decreasing γ by 50% necessitates a 40% reduction in ΔP in order to retain = 1.04 sec. This, in turn, results in a 23% decrease in ΔPDroplet compared to the low-γ fixed ΔP case (as shown in Table 2). Comparing the reduced R and the reduced γ cases it is clear that both parameters have a markedly similar effect, demonstrating increased complexity in the outlet (at a given Tin) and more prominent transition regions. It is also notable that aperiodic behavior is predicted to exist, indicating the possible existence of chaotic responses in this purely deterministic system.
Figure 12:
Effects of the surface tension γ on periodicity in the outlet channel showing the low γ (γ = 1.8 dyn cm−1, R = 50 μm, ΔP = 19400 dyn cm−2), low R (γ = 3.6 dyn cm−1, R = 25 μm, ΔP = 73800 dyn cm−2), and the baseline cases (γ = 3.6 dyn cm−1, R = 50 μm, ΔP = 32547 dyn cm−2) with μ = 0.0295 g/cm sec and α = 0.9. The low radius and low surface tension cases exhibit similar behavior; in both cases the influence of an individual droplet is reduced. Large symbols indicate transition region points.
The similar behavior found when reducing R and γ while holding = 1.04 sec may come as a surprise given the disparate effects of these parameters when ΔP is fixed, as shown in Figure 9 and Figure 11. With fixed, halving R causes a 16-fold increase in the fluidic resistance of the Poiseuille regions while ΔPDroplet is 2.27 times larger. Despite the increase in ΔPDroplet, a reduction in R has the net effect of decreasing the relative influence of each droplet because of the simultaneously increased Poiseuille resistance. This behavior is identical to that predicted when reducing γ, where the significance of ΔPDroplet is reduced in comparison to the viscous contributions. This similarity is not observed for fixed ΔP because the disparity in the overall resistance of the system results in an order of magnitude difference in the flow rates that dramatically affects .
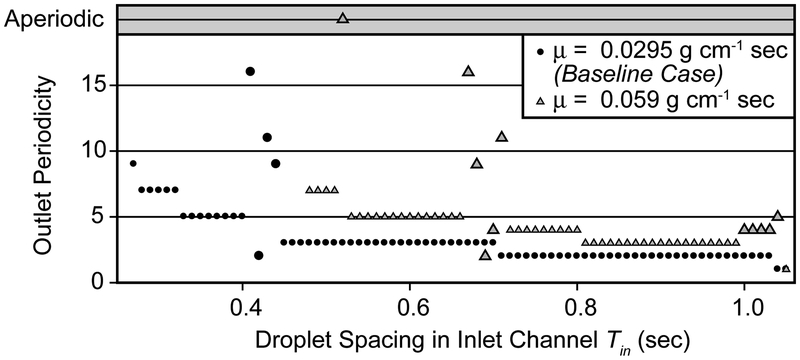
Figure 13 shows the effect of altering the bulk fluid viscosity (μ) on outlet channel periodicity for = 1.04 sec. The viscosity is linearly related to the Poiseuille resistance and ΔPDroplet increases only slightly with μ when is held fixed. Therefore, increasing μ reduces the influence of each droplet, so higher-order periodicities and transition-region behavior is favored. This is in contrast to the behavior witnessed with a fixed ΔP, where an increase in viscosity yields larger Tin and a delayed development of higher-order periodicities.
Figure 13:
Effects of the viscosity μ (at fixed ) on periodicity in the outlet channel showing the baseline (μ = 0.59 g cm−1 sec−1, ΔP =32547 dyn cm−2) and high viscosity (μ = 0.059 g/cm sec, ΔP = 38800 dyn cm−2) cases where γ = 3.6 dyn cm−1, R = 50 μm, and α = 0.9. At a given Tin, periodicity is greater for the high-viscosity case because the Poiseuille pressure drop has increased while the droplet pressure drop remains relatively constant. Large symbols indicate transition region points.
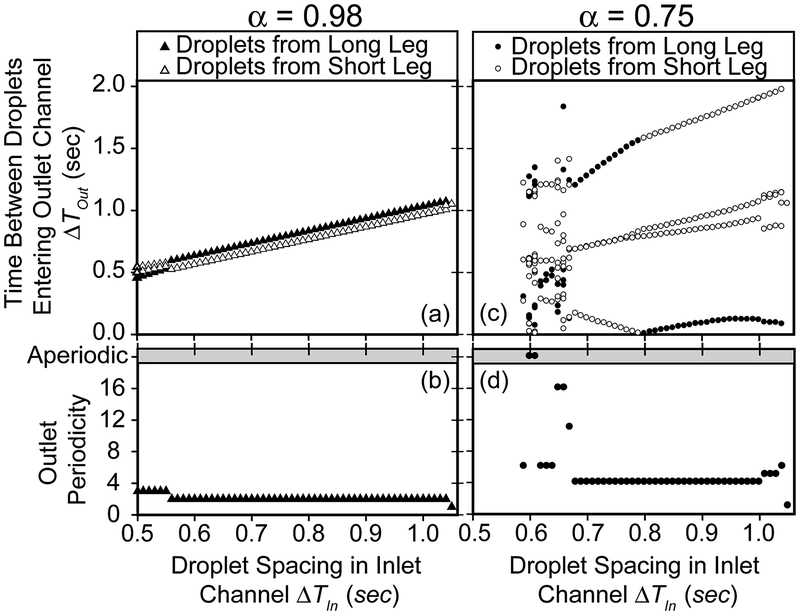
Altering the ratio of the leg lengths (α = LShort/LLong) while fixing = 1.04 sec produces a dramatic effect as demonstrated in the bifurcation map that relates the inlet to outlet spacing (Figure 14a and c) and the outlet periodicities shown in Figure 14b and d. Figure 14a and c show the relationship between the inlet and outlet channel droplet spacing, each value of Tin represents an independent run of the simulation. Grey symbols denote droplets traveling trough the short leg of the flow loop and black symbols indicate passage through the long leg. The slight asymmetry between the legs of the flow loop (less pronounced than in the baseline case) results in outlet spacing near the identity line and p3 behavior is not found until Tin < 0.57 sec (Figure 14b). Reducing α (increasing the disparity in length) requires the presence more droplets within the short leg to sufficiently reduce the flow in that leg and force droplets into the long branch, producing higher-order periodicities (Figure 14d). Therefore, low values of α are conducive to higher-order periodicities soon after making the transition from p1 to higher-order periodicities (as reported by Jousse et al10).
Figure 14:
Bifurcation maps (a,c) and outlet periodicities (b,d) describing the substantial effects of the leg length ratio α = LLong/LShort for α = 0.98 (A and B, ΔP = 38600 dyn cm−2) and α = 0.75 (C and D, ΔP = 19700 dyn cm−2) at μ = 0.0295 g/cm sec, γ = 3.6 dyn cm−1, and R = 50 μm. Reducing the leg length ratio (increasing the disparity in lengths) results in a wider distribution of droplet spacing and higher-order periodicities at a given Tin.
Increasing the asymmetry of the loop also serves to increase the irregularity of the pattern in the outflow channel. The irregular outlet spacing is demonstrated in the bifurcation diagram for α = 0.75 (Figure 14c) by the wide range of ΔTout occurring at a given Tin. The range of time between droplets is inversely related to α - more unequal leg lengths produce a greater variation in droplet spacing in the outlet channel. Additionally, the lower band of ΔTout is close to zero for α = 0.75 at Tin = 0.8 sec, indicating that droplets in the outlet channel are immediately adjacent to each other. Successful passive droplet fusion relies on positioning the two droplets adjacent to each other, this behavior is exhibited in the α = 0.75 case. Also note that in the lower band droplets arrive from the long leg for Tin ≥ 0.8 sec and the short leg for Tin < 0.8 sec, this occurs because these droplets are now emerging from the flow loop in a reversed order.
Reordering of droplets in the outlet channel, a potentially important design characteristic, is promoted with decreasing values of α. Reducing the length of the short leg increases the likelihood of a droplet remaining in the long leg while a subsequent droplet moves through the short leg and emerges into the outlet. Reordering of drops in the outlet occurred for all Tin < 1.05 sec for α = 0.75, whereas this phenomenon was not observed in the α = 0.98 simulations. However, decreasing α while holding the other parameters constant increases the number of droplets necessary to sufficiently change the flow rate and drive a droplet into the long leg. This results in increased transition region prominence and promotes higher-order periodicities, akin to the reduced droplet influence responsible for such phenomenon when varying R, μ, and γ.
Transition Regions
We have found that transition regions (highlighted in gray in Figure 7b and indicated by large symbols in Figures 8–13) occur between large, established zones of stable periodicity. These higher-order regions arise when the Δt separating droplets arriving at the flow loop bifurcation and outlet channel is small. For example, Figure 10 shows the outlet channel periodicity for the baseline, low R, and low γ cases for fixed . It is clear that the reduction in R favors the existence of the transition regions occurring between the p1-p3, p4-p5, and p5-p6 (low R) or p5-p7 (low γ) regimes whereas higher-order behavior is not observed in these regions for the baseline case. Generally, we find that decreasing the relative influence of a droplet while holding fixed will increase the prevalence of transition regions.
Transition regions must be considered when utilizing droplet periodicity in device design. If the application specifies that a certain spacing, order, or pattern of droplets is present in the outlet then the parameters (R, μ, γ, and α) should be selected to place the device output in a region of stable periodicity away from transition regions. This will reduce the effect of fluctuations in the operating parameters (including the driving pressure ΔP) or variations in the device itself from significantly affecting the output.
Limitations
Because of the simplifying assumptions used in creating our model, we do not expect to exactly match the experimental results of Fuerstman et al. For example, we consider a cylindrical tube, as opposed to a rectangular cross section – this allows us to use well-established pressure-flow relationships (3), but may deviate slightly from rectangular duct models. Furthermore, the dynamics of droplet transitions from channel to channel are neglected and we assume that a Poiseuille flow field exists between droplets, disregarding the transition to this fully-developed flow. However, despite these shortcomings our model allows understanding of the effects of parameter variation on the outlet periodicity in this system. Future versions of this model may employ relationships describing flow through square channels, and well as the effects of junctions and closely-spaced droplets.
Conclusions
We have created an agent-based model of droplet flow through a two-branch microfluidic network in order to investigate pattern formation in the outlet channel. This model is capable of qualitatively reproducing the experimental findings of Fuerstman et al1. We elucidate the behaviors responsible for pattern formation and explore the effects of parameter variation on outlet periodicity. This study is intended to facilitate the design and development of more complex droplet-based microfluidic networks by providing an improved understanding of the fluid-mechanical forces responsible for the complex behaviors observed experimentally.
When holding the driving pressure ΔP fixed the droplet spacing at which the system transitions from p1 to higher orders () is strongly dependent on the fluidic resistance Ω and the droplet pressure drop ΔPDroplet. Increased Ω logically results in larger values of because the flow-rate in the channel (and the droplet velocity) will decrease. Reducing ΔPDroplet from that of the baseline case (such as decreasing γ) may influence the number of droplets necessary to overcome the difference in flow-rates due to the unequal length of the legs. When this occurs, will be dramatically reduced and the system will tend to go from p1 to p3 or higher, bypassing the p2 mode.
We have found that the magnitude of the pressure differential associated with each droplet relative to the viscous pressure drop in the bulk fluid is critical in determining the outflow behavior of the system. This influence decreases when the droplet pressure drop (ΔPDroplet) decreases (such as reduced γ) or the viscous pressure drop in the bulk fluid is increased (such as decreasing R or increasing μ). When the influence of an individual droplet is low higher-order periodicities are achieved at a given inlet droplet spacing Tin.
The length ratio of the two legs of the flow loop (α = LShort/LLong) also plays a critical role in determining the behavior of the system. When α ~ 1 (similar leg lengths), lower-order periodicities are common and this results in even droplet spacing in the outlet. As demonstrated by Figure 14, decreasing α (increasing leg asymmetry) leads to higher-order periodicities, increased the variation in the distance between droplets in the outlet, and results in droplet reordering since more droplets are required to overcome the disparity in flow rate between the short and long legs of the flow loop.
Finally, we predict the existence of localized regions of higher-order periodicities, termed transition regions, that are favored by a reduced droplet influence (i.e. reduced ΔPDroplet or increased Poiseuille pressure drop). These transition regions occur because of the small Δt separating droplets entering and departing the flow loop, and fluctuations in the flow rate caused by transient droplet dynamics that alter droplet timing to create higher-order periodicities in the outlet. This behavior is a striking demonstration of the fascinating system responses that can arise from simple deterministic systems.
Acknowledgements
This research was supported in part by NIH (R01-HL8126), NSF (EPS-0701491) and the Louisiana Board of Regents Support Fund (NSF/LEQSF(2007–10)-CyberRII-05).
References
- 1.Fuerstman MJ, Garstecki P and Whitesides GM, Science, 2007, 315(5813), 828–32. [DOI] [PubMed] [Google Scholar]
- 2.Williams RP, G. S, Miller OJ, Magdassi S, Tawfik DS and Griffiths AD, Nat. Methods, 2006, 3, 545–50. [DOI] [PubMed] [Google Scholar]
- 3.Beer NR, Hindson BJ, Wheeler EK, Hall SB, Rose KA, Kennedy IM and Colston BW, Anal. Chem, 2007, 79, 8471–5. [DOI] [PubMed] [Google Scholar]
- 4.Clausell-Tormos J, Lieber D, Baret JC, El-Harrak A, Miller OJ, Frenz L, Blouwolff J, Humphry KJ, Köster S, Duan H, Holtze C, Weitz DA, Griffiths AD and Merten CA, Chem Biol, 2008, 15(8), 427–37. [DOI] [PubMed] [Google Scholar]
- 5.Zheng B, Tice JD and Ismagilov RF, Anal. Chem, 2004, 76, 4977–82. [DOI] [PMC free article] [PubMed] [Google Scholar]
- 6.Huebner A, Sharma S, M. S-A, Hollfelder F, Edel JB and deMello AJ, Lab Chip, 2008, 8, 1244–54. [DOI] [PubMed] [Google Scholar]
- 7.Stone HA, Stroock AD and Ajdari A, Annu. Rev. Fluid Mech, 2004, 36. [Google Scholar]
- 8.Tan Y-C, Fisher JS, Lee AI, Cristini V and Phillip A, Lab Chip, 2004, 4, 292–8. [DOI] [PubMed] [Google Scholar]
- 9.Khandurina J and Guttman A, J. Chromatogr. A, 2002, 943, 159–83. [DOI] [PubMed] [Google Scholar]
- 10.Jousse F, Farr R, Link DR, Fuerstman MJ and Garstecki P, Phys. Rev. E, 2006, 74(036311), 1–5. [DOI] [PubMed] [Google Scholar]
- 11.Schindler M and Ajdari A, Phys. Rev. Lett, 2008, 100. [DOI] [PubMed] [Google Scholar]
- 12.Sessoms DA, Belloul M, Roche M, Courbin L and Panizza P, Phys. Rev. E, 2009, 80(016317), 1–10. [DOI] [PubMed] [Google Scholar]
- 13.Engl W, Roche M, Colin A, Panizza P and Ajdari A, Phys. Rev. Lett, 2005, 95, 208–304. [DOI] [PubMed] [Google Scholar]
- 14.Jousse F, Lian G, Janes R and Melrose J, Lab Chip, 2005, 5, 646–56. [DOI] [PubMed] [Google Scholar]
- 15.Wooldridge M and Jennings N, Knowl Eng Rev, 1995, 10(2), 115–52. [Google Scholar]
- 16.Adzima BJ and Velankar SS, J. Micromech. Microeng, 2006, 16, 1504–10. [Google Scholar]
- 17.Hodges SR, Jensen OE and Rallison JM, J. Fluid Mech, 2004, 501, 279–301. [Google Scholar]
- 18.Ratulowski J and Chang H-C, Phys. Fluids A, 1989, 1, 1642–55. [Google Scholar]
- 19.Muradoglu M and Stone HA, J. Fluid Mech, 2007, 570, 455–66. [Google Scholar]
- 20.Smith BJ and Gaver DP, J. Fluid Mech, 2008, 601, 1–23. [DOI] [PMC free article] [PubMed] [Google Scholar]
- 21.Boy DA, Gibou F and Pennathur S, Lab Chip, 2008, 8, 1424–31. [DOI] [PubMed] [Google Scholar]
- 22.Cristini V and Tan Y-C, Lab Chip, 2004, 4, 257–64. [DOI] [PubMed] [Google Scholar]
- 23.Giavedoni MD and Saitia FA, Phys. Fluids, 1997, 9, 2420–8. [Google Scholar]
- 24.Shen EI and Udell KS, ASME J. Appl. Mech, 1985, 52, 253–6. [Google Scholar]
- 25.Halpern D and Gaver DP III, J. Comput. Phys, 1994, 115, 366–75. [Google Scholar]
- 26.Lu W-Q and Chang H-C, J. Comput. Phys, 1988, 77, 340–60. [Google Scholar]


