Abstract
We demonstrate that although barometric pressures are complicated signals comprised of numerous frequencies, it is a subset of these frequencies that drive the overwhelming majority of gas transport in fractured rock. Using an inverse numerical analysis, we demonstrate that a single barometric component with seasonally modulated amplitude approximates gas transport due to a measured barometric signal. If past barometric tendencies are expected to continue at a location, the identification of this frequency can facilitate accurate long term predictions of barometrically induced gas transport negating the need to consider stochastic realizations of future barometric variations. Additionally, we perform an analytical analysis that indicates that there is a set of barometric frequencies, consistent with the inverse numerical analysis, with high production efficiency. Based on the corroborating inverse numerical and analytical analyses, we conclude that there is a set of dominant gas transport frequencies in barometric records.
Subject terms: Environmental impact, Hydrology
Introduction
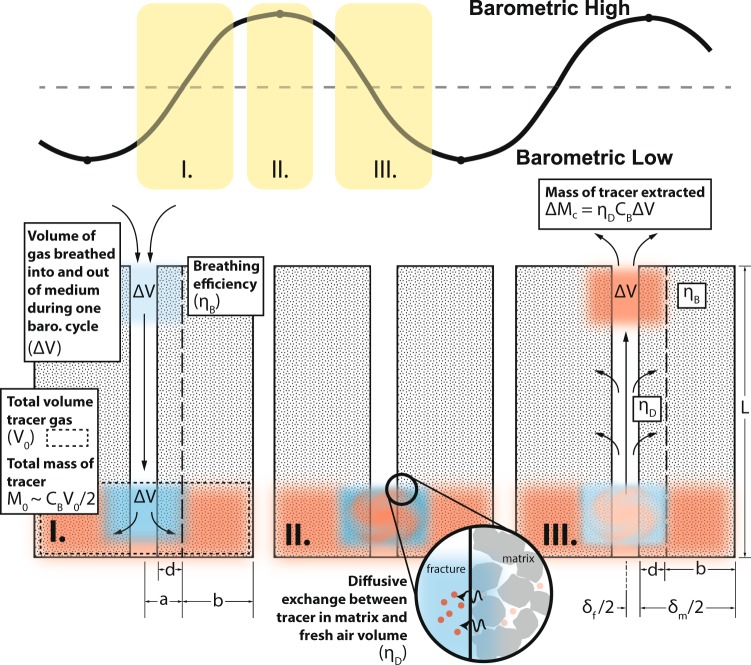
Predictions of gas transport can be improved for many applications by better understanding the effect of barometric variations on gas transport in fractured rock. Barometric variations push gases deeper into the fractured rock during barometric highs and pull gases upward during barometric lows1–5. Figure 1 contains a schematic conceptualization of this process with details that will be referred to throughout this paper. Fractures provide fast pathways for gas transport while the rock matrix provides relatively immobile gas storage in between barometric cycles, allowing for a ratcheting mechanism that greatly enhances gas transport. Barometric variations can drive leakage from CO2 sequestration sites6–10, leakage of methane from hydraulic fracturing operations11, radon gas entry into buildings12, and radionuclide gas seepage from underground nuclear explosions and waste storage13–19.
Figure 1.
Schematic representation of barometric pumping of gas through a fracture. The portion of the barometric curve that Panel I, II, III are associated with is indicated along the top of the schematic. The breathing efficiency (ηB), diffusive exchange efficiency (ηD), and important quantities used and defined in the analytical analysis are indicated. CB is the tracer concentration.
One of the primary uncertainties in making predictions of barometrically-induced gas transport is that the future barometric variations are highly uncertain and cannot be accurately forecasted past a few weeks. Barometric pressure fluctuations are complex signals composed of many frequencies driven by multiple processes including atmospheric tides, weather patterns, and seasonal and annual cycles and are highly dependent on latitude and elevation. Many previous researchers have assumed that barometric variations due to roughly weekly weather patterns are important frequencies to consider for gas transport in fractured rock. Nilson et al.1 identified that the barometric period with the highest amplitude at the National Nuclear Security Site (NNSS) was approximately 7.2 days based on historical data. Mourzenko et al.20 use a synthetic sinusoidal barometric signal with period of approximately 7.3 days to represent weather patterns at Roselend Natural Laboratory in France for their numerical investigations. Neeper3 also assumed that weekly weather patterns are important for gas transport in fractured rock. However, in our investigations, a spectral analysis of a barometric record results in many frequencies with similar amplitude making it difficult to identify a single dominant barometric frequency. We also demonstrate that the barometric sinusoidal component with the largest amplitude will not necessarily be associated with the dominant gas transport frequency.
This paper presents the first detailed analysis of the identification of the dominant gas transport frequency through corroborating inverse numerical and analytical analyses. Using barometric pressures measured in Anchorage, AK from 2014 through 2017, we first present the decomposition of a barometric pressure record into sinusoidal components (amplitude/frequency pairs). Anchorage was chosen since it is representative of a location with large barometric variations. Then, we present an inverse analysis using a numerical model of gas transport within a fractured domain demonstrating that a dominant transport frequency can be identified that reproduces gas transport simulated using the measured barometric pressures. Next, we perform an analytical analysis of gas production efficiency using the decomposed barometric pressure record. From this we identify a set of highly efficient frequencies for producing gas that are clustered around the frequency identified in the inverse numerical analysis. Finally, we provide conclusions based on the corroborating evidence from the inverse numerical and analytical analyses.
Barometric Pressure Decomposition
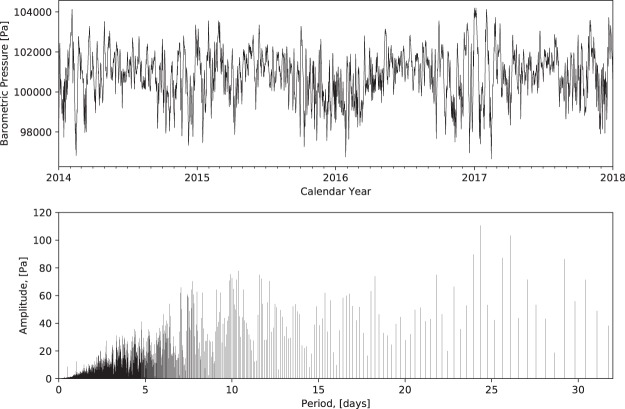
We obtained hourly barometric pressure data from Anchorage, AK from 2014 through 2017 from Weather Underground (www.wunderground.com). In order to obtain a uniform one hour spacing, we linearly interpolated a few missing measurements and removed a few extra intra-hour measurements in the record (top plot in Fig. 2). We decomposed the data into the frequency domain using a Fast Fourier Transform (FFT) algorithm21 in the bottom plot of Fig. 2, where the barometric period is T = 2π/ω, where ω is the barometric frequency. From this plot, it is apparent that the barometric signal is a complicated combination of many components (frequency/amplitude pairs). While a period of around 24 days has the largest amplitude, our analysis below will demonstrate that this is not the dominant gas transport frequency. Therefore, unlike the case in Nilson et al.1, where the dominant gas transport frequency is identified as the frequency with the largest amplitude, it is not possible to identify the dominant gas transport frequency simply based a spectral analysis alone.
Figure 2.
Measured barometric pressure record from Anchorage, AK (top) and associated amplitude/period pairs (bottom).
Numerical Modeling Analysis
We use a 2D numerical model to simulate air flow and gas transport and immobile pore-water storage of dissolved gas within a partially-saturated, fractured rock with 1 mm vertical fractures separated by 10 m. The 2D planar model domain comprises a vertical half fracture (δf/2 = 0.5 mm) connected to a matrix half block (δm/2 = 5 m) extending 100 m deep (refer to Panel III of Fig. 1). The vertical sides of the model are reflection (zero-flux Neumann) boundaries allowing the half fracture/half matrix block to represent a series of fractures/matrix blocks. The bottom is also a zero-flux Neumann boundary representing an extremely low permeability bedrock or a water table. The bottom 5 m of the model is populated with a gas tracer concentration of 1 mol/L. A time-varying pressure boundary is applied to the top of the model representing barometric variations. The model is implemented in the PFLOTRAN simulator22 with modifications to allow for kinetic dissolution and exsolution of gas between air and immobile pore-water. The model is described in detail and verified against a suite of analytical solutions in Harp et al.5.
Identifying the dominant gas transport frequency
We calibrate the synthetic pressures using a Levenberg-Marquardt optimization approach23 implemented in the PEST software package24. An initial calibration using a single frequency synthetic barometric signal with constant amplitude resulted in a seasonal mismatch in concentrations (for details, refer to Section S1 in Supporting Material). By inspecting the top plot in Fig. 2, it is apparent that the barometric pressures during the summer months have lower amplitudes than during winter months. We therefore defined a seasonally modulated synthetic barometric pressure signal as
| 1 |
where is the mean amplitude of the dominant gas transport frequency, is the amplitude of the seasonal modulation, ωd is the dominant gas transport frequency, ωs is the seasonal modulation frequency (Ts = 1 year, where ωs = 2π/Ts), and γd and γs are the phase shift of the dominant gas transport frequency and seasonal modulation, respectively, and is a vector containing the calibration parameters. The () term captures the seasonal modulation about the mean of the dominant gas transport frequency. The objective function F minimized in the calibration is
| 2 |
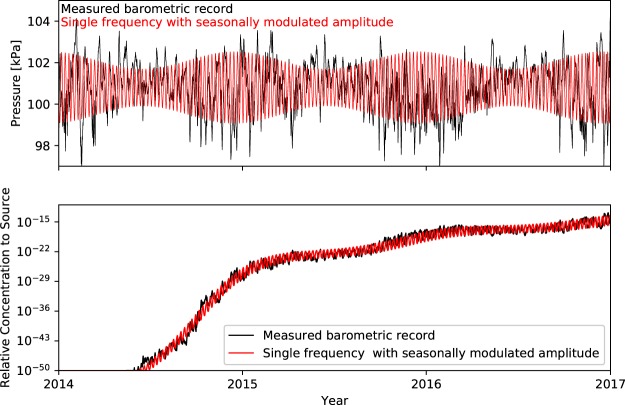
where and are the ith tracer concentrations at the ground surface driven by the measured and synthetic barometric signals, respectively. We plot the calibrated seasonally modulated barometric signal in the top plot of Fig. 3 as the red line along with the measured barometric record as the black line. In the bottom plot of Fig. 3, concentrations simulated using the synthetic barometric signal (red line) and measured barometric record (black line) are plotted, demonstrating that a seasonally modulated single frequency barometric signal is able to closely approximate concentrations driven by a measured barometric record. This calibration reduced the standard error of the concentration residuals by approximately half compared to the calibration with constant amplitude barometric frequency (Section S1 in Supporting Material).
Figure 3.
Top: Calibrated barometric signal with single, constant amplitude frequency (red line) with the measured barometric record (black line) for reference. Bottom: Gas concentrations (relative to the source concentration) at the top of the fracture (ground surface) simulated using a calibrated single frequency barometric signal with seasonally modulated amplitude from the top plot (red line). The relative concentrations driven by the measured barometric signal from the top plot (black line; calibration targets) are provided for reference.
The calibrated parameter values are Pa, Td = 7.29 days, Pa, and γs = 1.85 radians. We calibrated γd, but the calibration was insensitive to its value because the gas transport in our example is a longer term process resulting from a succession of barometric cycles, and therefore identifying a phase shift is not critical to match the overall concentration trend.
Sensitivity of calibrated barometric parameters to subsurface domain scenarios
Based on an analysis of the sensitivity of tracer concentrations at the top of the fracture to subsurface domain parameters, we identified that the concentrations are most sensitive to the depth to impermeable layer L and matrix permeability km (refer to Section S2 in Supporting Material for details). Therefore, since L and km have the largest potential to alter the calibration of the barometric parameters (), we focus on these subsurface domain parameters for further investigation.
We perform a joint inversion to calibrate the barometric parameters to match the concentrations simulated using the measured barometric record from 4 subsurface domain scenarios: (1) L = 50 m; (2) L = 150 m; (3) km = 10−19 m2, and (4) km = 10−17 m2, with the other subsurface properties at their base case values (δm = 10 m, L = 100 m, matrix porosity ϕm = 0.01 m3/m3, km = 10−18 m2, δf = 1 mm, and matrix saturation Sm = 0.5 m3/m3). The objective function for this joint inversion can be described by extending Eq. 2 as
| 3 |
where and are the ith concentrations of the jth simulation driven by the measured and synthetic barometric signal, respectively, with in this case.
In Fig. 4, we present the calibrated concentrations (red lines) against the concentrations simulated with measured barometric pressures (black lines). These plots illustrate that it is possible to use a single synthetic barometric signal with seasonally modulated amplitude to capture concentrations simulated with an actual barometric signal for various subsurface model domains and properties. The calibrated parameter values from this inversion are Pa, Td = 7.29 days, Pa, γs = 1.59 radians. These values are similar to those from the base case inversion presented above.
Figure 4.
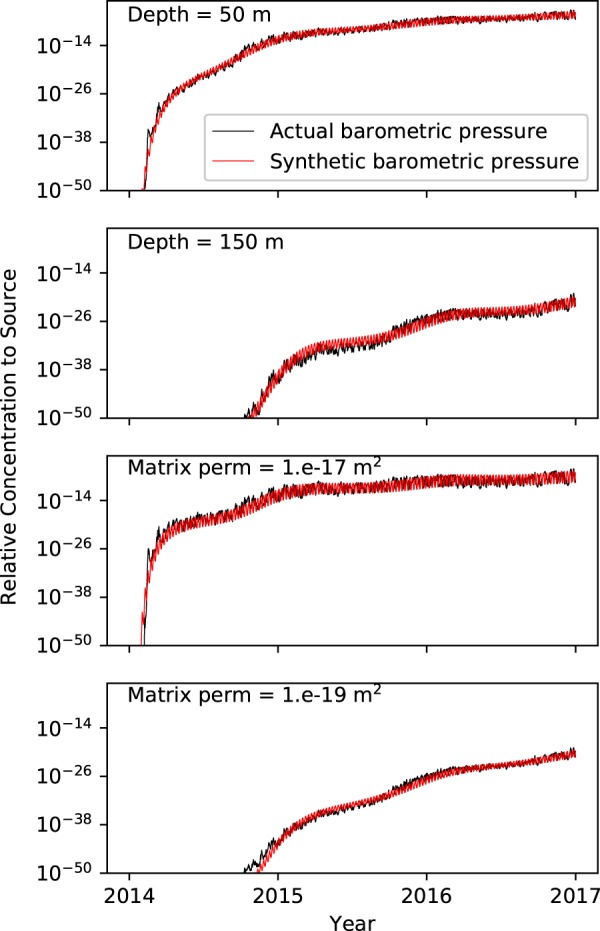
Results of a joint calibration of a seasonally-modulated single frequency barometric signal including concentrations from 4 subsurface domain scenarios. Concentrations at the top of the fracture (ground surface) driven by measured barometric pressures (calibration targets) are black lines and calibrated concentrations are red lines.
Analytical Analysis
The mass discharge efficiency of a barometric frequency is dependent on its ability to push and retract atmospheric air into and out of fractured rock and allow sufficient time for the diffusive exchange of gas into this air while at the depth of the tracer, and retain the gas during the return trip to the atmosphere (i.e., not lose too much gas due to diffusion into matrix without tracer). The mass discharge efficiency (ηM) can be defined as the mass of tracer removed from the subsurface during one barometric cycle (ΔMc) relative to the original mass of tracer in the subsurface (M0) as
| 4 |
where, assuming a linear concentration gradient with depth, M0 can be approximated as
| 5 |
where CB is the concentration of the tracer gas and V0 is the volume of air with tracer1. The dominant gas transport frequency will not only depend on ηM but will also depend on the frequency of occurrence of the barometric component. For example, a barometric component with lower ηM may remove more gas from the subsurface over time than a less frequent component with higher ηM simply because it occurs more often. We define the production efficiency (ηP) as a metric for identifying dominant gas transport frequencies by multiplying ηM by the frequency as
| 6 |
In order to approximate ΔMc analytically, the exchange of fresh air with air containing tracer can be conceptualized as occurring within a packet of air with volume ΔV that travels down the fracture and a portion of the matrix wall that has been invaded by incoming fresh air1. Figure 1 illustrates this conceptualization and many of the quantities used below. The thickness of this packet of air in half-space considering both the half fracture thickness and the invaded region of the associated matrix half block (d) is . The remainder of the matrix half block is then the region with tracer which has a thickness of . Based on this conceptualization, Nilson et al.1 derive an analytical equation for ΔMc (refer to Panel III of Fig. 1) as
| 7 |
where Wa is the Womersley number modified to account for the porosities of the given problem defined as and β is the ratio of the volume of clean air versus air with tracer calculated as , where ϕc is calculated as the volume weighted average porosity of the fracture and invaded region as , where ϕf is one in our case, and .
If the subsurface were in perfect equilibrium with the surface, i.e., the pneumatic diffusivity were extremely large so that pressure variations at the ground surface are immediately transferred throughout the subsurface, the ratio of ΔV to the total volume of subsurface air with tracer V0 would be proportional to the ratio of the change in pressure (amplitude) Δp to the mean static pressure p0 as
| 8 |
Based on this relationship, the conceptual maximum volume of air that could be extracted from the subsurface due to a single cycle of a barometric component is
| 9 |
where the variables have been defined earlier. However, due to finite pneumatic diffusivity in the fracture and matrix, perfect pressure equilibrium is never achieved throughout the subsurface. Using a double porosity (fracture/matrix) analytical solution, Nilson et al.1 derive an analytical solution for ΔV as
| 10 |
where the λ’s are dimensionless Fourier numbers that define the ratio of the diffusive transport rate to the storage rate defined as
| 11 |
| 12 |
and
| 13 |
where the subscripts fm, f, and m denote the composite fracture and matrix, fracture only, and matrix only, respectively. αf and αm are pneumatic diffusivities, where αf is defined using the cubic law as and αm is αm = kmp0/(ϕmμ), where μ is air viscosity.
Inserting Eq. 10 into Eq. 7, and then Eqs 5 and 7 into Eq. 6, ηP can be expressed as
| 14 |
This equation can also be derived from the breathing efficiency (ηB), which quantifies the volume of air that a barometric cycle is able to extract (ΔV) relative to the maximum volume that could be removed if the subsurface were in perfect equilibrium with the atmosphere (ΔVmax), defined as
| 15 |
and the diffusive exchange efficiency (ηD), which quantifies the fraction of the mass of air with tracer that is removed (ΔMc) versus the maximum mass that would be removed if the concentration of the packet of air could achieve and maintain the concentration of the air with tracer in the subsurface (CBΔV), defined as
| 16 |
Refer to Fig. 1 for depictions of ηB and ηD. Nilson et al.1 combine ηB and ηD into the overall transport efficiency η as
| 17 |
to describe the efficiency of a single cycle of a barometric component to extract gas from the subsurface (i.e., considering a single cycle in isolation, not the ability of the barometric component to extract gas from the subsurface per unit of time). As such, production efficiency can be equivalently expressed as
| 18 |
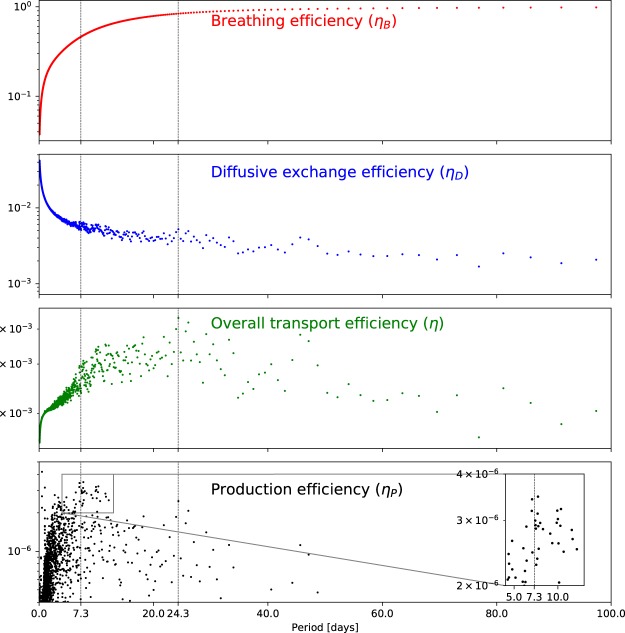
In Fig. 5, we plot the breathing efficiency (ηB), diffusive exchange efficiency (ηD), overall transport efficiency (η), and production efficiency (ηP) calculated for the components of the measured barometric record as a function of period. In the top plot, it is apparent that ηB increases monotonically with barometric period (decreases with frequency). It is not dependent on amplitude, which cancels out during its derivation. Therefore, ηB effectively quantifies the ability of lower frequency components to more effectively penetrate into fractured rock irrespective of their amplitude. In general, ηD decreases with increasing period, however, the combination of period and amplitude leads to more nuanced (non-monotonic) behavior. The combination of these conflicting efficiencies in η leads to a maximum efficiency at around 24.3 days (refer to the vertical dashed line in Fig. 5). Referring to the bottom plot of Fig. 2, this is the period with the largest amplitude. As discussed previously, η quantifies the gas transport efficiency of a single cycle of a barometric component and does not account for the frequency of occurrence of the barometric component. Therefore, it is not appropriate for identifying the dominant gas transport barometric component.
Figure 5.
Breathing, diffusive exchange, overall transport, and production efficiencies for the amplitude/frequency pairs of the measured barometric record plotted as function of barometric period.
In the bottom plot of Fig. 5, we plot the production efficiency (ηP; Eq. 14) as a function of barometric period. In this case, when the frequency of occurrence of the barometric component is taken into account, it is apparent that there is a cluster of high efficiency amplitude/frequency pairs around a period of 7.3 days (refer to the inset in Fig. 5), consistent with the inverse numerical analysis above. However, the results are complicated by the highest production efficiency occurring at 0.5 days. To investigate this, in Fig. 6, we plot the cumulative mean period of the amplitude/frequency pairs sorted in order of decreasing production efficiency. This demonstrates that although the highest production efficiency occurs at 0.5 days, the average period of the highest efficiency amplitude/frequency pairs hovers around 7.3 days. Therefore, it is likely that for the Anchorage, AK data that we analyzed, 7.3 days is the average period of a set of high production efficiency periods that lead to the vast majority of the gas transport.
Figure 6.
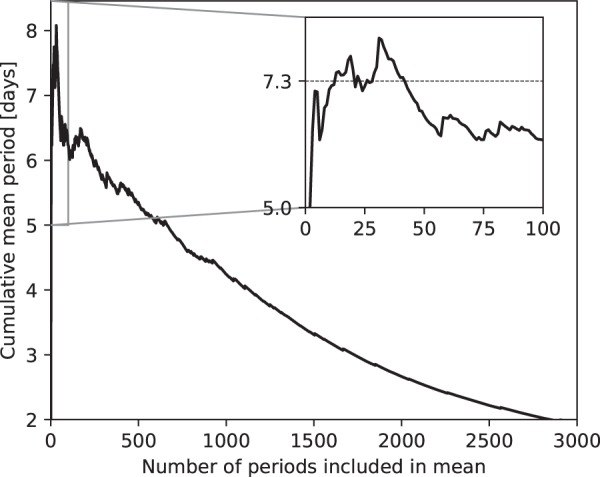
Cumulative mean period for amplitude/frequency pairs of the measured barometric record sorted in order of decreasing production efficiency.
Conclusions
The combined inverse numerical and analytical analyses presented in this manuscript support the following conclusions:
There is a set of barometric frequencies responsible for the vast majority of gas transport in fractured rock.
A single barometric frequency with seasonally modulated amplitude can be used to accurately predict the barometrically-induced gas transport from a measured barometric signal.
The dominant gas transport frequency is the average of the high production efficiency amplitude/frequency barometric sinusoidal components.
For practical applications, these conclusions indicate that as long as future barometric pressures at a location have similar characteristics to the past, it is possible to predict future gas transport using a single seasonally modulated barometric frequency. This eliminates the need to consider an ensemble of possible future barometric variations, significantly simplifying predictions of gas transport in fracture rock and subsequent breakthrough times.
Supplementary information
Acknowledgements
This research is supported by National Nuclear Security Administration Office of Defense Nuclear Nonproliferation Research and Development and the Defense Threat Reduction Agency. Los Alamos National Laboratory completed this work under the auspices of the U.S. Department of Energy under contract DE-AC52-06NA24596 and 89233218CNA000001. The authors are grateful to Jeffrey D. Hyman for constructive comments and suggestions during the preparation of this manuscript. The authors acknowledge the use of barometric pressure data from Weather Underground (www.wunderground.com).
Author Contributions
D.H. conceived and performed the analyses, P.S. and J.O. supported analysis development, and J.O. produced the schematic diagram (Fig. 1). All authors reviewed the manuscript.
Data Availability
The data used in this research is freely available from Weather Underground (www.wunderground.com).
Competing Interests
The authors declare no competing interests.
Footnotes
Publisher’s note: Springer Nature remains neutral with regard to jurisdictional claims in published maps and institutional affiliations.
Supplementary information
Supplementary information accompanies this paper at 10.1038/s41598-019-46023-z.
References
- 1.Nilson RH, Peterson EW, Lie KH, Burkhard NR, Hearst JR. Atmospheric pumping: A mechanism causing vertical transport of contaminated gases through fractured permeable media. J. Geophys. Res. 1991;96:21933–21948. doi: 10.1029/91jb01836. [DOI] [Google Scholar]
- 2.Auer LH, Rosenberg ND, Birdsell KH, Whitney EM. The effects of barometric pumping on contaminant transport. J. Contaminant Hydrol. 1996;24:145–166. doi: 10.1016/s0169-7722(96)00010-1. [DOI] [Google Scholar]
- 3.Neeper DA. Harmonic analysis of flow in open boreholes due to barometric pressure cycles. J. Contaminant Hydrol. 2003;60:135–162. doi: 10.1016/s0169-7722(02)00086-4. [DOI] [PubMed] [Google Scholar]
- 4.Neeper, D. A. & Stauffer, P. H. Transport by oscillatory flow in soils with rate-limited mass transfer: 1. theory. Vadose Zone J. 11 (2012).
- 5.Harp DR, et al. Immobile pore-water storage enhancement and retardation of gas transport in fractured rock. Transp. Porous Media. 2018;124:369–394. doi: 10.1007/s11242-018-1072-8. [DOI] [Google Scholar]
- 6.Viswanathan HS, et al. Development of a hybrid process and system model for the assessment of wellbore leakage at a geologic co2 sequestration site. Environ. science & technology. 2008;42:7280–7286. doi: 10.1021/es800417x. [DOI] [PubMed] [Google Scholar]
- 7.Shukla R, Ranjith P, Haque A, Choi X. A review of studies on co2 sequestration and caprock integrity. Fuel. 2010;89:2651–2664. doi: 10.1016/j.fuel.2010.05.012. [DOI] [Google Scholar]
- 8.Pan L, Oldenburg CM, Pruess K, Wu Y-S. Transient co2 leakage and injection in wellbore-reservoir systems for geologic carbon sequestration. Greenh. Gases: Sci. Technol. 2011;1:335–350. doi: 10.1002/ghg.41. [DOI] [Google Scholar]
- 9.Dempsey D, Kelkar S, Pawar R. Passive injection: a strategy for mitigating reservoir pressurization, induced seismicity and brine migration in geologic co2 storage. Int. J. Greenh. Gas Control. 2014;28:96–113. doi: 10.1016/j.ijggc.2014.06.002. [DOI] [Google Scholar]
- 10.Carroll SA, et al. Key factors for determining groundwater impacts due to leakage from geologic carbon sequestration reservoirs. Int. J. Greenh. Gas Control. 2014;29:153–168. doi: 10.1016/j.ijggc.2014.07.007. [DOI] [Google Scholar]
- 11.Myers T. Potential contaminant pathways from hydraulically fractured shale to aquifers. Groundw. 2012;50:872–882. doi: 10.1111/j.1745-6584.2012.00933.x. [DOI] [PubMed] [Google Scholar]
- 12.Tsang Y, Narasimhan T. Effects of periodic atmospheric pressure variation on radon entry into buildings. J. Geophys. Res. Solid Earth. 1992;97:9161–9170. doi: 10.1029/92JB00707. [DOI] [Google Scholar]
- 13.Carrigan CR, Heinle RA, Hudson GB, Nitao JJ, Zucca JJ. Trace gas emissions on geological faults as indicators of underground nuclear testing. Nat. 1996;382:528–531. doi: 10.1038/382528a0. [DOI] [Google Scholar]
- 14.Bowyer TW, et al. Detection and analysis of xenon isotopes for the comprehensive nuclear-test-ban treaty international monitoring system. J. environmental radioactivity. 2002;59:139–151. doi: 10.1016/S0265-931X(01)00042-X. [DOI] [PubMed] [Google Scholar]
- 15.Issartel J-P, Baverel J. Inverse transport for the verification of the comprehensive nuclear test ban treaty. Atmospheric Chem. Phys. 2003;3:475–486. doi: 10.5194/acp-3-475-2003. [DOI] [Google Scholar]
- 16.Carrigan CR, Sun Y. Detection of noble gas radionuclides from an underground nuclear explosion during a ctbt on-site inspection. Pure Appl. Geophys. 2014;171:717–734. doi: 10.1007/s00024-012-0563-8. [DOI] [Google Scholar]
- 17.Sun Y, Carrigan C. Modeling Noble Gas Transport and Detection for The Comprehensive Nuclear-Test-Ban Treaty. Pure Appl. Geophys. 2014;171:735–750. doi: 10.1007/s00024-012-0514-4. [DOI] [Google Scholar]
- 18.Jordan Amy B., Stauffer Philip H., Zyvoloski George A., Person Mark A., MacCarthy Jonathan K., Anderson Dale N. Uncertainty in Prediction of Radionuclide Gas Migration from Underground Nuclear Explosions. Vadose Zone Journal. 2014;13(10):0. doi: 10.2136/vzj2014.06.0070. [DOI] [Google Scholar]
- 19.Jordan AB, Stauffer PH, Knight EE, Rougier E, Anderson DN. Radionuclide gas transport through nuclear explosion-generated fracture networks. Sci. reports. 2015;5:18383. doi: 10.1038/srep18383. [DOI] [PMC free article] [PubMed] [Google Scholar]
- 20.Mourzenko V, et al. Barometric pumping of a fractured porous medium. Geophys. Res. Lett. 2014;41:6698–6704. doi: 10.1002/2014GL060865. [DOI] [Google Scholar]
- 21.Cooley JW, Tukey JW. An algorithm for the machine calculation of complex fourier series. Math. computation. 1965;19:297–301. doi: 10.1090/S0025-5718-1965-0178586-1. [DOI] [Google Scholar]
- 22.Lichtner, P. et al. PFLOTRAN user manual: A massively parallel reactive flow and transport model for describing surface and subsurface processes. Tech. Rep. Report No.: LA-UR-15-20403, Los Alamos National Laboratory (2015).
- 23.Marquardt DW. An algorithm for least-squares estimation of nonlinear parameters. J. society for Ind. Appl. Math. 1963;11:431–441. doi: 10.1137/0111030. [DOI] [Google Scholar]
- 24.Doherty, J. PEST-ASP user’s manual. Watermark Numer. Comput. Brisbane, Aust. (2001).
Associated Data
This section collects any data citations, data availability statements, or supplementary materials included in this article.
Supplementary Materials
Data Availability Statement
The data used in this research is freely available from Weather Underground (www.wunderground.com).


