Abstract
Mammalian genomes are folded into a hierarchy of compartments, topologically associating domains (TADs), subTADs, and long-range looping interactions. The higher-order folding patterns of chromatin contacts within TADs and how they localize to disease-associated single nucleotide variants (daSNVs) remains an open area of investigation. Here, we analyze high-resolution Hi-C data with graph theory to understand possible mesoscale network architecture within chromatin domains. We identify a subset of TADs exhibiting strong core-periphery mesoscale structure in embryonic stem cells, neural progenitor cells, and cortical neurons. Hyper-connected core nodes co-localize with genomic segments engaged in multiple looping interactions and enriched for occupancy of the architectural protein CCCTC binding protein (CTCF). CTCF knockdown and in silico deletion of CTCF-bound core nodes disrupts core-periphery structure, whereas in silico mutation of cell type-specific enhancer or gene nodes has a negligible effect. Importantly, neuropsychiatric daSNVs are significantly more likely to localize with TADs folded into core-periphery networks compared to domains devoid of such structure. Together, our results reveal that a subset of TADs encompasses looping interactions connected into a core-periphery mesoscale network. We hypothesize that daSNVs in the periphery of genome folding networks might preserve global nuclear architecture but cause local topological and functional disruptions contributing to human disease. By contrast, daSNVs co-localized with hyper-connected core nodes might cause severe topological and functional disruptions. Overall, these findings shed new light into the mesoscale network structure of fine scale genome folding within chromatin domains and its link to common genetic variants in human disease.
Subject terms: Network topology, Epigenomics, Functional genomics, Regulatory networks
Introduction
Seminal studies based on microscopy1–3 or molecular proximity ligation4–8 have revealed that chromatin is non-randomly folded in unique patterns at disparate length scales. Individual chromosomes segregate into independent territories with respect to each other9. Within each chromosome, active and inactive genomic regions partition into large-scale ‘A’ and ‘B’ compartments distinguished by activating and repressive chromatin modifications, respectively5. Within compartments, chromatin is further partitioned into Megabase (Mb)-sized topologically associating domains (TADs) and smaller, nested subTADs6,10–14. TADs/subTADs are demarcated by boundaries and have been formally defined as contiguous genomic intervals in which the majority of loci interact more frequently with each other than with loci outside of the domain11,15. At the sub-Mb scale, distal genomic segments can form specific physical contacts called looping interactions within and between subTADs11,16–19. The highest frequency loops in a population of cells are made manifest in Hi-C maps as punctate enriched peaks of contact between two genomic fragments compared to the surrounding TAD background signal. Finally, at the smallest length scale, DNA wraps around the histone octamer to form a 10 nm chromatin fiber. Understanding how chromatin architecture is connected to genome function is important because it sheds light on the molecular mechanisms governing healthy development and how these mechanisms go awry in disease.
Computational tools from network science and graph theory have been employed to characterize the structural features of real-world complex systems across a range of length scales20,21. Local and global properties of networks are straightforward to compute because the units of analysis, individual nodes and the whole network, are immediately evident and require no additional search. Mesoscale structure, however, is not always evident22. The difficulty largely lies in the fact that the identification of mesoscale structure requires the specification of a partition of a network’s nodes into groups (the units of analysis) based on a given criterion23. Real-world networks are composed of many nodes and edges arranged in complex patterns that can obscure structural regularities. Due to this complexity, if one wishes to identify mesoscale structure in networks, one must frequently search for it algorithmically24. Recently, algorithmic approaches explicitly developed for this purpose have uncovered assortative communities25,26, cores and peripheries27, and bipartite or disassortative structures28 in a wide range of diverse complex systems29,30.
We reasoned that an exploration of mesoscale network properties in high-resolution 3-D genome folding maps might lead to new understanding of the link between genome structure and function. Recently, our group and others have used network modularity maximization and the tuning of a resolution parameter, γ, to uncover a hierarchy of partially overlapping, nested communities in human Hi-C data genome-wide31,32. By smoothly tuning the resolution parameter from high to low extremes, we can effectively obtain estimates of a network’s community structure, spanning from the coarsest scale at which all network nodes fall into the same community to the finest scale where network nodes form singleton communities32,33. This so-called multi-scale community detection methodology ultimately revealed that nested communities in network science are synonymous with TADs/subTADs and have strong utility in their sensitive and specific detection genome-wide from Hi-C maps31,32.
Another feature of 3-D genome folding thought to fall in the range of mesoscale intermediate-length structure is the long-range loop11. We hypothesized that looping interactions within chromatin domains might form meso-scale network structures with importance for genome function. Here, we demonstrate that a subset of TADs genome-wide are folded into core-periphery networks, whereas size-matched, randomly positioned genomic intervals show no such structure. Core nodes directly correspond to genomic fragments engaged in multiple, highly connected looping interactions. Interconnected core nodes are strongly enriched for constitutively bound CTCF, whereas cell type-specific enhancers and genes are generally evenly distributed across both core and periphery nodes. Experimental knockdown of CTCF and in silico mutation of CTCF-occupied nodes disrupts core-periphery network structure, whereas in silico mutation of cell type specific enhancer or gene nodes has a negligible effect. Importantly, we discovered that common single nucleotide variants (SNVs) associated with key neuropsychiatric diseases, including autism spectrum disorder (ASD), schizophrenia, and obsessive-compulsive disorder (OCD), are strongly enriched in core-periphery TADs in cortical neurons. Together, these results reveal a subset of TADs that are folded in mesoscale core-periphery networks. We hypothesize a working model in which daSNVs that disrupt the highly interconnected core nodes might result in severe topological and functional disruption. By contrast, we posit that daSNVs in peripheral nodes might preserve global genome folding, but result in slight local topological and functional disruptions contributing to human disease.
Results
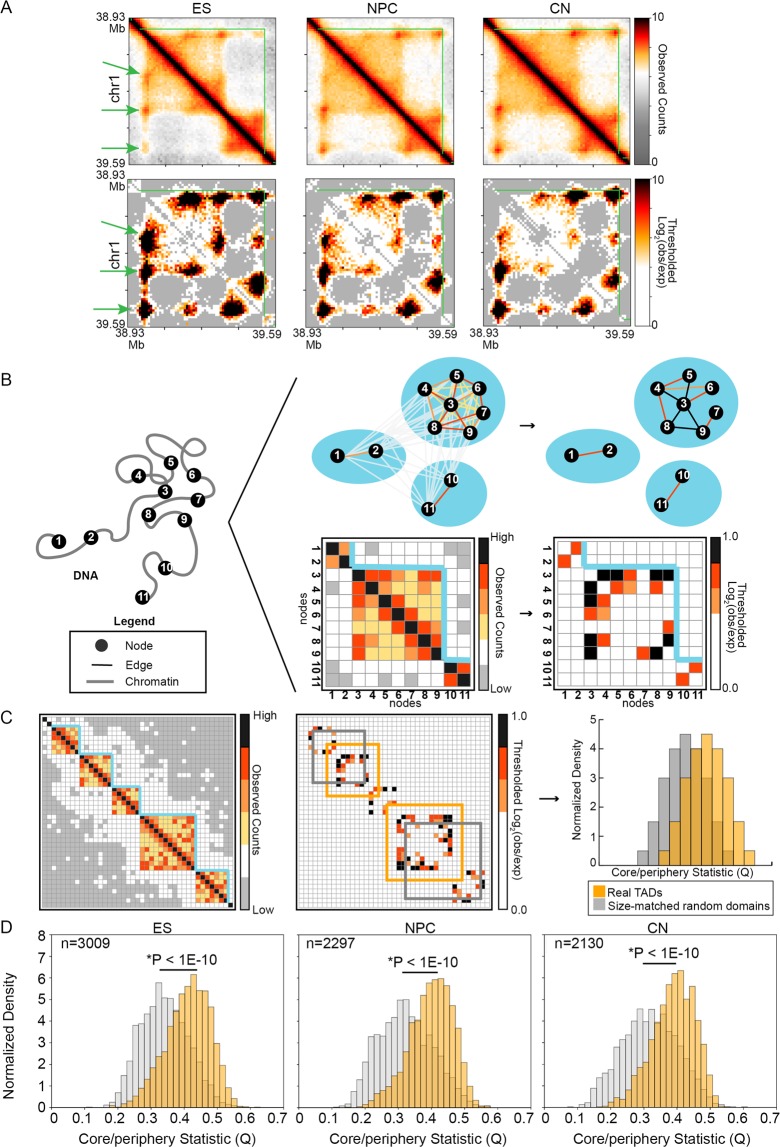
The mesoscale network patterns created by genome folding within TADs are poorly understood. Progress in exploring such a question has been hindered by the paucity of ultra-high resolution, genome-wide Hi-C maps across multiple mammalian cell types. Recently, Cavalli and colleagues published kilobase (kb)-resolution Hi-C maps with the highest read depth to date allowing for the genome-wide identification of looping interactions in mouse embryonic stem (ES) cells, primary neural progenitor cells (NPCs), and primary cortical neurons (CNs)34. We created interaction frequency maps at four kb resolution in all three cell types (Fig. 1A, Supplementary Methods, Supplementary Table 1). By applying the well-established directionality index and hidden Markov model methodology6, we identified TADs genome-wide in all three cell types (Supplementary Tables 2–7). We also modeled the distance-dependence and local TAD structure to compute an expected count for every pixel (Supplementary Figs 1–2, Supplementary Methods), thus enabling us to compute background-corrected interaction frequency (Observed/Expected) heatmaps (Fig. 1A). Thus, we created Observed/Expected heatmaps to enable the exploration of mesoscale network structure created by looping interactions within TADs genome-wide in mouse ES cells, NPCs, and CNs.
Figure 1.
Genome folding within topologically associating domains (TADs) can exhibit mesoscale core-periphery network structure. (A) Relative interaction frequency (Observed) and background-corrected interaction frequency (Observed/Expected) Hi-C heatmaps for a given TAD in mouse embryonic stem (ES) cells, neural progenitor cells (NPCs), and cortical neurons (CNs). Green lines, borders of TADs. Green arrowheads, genome structure signal indicative of a persistent looping interaction in ensemble Hi-C maps. (B) 3-D genome folding can be represented as a network where nodes correspond to bins of DNA and edges correspond to bin-bin interaction frequencies. Interaction frequency heatmaps of genome folding can be represented as adjacency matrices, allowing tools from graph theory and network science to be readily applied. Blue lines represent TAD boundaries. (C,D) To test for the possible presence of core-periphery structure created by looping interactions within TADs, we computed the core-periphery quality index Q for all true TADs compared to pseudo-TADs generated by choosing size-matched genomic regions at random. A Kolmogorov–Smirnov test was used to compare Q values for TADs vs. randomly placed, size-matched genomic regions in ES cells, NPCs, and CNs.
Visual inspection of the heatmaps revealed that many TADs contain bins that form multiple looping interactions (green arrows, Fig. 1A) with other highly interconnected nodes. This observation is reminiscent of core-periphery structure, a mesoscale organization of a graph that is often studied in network science. Core nodes exhibit high signal strength and are highly connected (high degree) to other highly connected nodes. By contrast, periphery nodes interact with core nodes but are rarely connected to each other. To explore the possibility of core-periphery network structure within TADs, we conceptualized Hi-C data as a network with each genomic bin represented as a node and Observed/Expected interaction frequencies between nodes represented as edges (Fig. 1B). We represented each Observed/Expected interaction frequency matrix for every TAD and cell type as an independent network (Fig. 1B). To quantify the strength of a TAD network’s core-periphery structure, we computed a core-periphery statistic, Q, using the Kernighan-Lin algorithm to optimize a quality index measuring core-periphery node separation (detailed in Supplementary Methods). In brief, we sought to maximize the interaction strength among core nodes and to minimize the interaction strength among periphery nodes. Intuitively, this quality index Q will be high when a TAD contains strong core-periphery network structure and low in TADs devoid of such structure. We observed that genome folding within TADs genome-wide in mouse ES cells, NPCs, and CNs exhibit significantly stronger core-periphery structure than expected in two null models: (i) pseudo-TADs where matched-size genomic intervals are positioned at random (Fig. 1C,D) and (ii) Erdős–Rényi random graphs (Supplementary Fig. 3). These results suggest that genome folding within at least a subset of TADs can exhibit mesoscale core-periphery network structure.
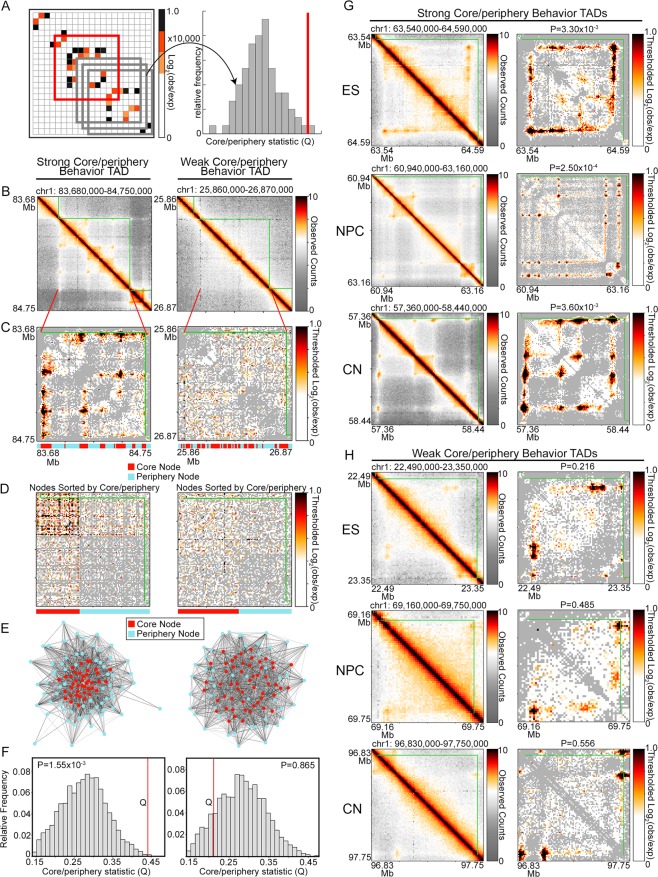
We next set out to identify chromatin domains genome-wide that exhibit the highest core-periphery network structure in ES cells, NPCs, and cortical neurons. For each individual TAD network in each independent cell type, we compared its core-periphery test statistic, Q, to a null distribution of Q values computed on 10,000 randomly placed, size-matched genomic intervals (Fig. 2A, Supplementary Methods). We rejected the null hypothesis that the specific TAD does not exhibit core-periphery structure in cases where the multiple-testing corrected empirical p-value was less than a rigorous threshold of alpha <= 0.012 (Fig. 2A, Supplementary Methods). We identified a subset of TADs with the strongest possible core-periphery structure in mouse ES cells, NPCs, and cortical neurons (Supplementary Fig. 4) and compared their structural features to TADs that were not significantly core-periphery. We noticed that strong core-periphery TADs contain nodes that form multiple looping events with other highly looping nodes (Fig. 2B–F left column, Fig. 2G). By contrast, TADs devoid of core-periphery network structure are either depleted of looping interactions or contain single anchor-to-anchor looping interactions that do not involve multiple nodes (Fig. 2B–F right column, Fig. 2H). Importantly, we observed that core nodes directly correspond to genomic fragments engaged in multiple, highly connected looping interactions. These results reveal that a gradient of core-periphery network architectures can be found across TADs genome-wide, with complex core-periphery TADs containing complex hubs of hyper-connected genomic anchors engaged in multiple long-range loops.
Figure 2.
A subset of genome-wide TADs exhibit significant core-periphery network structure. (A) A TAD’s core-periphery test statistic Q (red) is compared to a null distribution of Q values from 10,000 randomly placed windows of equal size on the same chromosome (gray). The one-tailed empirical p-value is calculated as the percentage of random Q values greater than or equal to the real TAD Q value. (B) Observed heatmaps of a strong (left column) and weak (right column) core-periphery TAD in embryonic stem cells. (C) Observed/Expected heatmaps for TADs in panel (B) with negative interaction scores thresholded to 0. Thresholded values are shown in gray. Locations of core and periphery nodes are shown below each heatmap. (D) Observed/Expected heatmaps from panel (C) sorted to align all core-core edges at the top left and all periphery-periphery edges at the bottom right. Locations of core and periphery nodes are shown below each heatmap. (E) Kamada-Kawai force-directed graph visualizations of the TADs in panel (C). Nodes are colored according to their core-periphery classification. Red, core. Blue, periphery. (F) Null distribution and test statistic for each respective TAD in panel (C). (G-H) Observed heatmaps of TADs exhibiting (G) strong, significant and (H) weak core-periphery behavior in each cell type. Empirical p-values are listed on each Observed/Expected heatmap.
We next sought to understand the differences between core and periphery nodes by integrating epigenetic annotations on the linear genetic sequence with all nodes in TADs with significantly strong core-periphery network architecture. We analyzed CTCF and H3K27ac ChIP-seq data from Cavalli and colleagues in the same mouse ES cells, NPCs, and cortical neurons used to generate the Hi-C data (Supplementary Table 8). Specifically, we stratified (1) CTCF occupancy into seven cell type-specific classes, including: ES-only, NPC-only, CN-only, ES + NPC, ES + CN, NPC + CN, and constitutively bound sites, (2) six classes of cell type-specific putative enhancers exhibiting positive H3K27ac signal and distal from transcription start sites, including: ES-only, NPC-only, CN-only, ES + NPC, ES + CN, and NPC + CN putative enhancers, and (3) eight classes of genes exhibiting positive H3K27ac signal at their transcription start sites, including: ES-only, NPC-only, CN-only, ES + NPC, ES + CN, NPC + CN, constitutively active, and constitutively inactive (Supplementary Tables 9–29, Supplementary Methods). As previously reported35, the large majority of CTCF bound sites (n = 44,830) are ES cell-specific, with neural differentiation involving a continuous trimming back of CTCF occupancy (Supplementary Fig. 5A–D). We observed a notable group of constitutively occupied CTCF sites across all three lineages (n = 8,853) and negligible CN-specific CTCF sites. By contrast, there were notable groups of ES cell-specific (n = 13,634), NPC-specific (n = 1,088), and CN-specific (n = 6,343) putative enhancers marked by strong H3K27ac+ signal distal from transcription start sites (Supplementary Figs 5E–H, 6). We also stratified groups of cell type-specific, inactive, and constitutively active genes by H3K27ac+ signal at transcription start sites (Supplementary Figs 5I–L, 6). These results confirm the known groups of cell type-specific genes and enhancers and that CTCF occupancy largely falls into a class of ES cell-specific or constitutive occupancy across cell types.
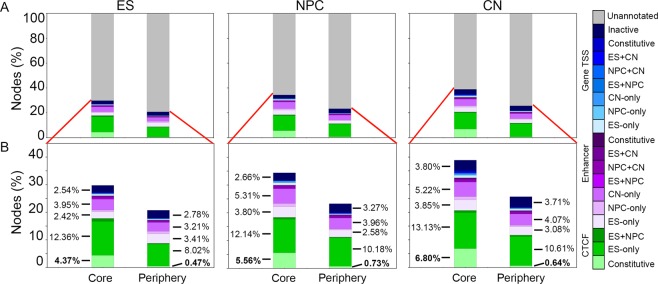
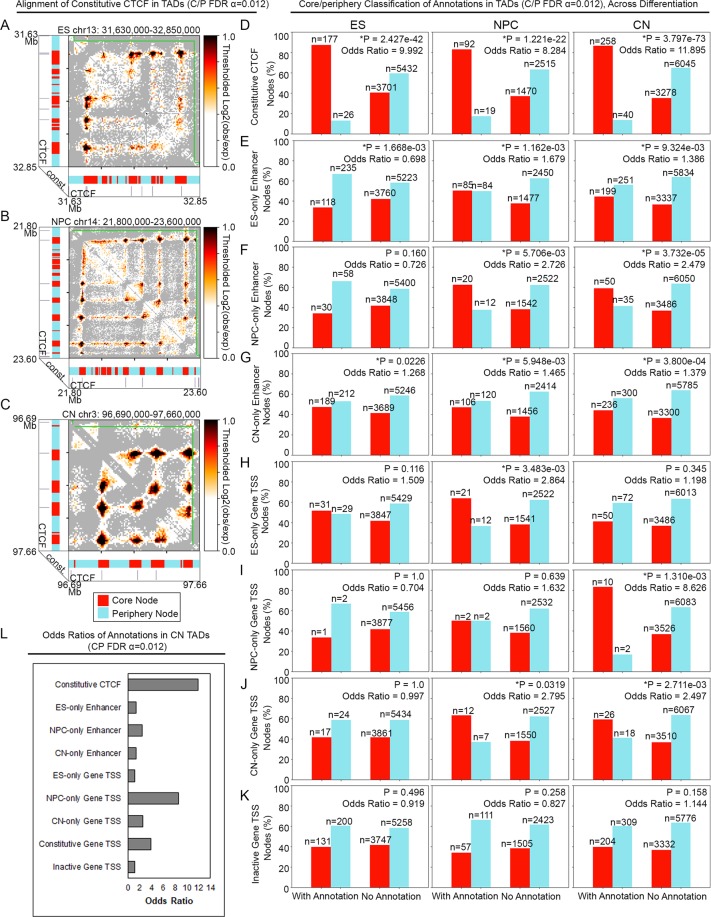
We next canvased the set of all possible cell type-specific annotations for their co-localization at core versus periphery nodes in TADs with significant core-periphery network structure. We found that core nodes were markedly more co-localized with CTCF occupied sites than periphery nodes (Fig. 3). Consistent with this observation, constitutively bound CTCF sites were strongly enriched for core nodes and depleted for periphery nodes across core-periphery TADs from all three cell types (Fig. 4A–D, Supplementary Fig. 7). Nearly all cell type-specific enhancer and gene classes were evenly distributed between core and periphery nodes with modest Odds Ratios (Fig. 4E–L, Supplementary Figs 8–9, Supplementary Tables 30–32). The one exception was constitutively expressed genes significantly enriched in core nodes versus periphery nodes in cortical neuron core-periphery TADs at our stringent p-value cutoff of P<0.0005 (Odds Ratio = 3.977) (Fig. 4L, Supplementary Fig. 9). Taken together, these results reveal that hyper-connected core genome folding nodes are occupied by CTCF and that cell type-specific enhancers and genes show no clear bias to core vs. periphery nodes in TADs with core-periphery network structure.
Figure 3.
Distribution of 1-D Epigenome annotations with respect to core and periphery nodes. (A) Core and periphery nodes in significantly core-periphery TADs in ES cells, NPCs, and CNs were intersected with genome-wide cell type-specific CTCF occupied sites, putative enhancers, and genes. (B) Zoom-in of the percent of core and periphery nodes intersecting annotations in TADs with significant core-periphery network structure.
Figure 4.
Constitutive and cell-specific CTCF occupied sites are strongly enriched at core vs. periphery nodes across cell types. (A–C) Observed/Expected heatmap examples in (A) ES cell (B) NPC and (C) CN TADs with significant core-periphery architecture illustrating co-localization of constitutive CTCF occupancy with core nodes and not with periphery nodes. (D–K) Bar plots comparing proportions of core and periphery nodes that intersect the annotation of interest vs. do not intersect the annotation of interest. Odds ratios (OR) are reported for all plots. (D) Constitutive CTCF, (E) ES-only enhancers, (F) NPC-only enhancers, (G) CN-only enhancers, (H) ES-only genes, (I) NPC-only genes, (J) CN-only genes, (K) Inactive genes. (L) Summary of Odds ratios for 1-D Epigenome annotation enrichment in core vs. periphery nodes for all TADs with significant core-periphery structure in cortical neurons.
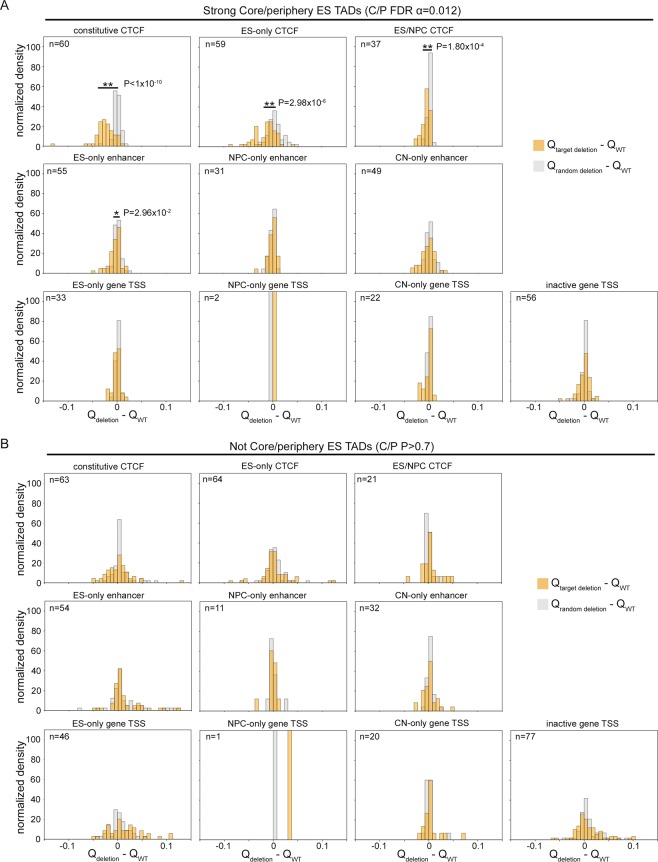
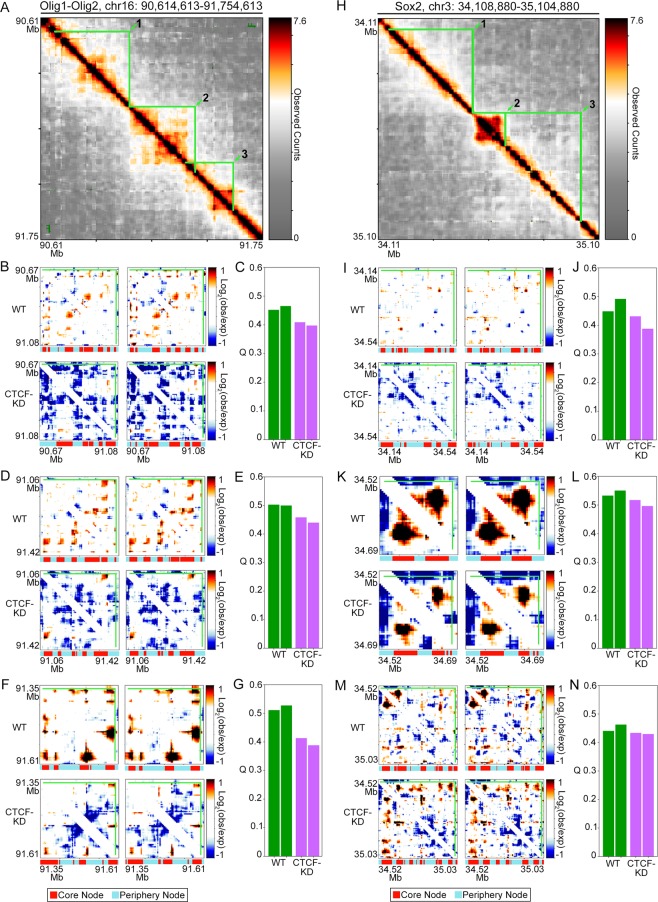
To determine if looping core-periphery structure could be disrupted, we performed both in silico mutagenesis and in vitro experimental knock down experiments. We first conducted in silico mutagenesis experiments by computing the core-periphery test statistic Q after either deleting nodes containing a particular 1-D Epigenomic annotation or deleting nodes at random (Fig. 5, Supplementary Fig. 10). We found that in silico mutation of CTCF binding sites significantly disrupted core-periphery structure in both ES cells (Fig. 5A) and CNs (Supplementary Fig. 10A). This effect was specific to significantly core-periphery TADs and was not made manifest in the same analysis on TADs that did not exhibit notable core-periphery structure (Fig. 5B, Supplementary Fig. 10B). Moreover, in silico mutation of cell type-specific enhancers or genes had a minimal effect on core-periphery structure. We also knocked down CTCF to 20% of its wild type levels in mouse ES cells using lentiviral shRNA (Supplementary Fig. 11, Supplementary Table 33). We compared genome folding in wild type and CTCF knock-down ES cells by using Chromosome-Conformation-Capture-Carbon-Copy (5C) as previously described10,35–39. Although CTCF levels were not completely ablated, we found that network core-periphery structure was slightly reduced in some but not all chromatin domains (Fig. 6). Together, these results demonstrate that core-periphery network structure in a subset of TADs can be altered upon disruption of CTCF protein levels or mutagenesis of CTCF’s occupied sites in the genome.
Figure 5.
In silico mutation of CTCF occupied nodes results in significant ablation of core-periphery network structure. (A) Difference in Q values before and after node deletion in significant core-periphery TADs for three classes of CTCF (top), three classes of enhancers (middle), and four classes of gene TSS (bottom). We deleted nodes that co-localize with target 1-D Epigenome marks (orange) or the same number of random nodes (grey) for each TAD in ES cells. A single asterisk indicates a marginally significant difference in distribution means (two-tailed Mann-Whitney U test, P < 0.05), and a double asterisk indicates a highly significant difference in distribution means (two-tailed Mann-Whitney test U test, P < 0.005). (B) The same analysis was performed for TADs in ES cells that do not exhibit core-periphery network structure (Supplementary Methods). No significant difference was found for any target annotation (two-tailed Mann-Whitney U test).
Figure 6.
Knockdown of CTCF levels in ES cells results in decreased core-periphery network structure in subTADs around pluripotency genes. (A) Observed heatmap of Chromosome-Conformation-Capture-Carbon-Copy data around the Olig1 and Olig2 genes in ES cells. The three Olig1-Olig2 subTADs used in subsequent core-periphery analysis are outlined in green and labeled 1 (B,C), 2 (D,E), and 3(F,G). (B,D,F) Observed/Expected heatmaps of Olig1-Olig2 (B) subTAD 1, (D) subTAD 2, and (F) subTAD3 in two wild type ES cell replicates (to row) and two CTCF knock down ES cell replicates (bottom). (C,E,G) Core-periphery test statistic Q for (C) subTAD 1, (E) subTAD 2, and (G) subTAD3. (H) Observed heatmap of Chromosome-Conformation-Capture-Carbon-Copy data around the Sox2 gene in ES cells. The three Sox2 subTADs used in subsequent core-periphery analysis are outlined in green and labeled 1 (I,J), 2 (K,L), and 3(M-N). (I,K,M) Observed/Expected heatmaps of Sox2 (I) subTAD 1, (K) subTAD 2, and (M) subTAD3 in two wild type ES cell replicates (to row) and two CTCF knock down ES cell replicates (bottom). (J,L,N) Core-periphery test statistic Q for (J) subTAD 1, (L) subTAD 2, and (N) subTAD3. Core and periphery nodes are labeled under each heatmap.
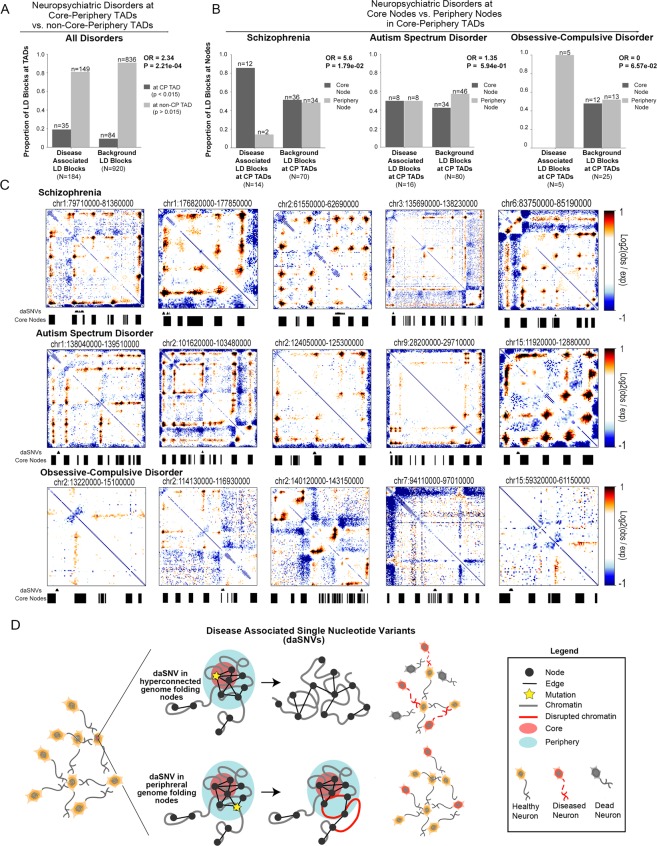
Finally, we assessed the possible link between the 3-D genome’s core-periphery network structure and neuropsychiatric disease-associated single nucleotide variants (daSNVs). We first observed that TADs in CNs with significant core-periphery structure are significantly more conserved across placental mammals than domains devoid of such structure (Supplementary Fig. 12A). Core nodes in highly core-periphery TADs have significantly higher conservation and gene density compared to periphery nodes in core-periphery TADs (Supplementary Fig. 12B,C). Importantly, we observed that schizophrenia, ASD, and OCD daSNVs in non-coding genomic regions were significantly more likely to co-localize with CN TADs with significant core-periphery structure than to CN TADs devoid of such structure (Fig. 7A, Supplementary Methods). We then compared the distribution of neuropsychiatric daSNVs across core and periphery genome folding nodes (Fig. 7B,C). Importantly, we found that the linkage disequilibrium (LD) blocks encompassing schizophrenia daSNVs were significantly enriched at core nodes, wheras OCD daSNVs were enriched at periphery nodes, and ASD daSNVs were equally distributed across core or periphery nodes (Fig. 7B,C). Size-matched, background SNV LD blocks exhibited a relatively even distribution across core and periphery nodes (Fig. 7B, Supplementary Methods). We hypothesize that daSNVs disrupting highly interconnected core nodes would result in severe topological and functional disruption leading to severe pathological phenotypes (Fig. 7D). We also posit that daSNVs in the periphery of genome folding networks might preserve global genome folding but result in slight local topological and functional disruptions that contribute in aggregate to human disease (Fig. 7D).
Figure 7.
TADs in cortical neurons with strong core-periphery mesoscale structure are enriched for neuropsychiatric disease-associated single nucleotide variants. (A) Odds ratios representing the enrichment of schizophrenia-, OCD-, and ASD-associated common single nucleotide variants (SNVs) in TADs with strong and weak core-periphery structure compared to linkage disequilibrium size- and minor allele frequency-matched background SNVs (N = 100 sets of background SNVs). Pvalues, Fisher’s exact test. (B) Odds ratios representing the enrichment of schizophrenia-, OCD-, and ASD-associated common SNVs at core versus periphery nodes in TADs with strong core-periphery structure compared to linkage disequilibrium size- and minor allele frequency-matched background SNVs (N = 100 sets of background SNVs). Pvalues, Fisher’s exact test. (C) Observed/Expected heatmaps of neuropsychiatric daSNVs at core and periphery nodes in TADs with strong core-periphery structure. daSNV LD blocks are plotted below the heatmap (Supplementary Methods). (D) Schematic working model of the core-periphery network structure of the 3-D genome and our hypothesized model of the topological and functional consequences of daSNVs at core versus periphery nodes.
Discussion
Complex systems from a wide range of orthogonal disciplines can be represented as networks. Networks are defined mathematically as a collection of nodes and the pattern of edges between them. Because data from genome-wide proximity ligation studies are traditionally represented in the form of a square, symmetric array, we reasoned that computational tools and mathematical models from network science might have utility in capturing mesoscale structure not visible to the human eye in maps of higher-order chromosome architecture. Previously, by applying graph theory methods to Hi-C data, we found that the topology of the mammalian genome is organized into nested community structures that correspond to TADs and subTADs31. Here, we again demonstrate that graph theory tools have utility in uncovering an additional layer of mesoscale genome folding. We find that looping interactions in a subset of TADs and subTADs can fold into core-periphery network structures. Prior to this study it was unknown whether genome folding at the highest resolution within large scale TADs had a specific mesoscale network structure. Although network algorithms to query mesoscale structure have existed for some time, progress was limited by the paucity of high-resolution Hi-C data required to detect looping interactions genome-wide. Our finding of core-periphery network structure within a subset of chromatin domains was made possible by the very recent publication of the highest read depth Hi-C libraries to date across mouse ES cells, NPCs, and CNs34.
Together, our data suggest that understanding the mesoscale network structures of 3-D genome folding in a comprehensive, quantitative manner could shed new light into mechanisms governing how gene expression patterns are altered over long genomic distances by common genetic variation. First, we find that hyper-connected core nodes are highly enriched for the architectural protein CTCF and its knockdown leads to topological disruption of genome folding core-periphery networks. Second, in cortical neurons, we observed that neuropsychiatric daSNVs are co-localized with TADs exhibiting significant core-periphery network structure. Our working hypothesis is that daSNVs enriched at core looping nodes might lead to severe or early onset forms of human disease due to global disruption of large-scale chromatin architecture and gene expression (Fig. 7D). It is tempting to speculate that mutations in the periphery of genome folding networks might preserve global genome folding networks, but result in local topological and functional disruptions contributing slightly to human disease. In light of the growing knowledge that many complex traits and diseases are thought to be driven by a large number of common variants with small effect sizes40–43, an exciting area of future inquiry will be to understand the localization and functional importance of human genetic variation contributing to disease and cell type-specific gene expression signatures compared to core and periphery nodes in genome folding networks.
Core-periphery structure is abundant in a wide range of complex networks across disciplines, and has critical implications for system function and dynamics. Intuitively, the architecture itself allows for the top-down influence, or even control of, core regions on a receptive periphery. In social systems, core-periphery architecture is thought to support an optimal trade-off in the capacity for social groups to both broadcast (to the periphery) and receive (from the periphery) information critical to the group’s survival and success44. In information processing systems such as the brain, core-periphery structure is thought to support the ability of the core to integrate the multimodal information obtained from the periphery. In transportation systems, often dual or multiple cores are identified, possibly driven by constraints of geography and the evolution of the system (and the culture it supports) over time30.
Core-periphery structure also impacts the manner in which the system evolves over time and responds to exogenous perturbations45. In studies of population dynamics, cores are associated with relatively stable population dynamics, while increasing variance and importance of density-independent processes operate at the periphery46. Similar inferences have been drawn in the context of human brain dynamics, where a core of brain regions associated with task performance displays more stable dynamics than a periphery of brain regions associated with supportive roles in cognition47. Studies of population-level behavior in humans have also provided initial evidence that resources may be over-utilized in the network core, and under-utilized in the network periphery48. Finally, the architecture has important implications for robustness to failures, spreading dynamics, or collective behaviors across systems spanning biological, social, and technological domains49. Exciting areas of future inquiry will involve the causal studies necessary to determine how the functional roles for core-periphery structure in complex systems may be made manifest in TADs with core-periphery genome folding structure and human gene regulation.
Methods from graph theory and network science have recently been applied to find biologically meaningful patterns in chromatin folding data31,32,50–56. Multi-dimensional scaling has been used to convert 2-D proximity ligation matrices into 3-D models of the physical folding of chromosomes50. Ruan and colleagues assembled a binary network of chromatin interactions between RNA polymerase II bound genomic regions from ChIA-PET data53. They reported that RNA II-mediated connections in the human genome resemble a modular, scale-free network in which most nodes are weakly connected and then a small number of nodes have a high number of interactions. The authors hypothesized that chromatin networks may have evolved scale-free properties to better tolerate random perturbations57. Babaei and colleagues recently pursued the possibility of predicting co-expressed gene pairs by network metrics computed from mouse cortex Hi-C data such as the Jaccard index, the betweenness centrality, and the clustering coefficient55. Similarly, independent studies have explored genome folding patterns at master replication origins, histone modifications and cohesin binding sites using network metrics such as centrality, clustering coefficient, and assortativity51,52,56. Finally, we and others have also recently demonstrated that larger TADs and smaller subTADS can be parsed across length scales via the fine-tuning of the structural resolution parameter in a Louvain-like locally greedy algorithm to maximize a modularity quality function31,32. Although the concept of analyzing 3-D genome folding as a network has been pursued previously31,32,50–56, here we take an entirely new angle, which is to discover mesoscale core-periphery network structure in a subset of mammalian TADs. The ability to accurately quantify core-periphery network structure in Hi-C genome folding maps provides future opportunities to shed new light on how genome sequence influences 3-D structure to govern function across development and during the onset and progression of disease.
Supplementary information
Acknowledgements
J.E.P.C. is a New York Stem Cell Foundation (NYSCF) Robertson Investigator and an Alfred P. Sloan Foundation Fellow. This work was funded by The New York Stem Cell Foundation (J.E.P.C.), the Alfred P. Sloan Foundation (J.E.P.C., D.S.B.), the NIH Director’s New Innovator Award from the National Institute of Mental Health (1DP2MH11024701; J.E.P.C.), a 4D Nucleome Common Fund grant (1U01HL12999801; J.E.P.C.), and a joint NSF-NIGMS grant to support research at the interface of the biological and mathematical sciences (1562665; J.E.P.C.). D.S.B. would also like to acknowledge support from the John D. and Catherine T. MacArthur Foundation, the National Institute of Child Health and Human Development (1R01HD086888-01) and the National Science Foundation (BCS-1441502, PHY-1554488, and BCS-1631550).
Author Contributions
J.E.P.C. and D.S.B. conceived of the study. H.H., S.T.C., D.J.E. and K.R.T. analyzed the data. J.E.P.C., D.S.B., H.H., K.R.T. and S.T.C. wrote the manuscript.
Code and Data Availability
Data in this manuscript were downloaded from GEO as detailed in the Supplementary Methods. We will freely share code upon request.
Competing Interests
The authors declare no competing interests.
Footnotes
Publisher’s note: Springer Nature remains neutral with regard to jurisdictional claims in published maps and institutional affiliations.
Harvey Huang, Sunny Chen and Katelyn R. Titus contributed equally.
Supplementary information
Supplementary information accompanies this paper at 10.1038/s41598-019-45457-9.
References
- 1.Fraser P, Bickmore W. Nuclear organization of the genome and the potential for gene regulation. Nature. 2007;447:413–417. doi: 10.1038/nature05916. [DOI] [PubMed] [Google Scholar]
- 2.Kosak ST, Groudine M. Form follows function: The genomic organization of cellular differentiation. Genes Dev. 2004;18:1371–1384. doi: 10.1101/gad.1209304. [DOI] [PubMed] [Google Scholar]
- 3.Lanctôt C, Cheutin T, Cremer M, Cavalli G, Cremer T. Dynamic genome architecture in the nuclear space: regulation of gene expression in three dimensions. Nat. Rev. Genet. 2007;8:104–115. doi: 10.1038/nrg2041. [DOI] [PubMed] [Google Scholar]
- 4.Dostie J, et al. Chromosome Conformation Capture Carbon Copy (5C): a massively parallel solution for mapping interactions between genomic elements. Genome Res. 2006;16:1299–1309. doi: 10.1101/gr.5571506. [DOI] [PMC free article] [PubMed] [Google Scholar]
- 5.Lieberman-Aiden E, et al. Comprehensive mapping of long-range interactions reveals folding principles of the human genome. Science. 2009;326:289–293. doi: 10.1126/science.1181369. [DOI] [PMC free article] [PubMed] [Google Scholar]
- 6.Dixon JR, et al. Topological domains in mammalian genomes identified by analysis of chromatin interactions. Nature. 2012;485:376–380. doi: 10.1038/nature11082. [DOI] [PMC free article] [PubMed] [Google Scholar]
- 7.Simonis M, et al. Nuclear organization of active and inactive chromatin domains uncovered by chromosome conformation capture–on-chip (4C) Nat. Genet. 2006;38:1348–1354. doi: 10.1038/ng1896. [DOI] [PubMed] [Google Scholar]
- 8.Fullwood MJ, et al. An oestrogen-receptor-alpha-bound human chromatin interactome. Nature. 2009;462:58–64. doi: 10.1038/nature08497. [DOI] [PMC free article] [PubMed] [Google Scholar]
- 9.Cremer T, Cremer C. Chromosome territories, nuclear architecture and gene regulation in mammalian cells. Nat Rev Genet. 2001;2:292–301. doi: 10.1038/35066075. [DOI] [PubMed] [Google Scholar]
- 10.Phillips-Cremins JE, et al. Architectural protein subclasses shape 3D organization of genomes during lineage commitment. Cell. 2013;153:1281–1295. doi: 10.1016/j.cell.2013.04.053. [DOI] [PMC free article] [PubMed] [Google Scholar]
- 11.Rao SS, et al. A 3D map of the human genome at kilobase resolution reveals principles of chromatin looping. Cell. 2014;159:1665–1680. doi: 10.1016/j.cell.2014.11.021. [DOI] [PMC free article] [PubMed] [Google Scholar]
- 12.Nora EP, et al. Spatial partitioning of the regulatory landscape of the X-inactivation centre. Nature. 2012;485:381–385. doi: 10.1038/nature11049. [DOI] [PMC free article] [PubMed] [Google Scholar]
- 13.Sexton T, et al. Three-dimensional folding and functional organization principles of the Drosophila genome. Cell. 2012;148:458–472. doi: 10.1016/j.cell.2012.01.010. [DOI] [PubMed] [Google Scholar]
- 14.Fraser J, et al. Hierarchical folding and reorganization of chromosomes are linked to transcriptional changes in cellular differentiation. Mol Syst Biol. 2015;11:852. doi: 10.15252/msb.20156492. [DOI] [PMC free article] [PubMed] [Google Scholar]
- 15.Dixon JR, Gorkin DU, Ren B. Chromatin Domains: The Unit of Chromosome Organization. Mol. Cell. 2016;62:668–680. doi: 10.1016/j.molcel.2016.05.018. [DOI] [PMC free article] [PubMed] [Google Scholar]
- 16.Sanborn AL, et al. Chromatin extrusion explains key features of loop and domain formation in wild-type and engineered genomes. Proc Natl Acad Sci USA. 2015;112:E6456–6465. doi: 10.1073/pnas.1518552112. [DOI] [PMC free article] [PubMed] [Google Scholar]
- 17.Fudenberg G, et al. Formation of Chromosomal Domains by Loop Extrusion. Cell Rep. 2016;15:2038–2049. doi: 10.1016/j.celrep.2016.04.085. [DOI] [PMC free article] [PubMed] [Google Scholar]
- 18.Dowen JM, et al. Control of cell identity genes occurs in insulated neighborhoods in mammalian chromosomes. Cell. 2014;159:374–387. doi: 10.1016/j.cell.2014.09.030. [DOI] [PMC free article] [PubMed] [Google Scholar]
- 19.Morey C, Da Silva NR, Perry P, Bickmore WA. Nuclear reorganisation and chromatin decondensation are conserved, but distinct, mechanisms linked to Hox gene activation. Development. 2007;134:909–919. doi: 10.1242/dev.02779. [DOI] [PubMed] [Google Scholar]
- 20.Newman, M. Networks: An Introduction, Edn. 1 edition. (Oxford University Press, 2010).
- 21.Ravasz E, Barabasi AL. Hierarchical organization in complex networks. Phys Rev E Stat Nonlin Soft Matter Phys. 2003;67:026112. doi: 10.1103/PhysRevE.67.026112. [DOI] [PubMed] [Google Scholar]
- 22.Traud AL, Frost C, Mucha PJ, Porter MA. Visualization of communities in networks. Chaos. 2009;19:041104. doi: 10.1063/1.3194108. [DOI] [PMC free article] [PubMed] [Google Scholar]
- 23.Porter, M. A., Onnela, J.-P. & Mucha, P. J. Communities in Networks, 0–26 (2009).
- 24.Blondel VD, Guillaume J-L, Lambiotte R, Lefebvre E. Fast unfolding of communities in large networks. J. Stat. Mech: Theory Exp. 2008;10008:6. [Google Scholar]
- 25.Lancichinetti A, Fortunato S. Benchmarks for testing community detection algorithms on directed and weighted graphs with overlapping communities. Phys Rev E Stat Nonlin Soft Matter Phys. 2009;80:016118. doi: 10.1103/PhysRevE.80.016118. [DOI] [PubMed] [Google Scholar]
- 26.Lancichinetti A, Fortunato S, Radicchi F. Benchmark graphs for testing community detection algorithms. Phys Rev E Stat Nonlin Soft Matter Phys. 2008;78:046110. doi: 10.1103/PhysRevE.78.046110. [DOI] [PubMed] [Google Scholar]
- 27.Borgatti SP, Everett MG. Models of core/periphery structures. Social Networks. 2000;21:375–395. doi: 10.1016/S0378-8733(99)00019-2. [DOI] [Google Scholar]
- 28.De Bacco C, Power EA, Larremore DB, Moore C. Community detection, link prediction, and layer interdependence in multilayer networks. Phys Rev E. 2017;95:042317. doi: 10.1103/PhysRevE.95.042317. [DOI] [PubMed] [Google Scholar]
- 29.Betzel RF, Medaglia JD, Bassett DS. Diversity of meso-scale architecture in human and non-human connectomes. Nat Commun. 2018;9:346. doi: 10.1038/s41467-017-02681-z. [DOI] [PMC free article] [PubMed] [Google Scholar]
- 30.Zhang X, Martin T, Newman ME. Identification of core-periphery structure in networks. Phys Rev E Stat Nonlin Soft Matter Phys. 2015;91:032803. doi: 10.1103/PhysRevE.91.032803. [DOI] [PubMed] [Google Scholar]
- 31.Norton HK, et al. Detecting hierarchical genome folding with network modularity. Nat Methods. 2018;15:119–122. doi: 10.1038/nmeth.4560. [DOI] [PMC free article] [PubMed] [Google Scholar]
- 32.Yan KK, Lou S, Gerstein M. MrTADFinder: A network modularity based approach to identify topologically associating domains in multiple resolutions. PLoS Comput Biol. 2017;13:e1005647. doi: 10.1371/journal.pcbi.1005647. [DOI] [PMC free article] [PubMed] [Google Scholar]
- 33.Newman M. Modularity and community structure in networks. Proceedings of the National Academy of …. 2006;103:8577–8582. doi: 10.1073/pnas.0601602103. [DOI] [PMC free article] [PubMed] [Google Scholar]
- 34.Bonev B, et al. Multiscale 3D Genome Rewiring during Mouse Neural Development. Cell. 2017;171:557–572 e524. doi: 10.1016/j.cell.2017.09.043. [DOI] [PMC free article] [PubMed] [Google Scholar]
- 35.Beagan, J. A. et al. YY1 and CTCF orchestrate a 3D chromatin looping switch during early neural lineage commitment. Genome Res (2017). [DOI] [PMC free article] [PubMed]
- 36.Beagan JA, et al. Local Genome Topology Can Exhibit an Incompletely Rewired 3D-Folding State during Somatic Cell Reprogramming. Cell Stem Cell. 2016;18:611–624. doi: 10.1016/j.stem.2016.04.004. [DOI] [PMC free article] [PubMed] [Google Scholar]
- 37.Gilgenast TG, Phillips-Cremins JE. Systematic Evaluation of Statistical Methods for Identifying Looping Interactions in 5C Data. Cell Syst. 2019;8:197–211 e113. doi: 10.1016/j.cels.2019.02.006. [DOI] [PMC free article] [PubMed] [Google Scholar]
- 38.Kim JH, et al. 5C-ID: Increased resolution Chromosome-Conformation-Capture-Carbon-Copy with in situ 3C and double alternating primer design. Methods. 2018;142:39–46. doi: 10.1016/j.ymeth.2018.05.005. [DOI] [PMC free article] [PubMed] [Google Scholar]
- 39.Sun, J. H. et al. Disease-Associated Short Tandem Repeats Co-localize with Chromatin Domain Boundaries. Cell, (2018). [DOI] [PMC free article] [PubMed]
- 40.Boyle EA, Li YI, Pritchard JK. An Expanded View of Complex Traits: From Polygenic to Omnigenic. Cell. 2017;169:1177–1186. doi: 10.1016/j.cell.2017.05.038. [DOI] [PMC free article] [PubMed] [Google Scholar]
- 41.Yang J, et al. Common SNPs explain a large proportion of the heritability for human height. Nat Genet. 2010;42:565–569. doi: 10.1038/ng.608. [DOI] [PMC free article] [PubMed] [Google Scholar]
- 42.Shi H, Kichaev G, Pasaniuc B. Contrasting the Genetic Architecture of 30 Complex Traits from Summary Association Data. Am J Hum Genet. 2016;99:139–153. doi: 10.1016/j.ajhg.2016.05.013. [DOI] [PMC free article] [PubMed] [Google Scholar]
- 43.Manolio TA, et al. Finding the missing heritability of complex diseases. Nature. 2009;461:747–753. doi: 10.1038/nature08494. [DOI] [PMC free article] [PubMed] [Google Scholar]
- 44.Bonnell TR, Clarke PM, Henzi SP, Barrett L. Individual-level movement bias leads to the formation of higher-order social structure in a mobile group of baboons. R Soc Open Sci. 2017;4:170148. doi: 10.1098/rsos.170148. [DOI] [PMC free article] [PubMed] [Google Scholar]
- 45.Gollo LL, Roberts JA, Cocchi L. Mapping how local perturbations influence systems-level brain dynamics. Neuroimage. 2017;160:97–112. doi: 10.1016/j.neuroimage.2017.01.057. [DOI] [PubMed] [Google Scholar]
- 46.Huntsman BM, Petty JT. Density-dependent regulation of brook trout population dynamics along a core-periphery distribution gradient in a central Appalachian watershed. PLoS One. 2014;9:e91673. doi: 10.1371/journal.pone.0091673. [DOI] [PMC free article] [PubMed] [Google Scholar]
- 47.Bassett DS, et al. Task-based core-periphery organization of human brain dynamics. PLoS Comput Biol. 2013;9:e1003171. doi: 10.1371/journal.pcbi.1003171. [DOI] [PMC free article] [PubMed] [Google Scholar]
- 48.Vuorinen HS, Floman PA, Vaananen IS. Children and core-periphery differences. Soc Sci Med. 1988;27:1263–1268. doi: 10.1016/0277-9536(88)90356-5. [DOI] [PubMed] [Google Scholar]
- 49.Rossa FD, Dercole F, Piccardi C. Profiling core-periphery network structure by random walkers. Sci Rep. 2013;3:1467. doi: 10.1038/srep01467. [DOI] [PMC free article] [PubMed] [Google Scholar]
- 50.Lesne A, Riposo J, Roger P, Cournac A, Mozziconacci J. 3D genome reconstruction from chromosomal contacts. Nat Methods. 2014;11:1141–1143. doi: 10.1038/nmeth.3104. [DOI] [PubMed] [Google Scholar]
- 51.Kruse K, Sewitz S, Babu MM. A complex network framework for unbiased statistical analyses of DNA-DNA contact maps. Nucleic Acids Res. 2013;41:701–710. doi: 10.1093/nar/gks1096. [DOI] [PMC free article] [PubMed] [Google Scholar]
- 52.Pancaldi V, et al. Integrating epigenomic data and 3D genomic structure with a new measure of chromatin assortativity. Genome Biol. 2016;17:152. doi: 10.1186/s13059-016-1003-3. [DOI] [PMC free article] [PubMed] [Google Scholar]
- 53.Sandhu KS, et al. Large-scale functional organization of long-range chromatin interaction networks. Cell Rep. 2012;2:1207–1219. doi: 10.1016/j.celrep.2012.09.022. [DOI] [PMC free article] [PubMed] [Google Scholar]
- 54.Barabasi AL, Albert R. Emergence of scaling in random networks. Science. 1999;286:509–512. doi: 10.1126/science.286.5439.509. [DOI] [PubMed] [Google Scholar]
- 55.Babaei S, et al. Hi-C Chromatin Interaction Networks Predict Co-expression in the Mouse Cortex. PLoS Comput Biol. 2015;11:e1004221. doi: 10.1371/journal.pcbi.1004221. [DOI] [PMC free article] [PubMed] [Google Scholar]
- 56.Boulos, R. E., Arneodo, A., Jensen, P. & Audit, B. Revealing Long-Range Interconnected Hubs in Human Chromatin Interaction Data Using Graph Theory. Phys Rev Lett111 (2013). [DOI] [PubMed]
- 57.Albert R, Jeong H, Barabasi AL. Error and attack tolerance of complex networks. Nature. 2000;406:378–382. doi: 10.1038/35019019. [DOI] [PubMed] [Google Scholar]
Associated Data
This section collects any data citations, data availability statements, or supplementary materials included in this article.
Supplementary Materials
Data Availability Statement
Data in this manuscript were downloaded from GEO as detailed in the Supplementary Methods. We will freely share code upon request.


