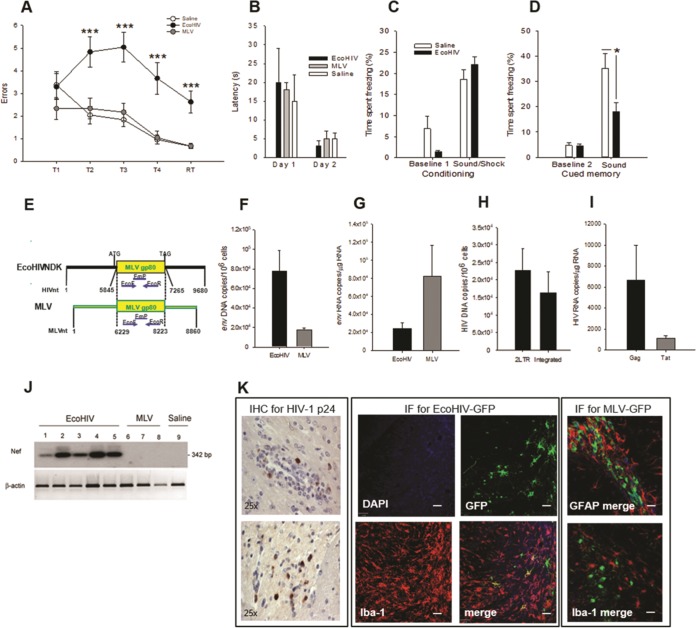
FIG 1.
EcoHIV and MLV efficiently replicate in mouse brain but only EcoHIV causes learning and memory impairments. (A and B) The RAWM test of mice inoculated intracranially with EcoHIV (closed circles), MLV (gray circles), or saline (open circles). Testing was conducted over 12 days starting 10 days after infection (n = 8 per group). (A) Mean number of errors ± the standard errors of the mean (SEM) made on the last 3 days of RAWM testing with the hidden platform. T1 to T4 denote acquisition trials, and RT denotes the retention trial performed after a 30-min delay. F(2,71) = 8.951, P < 0.001/T2, F(2,71) = 14.171, P < 0.001/T3, F(2,71) = 11.444, P < 0.001/T4, F(2,71) = 14.671, P < 0.001/R; (***, P < 0.001). (B) Mean latencies ± the SEM in finding the visible platform on trial 4 on days 1 and 2 of visible platform testing. (C and D) The auditory-cued fear conditioning test 2 weeks after intracranial inoculation with EcoHIV or saline (n = 8 per group). The figure shows the mean percentages of time spent freezing ± the SEM during paired sound-shock conditioning sessions on day 1 of the test (C) and sound (cued) response sessions in a new context on day 2 of the test (D). (E) Schematic representation of the shared MLV gp80 env gene in EcoNDK and MLV. (F and G) Quantification of EcoHIV (black bars) and MLV (gray bars) showing DNA or RNA burdens, respectively, in the brain tissues of mice after completion of the RAWM test shown in panels A and B. The env DNA or RNA region was amplified by QPCR or RT-QPCR, respectively; results are mean copies ± the SEM. (H to J) In a parallel experiment, three mice each were infected intracranially with EcoHIV, and 2 weeks later the brain tissues were tested by QPCR for HIV 2LTR and integrated DNA (H), by RT-QPCR for HIV Gag and Tat RNA (I), and by Southern blot hybridization for Nef transcript (J). The results in panels H and I are mean copies ± the SEM; β-actin RNA amplified in parallel served as a loading control in panel J. (K) Detection and cellular localization of viral proteins in mouse brain sections 2 weeks after intracranial infection of three to four mice each with EcoHIV (left panels), EcoHIV-GFP (middle panels), or MLV-GFP (Right panels). Representative images from five to seven sections in each mouse are shown. (Left panel) Detection of HIV p24 by immunohistochemical (IHC) staining evaluated by light microscopy. Note the p24-positive cells near a perivascular lesion (top) and in the brain parenchyma (bottom). Magnification, ×25. (Middle panel) Localization of HIV-encoded GFP in monocytoid cells by costaining for macrophage marker Iba-1 (red), GFP (green), and nuclear marker DAPI (blue) and evaluation by fluorescence microscopy. Individual channels and a merge image are shown. (Right panel) Detection of MLV-encoded GFP by costaining for GFP (green), nuclear marker DAPI (blue), and either astrocyte marker GFAP (red, upper image) or macrophage marker Iba-1 (red, lower image) and evaluation by fluorescence microscopy. Representative merged images are shown. Note the absence of colocalization of GFP with either GFAP or Iba-1.

