Abstract
Monoubiquitination of histone H2B on lysine 120 (H2Bub1) is an epigenetic mark generally associated with transcriptional activation, yet the global functions of H2Bub1 remain poorly understood. Ferroptosis is a form of non‐apoptotic cell death characterized by the iron‐dependent overproduction of lipid hydroperoxides, which can be inhibited by the antioxidant activity of the solute carrier family member 11 (SLC7A11/xCT), a component of the cystine/glutamate antiporter. Whether nuclear events participate in the regulation of ferroptosis is largely unknown. Here, we show that the levels of H2Bub1 are decreased during erastin‐induced ferroptosis and that loss of H2Bub1 increases the cellular sensitivity to ferroptosis. H2Bub1 epigenetically activates the expression of SLC7A11. Additionally, we show that the tumor suppressor p53 negatively regulates H2Bub1 levels independently of p53's transcription factor activity by promoting the nuclear translocation of the deubiquitinase USP7. Moreover, our studies reveal that p53 decreases H2Bub1 occupancy on the SLC7A11 gene regulatory region and represses the expression of SLC7A11 during erastin treatment. These data not only suggest a noncanonical role of p53 in chromatin regulation but also link p53 to ferroptosis via an H2Bub1‐mediated epigenetic pathway. Overall, our work uncovers a previously unappreciated epigenetic mechanism for the regulation of ferroptosis.
Keywords: ferroptosis, H2B monoubiquitination, p53, SCL7A11, USP7
Subject Categories: Autophagy & Cell Death; Chromatin, Epigenetics, Genomics & Functional Genomics; Post-translational Modifications, Proteolysis & Proteomics
Introduction
Cell death plays crucial roles in multiple biological processes, such as the control of normal development, the maintenance of homeostasis in multicellular organisms, and the regulation of uncontrolled proliferative or degenerative diseases 1, 2, 3. Apoptosis is the most deeply investigated form of cell death, while other types of non‐apoptotic cell death (e.g., necroptosis or pyroptosis) have also been identified.
Ferroptosis is a recently discovered type of non‐apoptotic cell death 4, 5, 6, 7. The execution of ferroptosis closely involves the ion‐dependent accumulation of lipid reactive oxygen species (ROS) instead of cytosolic ROS. The small molecule erastin has been recognized as specifically inducing ferroptosis by disrupting cellular lipid redox homeostasis. Detailed studies indicated that erastin inhibits the activity of the cystine/glutamate antiporter (system ), further leading to a decrease in cystine uptake. This reduction in cystine eventually results in a depletion of glutathione (GSH), which is the major antioxidant in cells 8, 9. Reduced GSH is utilized by glutathione peroxidase 4 (GPX4) to reduce lipid hydroperoxides and therefore protects cells against ferroptosis. The inactivation of GPX4 induces ferroptosis even in cells with normal cystine and GSH contents 10. SLC7A11 is a key component of system , which is required for cystine uptake 11, 12. Consistently, depletion of SLC7A11 results in significant upregulation of erastin‐induced ferroptosis. In addition, ferroptosis is morphologically distinct from other types of programmed cell death. For instance, ferroptotic cells show abnormal mitochondrial morphology with smaller size and increased membrane density, which has been recognized as the lone typical characteristic of ferroptosis in terms of morphology 4, 13.
Monoubiquitination of histone H2B at lysine 120 (H2Bub1) is a key epigenetic modification in the regulation of gene transcription and chromatin organization. For example, H2Bub1 is usually believed to be an active marker for gene transcription and results in an open chromatin context to facilitate gene transcription 14, 15, 16, 17. H2Bub1 is catalyzed by the E2 ubiquitin‐conjugating enzyme RAD6 (UBE2A/B) and E3 ubiquitin‐protein ligase BRE1 (RNF20/40), and the regulation of H2Bub1 by RAD6/BRE1 is conserved from yeast to human 18, 19, 20, 21. In addition to the establishing enzymes, multiple deubiquitinases have also been identified, including USP7 22, 23, 24, 25, USP12 26, USP22 27, USP44 28, USP46 26, and USP49 29. An increasing number of studies have indicated that H2Bub1 plays significant roles in various biological processes. For example, other researchers and our group have revealed the critical roles of H2Bub1 in the control of embryonic stem cell (ESC) differentiation. Levels of H2Bub1 are increased significantly during ESC differentiation, and this upregulation of H2Bub1 is required for efficient ESC differentiation. Mechanistic studies have revealed that the role of H2Bub1 in the regulation of ESC differentiation is mainly achieved through epigenetically regulating the expression of differentiation‐related genes or a group of long genes 28, 30, 31. Moreover, H2Bub1 has also been reported to be closely involved in cancer. Most studies have indicated that the levels of H2Bub1 are decreased in cancer, and loss of H2Bub1 promotes cancer metastasis 32, 33, although controversial results have been reported 34. In addition, our group recently suggested that H2Bub1 is also a critical epigenetic marker for the regulation of autophagy. H2Bub1 levels are strikingly decreased during starvation‐induced autophagy, and loss of H2Bub1 results in autophagosome formation and the activation of autophagy 35, 36.
p53 is the most investigated tumor suppressor and is mutated in more than 50% of human cancers 37, 38, 39. p53 is a sequence‐specific DNA‐binding protein that functions as a transcription factor 40, 41. It is well known that p53 plays critical roles in apoptosis, cell cycle regulation, senescence, DNA repair, and other cellular events 42. A recent study indicated that p53 also plays a crucial role in the control of ferroptosis by downregulating the expression of SLC7A11 13. However, how p53 negatively regulates SLC7A11 expression is still unclear, since p53 is a traditional transcription factor that usually activates gene expression. In addition, the chromatin‐regulating function of p53 has recently become a focus. p53 “gain‐of‐function” mutants can affect histone methylation and acetylation by regulating the expression of histone methyltransferases (e.g., MLL1 and MLL2) and histone acetyltransferase (e.g., MOZ) 43. Nevertheless, the role of p53 in controlling histone methylation and acetylation is still achieved through transcriptionally regulating the expression of the related enzymes.
In this study, we demonstrate that H2Bub1, as an epigenetic modification, plays an essential role in the regulation of ferroptosis. In addition, we identified that p53 is a novel regulator of H2Bub1, likely independent of its transcription factor activity, further supporting the status of p53 as a significant chromatin regulator 43. Most importantly, this study also links p53 to ferroptosis by the H2Bub1‐mediated epigenetic pathway.
Results
Loss of H2Bub1 significantly sensitizes cells to erastin‐induced ferroptosis
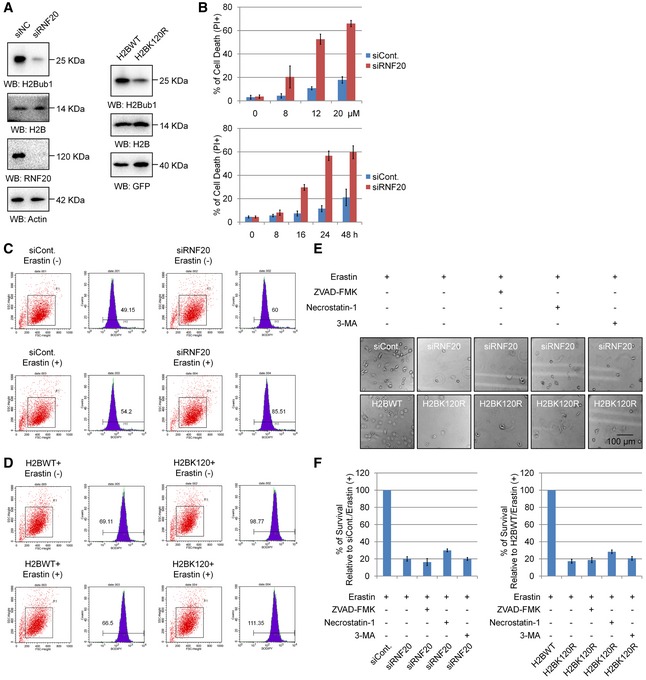
To determine whether epigenetic modifications regulate ferroptosis, we first performed Western blot screening with various antibodies against distinct histone modifications upon erastin (a specific ferroptosis inducer) stimulation, a standard method to induce ferroptosis 4, 13. Intriguingly, we found that the levels of H2Bub1 are strikingly decreased after erastin treatment, suggesting that H2Bub1 may be involved in the regulation of ferroptosis (Fig 1A). To further determine the role of H2Bub1 in the control of ferroptosis, we next tested the effect of loss of H2Bub1 on ferroptosis. In addition to knockdown of RNF20 expression, we and others previously indicated that overexpression of the K120R mutant of H2B (H2BK120R) can also downregulate the levels of endogenous H2Bub1 making a useful way to examine the roles of H2Bub1 44, 45. Therefore, we inhibited endogenous H2Bub1 by knocking down the RNF20 expression and overexpressing of H2BK120R mutant (Fig EV1A). Surprisingly, we observed that loss of H2Bub1 with RNF20‐specific siRNA or H2BK120R mutant significantly sensitizes cells to erastin‐induced cell death (Figs 1B and EV1B). As mentioned above, lipid ROS accumulation is a hallmark of ferroptosis 4. We therefore examined the intracellular lipid ROS levels in normal and H2Bub1‐depleted cells upon erastin treatment. Consistent with its effect on cell death, the loss of H2Bub1 obviously increased erastin‐induced lipid ROS levels (Figs 1C, and EV1C and D). Because the alteration of mitochondrial morphology is the lone characteristic feature of ferroptosis compared to other forms of cell death 4, 13, we performed a transmission electron microscopy assay to detect mitochondrial morphology. Consistent with the ferroptotic morphology 4, 13, cells depleted of H2Bub1 and treated with erastin show very serious defects in mitochondrial morphology, including smaller size and increased membrane density, while the nuclear membrane is intact, and no DNA fragmentation is observed (Fig 1D). To further confirm the mode of H2Bub1‐regulated cell death upon erastin stimulation, we treated cells with ferrostatin‐1 (ferr‐1), a specific inhibitor of ferroptosis 4, 13. Notably, ferr‐1 almost completely rescued the cell death induced by the loss of H2Bub1 upon erastin treatment (Fig 1E). In contrast, inhibitors of other forms of cell death, including ZVAD‐FMK (apoptosis), necrostatin‐1 (necroptosis), and 3‐MA (autophagy), all failed to suppress erastin‐induced cell death in H2Bub1‐depleted cells (Fig EV1E and F). Together, these data demonstrate that the epigenetic marker H2Bub1 is likely a novel negative regulator of ferroptosis.
Figure 1. Loss of H2Bub1 promotes ferroptosis.
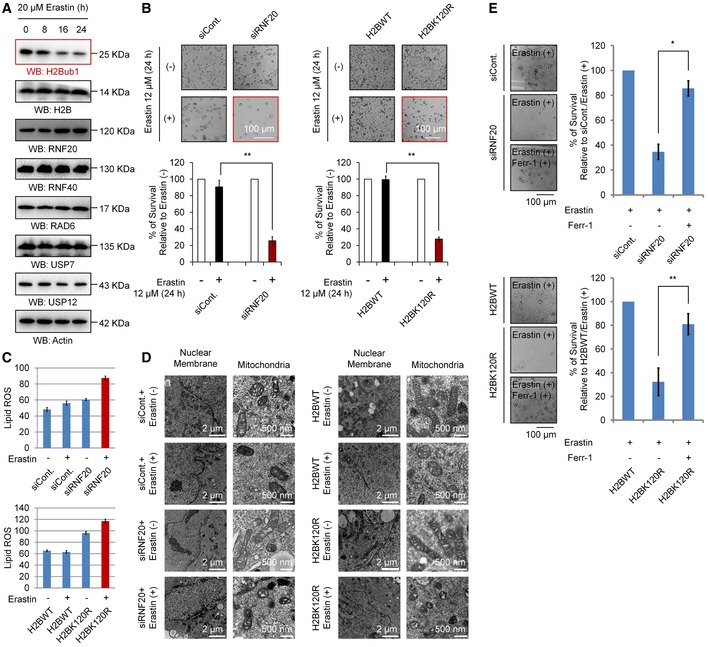
- Western blot analysis of 293T cells treated with 20 μM erastin for the indicated times.
- H1299 cells transfected with a control siRNA (siCont.) or an RNF20‐specific siRNA (siRNF20) and a wild‐type H2B (H2BWT) or a K120R‐mutated H2B (H2BK120R) were treated with 12 μM erastin (+) or untreated (−) for 24 h. Representative phase‐contrast images were recorded (magnification, ×20), and the surviving cells were counted.
- Lipid ROS levels were assessed by flow cytometry after C11‐BODIPY staining in cells treated as in (B).
- H1299 cells treated as in (B) were subjected to transmission electron microscopy. Representative images are shown.
- Control H1299 cells (transfected with siCont. or H2BWT) and H2Bub1‐depleted H1299 cells (transfected with siRNF20 or H2BK120R) were treated with erastin either with or without a ferroptosis‐specific inhibitor, ferrostatin‐1 (2 μM), for 24 h. Representative phase‐contrast images were recorded (magnification, ×20), and the surviving cells were counted.
Figure EV1. Loss of H2Bub1 sensitizes cells to erastin‐induced cell death.
-
AWestern blot for H1299 cells transfected as indicated.
-
BH1299 cells transfected with a control siRNA (siCont.) or a RNF20‐specific siRNA (siRNF20) were treated with erastin with different dosage for 24 h or with 12 μM for different time points as indicated. Cell death was then examined by PI staining coupled with flow cytometry assay.
-
C, DH1299 cells transfected as indicated for 24 h were treated with 12 μM erastin (+) or untreated (−) for another 24 h. Cells were harvested and subjected to flow cytometry analysis by staining with C11‐BODIPY to detect lipid ROS levels.
-
E, FH1299 cells transfected with a control siRNA (siCont.) or an RNF20‐specific siRNA (siRNF20), and a wild‐type H2B (H2BWT) or a K120R‐mutated H2B (H2BK120R) were treated with 12 μM erastin for 24 h together with specific cell death inhibitors (+) or untreated (−). Representative phase‐contrast images were recorded (magnification, ×20) (E), and the surviving cells were counted (F).
H2Bub1 regulates the expression of SLC7A11 and a group of ion‐binding genes that function in multiple metabolism‐related processes
As previously mentioned, SLC7A11, which encodes a component of the cystine/glutamate antiporter, system , is a critical protein in the control of ferroptosis 4, 13. Therefore, we tested whether H2Bub1 affects SLC7A11 expression. To our surprise, we found that loss of H2Bub1 significantly downregulates both the mRNA and protein levels of SLC7A11 (Fig 2A). Moreover, our chromatin immunoprecipitation (ChIP) analysis indicates that H2Bub1 is enriched in the gene regulatory region of the SLC7A11 gene (Fig 2B, left), and most importantly, erastin treatment abolishes the occupancy of H2Bub1 on SLC7A11 (Fig 2B, right), suggesting that SLC7A11 may represent a novel downstream target gene of H2Bub1. As above mentioned, the uptake of extracellular cystine is mediated by SLC7A11, and cystine is a major precursor for GSH biosynthesis. GSH is the primary cellular antioxidant and protects cells from ferroptosis 8, 9, 10, 11, 12. We therefore tested the intracellular GSH levels to indicate the activities of SLC7A11. Consistently, we observed that loss of H2Bub1 decreased the intracellular GSH levels, suggesting an impaired SLC7A11 activity in H2Bub1‐depleted cells (Fig 2C). We next examined whether SLC7A11 is essential for the sensitization of cells to erastin‐induced ferroptosis by loss of H2Bub1. As expected, SCL7A11 overexpression almost significantly rescued the ferroptosis induced by the loss of H2Bub1 upon erastin stimulation, suggesting that SLC7A11 plays a major role in mediating the loss of H2Bub1‐sensitized ferroptosis (Fig 2D and E).
Figure 2. Identification of SLC7A11 as a target of H2Bub1.

- qRT–PCR (left) and Western blot (right) analyses of H1299 cells transfected with a control siRNA (siCont.) or an RNF20‐specific siRNA (siRNF20) and a wild‐type H2B (H2BWT) or a K120R‐mutated H2B (H2BK120R) for 24 h.
- Chromatin immunoprecipitation (ChIP) assay was carried out with anti‐H2Bub1 antibodies in H1299 cells (left) or 293T cells either untreated or treated with 20 μM erastin for 24 h (right). The intergenic region was used as a negative control for the occupancy of H2Bub1.
- Intracellular GSH levels were examined in H1299 cells treated as indicated, and bar graphs are shown.
- H1299 cells transfected as indicated were treated with 12 μM erastin (+) or untreated (−) for 24 h. Representative phase‐contrast images were recorded (magnification, ×20).
- Surviving cells from the assay shown in (D) were counted.
- GO analysis with the genes downregulated in H2BK120R (black) or RNF20‐specific siRNA (siRNF20) (red) transfected 293T cells by employing a previously reported microarray data 44.
- Affected metal ion‐binding genes in (F) were selected and subjected to cluster analysis.
- Labile iron levels were assessed by flow cytometry with a standard method in H1299 cells.
- Labile iron levels examined in (H) were quantified.
In addition, we previously performed a microarray analysis to predict the global biological roles of H2Bub1 with H2Bub1‐depleted cells 44. A GO analysis was performed with these reported data, and intriguingly, we found that a group of genes that encode metal ion‐binding proteins were significantly affected by the loss of H2Bub1 (Fig 2F), and these genes were downregulated after H2Bub1 depletion (Figs 2G, and EV2A and B). We therefore suspected that the decreased expression of these genes after loss of H2Bub1 may result in an increase in metal ion levels that may include iron, providing a novel possible mechanism for the sensitization of cells to erastin‐induced ferroptosis by loss of H2Bub1. Therefore, we measured the labile iron levels in both control and H2Bub1‐depleted H1299 cells. Consistent with our speculation, the results show that loss of H2Bub1 significantly increases the labile iron levels in human cells (Fig 2H and I). In addition, a STRING analysis suggested that these affected metal ion‐binding genes are mainly enriched in various metabolism‐related processes, including redox‐related events (e.g., ADAMTS5, CYP51A1, and ZNF341) and multiple macromolecule metabolic processes (e.g., BCL11B, MGAT4A, CHSY3, and LMO3; Fig EV2C), which are tightly related to the regulation of cellular redox balance.
Figure EV2. H2Bub1 regulates the expression of a group of ion‐binding proteins.
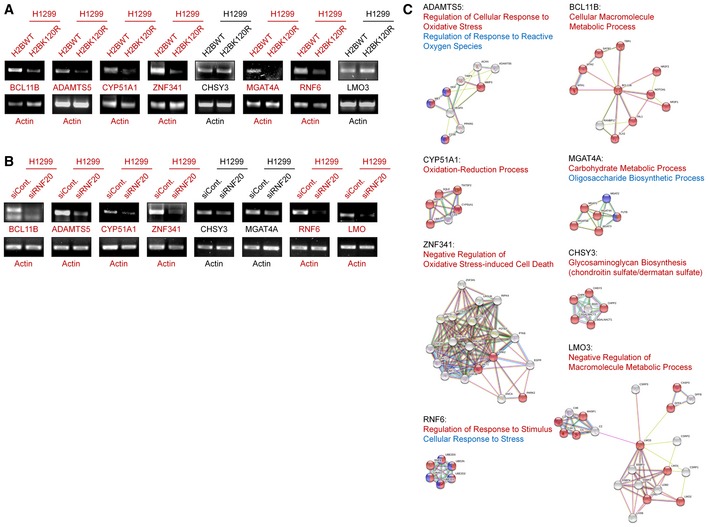
- mRNA levels of H2Bub1‐affected metal ion‐binding genes in H1299 cells transfected with wild‐type H2B (H2BWT) and K120R‐mutated H2B (H2BK120R) were determined by RT–PCR analysis.
- The mRNA levels of the same genes shown in (A) were tested by RT–PCR analysis in H1299 cells transfected with a control siRNA (siCont.) and an RNF20‐specific siRNA (siRNF20).
- STRING analysis of the selected metal ion‐binding genes indicated that several metabolism‐related processes are involved, including multiple redox‐related events.
p53 negatively regulates H2Bub1 levels
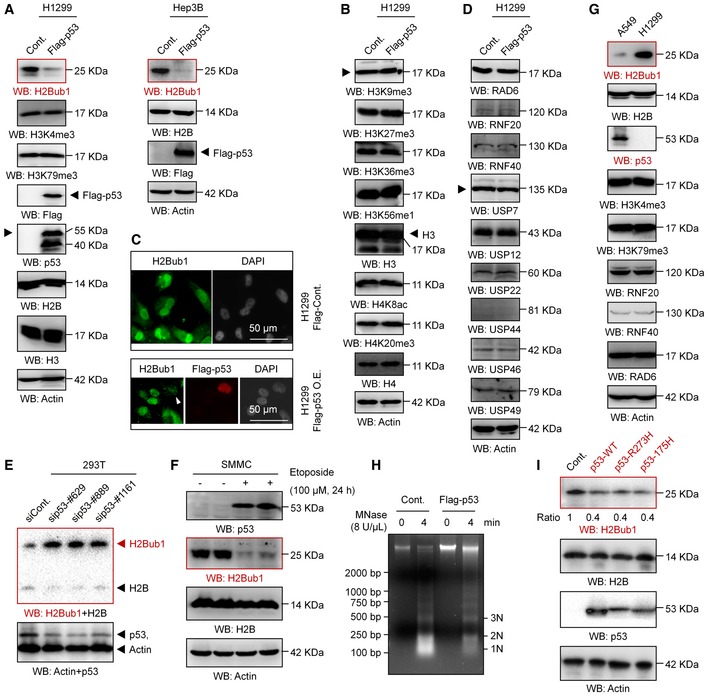
Previous studies indicated that p53 controls chromatin methylation and acetylation by transcriptionally regulating the expression of multiple histone methyltransferases and acetyltransferase 43 and that p53 affects ferroptosis by transcriptionally downregulating the expression of SLC7A11 13. Therefore, we wondered whether p53 modulates H2Bub1 levels. To our great surprise, we found that overexpression of p53 reduces H2Bub1 levels strikingly in distinct cell lines (Figs 3A and EV3A), whereas the levels of other histone modifications, including H3K9me3, H3K27me3, H3K36me3, H3K56me1, H4K8ac, and H4K20me3, are not affected (Figs 3B and EV3B). Although H3K4me3 and H3K79me3 are reported to be downstream targets of H2Bub1 46, 47, 48, the levels of both H3K4me3 and H3K79me3 were not obviously affected by p53 overexpression (Fig 3A), which is consistent with the view that changes in H2Bub1 are not always coupled with changes in H3K4me3 and H3K79me3 28, 30, 31, 49, 50. Moreover, the results of our immunofluorescence (IF) assay also support the above notion that overexpression of p53 downregulates the levels of H2Bub1 (Fig 3C). Together, these findings suggest that p53 specifically regulates H2Bub1 in human cells.
Figure 3. p53 negatively regulates H2Bub1.
-
A, BWestern blot analysis was performed with H1299 or Hep3B cells transfected with a Flag‐tagged p53 or an empty plasmid (Cont.) for 48 h.
-
CImmunofluorescence (IF) assay for H1299 cells transfected with a Flag‐tagged p53 (Flag‐p53) or an empty plasmid (Cont.) for 48 h. Representative images are shown (magnification, ×40). Arrowhead indicates a Flag‐p53 overexpressing cell.
-
DWestern blot analysis was performed with H1299 transfected with a Flag‐tagged p53 or an empty vector (Cont.) for 48 h.
-
E293T cells transfected with a control siRNA (siCont.) and three p53‐specific siRNAs (sip53) were subjected to Western blot analysis.
-
FSMMC cells were treated with 100 μM etoposide (+) or untreated (−) for 24 h, and Western blot analysis was performed.
-
GWestern blot analysis of A549 cells and H1299 cells.
-
HH1299 cells transfected with a Flag‐tagged p53 or an empty plasmid (Cont.) were analyzed by micrococcal nuclease (MNase) digestion assay.
-
IWestern blot analysis of H1299 cells transfected with a wild‐type p53 (p53‐WT) or two “gain‐of‐function” mutants (p53‐R273H and p53‐R175H) for 48 h.
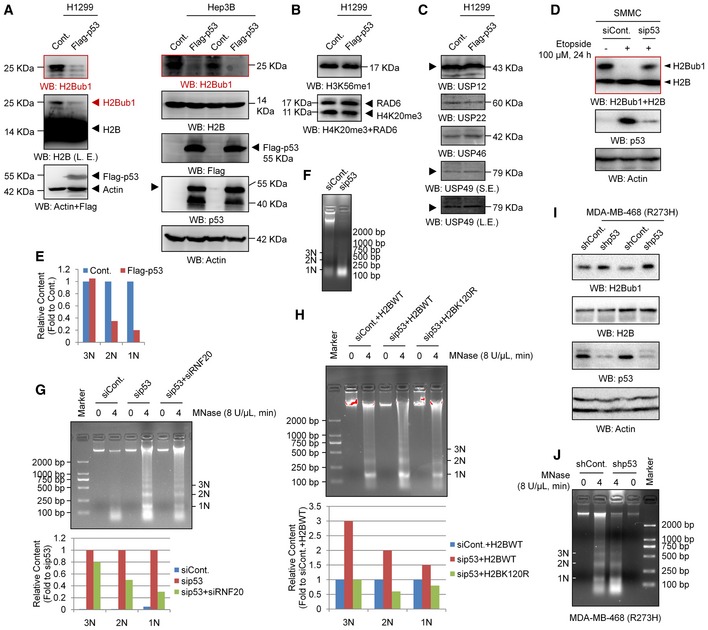
Figure EV3. Loss of H2Bub1 affects H2Bub1 levels and chromatin compaction.
-
A–CH1299 or Hep3B cells were transfected with a Flag‐tagged p53 or an empty control vector (Cont.) for 48 h followed by Western blot analysis. Arrowheads indicate the corresponding band of the indicated proteins.
-
DControl (siCont.) or p53 depleted (sip53) SMMC cells were treated with 100 μM etoposide (+) or untreated (−) for 24 h as indicated, and Western blot analysis was performed.
-
ERelative quantification of 1N–3N bands specifically corresponding to the data in Fig 3H. No replicates were involved in the band quantification.
-
FMNase digestion analysis for 293T cells transfected with a control siRNA (siCont.) or a p53‐specific siRNA.
-
G293T cells transfected with a control siRNA (siCont.), a p53‐specific siRNA (sip53), or sip53 together with an RNF20‐specific siRNA (sip53 + siRNF20) were harvested for the MNase digestion assay. Corresponding relative quantification of 1N–3N bands is shown. No replicates were involved in the band quantification.
-
H293T cells transfected with a control siRNA (siCont.), a p53‐specific siRNA (sip53) together with a wild‐type H2B (H2BWT), or a K120R‐mutated H2B (H2BK120R) as indicated for 48 h. Cells were then harvested for the MNase digestion assay. Corresponding relative quantification of 1N–3N bands is shown. No replicates were involved in the band quantification.
-
IMDA‐MB‐468 cells infected with a control shRNA (siCont.) and a p53‐specific shRNA (sip53, Santa Cruz, #sc‐29435‐V) were subjected to Western blot analysis.
-
JMNase digestion analysis for MDA‐MB‐468 cells infected with a control shRNA (siCont.) or a p53‐specific shRNA.
We next wondered how p53 regulates the levels of H2Bub1. Therefore, the levels of all the reported ubiquitinases (e.g., RAD6, RNF20, and RNF40) 20, 21 and deubiquitinases (e.g., USP7, USP12, USP22, USP44, USP46, and USP49) 22, 23, 24, 25, 26, 27, 28, 29 were examined upon p53 overexpression. However, no obvious changes were observed in any of the tested enzymes, suggesting that other mechanisms are likely involved (Figs 3D and EV3C).
Furthermore, we also performed a p53 knockdown experiment to validate the effect of p53 on H2Bub1. Consistently, the levels of H2Bub1 were increased in p53‐depleted cells (Fig 3E). To further confirm p53‐H2Bub1 regulation under relative physiological conditions, we tested the relationship between p53 and H2Bub1 in response to treatment with etoposide, a well‐known anti‐cancer drug that can induce p53 upregulation 51, 52. Intriguingly, the levels of H2Bub1 were significantly decreased, therefore negatively correlating to p53 upregulation upon etoposide treatment (Fig 3F). Moreover, the observed etoposide‐induced loss of H2Bub1 can be rescued by further depletion of p53, suggesting that the effect of etoposide on H2Bub1 is p53 dependent (Fig EV3D). More interestingly, we examined the levels of H2Bub1 in a pair of cell lines with (A549) or without p53 (H1299). The levels of H2Bub1 in H1299 cells were much higher than those in A549 cells, while no obvious differences in the levels of H3K4me3 and H3K79me3 were observed (Fig 3G). Together, these data indicate that p53 is a novel negative regulator of H2Bub1.
As H2Bub1 is a critical modulator of higher order chromatin structure and can cause chromatin decondensation 17, 53, we suspected that p53 may also affect higher order chromatin structure by regulating H2Bub1. We examined the degree of chromatin compaction in H1299 cells with or without p53 overexpression by using micrococcal nuclease (MNase) digestion, which cuts the linker DNA that connects the nucleosomes and thus can show higher order chromatin structure status. The DNA from whole nuclei that we isolated from p53‐overexpressing cells was less digested than that from the control counterparts, suggesting that p53 overexpression renders the chromatin more compacted (Figs 3H and EV3E), which is similar to the effect of loss of H2Bub1 53. Consistently, cells with p53 knockdown showed a less compacted chromatin that was much more susceptible to digestion by MNase (Fig EV3F). To confirm whether the effect of p53 on higher order chromatin structure is achieved through its regulation on H2Bub1, a rescue assay of the MNase digestion experiment was performed. We found that loss of H2Bub1 rescues the effect of p53 knockdown on chromatin compaction, suggesting that the regulation of higher order chromatin structure by p53 is achieved through modulating H2Bub1 (Fig EV3G and H).
Intriguingly, the regulation of H2Bub1 by p53 seems not to be dependent on its transcription factor activity, as overexpression of the “gain‐of‐function” mutants that lack its DNA‐sequence‐specific transcription function, p53‐R273H and p53‐R175H 54, 55, also shows similar effects on H2Bub1 levels to those of wild‐type p53 (p53‐WT; Fig 3I). Moreover, loss of p53 in MDA‐MB‐468 cells, which possess intrinsic p53‐R273H mutation 43, also increases the H2Bub1 levels (Fig EV3I) and results in a less compacted chromatin conditions (Fig EV3J), which are similar as observed in p53‐WT 293T cells (Figs 3E and EV3F).
p53 promotes the nuclear translocation of H2Bub1 deubiquitinase USP7
It has been reported that USP7 (also named HAUSP) interacts with, deubiquitinates, and stabilizes p53 56, 57. However, loss of USP7 in cells does not decrease p53 levels as predicted 58, as USP7 also binds and deubiquitinates MDM2 58, 59. Moreover, MDM2 seems to be a better binding partner of USP7 than p53 60, 61. Thus, the molecular regulation of the p53‐USP7 interaction is rather complicated. We therefore suspected that the interaction between p53 and USP7 may possess additional undetermined regulatory significance. In addition, increasing studies have indicated that H2Bub1 is also a substrate of USP7. USP7 deubiquitinates H2Bub1 to modulate the chromatin landscape in both Drosophila and mammals 22, 23, 24, 25. Together with the findings that the regulation of H2Bub1 by p53 does not seem to be achieved by affecting the expression of H2Bub1‐related ubiquitinase or deubiquitinase (Figs 3D and EV3C), we speculated that p53 may regulate H2Bub1 by controlling USP7 through an unknown mechanism rather than controlling USP7 expression. We first confirmed the interaction between USP7 and p53 in human cells and found that USP7 indeed associates with p53 (Fig 4A), which is consistent with previously reported results 56. Moreover, the regulation of H2Bub1 by p53 is blocked when USP7 is depleted, suggesting that p53 regulates H2Bub1 likely through USP7 (Figs 4B and EV4A). Intriguingly, we found that in H1299 cells without p53 expression, depletion of USP7 shows a weak effect on H2Bub1 levels (Fig 4B, compare with lane 1 and lane 4). However, consistent with previous reports 22, 23, 24, depletion of USP7 in cells with p53 expression significantly increases H2Bub1 levels (Figs EV4B and 4B, compare with lane 2 and lane 3), suggesting that p53 is also required for the regulation of H2Bub1 by USP7. Thus, both p53 and USP7 are mutually required for the control of H2Bub1 levels.
Figure 4. p53 regulates the nuclear translocation of USP7.
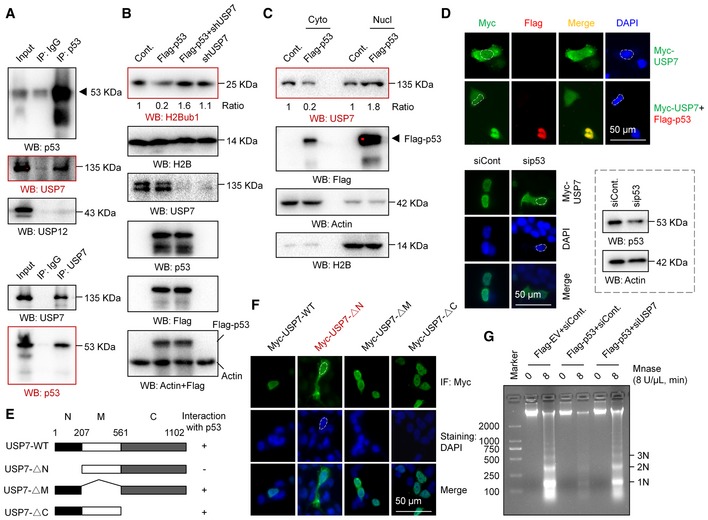
- Coimmunoprecipitation (Co‐IP) analysis was performed in A549 cells with antibodies against p53 or USP7.
- H1299 cells were transfected with an empty vector (Cont.), a Flag‐tagged p53, a USP7‐specific shRNA, or the last two plasmids together for 48 h. Western blot analysis was then performed.
- Nuclear and cytosolic extracts were differentially prepared from H1299 cells transfected with a Flag‐tagged p53 or an empty plasmid (Cont.). Western blot analysis was then performed.
- H1299 cells transfected with a Myc‐tagged USP7 or a Myc‐tagged USP7 together with a Flag‐tagged p53 were subjected to IF analysis (upper). A549 cells transfected with a p53‐specific siRNA or a control siRNA (siCont.) were examined by IF analysis, and the RNAi efficiency is shown (lower). Representative images are shown (magnification, ×40).
- IF analysis of A549 cells transfected with a Myc‐tagged wild‐type USP7 (Myc‐USP7‐WT) or three Myc‐tagged truncated mutants. Representative images are shown (magnification, ×40).
- H1299 cells were transfected with a Flag‐tagged p53 or an empty vector together with a USP7‐specific siRNA or a control siRNA as indicated for 48 h. Cells were then harvested and subjected to a MNase digestion assay.
Source data are available online for this figure.
Figure EV4. USP7 is involved in the p53‐regulated H2Bub1 levels.
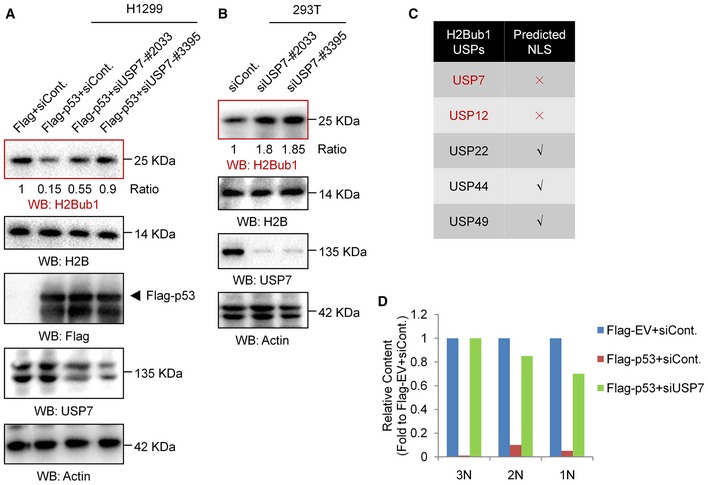
- H1299 cells were transfected with an empty vector (Flag) or a Flag‐tagged p53 together with a control siRNA (siCont.) or two separate USP7‐specific shRNAs (siUSP7) for 48 h. Western blot analysis was then performed.
- Western blot analysis of 293T cells transfected with a control siRNA or two separate USP7‐specific shRNAs (siUSP7).
- Results of the NLS prediction analysis.
- Relative quantification of 1N–3N bands specifically corresponding to the data in Fig 4G. No replicates were involved in the band quantification.
Our nuclear localization signal (NLS) prediction analysis showed that USP7 seems to lack a typical NLS (Fig EV4C). We next examined whether p53 regulates the nuclear translocation of USP7. Western blot analysis of nuclear and cytosolic fractions revealed that USP7 is present in almost equal amounts in the cytoplasm and nucleus of H1299 cells without p53 overexpression. However, a significant decrease in USP7 in the cytosolic fraction combined with an increase in nuclear USP7 was detected after p53 overexpression, suggesting that p53 promotes the nuclear translocation of USP7 (Fig 4C). In accordance with the Western blot results, our IF analysis also supports the idea that p53 regulates the nuclear translocation of USP7. We found that the USP7 protein is distributed throughout the cell in H1299 cells without p53 overexpression, while it primarily resided in the nucleus after p53 overexpression (Fig 4D, upper). More intriguingly, in contrast to the distribution in H1299 cells, USP7 is mainly localized in the nucleus in p53‐positive A549 cells. Depletion of p53 resulted in an obvious whole‐cell distribution in A549 cells, similar to that in normal H1299 cells (without p53; Fig 4D, lower). As it has been reported that the N‐terminal region of USP7 is required for its interaction with p53 56, 57 (Fig 4E), we next analyzed the distributions of various USP7 mutants, including USP7 lacking the N‐terminal region (USP7‐∆N), lacking the middle region (USP7‐∆M), and lacking the C‐terminal region (USP7‐∆C) in A549 cells. Intriguingly, the USP7‐∆N mutant lacking the ability to interact with p53 shows a whole‐cell distribution, while other mutants show nuclear distributions similar to that of wild‐type USP7 (Fig 4F), further indicating that loss of the interaction with p53 impairs the nuclear localization of USP7. Together, the above results reveal a previously unknown regulatory mechanism of the p53‐USP7 interaction that p53 promotes the nuclear translocation of USP7 by interacting with USP7.
Together with the findings that p53 modulates higher order chromatin structure by affecting H2Bub1 (Figs 3H, and EV3E–H and J), and the regulation of H2Bub1 by p53 is achieved by controlling USP7 nuclear translocation (Figs 4A–F and EV4A–C), we next asked whether USP7 is involved in the regulation of chromatin structure by p53. As expected, we found that the compacted chromatin status induced by p53 overexpression is strikingly rescued by USP7 knockdown, as depletion of USP7 in p53‐overexpressing cells results in a similar MNase digestion pattern to that in the control cells (Figs 4G and EV4D), further supporting the above observation about p53‐H2Bub1 regulation.
In addition, to our great surprise, we accidentally found that p53 associates with H2Bub1 but not free H2B in human cells (Fig 5A). Moreover, we synthesized a biotin‐labeled peptide which was used to generate the H2Bub1‐specific antibody 16 and the corresponding free H2B peptide (Fig 5B). Peptide pull‐down assay was then performed. Intriguingly, our result revealed that p53 specifically associates with the “H2Bub1” peptide but not the free H2B peptide (Fig 5C), suggesting that p53 may recognize and bind to the branching region of K120 ubiquitinated H2B. Together with the findings that p53 positively regulates USP7 nuclear translocation (Fig 4C–F), we next asked whether p53 promotes the binding of USP7 to H2Bub1. Indeed, we found that p53 overexpression significantly promotes the binding of USP7 to H2Bub1 under treatment with the USP7‐specific inhibitor P5091 62 (Fig 5D), suggesting that p53 likely promotes the recruitment of USP7 to H2Bub1. Based on all these results, we speculate that p53 may act as a mediator that links USP7 to H2Bub1 by promoting USP7 nuclear translocation and recognizing H2Bub1 (Fig 5E).
Figure 5. p53 associates with H2Bub1 both in vivo and in vitro .
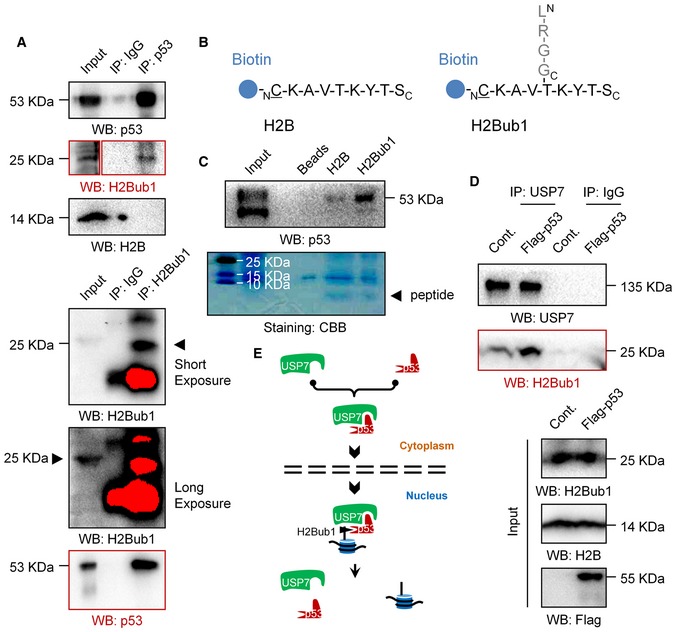
- Co‐IP analysis was performed in 293T cells with antibodies against p53 or H2Bub1.
- Peptide pull‐down assay was performed with synthesized peptides in (B).
- Co‐IP analysis for H1299 cells transfected with a Flag‐tagged p53 or an empty plasmid (Cont.) treated with a USP7‐specific inhibitor P5091.
- A proposed working model of the regulation of H2Bub1 by p53.
The p53‐USP7‐H2Bub1 axis responds to erastin stimulation and regulates SLC7A11 expression
To determine whether the observed p53‐USP7‐H2Bub1 axis regulates SLC7A11 expression during ferroptosis induction, we first examined the dynamic changes in the related components in response to erastin treatment. However, both p53 and USP7 protein levels showed no obvious changes upon erastin treatment, although H2Bub1 levels were decreased significantly (Fig 6A), suggesting that more complicated mechanisms are involved. We next asked whether erastin treatment modulates the interaction between p53 and USP7 and further triggers the nuclear translocation of USP7. As expected, erastin treatment strikingly promotes the interaction between p53 and USP7 (Figs 6B and EV5A). We next tested the effect of erastin treatment on USP7's subcellular distribution status. Interestingly, we found that erastin treatment significantly promotes the nuclear translocation of USP7, as the levels of USP7 in the nuclear fraction are significantly increased after erastin treatment, while that in the cytosolic fraction is decreased (Figs 6C and EV5B). However, in H1299 cells without p53 overexpression, no obvious changes in USSP7 distribution between cytoplasm and nucleus upon erastin treatment were observed, suggesting that erastin‐induced USP7 nuclear translocation depends on p53 (Fig EV5C). Moreover, we observed that the erastin‐induced downregulation of H2Bub1 is obviously rescued by depletion of p53 or USP7, supporting the essential role of the p53‐USP7 axis in the regulation of H2Bub1 levels by erastin (Fig 6D).
Figure 6. p53‐USP7‐H2Bub1 axis regulates SLC7A11 expression.
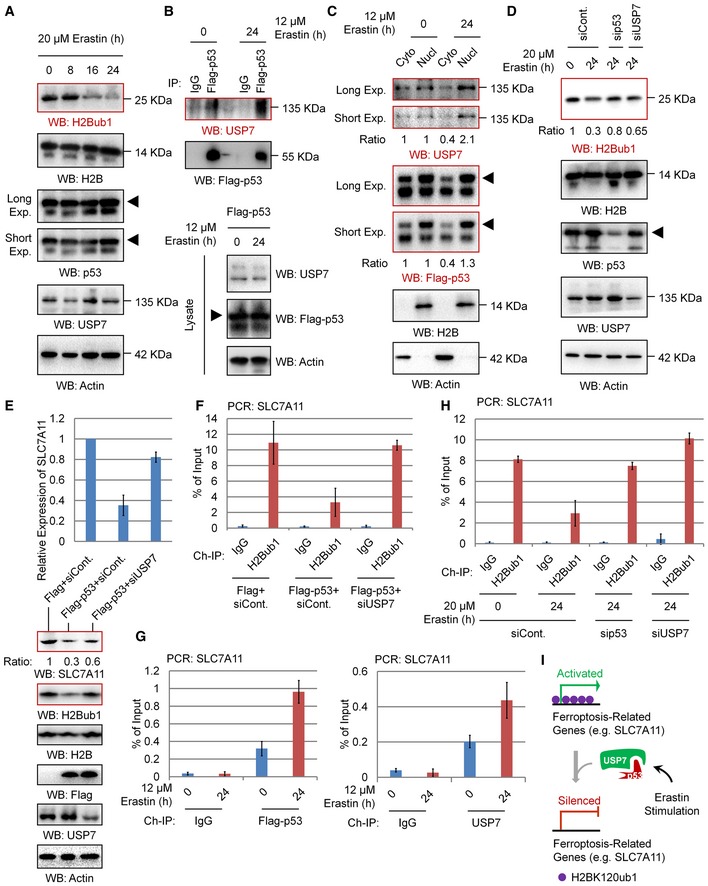
- Western blot analysis of 293T cells treated with 20 μM erastin for the indicated times.
- H1299 cells were transfected with Flag‐tagged p53 for 24 h and then treated with 12 μM erastin or untreated for another 24 h. Co‐IP analysis was performed with antibodies against Flag.
- H1299 cells transfected with Flag‐tagged p53 were treated with erastin or untreated for 24 h. Nuclear and cytosolic extracts were differentially prepared and subjected to Western blot analysis.
- 293T cells transfected with a p53‐specific siRNA, a USP7‐specific siRNA, or a control siRNA (siCont.) were treated with 20 μM erastin or untreated for 24 h as indicated. Western blot analysis was then performed.
- qRT–PCR (above) and Western blot (below) analyses for H1299 cells transfected with a Flag‐tagged p53 or an empty plasmid together with a USP7‐specific siRNA or a control siRNA (siCont.) as indicated.
- ChIP analysis of H1299 cells transfected with a Flag‐tagged p53 or an empty plasmid together with a USP7‐specific siRNA or a control siRNA (siCont.) as indicated.
- H1299 cells transfected with Flag‐tagged p53 were treated with 12 μM erastin or untreated for 24 h. ChIP analysis with antibodies against Flag or USP7 was performed.
- 293T cells transfected with a p53‐specific siRNA, a USP7‐specific siRNA, or a control were treated with 20 μM erastin or untreated for 24 h. ChIP analysis was performed with anti‐H2Bub1 antibodies.
- A proposed working model for the p53‐USP7‐H2Bub1 axis in the regulation of SLC7A11 expression.
Figure EV5. Erastin promotes the nuclear translocation of USP7, and USP7 is involved in the regulation of the expression of a group of ion‐binding proteins affected by p53.
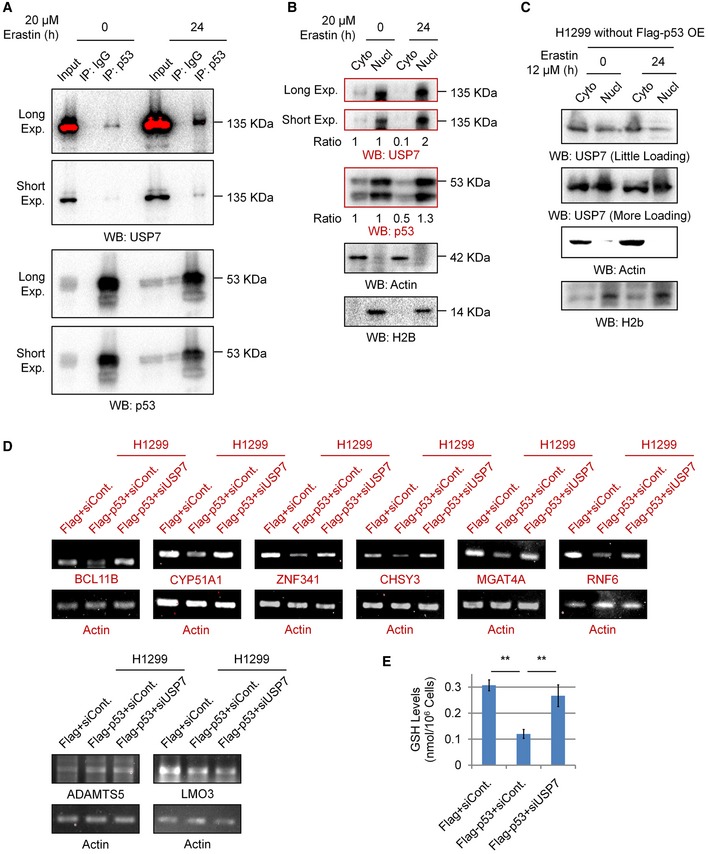
- Co‐IP analysis of the endogenous interaction between p53 and USP7 in 293T cells with or without erastin treatment.
- Nuclear and cytosolic extracts were differentially prepared from 293T cells treated with 20 μM erastin or untreated for 24 h. Western blot analysis was then performed to detect the levels of endogenous USP7 and p53.
- H1299 cells were treated with erastin or untreated for 24 h. Nuclear and cytosolic extracts were differentially prepared and subjected to Western blot analysis.
- H1299 cells were transfected with a Flag‐tagged p53 or an empty control plasmid (Flag) together with a control siRNA (siCont.) or a USP7‐specific siRNA (siUSP7) as indicated for 48 h. Cells were then lysed and subjected to RT–PCR analysis.
- Intracellular GSH levels were examined in H1299 cells transfected as indicated, and bar graphs are shown.
Next, we examined the effect of the p53‐USP7‐H2Bub1 axis on the expression of SLC7A11. In accordance with a previous report 13, p53 overexpression obviously decreases both the mRNA and protein levels of SLC7A11, and this negative effect on SLC7A11 expression is rescued by further depletion of USP7, suggesting that the control of SLC7A11 expression by p53 is achieved through USP7 (Fig 6E), and a similar effect is also observed in most of the H2Bub1‐affected metal ion‐binding genes (Fig EV5D). Furthermore, our ChIP analysis demonstrated that p53 overexpression reduces the occupancy of H2Bub1 on the SLC7A11 gene regulatory region, and this downregulation is also rescued by depletion of USP7 (Fig 6F). Moreover, we also examined the GSH levels to indicate the activities of SLC7A11. In accordance with the expression changes in SLC7A11, our data suggested that p53 overexpression decreased the intracellular GSH levels, and this decrease is also rescued by further depletion of USP7 (Fig EV5E). As erastin promotes the nuclear translocation of USP7, we examined whether p53 and USP7 are recruited to the SLC7A11 gene regulatory region. As expected, erastin treatment strikingly increased the occupancy levels of both p53 and USP7 on the SLC7A11 gene regulatory region (Fig 6G). In addition, the erastin‐induced loss of H2Bub1 occupancy on the SLC7A11 gene regulatory region is significantly rescued by depletion of both p53 and USP7 (Fig 6H). Together, these data support the notion that the p53‐USP7‐H2Bub1 axis regulates SLC7A11 expression and activity during ferroptosis induction by erastin treatment (Fig 6I).
The p53‐USP7‐H2Bub1 axis sensitizes cells to erastin‐induced ferroptosis
Then, we tested the role of the p53‐USP7‐H2Bub1 axis in the regulation of ferroptosis. p53 overexpression results in infrequent cell death even in cells without erastin treatment (Fig 7A). This result is reasonable, as p53 is critical in the regulation of apoptosis, and overexpression of p53 usually leads to activation of apoptosis 63, 64. Our transmission electron microscopy assay also supports this opinion, as p53 overexpression results in chromatin condensation and margination, a typical feature of apoptosis (Fig 7B). However, after erastin treatment, p53‐overexpressing cells showed the highest amount of cell death with characteristic features of ferroptosis, smaller mitochondria size, and increased membrane density (Fig 7A and B), suggesting that ferroptosis occurred. Moreover, the obvious ferroptosis detected in p53‐overexpressing cells was significantly rescued by USP7 depletion (Fig 7A). In addition, the abnormal mitochondrial morphology observed in erastin‐treated p53‐overexpressing cells also recovered upon USP7 depletion, even in cells treated with erastin (Fig 7B). We also examined the changes in lipid ROS levels in cells treated as above. We found that p53 overexpression strikingly increased lipid ROS levels after erastin treatment, and this p53‐induced lipid ROS upregulation was almost completely blocked by USP7 knockdown (Fig 7C), which is similar to its effect on ferroptosis (Fig 7A and B).
Figure 7. Effects of the p53‐USP7‐H2Bub1 axis on ferroptosis.
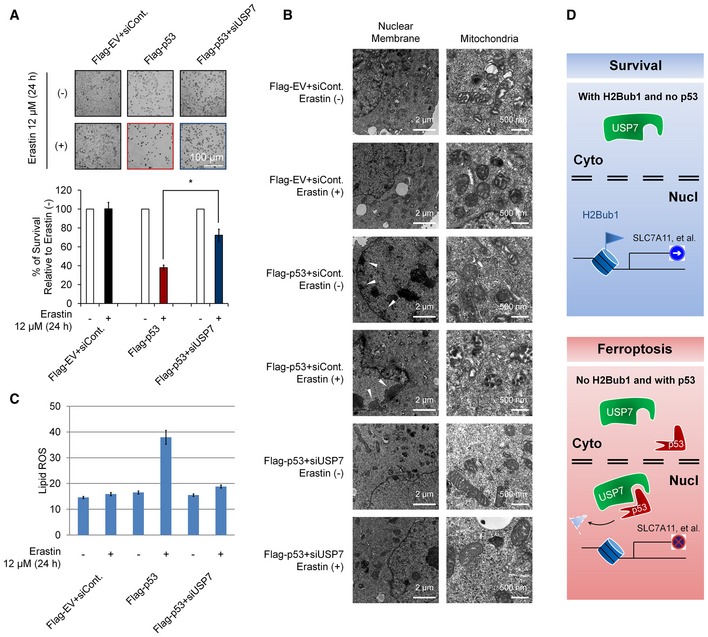
- H1299 cells transfected with a Flag‐tagged p53 or an empty plasmid together with a USP7‐specific siRNA or a control siRNA (siCont.) as were treated with 12 μM erastin (+) or untreated (−) for 24 h as indicated. Representative phase‐contrast images were recorded (magnification, ×20), and the surviving cells were counted.
- H1299 cells treated as in (A) were subjected to transmission electron microscopy. Representative images are shown. Arrowhead indicates condensed and marginated chromatin.
- Lipid ROS levels were examined in cells treated as in (A and B).
- Working model. Normal cells or cells without p53 show relatively low levels of nuclear USP7. H2Bub1 is maintained at relatively high levels and is required for normal SLC7A11 expression. However, when cells are subjected to ferroptotic stress (e.g., erastin treatment), increasing amounts of p53 interact with USP7 and promote the nuclear translocation of USP7. The translocated USP7 further removes H2Bub1 from the SLC7A11 gene regulatory region and inactivates SCL7A11 expression. Eventually, ferroptosis occurs.
Collectively, this study provides a novel epigenetic mechanism in the regulation of ferroptosis by histone modification H2Bub1. SLC7A11, the key regulator of ferroptosis, is a downstream target of H2Bub1. Loss of H2Bub1 results in the inactivation of SLC7A11 expression and further leads to ferroptosis. In addition, p53 is identified as a negative regulator of H2Bub1 by interacting and promoting the nuclear translocation of USP7, a reported H2Bub1 deubiquitinase. Moreover, this p53‐USP7‐H2Bub1‐SLC7A11 regulatory axis can be stimulated by erastin and sensitizes cells to erastin‐induced ferroptosis (Fig 7D).
Discussion
Ferroptosis is a new form of non‐apoptotic cell death identified recently 4, 5, 6, 7. An increasing number of studies have suggested that ferroptosis is critical for several physiological or pathological processes, including excitotoxic neurotrauma diseases and cancer 4, 13. Although it has been reported that the induction of ferroptosis is tightly related to cellular redox status, especially the lipid ROS levels in an iron‐dependent manner 4, 5, 6, 7, whether nuclear events are involved in the regulation of ferroptosis remains poorly understood.
Here, our study reveals an important epigenetic mechanism linking p53 to SLC7A11 expression and ferroptosis. Specifically, we demonstrate a model in which the epigenetic marker H2Bub1 is required for SLC7A11 expression and inhibits ferroptosis under normal conditions, while p53 suppresses the levels of H2Bub1 by promoting the nuclear translocation of deubiquitinase USP7, further contributing to the inactivation of SLC7A11 expression. Erastin stimulates the interaction between p53 and USP7, further leading to the erasure of H2Bub1 and repression of SLC7A11 expression, eventually sensitizing cells to erastin‐induced ferroptosis.
A recent report has described that p53 positively regulates ferroptosis primarily by transcriptionally suppressing the expression of SLC7A11. p53 binds to the promoter region of SLC7A11 13. However, it is well known that p53 is a transcription factor and usually functions as an activator of gene transcription. How p53 inhibits the expression of SLC7A11 is unclear. This study provides a possible explanation for this phenomenon. p53 likely inactivates SLC7A11 expression by downregulating H2Bub1 levels in the SLC7A11 gene regulatory region. Therefore, H2Bub1 functions as a critical adaptor that mediates p53‐regulated ferroptosis.
USP7 (HAUSP) has been described as a deubiquitinase for both p53 and H2Bub1 22, 23, 24, 25, 56, 57. However, deletion of USP7 in cells does not result in a decrease in p53 protein levels as predicted 58, apparently because of USP7's ability to bind and deubiquitinate MDM2 58, 59. Thus, the molecular regulation of the p53‐USP7 interaction is rather complicated. However, by contrast, whether p53 regulates USP7 is completely undetermined. Our results provide a previously unknown molecular regulatory mechanism for the p53‐USP7 interaction in which p53 is essential for the nuclear localization of USP7, as we found that overexpression of p53 promotes USP7 nuclear translocation in H1299 cells, and depletion of p53 in A549 cells results in an obvious cytoplasmic localization of USP7 (Fig 4C and D). As mentioned above, p53 is involved in the regulation of ferroptosis by transcriptionally repressing the expression of SLC7A11 13. Here, our data indicated that ferroptosis inducer, erastin, promotes the interaction between p53 and USP7, and further results in an elevated nuclear translocation of USP7 (Figs 6B and C, and EV5A and B), suggesting that p53‐USP7 axis responses to erastin stimulation.
Recently, a study demonstrated that the “gain‐of‐function” p53 mutants, but not the wild‐type p53, regulate histone methylation and acetylation by controlling the transcription of several methyltransferases and acetyltransferase 43. Our study further expands the idea that p53 is a critical chromatin regulator. We found that, unlike the regulation of histone methylation and acetylation, both wild‐type p53 and the “gain‐of‐function” mutants regulate H2Bub1 levels (Figs 3I and EV3I). Further studies indicate that the regulation of H2Bub1 by p53 occurs through controlling the nuclear translocation of H2Bub1 deubiquitinase USP7. In addition, our results also show that p53 associates with H2Bub1 in human cells, and overexpression of p53 promotes the binding of USP7 to H2Bub1 (Fig 5), providing a possibility that p53 may direct USP7 to recognize H2Bub1. Therefore, compared with the regulation of histone methylation and acetylation, our results likely indicate a more direct role of p53 in the control of chromatin.
Collectively, our study provides a novel epigenetic mechanism for the regulation of ferroptosis that involves the p53‐USP7‐H2Bub1‐SLC7A11 axis.
Materials and Methods
Cell culture and transfection
All H1299 and A549 human lung cancer cells, HEK293T human embryonic kidney cells, and Hep3B and SMMC‐7721 human hepatoma cells were cultured at 37°C in DMEM (Gibco, #11960‐044) supplemented with 10% fetal bovine serum (Gibco, #10099141) and 1% penicillin and streptomycin (Gibco, #15070‐063) in a 5% CO2 incubator. The transfection of the constructs into the cells was performed using Lipofectamine 2000 (Invitrogen, #11668‐019) according to the manufacturer's standard protocol.
RNAi knockdown in cultured human cell lines
The siRNAs against RNF20 (5′‐GCGGCACAAUCACUAUCAATT‐3′ and 5′‐UUGAUAGUGAUUGUGCCGCTT‐3′), USP7 (#2033: 5′‐GAUGGGAUUUCCACAAGAUTT‐3′ and 5′‐AUCUUGUGGAAAUCCCAUGTT‐3′, #3395: 5′‐GCCCGGUAAUAUGUCUCAUTT‐3′ and 5′‐AUGAGACAUAUUACCGGGCTT‐3′) were designed and synthesized by the GenePharma Company (Shanghai, China).The shRNA against USP7 was a kind gift from Dr. Yan Zhang from the Institut Pasteur of Shanghai, Chinese Academy of Sciences. The siRNA and shRNA against p53 were purchased from Santa Cruz Biotechnology (#sc‐29435 and sc‐29435‐V). The shRNA or siRNA was transfected into the cultured cells using Lipofectamine 2000 (Invitrogen, #11668‐019), or cells were infected according to the manufacturer's protocol.
Coimmunoprecipitation (Co‐IP)
Cells were transfected with the indicated constructs using Lipofectamine 2000 (Invitrogen, #11668‐019). After 48 h, the cells were harvested, washed with ice‐cold PBS three times, resuspended in ATM lysis buffer (containing 100 mM Tris‐Cl, pH 7.5; 150 mM NaCl; 0.2 mM EDTA; 20% glycerol; 0.4% NP‐40, 2% Tween‐20; and 0.2 mM PMSF), and sonicated on ice 10 times (3 s each), with 20% efficiency. Cell lysates were incubated with normal IgG (Santa Cruz Biotechnology, #sc‐2025) as a negative control or the indicated antibodies for immunoprecipitation at 4°C overnight. Protein A/G agarose beads (Santa Cruz Biotechnology, #sc‐2003) were subsequently added and incubated for another 3 h. The solution was centrifuged to harvest the agarose beads after they were washed five times with lysis buffer. The precipitated proteins were released by boiling in loading buffer and resolved via SDS–PAGE. Western blot analyses were performed using related antibodies.
Peptide pull‐down assay
Peptide pull‐down assay was performed according to a previous report 65.
Antibodies and Western blot analysis
The anti‐H2Bub1 antibody was purchased from Medimabs (#MM‐0029) and Cell Signaling Technology (#5546). The antibodies against RNF20 (#11974), RNF40 (#12187), RAD6 (#4944), and H2B (#2934) were purchased from Cell Signaling Technology. The antibodies against Flag (#M20008), GFP (#M20004), and actin (#M20011) were purchased from Abmart (Shanghai, China). The anti‐p53 antibody was purchased from Santa Cruz Biotechnology (#sc‐126 and #sc‐126X) and Cell Signaling Technology (#2527). Antibodies against USP7 (GTX631108), USP12 (GTX115609), USP22 (GTX120048), USP44 (GTX87933), USP46 (GTX117994), and USP49 (GTX49374) were all purchased from GeneTex (Texas, USA). The antibodies against H3K4me3 (#9751), H3K79me3 (#74073), H3K9me3 (#13969), H3K27me3 (#9733), H3K36me3 (#9763), H4K8ac (#2594), H4K20me3 (#5737), H3 (#14269), and H4 (#2592) were purchased from Cell Signaling Technology. The anti‐H3K56me1 antibody was purchased from Active Motif (#39273). The anti‐SLC7A11 antibody was purchased from Abclonal (#A13685).
Cells were lysed in ATM lysis buffer (containing 100 mM Tris‐Cl, pH 7.5; 150 mM NaCl; 0.2 mM EDTA; 20% glycerol; 0.4% NP‐40; 2% Tween‐20; and 0.2 mM PMSF). The protein concentration in the supernatant was measured using a BCA Assay Kit (Novagen, #71285‐3). Next, samples were loaded into a 10% or 15% gel to resolve proteins. Different amounts of total protein were loaded in each experiment to facilitate the detection of different target proteins. After electrophoresis, the proteins were transferred to PVDF membranes (Amersham, #10600021) and hybridized with primary antibodies at a dilution of 1:2,000. HRP‐labeled secondary antibodies (Zhongshan Golden Bridge, #ZDR‐5306 and #ZDR‐5307) were applied at a dilution of 1:4,000. An eECL Western blot kit (CWBIO, #CW0049) was used to detect the signals on the membranes.
RT–PCR assay
RT–PCR assay was performed according to our previous reports 30, 35, 44. Briefly, cells were lysed to isolate total RNA using TRIzol reagent (Invitrogen, #15596‐026) according to the manufacturer's instructions. Reverse transcription was performed using a Reverse Transcription Kit (Takara, #2641A). Briefly, total RNA (5 μg) was reverse transcribed to synthesize cDNA in a volume of 20 μl using M‐MLV reverse transcriptase. In each 25 μl PCR mixture, 1 μl of cDNA was used for real‐time PCR (qRT–PCR) or semi‐quantitative PCR analyses. Real‐time PCR was performed with SYBR Advantage qPCR Premix (Clontech, #639676) on an iQ5 Real‐Time PCR System (Bio‐Rad). Fold differences in gene expression levels were calculated and normalized against the internal control GAPDH. For semi‐quantitative PCR, PCR products were loaded onto a 2% agarose gel, stained with ethidium bromide, and imaged.
Chromatin immunoprecipitation (ChIP) assay
ChIP was performed according to the published protocols from Upstate and our previous studies 30, 35. The primers for SLC7A11 ChIP assay were 5′‐atggtcagaaagcctg‐3′ (forward) and 5′‐ggtgccaatcataatg‐3′ (reverse). Antibodies against H2Bub1 (Medimabs, #MM‐0029), Flag (Abmart, #M20008), and USP7 (GeneTex, #GTX631108) were used.
Subcellular fractionation
Cytoplasmic and nuclear proteins were extracted using a Nuclear and Cytoplasmic Protein Extraction Kit from Beyotime Biotechnology (#P0027, Jiangsu, China) according to the manufacturer's instructions.
Immunofluorescence (IF) analysis
IF analysis was performed as previously described 35. Briefly, cells grown on culture slides were blocked with 2% BSA in PBS and incubated with anti‐Flag antibody (1:500 dilution, Abmart), anti‐Myc antibody (1:500 dilution, Abmart), or anti‐H2Bub1 antibody (1:500 dilution, Cell Signaling Technology) for 2 h at room temperature. Cy3‐coupled or FITC‐coupled secondary antibodies (Invitrogen) were applied at a dilution of 1:500. The DNA‐staining marker DAPI was then used at a concentration of 1 μg/ml. The slides were visualized with a confocal laser scanning microscope (Leica DMI4000B).
Lipid ROS analysis
H1299 cells (6‐well dishes) were treated as indicated, and then, 50 μM C11‐BODIPY (#D3861, Thermo Fisher) was added and incubated at 37°C for 1 h. Excess C11‐BODIPY was removed by washing the cells twice with PBS. Cells were trypsinized and resuspended in PBS plus 5% FBS. Oxidation of the polyunsaturated butadienyl portion of C11‐BODIPY is proportional to lipid ROS generation and was analyzed using a flow cytometer.
Micrococcal nuclease digestion
Cells (60 mm dish) were treated as indicated and harvested by trypsinization, followed by permeabilization with 0.5% Triton X‐100 for 10 min. Cells were then spun at 6,000 × g for 3 min at 4°C to collect the nuclei. The nuclei were resuspended in 150 μl digestion buffer (50 mM Tris–HCl, pH 7.9; 5 mM CaCl2; 100 μg/ml bovine serum albumin; protease inhibitors) and aliquoted into three tubes. One tube was set aside as an undigested control by adding 0.5 M (1.5 μl) EDTA. Another two tubes received 0.2 μl micrococcal nuclease (#M0247S, NEB) and were incubated at 37°C for 4 min or 8 min, respectively. Then, 0.5 M EDTA (1.5 μl) was added to each tube to terminate the digestion. The DNA was isolated by the phenol–chloroform extraction method and subjected to 2% agarose gel electrophoresis.
Measurement of labile iron pool (LIP)
Cells (6‐well dishes) were trypsinized, washed twice with 0.5 ml PBS, and then incubated with 0.2 μM calcein‐AM (#HY‐D0041, MCE) at 37°C for 15 min. Then, the cells were washed twice with 0.5 ml PBS and either incubated with 100 μM deferiprone (#HY‐B0568, MCE) or left untreated at 37°C for 1 h. The cells were analyzed with a flow cytometer. Calcein was excited at 488 nm, and fluorescence was measured at 525 nm. The difference in the cellular mean fluorescence with and without deferiprone incubation reflects the amount of the LIP.
Transmission electron microscopy
The day before the experiment, cells were seeded into 60‐mm dishes. Cells were then transfected as indicated for 48 h. Cells were harvested by trypsinization and then washed twice with PBS. Transmission electron microscopy was performed using standard procedures by the Microscopy Core Facility at Xi'an Jiao Tong University. At least 20 images were acquired for each structure of interest, and representative images are shown.
Measurement of cell death with propidium iodide (PI) staining–flow cytometry analysis
Cell death analysis with PI staining was performed according to a previous report 66. Briefly, cells were seeded into a 6‐well plate for different treatment. Cells were then harvested and subjected to PI staining coupled with flow cytometry analysis. In brief, cells were collected in a 1.5‐ml tube, washed once with PBS, and stained with PI (Solarbio, #C0080) at a concentration of 2 μg/ml in PBS. Dead cells (PI positive) were analyzed using a BD Accuri C6 flow cytometer (BD Biosciences).
Measurement of the intracellular GSH levels
GSH levels were detected using a GSH‐Glo Glutathione Assay Kit (Promega, #V6911) following the manufacturer's instructions and a previous report 66.
Author contributions
SC designed the study; YW, LY, XZ, WC, YL, Q‐RS, QH, SZ, G‐AZ, and YW performed the experiments; SC, YW, and LY analyzed the data; SC wrote the manuscript.
Conflict of interest
The authors declare that they have no conflict of interest.
Supporting information
Expanded View Figures PDF
Source Data for Expanded View
Review Process File
Source Data for Figure 4
Source Data for Figure 6
Acknowledgements
We thank Dr. Yan Zhang from the Institut Pasteur of Shanghai, Chinese Academy of Sciences, for kindly providing the USP7‐related plasmids, and Dr. Zhi‐Xiong Xiao from Sichuan University for kindly providing the “gain‐of‐function” mutants of p53. This work was supported by the National Natural Science Foundation of China (Grant No. 81773009), the Fundamental Research Funds for the Central Universities (Xi'an Jiao Tong University, Grant No. 2017qngz13), and the China Postdoctoral Science Foundation (Grant Nos. 2017M613149 and 2018T111038).
EMBO Reports (2019) 20: e47563
Contributor Information
Wen Cui, Email: cuiwenmd@163.com.
Su Chen, Email: chensu@xjtu.edu.cn.
References
- 1. Thompson CB (1995) Apoptosis in the pathogenesis and treatment of disease. Science 267: 1456–1462 [DOI] [PubMed] [Google Scholar]
- 2. Choi DW (1988) Glutamate neurotoxicity and diseases of the nervous system. Neuron 1: 623–634 [DOI] [PubMed] [Google Scholar]
- 3. Fuchs Y, Steller H (2011) Programmed cell death in animal development and disease. Cell 147: 742–758 [DOI] [PMC free article] [PubMed] [Google Scholar]
- 4. Dixon SJ, Lemberg KM, Lamprecht MR, Skouta R, Zaitsev EM, Gleason CE, Patel DN, Bauer AJ, Cantley AM, Yang WS et al (2012) Ferroptosis: an iron‐dependent form of nonapoptotic cell death. Cell 149: 1060–1072 [DOI] [PMC free article] [PubMed] [Google Scholar]
- 5. Dixon SJ, Stockwell BR (2014) The role of iron and reactive oxygen species in cell death. Nat Chem Biol 10: 9–17 [DOI] [PubMed] [Google Scholar]
- 6. Yang WS, Stockwell BR (2016) Ferroptosis: death by lipid peroxidation. Trends Cell Biol 26: 165–176 [DOI] [PMC free article] [PubMed] [Google Scholar]
- 7. Stockwell BR, Friedmann Angeli JP, Bayir H, Bush AI, Conrad M, Dixon SJ, Fulda S, Gascón S, Hatzios SK, Kagan VE et al (2017) Ferroptosis: a regulated cell death nexus linking metabolism, redox biology, and disease. Cell 171: 273–285 [DOI] [PMC free article] [PubMed] [Google Scholar]
- 8. Lim JC, Donaldson PJ (2011) Focus on molecules: the cystine/glutamate exchanger (System x(c)(−)). Exp Eye Res 92: 162–163 [DOI] [PubMed] [Google Scholar]
- 9. Conrad M, Sato H (2012) The oxidative stress‐inducible cystine/glutamate antiporter, system x(c)(−): cystine supplier and beyond. Amino Acids 42: 231–246 [DOI] [PubMed] [Google Scholar]
- 10. Yang WS, SriRamaratnam R, Welsch ME, Shimada K, Skouta R, Viswanathan VS, Cheah JH, Clemons PA, Shamji AF, Clish CB et al (2014) Regulation of ferroptotic cancer cell death by GPX4. Cell 156: 317–331 [DOI] [PMC free article] [PubMed] [Google Scholar]
- 11. Sato H, Tamba M, Ishii T, Bannai S (1999) Cloning and expression of a plasma membrane cystine/glutamate exchange transporter composed of two distinct proteins. J Biol Chem 274: 11455–81145 [DOI] [PubMed] [Google Scholar]
- 12. Sato H, Tamba M, Kuriyama‐Matsumura K, Okuno S, Bannai S (2000) Molecular cloning and expression of human xCT, the light chain of amino acid transport system xc − . Antioxid Redox Signal 2: 665–671 [DOI] [PubMed] [Google Scholar]
- 13. Jiang L, Kon N, Li T, Wang SJ, Su T, Hibshoosh H, Baer R, Gu W (2015) Ferroptosis as a p53‐mediated activity during tumour suppression. Nature 520: 57–62 [DOI] [PMC free article] [PubMed] [Google Scholar]
- 14. West MH, Bonner WM (1980) Histone 2B can be modified by the attachment of ubiquitin. Nucleic Acids Res 8: 4671–4680 [DOI] [PMC free article] [PubMed] [Google Scholar]
- 15. Xiao T, Kao CF, Krogan NJ, Sun ZW, Greenblatt JF, Osley MA, Strahl BD (2005) Histone H2B ubiquitylation is associated with elongating RNA polymerase II. Mol Cell Biol 25: 637–651 [DOI] [PMC free article] [PubMed] [Google Scholar]
- 16. Minsky N, Shema E, Field Y, Schuster M, Segal E, Oren M (2008) Monoubiquitinated H2B is associated with the transcribed region of highly expressed genes in human cells. Nat Cell Biol 10: 483–488 [DOI] [PubMed] [Google Scholar]
- 17. Fierz B, Chatterjee C, McGinty RK, Bar‐Dagan M, Raleigh DP, Muir TW (2011) Histone H2B ubiquitylation disrupts local and higher‐order chromatin compaction. Nat Chem Biol 7: 113–119 [DOI] [PMC free article] [PubMed] [Google Scholar]
- 18. Robzyk K, Recht J, Osley MA (2000) Rad6‐dependent ubiquitination of histone H2B in yeast. Science 287: 501–504 [DOI] [PubMed] [Google Scholar]
- 19. Hwang WW, Venkatasubrahmanyam S, Ianculescu AG, Tong A, Boone C, Madhani HD (2003) A conserved RING finger protein required for histone H2B monoubiquitination and cell size control. Mol Cell 11: 261–266 [DOI] [PubMed] [Google Scholar]
- 20. Kim J, Hake SB, Roeder RG (2005) The human homolog of yeast BRE1 functions as a transcriptional coactivator through direct activator interactions. Mol Cell 20: 759–770 [DOI] [PubMed] [Google Scholar]
- 21. Kim J, Guermah M, McGinty RK, Lee JS, Tang Z, Milne TA, Shilatifard A, Muir TW, Roeder RG (2009) RAD6‐Mediated transcription‐coupled H2B ubiquitylation directly stimulates H3K4 methylation in human cells. Cell 137: 459–471 [DOI] [PMC free article] [PubMed] [Google Scholar]
- 22. van der Knaap JA, Kumar BR, Moshkin YM, Langenberg K, Krijgsveld J, Heck AJ, Karch F, Verrijzer CP (2005) GMP synthetase stimulates histone H2B deubiquitylation by the epigenetic silencer USP7. Mol Cell 17: 695–707 [DOI] [PubMed] [Google Scholar]
- 23. Sarkari F, Sanchez‐Alcaraz T, Wang S, Holowaty MN, Sheng Y, Frappier L (2009) EBNA1‐mediated recruitment of a histone H2B deubiquitylating complex to the Epstein‐Barr virus latent origin of DNA replication. PLoS Pathog 5: e1000624 [DOI] [PMC free article] [PubMed] [Google Scholar]
- 24. van der Knaap JA, Kozhevnikova E, Langenberg K, Moshkin YM, Verrijzer CP (2010) Biosynthetic enzyme GMP synthetase cooperates with ubiquitin‐specific protease 7 in transcriptional regulation of ecdysteroid target genes. Mol Cell Biol 30: 736–744 [DOI] [PMC free article] [PubMed] [Google Scholar]
- 25. Liefke R, Karwacki‐Neisius V, Shi Y (2016) EPOP interacts with elongin BC and USP7 to modulate the chromatin landscape. Mol Cell 64: 659–672 [DOI] [PMC free article] [PubMed] [Google Scholar]
- 26. Joo HY, Jones A, Yang C, Zhai L, Smith AD IV, Zhang Z, Chandrasekharan MB, Sun ZW, Renfrow MB, Wang Y et al (2011) Regulation of histone H2A and H2B deubiquitination and Xenopus development by USP12 and USP46. J Biol Chem 286: 7190–7201 [DOI] [PMC free article] [PubMed] [Google Scholar]
- 27. Zhao Y, Lang G, Ito S, Bonnet J, Metzger E, Sawatsubashi S, Suzuki E, Le Guezennec X, Stunnenberg HG, Krasnov A et al (2008) A TFTC/STAGA module mediates histone H2A and H2B deubiquitination, coactivates nuclear receptors, and counteracts heterochromatin silencing. Mol Cell 29: 92–101 [DOI] [PubMed] [Google Scholar]
- 28. Fuchs G, Shema E, Vesterman R, Kotler E, Wolchinsky Z, Wilder S, Golomb L, Pribluda A, Zhang F, Haj‐Yahya M et al (2012) RNF20 and USP44 regulate stem cell differentiation by modulating H2B monoubiquitylation. Mol Cell 46: 662–673 [DOI] [PMC free article] [PubMed] [Google Scholar]
- 29. Zhang Z, Jones A, Joo HY, Zhou D, Cao Y, Chen S, Erdjument‐Bromage H, Renfrow M, He H, Tempst P et al (2013) USP49 deubiquitinates histone H2B and regulates cotranscriptional pre‐mRNA splicing. Genes Dev 27: 1581–1595 [DOI] [PMC free article] [PubMed] [Google Scholar]
- 30. Chen S, Li J, Wang DL, Sun FL (2012) Histone H2B lysine 120 monoubiquitination is required for embryonic stem cell differentiation. Cell Res 22: 1402–1405 [DOI] [PMC free article] [PubMed] [Google Scholar]
- 31. Karpiuk O, Najafova Z, Kramer F, Hennion M, Galonska C, König A, Snaidero N, Vogel T, Shchebet A, Begus‐Nahrmann Y et al (2012) The histone H2B monoubiquitination regulatory pathway is required for differentiation of multipotent stem cells. Mol Cell 46: 705–713 [DOI] [PubMed] [Google Scholar]
- 32. Prenzel T, Begus‐Nahrmann Y, Kramer F, Hennion M, Hsu C, Gorsler T, Hintermair C, Eick D, Kremmer E, Simons M et al (2011) Estrogen‐dependent gene transcription in human breast cancer cells relies upon proteasome‐dependent monoubiquitination of histone H2B. Cancer Res 71: 5739–5753 [DOI] [PubMed] [Google Scholar]
- 33. Zhang K, Wang J, Tong TR, Wu X, Nelson R, Yuan YC, Reno T, Liu Z, Yun X, Kim JY et al (2017) Loss of H2B monoubiquitination is associated with poor‐differentiation and enhanced malignancy of lung adenocarcinoma. Int J Cancer 141: 766–777 [DOI] [PMC free article] [PubMed] [Google Scholar]
- 34. Yao X, Tang Z, Fu X, Yin J, Liang Y, Li C, Li H, Tian Q, Roeder RG, Wang G (2015) The mediator subunit MED23 couples H2B mono‐ubiquitination to transcriptional control and cell fate determination. EMBO J 34: 2885–2902 [DOI] [PMC free article] [PubMed] [Google Scholar]
- 35. Chen S, Jing Y, Kang X, Yang L, Wang DL, Zhang W, Zhang L, Chen P, Chang JF, Yang XM et al (2017) Histone H2B monoubiquitination is a critical epigenetic switch for the regulation of autophagy. Nucleic Acids Res 45: 1144–1158 [DOI] [PMC free article] [PubMed] [Google Scholar]
- 36. Baek SH, Kim KI (2017) Epigenetic control of autophagy: nuclear events gain more attention. Mol Cell 65: 781–785 [DOI] [PubMed] [Google Scholar]
- 37. Finlay CA, Hinds PW, Levine AJ (1989) The p53 proto‐oncogene can act as a suppressor of transformation. Cell 57: 1083–1093 [DOI] [PubMed] [Google Scholar]
- 38. Kastan MB, Radin AI, Kuerbitz SJ, Onyekwere O, Wolkow CA, Civin CI, Stone KD, Woo T, Ravindranath Y, Craig RW (1991) Levels of p53 protein increase with maturation in human hematopoietic cells. Cancer Res 51: 4279–4286 [PubMed] [Google Scholar]
- 39. Vousden KH, Lu X (2002) Live or let die: the cell's response to p53. Nat Rev Cancer 2: 594–604 [DOI] [PubMed] [Google Scholar]
- 40. Bargonetti J, Friedman PN, Kern SE, Vogelstein B, Prives C (1991) Wild‐type but not mutant p53 immunopurified proteins bind to sequences adjacent to the SV40 origin of replication. Cell 65: 1083–1091 [DOI] [PubMed] [Google Scholar]
- 41. Kern SE, Kinzler KW, Bruskin A, Jarosz D, Friedman P, Prives C, Vogelstein B (1991) Identification of p53 as a sequence‐specific DNA‐binding protein. Science 252: 1708–1711 [DOI] [PubMed] [Google Scholar]
- 42. Kruse JP, Gu W (2009) Modes of p53 regulation. Cell 137: 609–622 [DOI] [PMC free article] [PubMed] [Google Scholar]
- 43. Zhu J, Sammons MA, Donahue G, Dou Z, Vedadi M, Getlik M, Barsyte‐Lovejoy D, Al‐awar R, Katona BW, Shilatifard A et al (2015) Gain‐of‐function p53 mutants co‐opt chromatin pathways to drive cancer growth. Nature 525: 206–211 [DOI] [PMC free article] [PubMed] [Google Scholar]
- 44. Wu Y, Chen P, Jing Y, Wang C, Men YL, Zhan W, Wang Q, Gan Z, Huang J, Xie K et al (2015) Microarray analysis reveals potential biological functions of histone H2B monoubiquitination. PLoS One 10: e0133444 [DOI] [PMC free article] [PubMed] [Google Scholar]
- 45. Moyal L, Lerenthal Y, Gana‐Weisz M, Mass G, So S, Wang SY, Eppink B, Chung YM, Shalev G, Shema E et al (2011) Requirement of ATM‐dependent monoubiquitylation of histone H2B for timely repair of DNA double‐strand breaks. Mol Cell 41: 529–542 [DOI] [PMC free article] [PubMed] [Google Scholar]
- 46. Dover J, Schneider J, Tawiah‐Boateng MA, Wood A, Dean K, Johnston M, Shilatifard A (2002) Methylation of histone H3 by COMPASS requires ubiquitination of histone H2B by Rad6. J Biol Chem 277: 28368–28371 [DOI] [PubMed] [Google Scholar]
- 47. Ng HH, Xu RM, Zhang Y, Struhl K (2002) Ubiquitination of histone H2B by Rad6 is required for efficient Dot1‐mediated methylation of histone H3 lysine 79. J Biol Chem 277: 34655–34657 [DOI] [PubMed] [Google Scholar]
- 48. Sun ZW, Allis CD (2002) Ubiquitination of histone H2B regulates H3 methylation and gene silencing in yeast. Nature 418: 104–108 [DOI] [PubMed] [Google Scholar]
- 49. Hahn MA, Dickson KA, Jackson S, Clarkson A, Gill AJ, Marsh DJ (2012) The tumor suppressor CDC73 interacts with the ring finger proteins RNF20 and RNF40 and is required for the maintenance of histone 2B monoubiquitination. Hum Mol Genet 21: 559–568 [DOI] [PubMed] [Google Scholar]
- 50. Vethantham V, Yang Y, Bowman C, Asp P, Lee JH, Skalnik DG, Dynlacht BD (2012) Dynamic loss of H2B ubiquitylation without corresponding changes in H3K4 trimethylation during myogenic differentiation. Mol Cell Biol 32: 1044–1055 [DOI] [PMC free article] [PubMed] [Google Scholar]
- 51. Herzog CE, Zwelling LA, McWatters A, Kleinerman ES (1995) Expression of topoisomerase II, bcl‐2, and p53 in three human brain tumor cell lines and their possible relationship to intrinsic resistance to etoposide. Clin Cancer Res 1: 1391–1397 [PubMed] [Google Scholar]
- 52. Chresta CM, Masters JR, Hickman JA (1996) Hypersensitivity of human testicular tumors to etoposide‐induced apoptosis is associated with functional p53 and a high Bax:Bcl‐2 ratio. Cancer Res 56: 1834–1841 [PubMed] [Google Scholar]
- 53. Blank M, Tang Y, Yamashita M, Burkett SS, Cheng SY, Zhang YE (2012) A tumor suppressor function of Smurf2 associated with controlling chromatin landscape and genome stability through RNF20. Nat Med 18: 227–234 [DOI] [PMC free article] [PubMed] [Google Scholar]
- 54. Muller PA, Vousden KH (2014) Mutant p53 in cancer: new functions and therapeutic opportunities. Cancer Cell 25: 304–317 [DOI] [PMC free article] [PubMed] [Google Scholar]
- 55. Lv T, Wu X, Sun L, Hu Q, Wan Y, Wang L, Zhao Z, Tu X, Xiao ZJ (2017) p53‐R273H upregulates neuropilin‐2 to promote cell mobility and tumor metastasis. Cell Death Dis 8: e2995 [DOI] [PMC free article] [PubMed] [Google Scholar]
- 56. Li M, Chen D, Shiloh A, Luo J, Nikolaev AY, Qin J, Gu W (2002) Deubiquitination of p53 by HAUSP is an important pathway for p53 stabilization. Nature 416: 648–653 [DOI] [PubMed] [Google Scholar]
- 57. Hu M, Li P, Li M, Li W, Yao T, Wu JW, Gu W, Cohen RE, Shi Y (2002) Crystal structure of a UBP‐family deubiquitinating enzyme in isolation and in complex with ubiquitin aldehyde. Cell 111: 1041–1054 [DOI] [PubMed] [Google Scholar]
- 58. Cummins JM, Vogelstein B (2004) HAUSP is required for p53 destabilization. Cell Cycle 3: 689–692 [PubMed] [Google Scholar]
- 59. Li M, Brooks CL, Kon N, Gu W (2004) A dynamic role of HAUSP in the p53‐Mdm2 pathway. Mol Cell 13: 879–886 [DOI] [PubMed] [Google Scholar]
- 60. Hu M, Gu L, Li M, Jeffrey PD, Gu W, Shi Y (2006) Structural basis of competitive recognition of p53 and MDM2 by HAUSP/USP7: implications for the regulation of the p53‐MDM2 pathway. PLoS Biol 4: e27 [DOI] [PMC free article] [PubMed] [Google Scholar]
- 61. Sheng Y, Saridakis V, Sarkari F, Duan S, Wu T, Arrowsmith CH, Frappier L (2006) Molecular recognition of p53 and MDM2 by USP7/HAUSP. Nat Struct Mol Biol 13: 285–291 [DOI] [PubMed] [Google Scholar]
- 62. Chauhan D, Tian Z, Nicholson B, Kumar KG, Zhou B, Carrasco R, McDermott JL, Leach CA, Fulcinniti M, Kodrasov MP et al (2012) A small molecule inhibitor of ubiquitin‐specific protease‐7 induces apoptosis in multiple myeloma cells and overcomes bortezomib resistance. Cancer Cell 22: 345–358 [DOI] [PMC free article] [PubMed] [Google Scholar]
- 63. Yonish‐Rouach E, Resnitzky D, Lotem J, Sachs L, Kimchi A, Oren M (1991) Wild‐type p53 induces apoptosis of myeloid leukaemic cells that is inhibited by interleukin‐6. Nature 352: 345–347 [DOI] [PubMed] [Google Scholar]
- 64. Shaw P, Bovey R, Tardy S, Sahli R, Sordat B, Costa J (1992) Induction of apoptosis by wild‐type p53 in a human colon tumor‐derived cell line. Proc Natl Acad Sci USA 89: 4495–4499 [DOI] [PMC free article] [PubMed] [Google Scholar]
- 65. Karagianni P, Amazit L, Qin J, Wong J (2008) ICBP90, a novel methyl K9 H3 binding protein linking protein ubiquitination with heterochromatin formation. Mol Cell Biol 28: 705–717 [DOI] [PMC free article] [PubMed] [Google Scholar]
- 66. Zhang Y, Shi J, Liu X, Feng L, Gong Z, Koppula P, Sirohi K, Li X, Wei Y, Lee H et al (2018) BAP1 links metabolic regulation of ferroptosis to tumour suppression. Nat Cell Biol 20: 1181–1192 [DOI] [PMC free article] [PubMed] [Google Scholar]
Associated Data
This section collects any data citations, data availability statements, or supplementary materials included in this article.
Supplementary Materials
Expanded View Figures PDF
Source Data for Expanded View
Review Process File
Source Data for Figure 4
Source Data for Figure 6


