

Abstract
Background:
Health literacy (HL) is defined as the ability to process health-related information to make decisions to maintain health and improve quality of life. A growing number of studies demonstrate that people with lower HL are less likely to use preventive services but more likely to use curative, emergency, or hospital care.
Objective:
This study investigated the relationship between HL and the use of different types of health services in a sample of the general German population, as we expected that the effect of HL on the frequency of use differs by type of health service.
Methods:
A nationally representative sample of 2,000 people in Germany was interviewed in person in 2014. Analyses of the data included frequencies of contacts with doctors, other health professionals, hospitals, and emergency services. Analysis also included a HL measure (European Health Literacy Survey Questionnaire), as well as sociodemographic and health status indicators. To test whether and how HL is related to the frequency of use of the different types of curative health services, regression analyses were performed.
Key Results:
Respondents with lower HL scores reported more frequent use of all four included types of curative health services. Although multiple regression analysis showed a direct significant effect of HL only on doctor (β = −.066) and other health professionals visits (β = −.103), no significant direct effect of HL on hospital and emergency services use was found when sociodemographic and health-related factors were controlled for.
Conclusions:
Health professionals should be aware that their patients are likely to have difficulties in understanding and processing health-related information. Interventions to strengthen HL should aim at improving health care literacy and, moreover, not only address individuals but also consider demands related to the health care system and health professionals' communication skills.
Plain Language Summary:
This study investigates the relationship between health literacy and health service use in Germany. The results show that health services are used more often by individuals with low health literacy. Thus, health professionals need to take low health literacy into account in their communication with patients. [HLRP: Health Literacy Research and Practice. 2018;2(2):e115–e122.]
Health literacy (HL) as a multidimensional concept is defined as the knowledge, motivation and competences to access, understand, appraise, and apply health information to make judgements and take decisions in everyday life related to health care, disease prevention, and health promotion to maintain or improve quality of life during the life course (Sørensen et al., 2012).
Prevalence of Limited Health Literacy
Previous studies show that insufficient HL is a problem in one-third to two-thirds of the general population in developed nations (Kutner, Greenberg, Jin, & Paulsen, 2006; Pelikan, Rothlin, & Ganahl, 2012; Rootman & Gordon-El-Bihbety, 2008). According to a study (European Health Literacy Survey [HLSEU]) (Pelikan et al., 2012; Sørensen et al., 2015) investigating HL in eight European member states, almost one-half of all EU citizens can be categorized as having limited (inadequate or problematic) HL (i.e., reports difficulties in accessing, understanding, appraising, and applying health information). A recent survey using the same methodology as the HLS-EU indicates that more than one-half of the German population reports difficulties in dealing with health-relevant tasks (Schaeffer, Berens, & Vogt, 2017).
Limited HL follows a social gradient, as low educational attainment, low socioeconomic status, immigration, and increasing age are associated with limited HL in Europe (Protheroe et al., 2017; Sørensen et al., 2015), in the United States (Ayotte, Allaire, & Bosworth, 2009; Baker et al., 2002) and in Germany (Berens, Vogt, Messer, Hurrelmann, & Schaeffer, 2016; Schaeffer et al., 2017, Vogt, Schaeffer, Messer, Berens, & Hurrelmann, 2017).
Health Literacy and Health Outcomes
Patient studies in the U.S. indicate that HL is related to health service use, health status indicators, and health behavior. People with lower functional HL are less likely to use preventive services and more likely to use and repeatedly use emergency or hospital care (Berkman, Sheridan, Donahue, Halpern, & Crotty, 2011; Cartwright, Dumenci, Cassel, Thomson, & Matsuyama, 2017; Griffey, Kennedy, D'Agostino McGowan, Goodman, & Kaphingst, 2014; Michtell, Sadikova, Jack, & Paasche-Orlow, 2012; Scott, Gazmararian, Williams, & Baker, 2002).
The limited available empirical evidence indicates that lower HL is also linked to increased health service use in Europe (Mantwill & Schulz, 2017; Palumbo, Annarumma, Adinolfi, Musella, & Piscopo, 2016; Pelikan et al., 2012; Sørensen et al., 2015; Vandenbosch et al., 2016). However, there are remarkable variations by type of health service and country (Sørensen et al., 2015). Results from the HLS-EU found the overall strongest correlation between HL and frequency of doctor visits; however, a direct effect could not be demonstrated in multivariate analysis (Pelikan et al., 2012). Furthermore, lower HL has been shown to be associated with increased use of hospital services in Austria, Bulgaria, Germany, and Poland (Pelikan et al., 2012), and of emergency services, doctor, and hospital services in Italy (Palumbo et al., 2016). In Belgium, a relationship was identified between lower HL and longer stays in general hospitals, as well as with more frequent use of day clinics, ambulance transportation, general practitioner home visits, and psychiatrist consultations (Vandenbosch et al., 2016).
This article explores the possible association between HL and the frequency of use of different types of health services in Germany.
Methods
Sampling, Data Collection, and Weighting
Data were used from the German Health Literacy Survey, which builds on the HLS-EU in terms of applied conceptual framework and methods (Pelikan et al., 2012; Schaeffer et al., 2017). A nationally representative sample of 2,000 respondents age 15 years or older was selected using a multistage sampling design (random route procedure). First, 258 selected sample points from a total of 53,000 across Germany were chosen, with each point containing about 700 households. Second, starting addresses were randomly chosen, and then every third household was selected via random-walk procedure excluding the starting address. Finally, the person with the most recent birthday was selected from each chosen household. Each household was contacted up to 4 times. Contact attempts were made on various days of the week and at different times of day.
Data were collected via computer-assisted personal interviews and a standardized, German language questionnaire in July and August 2014 by the polling agency Ipsos (Paris, France). The mean interview duration was 53 minutes. All interviewers were experienced and specifically trained in applying the questionnaire and conducting the face-to-face interviews.
To increase representativeness for age, gender, and regional variations and control for selection bias, the data were weighted using iterative proportional fitting based on the German Microcensus 2012.
Measures
Health literacy. HL was measured via the German version of the HLS-EU-Q47, a self-assessment instrument for measuring HL in a general population, which was originally developed for the HLS-EU (Sørensen et al., 2013). The original questionnaire was prepared in English and translated by two independent professional translators into German. Furthermore, a panel with the German-speaking research team of the HLS-EU, the HLS-EU Survey Coordinator, the translators, and other relevant health professionals verified the translation (Sørensen et al., 2013).
Respondents were asked to assess, on a scale ranging from very easy to very difficult, their perceived difficulties with tasks in regard to accessing, understanding, appraising, and applying health relevant information in the domains of health care, disease prevention, and health promotion. In total, the questionnaire is comprised of 47 items. The HL score was calculated for all respondents who answered at least 80% of the items. The index was standardized as recommended by the European Health Literacy Project using the formula in Figure 1.
Figure 1.
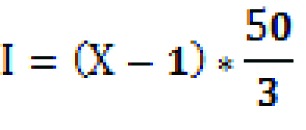
Formula used to standardize the health literacy index, as recommended by the European Health Literacy Project.
The index ranges from 0 to 50, with lower values indicating lower HL.
Health service use. Four different types of health services (doctors, hospital services, other health professionals, and emergency services) were assessed by single questions. Respondents were asked: “How many times have you been to the doctor/a patient to hospital/used services from other health professionals/used emergency services?” The type of doctor was not further specified, but it was explained that other health professionals include dentists, physiotherapists, psychologists, dieticians, or opticians. Emergency services were explained as including ambulance, after-hours clinics, and emergency departments. Occurrence of emergency service use was measured for the last 2 years and for doctors, hospital, and other health professionals for the last 12 months. Answers were categorized into the following groups: 0 times, 1 to 2 times, 3 to 5 times, and 6 times or more.
Sociodemographic indicators. Financial deprivation was calculated based on three items: First, the ability to afford to see a doctor (including transportation costs); second, the ability to pay for medication (both items measured as “It is…” very easy to very difficult on a 4-point Likert scale); and third, general problems when paying bills in the last 12 months (assessed via three possible answers: most of the time, from time to time, and almost never/never). The three items were combined based on the weighted sample using principal component analysis and regression factor scores, resulting in z-values with a mean of 0 and a standard deviation of 1. A positive factor score indicated higher self-reported financial deprivation than average, whereas a negative factor score indicated less than average financial deprivation (Pelikan et al., 2012). This allows for assessing financial deprivation compared to the average score among the study population.
Educational level was assessed using the International Standard Classification of Education (ISCED)-97 (Organisation for Economic Co-Operation and Development, 1999). ISCED-97 classifies seven levels of educational training, including professional training. A detailed description of the levels can be found elsewhere (Schneider & Kogan, 2008).
Migrant background was assessed by country of birth. Respondents born abroad (first generation) or with at least one parent born abroad (second generation) were characterized as having a migrant background, as in the German Microcensus (Statistisches Bundesamt, 2014). Respondents born in Germany, and whose parents were also born in Germany, were labelled as not having a migrant background.
Health status indicators. Health status was measured by two questions from the Minimum European Health Module (Cox et al., 2009; Eurostat, 2013): self-perceived health and presence of chronic illness. The first question of the module asks how the respondents rate their health in general, allowing them to answer on a 5-point Likert scale ranging from very good to very bad. The second question assesses the presence of long-standing health problems by asking the respondent if they have any chronic illness or health problem.
Ethics Approval And Consent
The study was approved by the Ethics Committee of Bielefeld University (reference number 066). The aim of the study, data collection, processing procedures, the possibility to refuse participation as well as the use of the data were explained prior to respondents giving informed consent to participate in the study. Adolescents age 15 years and older were able to give consent on their own (in accordance with established German case-law where the legal age is not relevant in the context of participation in research projects but rather is based on the adolescent's capacity of discernment).
Statistical Analyses
Data were analyzed using SPSS 23.0. Descriptive analyses were performed to characterize the study population (Tables 1 and 2) and the use of different health services in total (Table 3). To test the association between HL and the frequency of contacts with different types of health services, (multiple) linear regression models were calculated (Table 4). This is in line with current discussions concluding that parametric tests can be used to analyze Likert scale responses (Sullivan & Artino, 2013). Age, gender, financial deprivation, educational attainment, migrant background, self-perceived health, and chronic illness were included in the multiple regression models as covariates.
Table 1.
Age and Financial Deprivation of the Study Population in the German Health Literacy Survey
| Characteristic | Mean | SD | Minimum-Maximum |
|---|---|---|---|
| Age (years) | 48.24 | 18.18 | 15–99 |
| Financial deprivation (z-score) | 0 | 1 | −1.10–4.4 |
Table 2.
Characteristics of the Study Population in the German Health Literacy Survey (N = 2,000)
| Characteristic | % | n |
|---|---|---|
| Gender | ||
| Female | 51.1 | 1,022 |
| Male | 48.9 | 977 |
| Education (ISCED) | ||
| Level 0 and 1 (preschool and primary school) | 5.2 | 105 |
| Level 2 (lower secondary) | 28.2 | 564 |
| Level 3 (upper secondary) | 48.6 | 972 |
| Level 4 (postsecondary) | 8.5 | 170 |
| Levels 5 and 6 (first and second stage of tertiary) | 8.9 | 179 |
| Missing | 0.5 | 10 |
| Migration background | ||
| No | 91.8 | 1,836 |
| Yes | 7.9 | 158 |
| Missing | 0.3 | 6 |
| Self-assessed health | ||
| Very good | 27 | 540 |
| Good | 43.2 | 864 |
| Fair | 24.7 | 494 |
| Bad and very bad | 5 | 100 |
| Missing | 0.1 | 1 |
| Chronic illness | ||
| No | 74.8 | 1,495 |
| Yes | 24.9 | 499 |
| Missing | 0.3 | 6 |
Note. Data weighted for sample. Due to rounding differences, sum is not always 2,000. ISCED = International Standard Classification of Education.
Table 3.
Frequencies of Health Service Use by Different Types of Health Services (N = 2,000)
| Frequency of Use | ||
|---|---|---|
| Health Service | % | n |
| Doctor | ||
| 0 times | 14.9 | 296 |
| 1–2 times | 41.3 | 826 |
| 3–5 times | 27.1 | 542 |
| 6+ times | 16.6 | 333 |
| Missing | 0.1 | 3 |
| Hospital | ||
| 0 times | 80.6 | 1,614 |
| 1–2 times | 17.2 | 344 |
| 3–5 times | 1.6 | 31 |
| 6+ times | 0.5 | 10 |
| Missing | 0.1 | 1 |
| Other health professionals | ||
| 0 times | 24.1 | 482 |
| 1–2 times | 54.6 | 1,092 |
| 3–5 times | 14.7 | 294 |
| 6+ times | 6.4 | 128 |
| Missing | 0.2 | 4 |
| Emergency service | ||
| 0 times | 84 | 1,680 |
| 1–2 times | 14.8 | 297 |
| 3–5 times | 0.9 | 18 |
| 6+ times | 0.2 | 4 |
| Missing | 0.1 | 1 |
Note. Data weighted for sample.
Table 4.
Frequency of Health Service Use by Multiple Predictors for Different Types of Health Services: Results of Multivariate Linear Regression Analysis
| Doctora | Hospitala | Other Health Professionalsa | Emergency Servicea | |||||||||||||
|---|---|---|---|---|---|---|---|---|---|---|---|---|---|---|---|---|
| Model | b | 95% CI | β | p Value | b | 95% CI | β | p Value | b | 95% CI | β | p Value | b | 95% CI | β | p Value |
| Raw model | ||||||||||||||||
| Constant | 3.713 | [3.495, 3.930] | < .001 | 1.690 | [1.575, 1.804] | < .001 | 2.828 | [2.639, 3.017] | < .001 | 1.567 | [1.468, 1.667] | < .001 | ||||
| Health literacyb | −.038 | [−.045, −.032] | −.253 | < .001 | −.014 | [−.018, −.011] | −.181 | < .001 | −.024 | [−.030, −.019] | −.187 | < .001 | −.012 | [−.015, −.009] | −.176 | < .001 |
| Adjusted R2 | 0.063 | 0.032 | 0.034 | 0.030 | ||||||||||||
| Adjusted modelc | ||||||||||||||||
| Constant | 2.476 | [2.145, 2.808] | < .001 | 1.247 | [1.048, 1.447] | < .001 | 2.615 | [2.273, 2.957] | < .001 | 1.401 | [1.222, 1.579] | < .001 | ||||
| Health literacyb | −.010 | [−.016, −.004] | −.066 | .001 | 0.001 | [−.003, 0.005] | 0.013 | .589 | −.013 | [−.020, −.007] | −.103 | < .001 | −.001 | [−.005, 0.002] | −.020 | .421 |
| Genderd | 0.221 | [0.154, 0.287] | 0.118 | < .001 | −.016 | [−.055, 0.024] | −.016 | .443 | 0.138 | [0.070, 0.207] | 0.087 | < .001 | −.012 | [−.048, 0.023] | −.015 | .500 |
| Agee | 0.006 | [0.003, 0.008] | 0.112 | < .001 | −.002 | [−.004, −.001] | −.090 | .001 | 0.002 | [−.001, 0.004] | 0.038 | .167 | −.002 | [−.003, −.001] | −.079 | .004 |
| Financial deprivationf | −.029 | [−.065, 0.006] | −.031 | .105 | 0.045 | [0.023, 0.066] | 0.092 | < .001 | −.012 | [−.048, 0.025] | −.015 | .520 | 0.049 | [0.030, 0.068] | 0.116 | < .001 |
| Educationg | 0.046 | [0.023, 0.069] | 0.072 | < .001 | 0.004 | [−.010, 0.018] | 0.012 | .561 | 0.039 | [0.015, 0.063] | 0.070 | .002 | 0.002 | [−.010, 0.015] | 0.008 | .704 |
| Migrant backgroundh | −.001 | [−.124, 0.122] | 0.000 | .987 | 0.000 | [−.074, 0.074] | 0.000 | .997 | −.009 | [−.136, 0.118] | −.003 | .894 | 0.030 | [−.036, 0.096] | 0.019 | .374 |
| Self-perceived healthi | 0.359 | [0.303, 0.416] | 0.329 | < .001 | 0.194 | [0.161, 0.228] | 0.343 | < .001 | 0.105 | [0.047, 0.163] | 0.113 | < .001 | 0.111 | [0.080, 0.141] | 0.225 | < .001 |
| Chronic illnessj | −.572 | [−.664, −.480] | −.266 | < .001 | −.203 | [−.258, −.147] | −.182 | < .001 | −.373 | [−.468, −.278] | −.203 | < .001 | −.186 | [−.236, −.136] | −.192 | < .001 |
| Adjusted R2 | 0.400 | 0.198 | 0.127 | 0.144 | ||||||||||||
Note. β = standardizend coefficient; b= nonstandardized coefficient; CI = confidence interval.
Doctor, hospital, other health professionals use in the last 12 months, and emergency services use in the last 24 months; scale from 0–6 or more times (four categories).
Health literacy index: 0 (minimal) to 50 (maximal).
For adjusted model: for doctor use, n= 1,890; for hospital use, n= 1,890; for other health professional use, n= 1,890; and for emergency service use, n= 1,888.
Gender from 0 = male to 1 = female.
In years.
From no deprivation to high deprivation.
Measured in International Standard Classification of Education levels: 1 = low education to 8 = high education (eight categories).
0 = no migrant background; 1 = migrant background.
From 1 = very good to 5 = very bad (five categories).
Self-reported: 0 = yes; 1 = no.
Results
The mean age of the respondents was 48.2 years. Just more than one-half of the respondents were women (51.1%, n = 1,022). HL scores could be calculated for 1,946 of the 2,000 respondents. The mean general HL score was 32.8 (standard deviation, 6.2) for the total sample. All sample characteristics are presented in Tables 1 and 2.
Approximately 41.3% of all respondents had visited a doctor once or twice in the last 12 months (Table 3). Although more than one-half of the participants had consulted other health professionals once or twice, 24.1% had not visited these at all. Most respondents had not been hospitalized (80.7%), whereas 17.2% had been to the hospital once or twice in the last 12 months; 84% had not used an emergency service in the last 2 years.
In univariate regression models, the association with HL was strongest for the frequency of doctor visits (β = −.253), and slightly less for hospital (β = −.181), other health professionals (β = −0.187) and emergency service use (β = −.176) (Table 4). All associations were statistically significant (p < .001).
Direct associations of HL and use of different types of health services were tested in multiple regression models, adjusting for gender, age, financial deprivation, education, migration background, self-perceived health and self-reported chronic illness (Table 4). Adjusting for health and sociodemographic covariates showed considerably reduced direct effects of HL on the use of the different health services. HL remained a significant independent predictor for doctor visits (β = −.066) and other health professionals (β = −.103), whereas for use of hospitals and emergency services no significant direct effect of HL could be demonstrated in the multivariate models.
Self-perceived health and self-reported chronic illness emerged as the most important predictors for frequency of use of all types of health services, with more frequent use reported among respondents with lower levels of self-perceived health or self-reported chronic illness. The effects of other covariates on the frequency of health service use varied by type of service.
Discussion
The present study analyzes the association between HL and the use of different types of health services based on nationally representative survey data for Germany.
Univariate regression analyses showed that all health services included in this study are used more often by individuals with lower HL scores. This is in accordance with results demonstrated in bivariate regressions (with some variation by country) in the HLS-EU, which used the same HL measure and included a sample from the German North Rhine-Westphalia region (Pelikan et al., 2012). Also, a German study among the elderly in eastern Germany reported that, adjusted for age and education, lower HL was associated with more frequent medical consultations (Tiller, Herzog, Kluttig, & Haerting, 2015). However, these studies did not or only partly took account of important covariates, such as health status, chronic illness, or socioeconomic indicators.
Adjusting for health and sociodemographic covariates showed reduced direct effects of HL on use of health services, as expected. Yet, our findings indicate that with regard to the frequency of visits to doctors (β = −.066) and other health professionals (β = −.103), an independent direct effect of HL remains.
Whereas the HLS-EU study does not show independent effects of HL on doctor visits in multivariate models (Pelikan et al., 2012), results from Belgium support a direct association between HL and general practitioner home visits and consultations with psychiatrists (Vandenbosch et al., 2016).
Regarding the frequency of use of emergency services and hospitals, HL does not have an independent direct effect when controlling for health status and demographic and socioeconomic indicators. This is in line with findings from Belgium, which also show no relationship between HL and emergency consultations (Vandenbosch et al., 2016). However, our results contradict findings from Italy (Palumbo et al., 2016) and the U.S. (Berkman et al. 2011; Cartwright et al., 2017; Griffey et al., 2014), which show an independent, direct relation between HL and emergency service and hospital use.
An explanation for these differences might be that the U.S. studies (Berkman et al. 2011; Cartwright et al., 2017; Griffey et al., 2014) used different HL measures and that the Italian study (Palumbo et al., 2016), although using the same HL measure, did not account for sociodemographic covariates (which have shown to be associated with HL) (Berens et al., 2016; Schaeffer et al., 2017; Sørensen et al., 2015).
Another explanation might be that differences in health care systems account for differences in use. Hospitals, for example, play an important role in the German health care system. An indicator for the dominant position of hospitals and their often affiliated emergency services is the high proportion of hospital beds. In Germany there were 612 hospital beds per 100,000 inhabitants in 2012, whereas there were, on average, only 453 beds per 100,000 inhabitants in the World Health Organization European region (2018). The possible role of health care system characteristics for the frequency of use of different health services needs to be further explored.
Strengths and Limitations
Strengths of this study are its use of a multidimensional concept and measure of HL (i.e., the full version of the HLS-EU-Q47 questionnaire) and the data collection via computer-assisted personal interviews among a representative sample of the general German population. The face-to-face interview method used in the present study is more likely to enable even people with inadequate functional literacy (e.g., limited reading competences) to participate properly. Furthermore, the HLS-EU-Q-47 instrument is a subjective self-reporting tool measuring perceived HL for a wide range of competencies in dealing with health information; thus, its results do not simply reflect functional HL.
There are a number of limitations associated with the present study as well. Health service use, health status, and chronic illness (as well as all other measures, including financial situation, educational status) were self-reported, which means that answers might not correctly and precisely reflect actual use and health status. In addition, using a self-reported HL measure could cause an inverse relationship with health service use, as patients with a higher number of contacts to health services might face more complex situations and thereby rate their HL lower. However, we tried to take this into account by including self-perceived health and self- reported chronic illness in the analyses. Because all interviews were conducted in German, migrants with poor German language proficiency were not included in the survey; therefore, the effect of migration background on use of health services might be underestimated in our study. Health service use was measured as counts of events, meaning that the hospital and emergency service variables are not normally distributed and skewed to zero, and therefore might not be adequately powered in all categories. Thus, further analyses would be needed to explore the relation between HL and health service use in more detail. In addition, our results do not allow for an evaluation of the adequacy of use (i.e., over- or underutilization) or the reasons for use (i.e., preventive) but only report on the perceived frequency as such. Previous studies indicate that people with lower HL tend to overestimate the severity of a condition and seek emergency and hospital care even for conditions that do not require such care (May et al., 2018), that people with lower HL are likely to overuse services whereas people with high HL might underuse services (Mantwill & Schulz, 2017), and that preventive services are used less often by people with lower HL (Scott et al., 2002). Thus, the reasons for and adequacy of health service use needs to be further explored.
Conclusions
This study suggests that different types of health services are relatively more often used by people with lower levels of HL. Health professionals, therefore, should be aware that their patients are likely to have difficulties understanding and processing health-related information. Thus, interventions to strengthen HL should aim at improving health care literacy. They should also address individual patients and the circumstances related to the health care system, as well as the health professional's communication skills.
Acknowledgments
The authors thank the team at the Ludwig Boltzmann Institute of Health Promotion Research for providing the German version of the Health Literacy Survey-Europe Questionnaire and for their support in data preparation.
References
- Ayotte B. J. Allaire J. C. Bosworth H. (2009). The associations of patient demographic characteristics and health information recall: The mediating role of health literacy. Neuropsychology, Development, and Cognition. Section B, Aging, Neuropsychology, and Cognition, 16(4), 419–432. 10.1080/13825580902741336 [DOI] [PubMed] [Google Scholar]
- Baker D. W. Gazmararian J. A. Williams M. V. Scott T. Parker R. M. Green D. Peel J. (2002). Functional health literacy and the risk of hospital admission among Medicare managed care enrollees. American Journal of Public Health, 92(8), 1278–1283. 10.2105/AJPH.92.8.1278 [DOI] [PMC free article] [PubMed] [Google Scholar]
- Berens E. M. Vogt D. Messer M. Hurrelmann K. Schaeffer D. (2016). Health literacy among different age groups in Germany: Results of a cross-sectional survey. BMC Public Health, 16(1), 1151. 10.1186/s12889-016-3810-6 [DOI] [PMC free article] [PubMed] [Google Scholar]
- Berkman N. D. Sheridan S. L. Donahue K. E. Halpern D. J. Crotty K. (2011). Low health literacy and health outcomes: An updated systematic review. Annals of Internal Medicine, 155(2), 97–107. 10.7326/0003-4819-155-2-201107190-00005 [DOI] [PubMed] [Google Scholar]
- Cartwright L. A. Dumenci L. Cassel B. Thomson M. D. Matsuyama R. K. (2017). Health literacy is an independent predictor of cancer patients' hospitalizations. HLRP: Health Literacy Research and Practice, 1(4), e153–e162. 10.3928/24748307-20170808-01 [DOI] [PMC free article] [PubMed] [Google Scholar]
- Cox B. van Oyen H. Cambois E. Jagger C. Le Roy S. Robine J. M. Romieu I. (2009). The reliability of the Minimum European Health Module. International Journal of Public Health, 54(2), 55–60. 10.1007/s00038-009-7104-y [DOI] [PubMed] [Google Scholar]
- Eurostat. (2013). European Health Interview Survey (EHIS wave 2): Methodological manual. Methodologies and working papers. Retrieved from http://ec.europa.eu/eurostat/documents/3859598/5926729/KS-RA-13-018-EN.PDF/26c7ea80-01d8-420e-bdc6-e9d5f6578e7c
- Griffey R. T. Kennedy S. K. D'Agostino McGowan L. Goodman M. Kaphingst K. A. (2014). Is low health literacy associated with increased emergency department utilization and recidivism? Academic Emergency Medicine: Official Journal of the Society for Academic Emergency Medicine, 21(10), 1109–1115. 10.1111/acem.12476 [DOI] [PMC free article] [PubMed] [Google Scholar]
- Kutner M. Greenburg E. Jin Y. Paulsen C. (2006). The health literacy of America's adults: Results from the 2003 National Assessment of Adult Literacy. Retrieved from National Center for Education Statistics website: https://nces.ed.gov/pubs2006/2006483.pdf
- Mantwill S. Schulz P. J. (2017). Low health literacy and healthcare utilization among immigrants and non-immigrants in Switzerland. Patient Education and Counseling, 100(11), 2020–2027. 10.1016/j.pec.2017.05.023 [DOI] [PubMed] [Google Scholar]
- May M. Brousseau D. C. Nelson D. A. Flynn K. E. Wolf M. S. Lepley B. Morrison A. K. (2018). Why parents seek care for acute illness in the clinic or the ED: The role of health literacy. Academic Pediatrics, 18(3), 289–296. 10.1016/j.acap.2017.06.010 [DOI] [PMC free article] [PubMed] [Google Scholar]
- Michtell S. E. Sadikova E. Jack B. W. Paasche-Orlow M. K. (2012). Health literacy and 30-day postdischarge hospital utilization. Journal of Health Communication, 17(Suppl. 3), 325–338. 10.1080/10810730.2012.715233 [DOI] [PubMed] [Google Scholar]
- Organisation for Economic Co-Operation and Development. (1999). Classifying educational programmes: Manual for ISCED-97 implementation in OECD countries. Retrieved from http://www.oecd.org/edu/1841854.pdf
- Palumbo R. Annarumma C. Adinolfi P. Musella M. Piscopo G. (2016). The Italian Health Literacy Project: Insights from the assessment of health literacy skills in Italy. Health Policy, 120(9), 1087–1094. 10.1016/j.healthpol.2016.08.007 [DOI] [PubMed] [Google Scholar]
- Pelikan J. M. Rothlin F. Ganahl K. HLS-EU Consortium. (2012). Comparative report of health literacy in eight EU member states: The European Health Literacy Survey. Retrieved from Ludwig Boltzmann Institute website: http://lbihpr.lbg.ac.at.w8.netz-werk.com/sites/files/lbihpr/attachments/neu_rev_hls-eu_report_2015_05_13_lit.pdf
- Protheroe J. Whittle R. Bartlam B. Estacio E. V. Clark L. Kurth J. (2017). Health literacy, associated lifestyle and demographic factors in adult population of an English city: A cross-sectional survey. Health Expectations, 20(1):112–119. . 10.1111/hex.12440 [DOI] [PMC free article] [PubMed] [Google Scholar]
- Rootman I. Gordon-El-Bihbety D. (2008). A vision for a health literate Canada: Report of the expert panel on health literacy. Retrieved from Canadian Public Health Association website: https://www.cpha.ca/sites/default/files/uploads/resources/healthlit/report_e.pdf
- Schaeffer D. Berens E. M. Vogt D. (2017). Health Literacy in the German population. Deutsches Ärzteblatt International, 114(4), 53–60. 10.3238/arztebl.2017.0053 [DOI] [PMC free article] [PubMed] [Google Scholar]
- Schneider S. L Kogan I. (2008). The International Standard Classification of Education 1997: Challenges in the application to national data and the implementation in cross-national surveys. Retrieved from University of Mannheim website: http://www.mzes.uni-mannheim.de/publications/misc/isced_97/schn08b_the_international_standard_classification_of_educa.pdf
- Scott T. L. Gazmararian J. A. Williams M. V. Baker D. W. (2002). Health literacy and preventive health care use among Medicare enrollees in a managed care organization. Medical Care, 40(5), 395–404. 10.1097/00005650-200205000-00005 [DOI] [PubMed] [Google Scholar]
- Sørensen K. Pelikan J. M. Röthlin F. Ganahl K. Slonska Z. Doyle G. Brand H HLS-EU Consortium. (2015). Health literacy in Europe: Comparative results of the European health literacy survey (HLS-EU). European Journal of Public Health, 25(6), 1053–1058. 10.1093/eurpub/ckv043 [DOI] [PMC free article] [PubMed] [Google Scholar]
- Sørensen K. Van Den Broucke S. Pelikan J. M. Fullam J. Doyle G. Slonska Z. Brand H HLS-EU Consortium. (2013). Measuring health literacy in populations: Illuminating the design and development process of the European Health Literacy Survey Questionnaire (HLS-EU-Q). BMC Public Health, 13, 948. . 10.1186/1471-2458-13-948 [DOI] [PMC free article] [PubMed] [Google Scholar]
- Sørensen K. Van Den Broucke S. Fullam J. Doyle G. Pelikan J. Slonska Z. Brand H HLS-EU Consortium. (2012). Health literacy and public health: A systematic review and integration of definitions and models. BMC Public Health, 12, 80. 10.1186/1471-2458-12-80 [DOI] [PMC free article] [PubMed] [Google Scholar]
- Statistisches Bundesamt. Bevölkerung mit migrationshintergrund – Ergebnisse des Mikrozensus 2013. Retrieved from https://www.destatis.de/DE/Publikationen/Thematisch/Bevoelkerung/MigrationIntegration/MigrationshintergrundSonderausgabe5122121109004.pdf?__blob=publicationFile
- Sullivan G. M. Artino A. R. (2013). Analyzing and interpreting data from Likert-type scales. Journal of Graduate Medical Education. 5(4):541–542. 10.4300/JGME-5-4-18 [DOI] [PMC free article] [PubMed] [Google Scholar]
- Tiller D. Herzog B. Kluttig A. Haerting J. (2015). Health literacy in an urban elderly East-German population – Results from the population-based CARLA study. BMC Public Health, 15(1), 883. 10.1186/s12889-015-2210-7 [DOI] [PMC free article] [PubMed] [Google Scholar]
- Vandenbosch J. Van Den Broucke S. Vancorenland S. Avalosse H. Verniest R. Callens M. (2016). Health literacy and the use of healthcare services in Belgium. Journal of Epidemiology and Community Health, 70(10), 1032–1038. 10.1136/jech-2015-206910 [DOI] [PubMed] [Google Scholar]
- Vogt D. Schaeffer D. Messer M. Berens E. M. Hurrelmann K. (2017). Health literacy in old age: Results of a German cross- sectional study. Health Promotion International. Advance online publication. 10.1093/heapro/dax012 [DOI] [PubMed]
- World Health Organization Europe. Acute care hospital beds per 100,000. Retrieved from https://gateway.euro.who.int/en/indicators/hfa_478-5060-acute-care-hospital-beds-per-100-000/