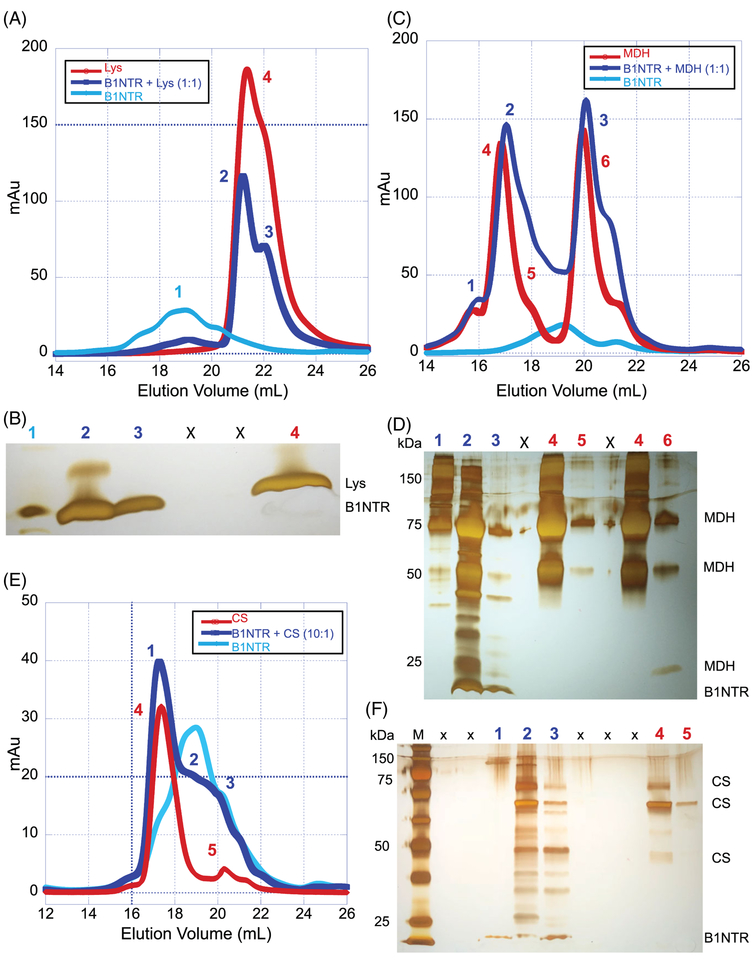
FIGURE 4.
B1NTR forms complexes with substrates during protein aggregation. (A) After incubation for 1 h at 45°C with 20 mM DTT, mixed samples of (1:1) Lys (75 μM) and B1NTR (75 μM) or each protein individually, were evaluated by SEC on a Superose 6 10/30 increase column at 0.3 mL/min. Peak fractions are indicated by numbers. (B) SDS-PAGE gel of respective sample elution fractions corresponding to observed peaks. Protein molecular mass marker is in far-left lane. Each indicated gel lane represents a sample taken from a fraction corresponding to those indicated on SEC traces, above. 1: B1NTR only, 2: B1NTR + Lys, 3: B1NTR + Lys, X: spillover lanes, 4: Lys only. (C) Mixed samples (1:1) B1NTR (50 μM) and MDH (50 μM) were evaluated by SEC after heating at 45°C for 1 h. Individual samples were obtained under similar conditions. Peak fractions are indicated by numbers above gel lanes. (D) SDS-PAGE gel of each respective peak elution obtained from independent SEC runs. Each indicated gel lane represents a peak obtained from multiple fractions and labeled on corresponding SEC traces, above in C. (E) A 10:1 ratio of B1NTR (50 μM) and CS (5 μM) were evaluated by SEC after heating at 45°C for 1 h. Individual sample evaluations were obtained under similar conditions. Peak fractions are indicated by numbers above gel lanes. (F) SDS-PAGE gel of each respective peak elution obtained from independent SEC runs. Each indicated gel lane represents a peak obtained from multiple fractions and labeled on corresponding SEC traces, (E). M: protein molecular weight marker, X: spillover lanes, 1: B1NTR + CS, 2: B1NTR + CS, 3: B1NTR + CS, 4: CS only, 5: CS only

