

Short abstract
Post‐EAU Treg cells are inducible Treg cells, and function through the PD‐1/PD‐L1 pathway.
Keywords: neuroimmunomodulation, melanocortins, adenosine, ocular immunobiology, suppressor cells
Abstract
The recovery of EAU, a mouse model of endogenous human autoimmune uveitis, is marked with the emergence of autoantigen‐specific regulatory immunity in the spleen that protects the mice from recurrence of EAU. This regulatory immunity is mediated by a melanocortin‐driven suppressor APC that presents autoantigen and uses adenosine to activate an antigen‐specific CD4+ Tregs through the A2Ar. These cells are highly effective in suppressing uveitis, and they appear to be inducible Tregs. In this study, we determined whether they are inducible or natural Tregs and identified the dependent mechanism for the function of these post‐EAU Tregs. The post‐EAU spleen CD25+CD4+ T cells were sorted for NRP‐1 expression and transferred to recipient mice immunized for EAU. The sorted NRP‐1−, but not the NRP‐1+, Tregs suppressed EAU. These NRP‐1− Tregs coexpress PD‐1 and PD‐L1. Treatment of naive APCs with α‐MSH promoted a regulatory APC that induced CD25+ CD4+ Tregs in a CD73‐dependent manner. These Tregs were PD‐L1+ PD‐1+ NRP‐1− FOXP3+ HELIOS− and suppressed EAU when transferred to recipient mice. In contrast, PD‐1− T cells did not suppress EAU, indicating that PD‐1 is necessary for the suppressive activity of iTregs. Moreover, these Tregs did not suppress effector T cells when the PD/‐1/PD‐L1 pathway was blocked. These results demonstrate that post‐EAU Tregs are inducible Tregs, which use a PD‐1/PD‐L1 mechanism to suppress disease.
Abbreviations
- A2Ar
adenosine 2A receptor
- α‐MSH
α‐melanocyte‐stimulating hormone
- Akt
protein kinase B
- AT
adoptive transfer
- CD
cluster of differentiation
- CTLA4
cytotoxic T‐lymphocyte‐associated protein 4
- EAU
experimental autoimmune uveoretinitis
- FOXP
Forkhead box protein
- IRBP
interphotoreceptor retinoid binding protein
- iTreg
inducible Treg
- Ly6G
lymphocyte antigen 6 complex locus G
- MC5r
melanocortin 5 receptor
- MFI
mean fluorescence intensity
- mTOR
mammalian target of rapamycin
- NrP‐1
neuropilin 1
- nTreg
natural Treg
- PD‐1
programmed cell death 1
- PD‐L
PD ligand
- SFM
serum‐free medium
- SHP
Src homology region 2 domain‐containing phosphatase
- Teff
effector T cell
- ZAP70
ζ‐chain‐associated protein kinase
Introduction
EAU is a mouse model of human autoimmune uveitis [1] and is used to better understand the mechanisms that contribute to the chronic nature of uveitis. EAU is induced in C57BL/6J mice with an immunization containing human IRBP peptide amino acids 1–20. Uveoretinitis is observed within 2–3 wk of immunization and spontaneously resolves within 70–90 d. During the resolution of EAU, IRBP‐specific regulatory immunity is found in the spleen [2, 3–4]. This regulatory immunity provides resistance to a memory/recall immune response when these mice are reimmunized to IRBP, and it suppresses uveitis when transferred to mice with EAU [2, 3, 4–5]. We have previously shown that this regulatory immunity is dependent on a melanocortin‐adenosinergic pathway and on the expression of the MC5r [3, 4–5]. MC5r is a receptor for the immunosuppressive neuropeptide, α‐MSH and is necessary for the emergence of a CD11b+F4/80+Ly‐6G+Ly‐6Clow regulatory APC in the spleen of post‐EAU mice [4]. These regulatory APCs activate CD25+CD4+ Tregs that are also present in the spleen of post‐EAU mice [2, 3]. We have shown that Treg activation involves T cell expression of the A2Ar and that the APCs must express the ectoenzymes CD39 and CD73 [4].
The dephosphorylation of ATP into adenosine by the ectoenzymes ectonucleoside triphosphate diphosphohydrolase 1 (ENTPD1/CD39) and 5′‐nucleotidase (NT5E/CD73), creates an adenosine rich microenvironment that promotes regulatory activity [6, 7, 8–9]. We and others have shown that adenosine signaling through A2Ar on T cells induces Treg activity [4, 10, 11], and the ectoenzymes are Treg markers; therefore adenosine is an autocrine regulatory signal on Tregs [12]. In addition to promoting regulatory activity, it has been shown that CD73‐derived adenosine inhibits NF‐κB in CD4+ T cells [13]. Thus, adenosine signaling on T cells through A2Ar is anti‐inflammatory and promotes regulatory activity. A2Ar stimulation mediates intracellular effects in a cAMP‐dependent manner [6], and T cell anergy mediated by A2Ar signaling occurs through inhibition of TCR‐induced ZAP70 phosphorylation [14]. Additional intracellular pathways involved in suppression of TCR activation include inhibition of Erk phosphorylation and subsequent AP‐1 binding [10]. What type of Treg is induced through A2Ar stimulation and how it suppresses inflammation is not well understood.
The developmental origin of Tregs has led to the classification of Tregs into nTregs, and iTregs from the periphery as a consequence of antigen exposure [15]. It has been shown that nTregs and iTregs can function together [16, 17] or independent of each other [15, 18, 19]. To distinguish between nTregs and iTregs, NRP‐1 has been suggested to be a surface marker that is expressed on nTregs, but not necessarily on iTregs [20, 21]. Understanding the potential origin of the Tregs makes it possible to know what population of T cells is targeted for induction of protective regulatory immunity by the melanocortin‐induced suppressor APC.
PD‐1 is a glycoprotein expressed on the cell surface by activated T cells and Tregs [22, 23–24]. It is in the B7 family of costimulatory/coinhibitory molecules, with a structure similar to CTLA‐4, but after T cell activation, it is expressed later than CTLA‐4 and suppresses activation to a greater extent than CTLA‐4 signaling [25]. In contrast to CTLA‐4, PD‐1 blocks the intracellular signaling pathways involved in TCR signaling rather than competing for costimulatory receptor ligands such as B7‐1 and B7‐2 [24, 25–26]. The PD‐1 intracellular signals block Teff function, and promote Treg activity [22, 23, 27]. The ligands for PD‐1 are PD‐L1 (B7‐[1H]) and PD‐L2 (B7‐DC); and PD‐L1 is coexpressed with PD‐1 on Tregs [28].
In this work, we determined the type of Treg induced by the post‐EAU melanocortin‐adenosinergic pathway and how it may function to suppress autoimmune uveitis. Our results further demonstrate the potential of the melanocortin‐adenosinergic pathway in reestablishing and maintaining immune tolerance after an autoimmune response.
MATERIALS AND METHODS
Mice
The Boston University Institutional Animal Care and Use Committee approved all study procedures involving mice. C57BL/6J mice were purchased from Jackson Laboratories (Bar Harbor, ME, USA). The CD73(−/−) and A2Ar(−/−) mice on a C57BL/6J background, were obtained from Dr. Jiang‐Fen Chen (Boston University School of Medicine, Boston, MA, USA). Both strains were housed and bred in the Boston University Laboratory Animal Science Center.
Induction of EAU
EAU was induced by immunizing the mice with an emulsion of CFA with 5 mg/ml desiccated Mycobacterium tuberculosis (Difco Laboratories, Detroit, MI, USA) and 2 mg/ml IRBP peptide amino acids 1–20 (Genscript, Piscataway, NJ, USA). The mice received a subcutaneous injection of the emulsion (100 µl) into 2 sites on the lower back, followed by an intraperitoneal injection of 0.3 µg pertussis toxin. The course of EAU was evaluated every 3–4 d by fundus examination. The ocular fundus was examined with a slit lamp microscope. The iris was dilated with 1% tropicamide, and the cornea was numbed with 0.5% proparacaine and flattened with a glass coverslip for the fundus observations. The clinical signs of observable infiltration and vasculitis in the retina were scored on a 5 point scale [29]. The maximum score from either eye per mouse was recorded for each day of observation.
Flow cytometry analysis
The spleens from post‐EAU mice (d 70–80 after immunization for EAU) were collected and placed in RPMI‐1640 with 5% FBS and supplemented with 10 μg/ml gentamicin (Sigma‐Aldrich, St. Louis, MO, USA) and with 10 mM HEPES, 1 mM sodium pyruvate, and nonessential amino acids (all from BioWhittaker, Walkersville, MD, USA). The cells were made into a single‐cell suspension, depleted of RBCs by using RBC lysis buffer (Sigma‐Aldrich), washed, and resuspended in serum‐free medium (SFM), consisting of RPMI‐1640 with 1% ITS+1 solution and 0.1% BSA (Sigma), and supplemented with 10 μg/ml gentamicin (all from Sigma‐Aldrich) and 10 mM HEPES, 1 mM sodium pyruvate, and nonessential amino acids 0.2% (all from BioWhittaker). IRBPp 1–20 was added at 50 μg/ml to cultures to reactivate T cells for 48 h at 37°C and 5% CO2.
The cells were washed with staining buffer, blocked with mouse IgG in staining buffer, and stained with conjugated antibodies. Staining buffer was PBS with 1% BSA. Antibodies used to stain the APCs were anti‐CD11b (clone M1/70;), anti‐Ly‐6C (clone HK1.4;), anti‐Ly‐6G (clone 1A8; all from Biolegend, San Diego CA, USA), and F4/80 (clone BM8; eBiosciences, San Diego, CA, USA). Antibodies used to stain the T cells were anti‐CD4 (clone GK1.5; Biolegend), anti‐CD25 (clone PC61; Biolegend), anti‐NRP‐1 (catalog no. FAB566P; R&D Systems, Minneapolis, MN, USA), anti‐PD‐1 (clone 29F.1A12; Biolegend), anti‐PD‐L1 (clone 10F.9G2, Biolegend), anti‐FOXP3 (clone MF14, Biolegend), and anti‐HELIOS (clone 22F6; Biolegend). The Fix/Perm Buffer set (Biolegend) was used for intracellular staining of FOXP3. Stained cells were analyzed in the Boston University Flow Cytometry Core Facility on a BD LSRII flow cytometer (BD Biosciences, San Jose, CA, USA), and the data were analyzed with FlowJo Software (Tree Star, Inc., Ashland, OR, USA).
In vitro α‐MSH treatment of APC and generation of IRBP‐specific T cells
Spleen APCs were collected by incubating splenocytes from naive mice in SFM at 37°C and 5% CO2 for 90 min in tissue culture plates and then were washed twice. The adherent cells were scraped off of the plastic in ice‐cold SFM. The APCs were plated at 1 × 10⁶ cells per well in a 24‐well plate in SFM, with 50 μg/ml IRBPp 1–20, with 1 ng/ml α‐MSH [30]. Popliteal lymph nodes were collected from mice injected with 5 mg/ml CFA and 1 mg/ml IRBPp 1–20 in the foot pad 7 d before lymph node collection. The T cells were enriched on CD3 columns (R&D Systems). APCs treated with α‐MSH were washed 3 times, and 5 × 10⁵ APCs were added to wells with 1.5 × 10⁶ T cells and 50 μg/ml IRBPp 1–20.
Cell sorting and adoptive transfer
Reactivated splenic T cells from post‐EAU mice or IRBP‐specific T cells activated by α‐MSH‐treated APCs were stained as described above. Stained T cells were sorted in the Boston University Flow Cytometry Core Facility on a MoFlo Cell Sorter (Beckman Coulter, Inc., Brea, CA, USA) or a FACSAria III (BD Biosciences). The cells were sorted into tubes containing 10% FBS and found to be ≥98% pure (data not shown). Mice were injected in the tail vein with 1 × 10⁵ sorted cells in PBS. Unsorted cells were transferred to mice at 1 × 10⁶ cells per mouse. Following the adoptive transfer, the mice were immunized for EAU as described above. Each group of adoptive transfer experiments was repeated at least 2 times, and each figure legend indicates the total number of mice assayed (n) for each figure. EAU scores were pooled from all repeated experiments.
PD‐1‐blocking antibody
To block PD‐1 on responder T cells, the CD4+ T cells were incubated with PD‐1‐blocking antibody (clone J43; eBioscience) at 1 or 10 μg per 1 × 10⁶ cells for 20 min and washed 3 times before adding 1.5 × 10⁶ T cells to wells containing APCs pulsed with IRBPp 1–20.
In vitro T cell coculture
In vitro‐generated Tregs and in vivo post‐EAU Tregs were collected and stained for CD4, CD25, NRP‐1, and PD‐1. The stained Tregs were sorted for PD‐1+NRP‐1−CD25+CD4+ Tregs. Responder IRBP‐specific T cells were collected from popliteal lymph nodes of mice injected with CFA and IRBPp 1–20, as described above, and enriched for CD4+ T cells (R&D systems). The T cells were added to wells seeded with untreated APCs pulsed with IRBP peptide. The wells contained 5 × 10⁵ APCs per well, 1.5 × 10⁶ total T cells, and 50 μg/ml IRBP peptide in SFM. Cocultures were incubated for 48 h at 37°C with 5% CO2. Preliminary experiments showed that the optimal concentration of Tregs to Teffs was 1:1 (Treg: Teff) when in vitro Tregs were used and 1:2 (Treg: Teff) when in vivo Tregs were used. Following the 48 h coculture, the supernatants were collected and assayed for IFN‐γ, TGF‐β, and IL‐17.
Cytokine analysis
Cytokine production was measured in the supernatant of cells cultured for 48 h. After incubation, the supernatants were assayed for IL‐17, IFN‐γ, and TGF‐β. The concentration of IFN‐γ was measured with a sandwich ELISA. (IFN‐γ detection and biotinylated IFN‐γ antibodies were from BD Biosciences.) The concentration of TGF‐β was measured with the standard Mv1Lu bioassay [31]. The concentration of IL‐17 in the culture medium was measured with an IL‐17 ELISA kit (R&D systems).
Statistical analysis
The experimental results for EAU scoring were analyzed with the nonparametric Mann‐Whitney U test for statistical differences in the EAU scores between groups of mice. In addition, changes in the tempo of disease between the groups of treated EAU mice were analyzed by 2‐way ANOVA. Comparisons of cytokine concentrations were statistically analyzed by 1‐way ANOVA with the post hoc Bonferroni comparison analysis. Statistical significance was set at P ≤ 0.05.
RESULTS
Post‐EAU Tregs are iTregs
In prior work, we showed that mice that have recovered from EAU have CD25+CD4+ Tregs in their spleens [3, 4] and that these cells are absent in the spleens of post‐EAU A2Ar knockout mice [4]. To determine whether these Tregs are nTregs or iTregs, we assayed the cells for expression of NRP‐1. It is thought that nTregs express NRP‐1, but that it is generally absent on iTregs [20, 21]. The CD25+CD4+ Tregs from the spleens of mice that had recovered from EAU were stained for NRP‐1. Since regulatory activity is absent in the spleens of post‐EAU A2Ar(−/−) mice [4], these CD25+CD4+ T cells were included as a control. Post‐EAU spleen cells from the wild‐type mice showed an NRP‐1+ and NRP‐1− population in the CD25+CD4+ Treg subset ( Fig. 1A ). In contrast, the CD25+CD4+ T cells from the post‐EAU A2Ar(−/−) mice had a greatly diminished population of NRP‐1− T cells (Fig. 1A).
Figure 1.
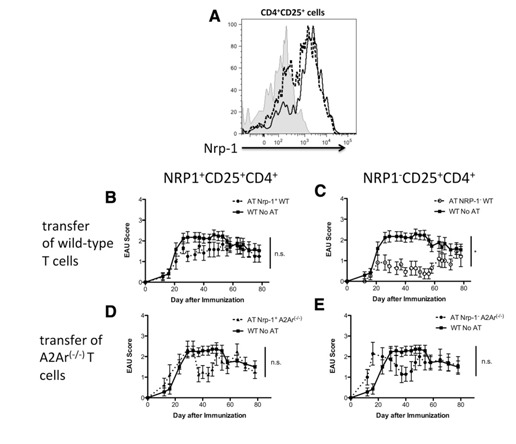
The post‐EAU CD4+CD25+ Tregs are ‐1−. The spleen cells from post‐EAU wild‐type and A2Ar(−/−) mice were collected and stimulated in vitro with IRBP for 48 h. After reactivation, the spleen cells were collected and stained for CD4, CD25, and NRP‐1 and analyzed by flow cytometry. (A) NRP‐1 expression on cells gated for CD4 and CD25. Shaded histogram: unstained control; dashed line: wild‐type; solid line: A2Ar(−/−). The unstained control was stained with anti‐CD4 and i‐CD25, but not anti‐NRP‐1. (B–E) EAU scores of mice that received a transfer of sorted T cells from post‐EAU mice; control mice were immunized for EAU but did not receive cells. The cells from the post‐EAU wild‐type, and A2Ar(−/−) mice were sorted into NRP‐1−CD25+CD4+ and NRP‐1+CD25+CD4+ populations and transferred to mice immunized for EAU. The transferred wild‐type T cells were (B) NRP‐1+CD25+CD4+ (n = 12) or (C) NRP‐1−CD25+CD4+ (n = 11), and A2Ar(−/−) T cells were (D) NRP‐1+CD25+CD4+, (n = 8) or (E) NRP‐1−CD25+CD4+, (n = 7). *P ≤ 0.05; significantly different from the control; N.S., no significant difference at any time point. Determined by 2‐way ANOVA.
To identify which subset is functionally suppressive, we sorted the NRP‐1+ and NRP‐1− subsets of post‐EAU splenic CD25+CD4+ T cells and transferred the sorted T cells into recipient mice immunized for EAU. The mice that received NRP‐1+ T cells showed no significant suppression of EAU compared with the immunized mice that received no transfer of cells (Fig. 1B). In stark contrast, the mice that received the sorted NRP‐1−CD25+CD4+ T cell subset showed significant suppression of disease compared with the immunized mice that did not receive cells (Fig. 1C). Neither subset from the post‐EAU A2Ar(−/−) mice had the regulatory capacity to suppress EAU in the recipient mice (Fig. 1D and E). Therefore, the post‐EAU Tregs are NRP‐1− CD25+ CD4+ indicating that they are iTregs.
Post‐EAU iTregs express PD‐1, PD‐L1, and FOXP3
We next asked whether the post‐EAU iTregs up‐regulate PD‐1, as do other adenosine‐stimulated Tregs [32]. Spleen cells from post‐EAU wild‐type and A2Ar(−/−) mice were restimulated in vitro with IRBP for 48 h and stained for PD‐1 and PD‐L1 expression. The unstimulated and restimulated T cells from the wild‐type mice showed that most of the NRP‐1− T cells were PD‐1+ ( Fig. 2A and C ). In contrast, the unstimulated and restimulated T cells from the A2Ar(−/−) mice had similar PD‐1 expression among the NRP‐1+ and NRP‐1− subsets (Fig. 2B and D). These observations demonstrated that there was a substantial subpopulation of PD‐1+ post‐EAU iTregs. Also, the post‐EAU iTregs were assayed for expression of PD‐L1. Most of the PD‐1+ iTregs were also PD‐L1+ ( Fig. 3A and B ) and the mean fluorescence intensity (MFI) reflected this observation (Fig. 3G). Because PD‐1 is upregulated on T cells during activation and we observed a similar proportion of PD‐1+PD‐L1+ T cells between the wild‐type and A2Ar(−/−) post‐EAU T cells, we next asked whether the typical Treg marker FOXP would be expressed. The PD‐1+ post‐EAU T cells showed a 2‐fold increase in FOXP3+ T cells from the wild‐type mice compared to the number in A2Ar(−/−) mice (Fig. 3C and D), and the MFI indicated significantly greater FOXP3 expression in the wild‐type mice compared to that in the A2Ar(−/−) mice (Fig. 3H). This result confirms our previous finding that post‐EAU A2Ar(−/−) mice have less FOXP3+ T cells than do the post‐EAU wild‐type mice [4]. We also examined HELIOS expression as another marker for n‐ and iTregs. The PD‐1+ subset from the post‐EAU mice showed fewer HELIOS+ T cells in the wild‐type mice than in the A2Ar(−/−) mice (Fig. 3E and F), and the MFI indicated significantly lower HELIOS expression in the wild‐type compared to the A2Ar(−/−) mice (Fig. 3I). These observations demonstrated that post‐EAU iTregs express PD‐1 and PD‐L1 and are FOXP3+ and HELIOS−.
Figure 2.
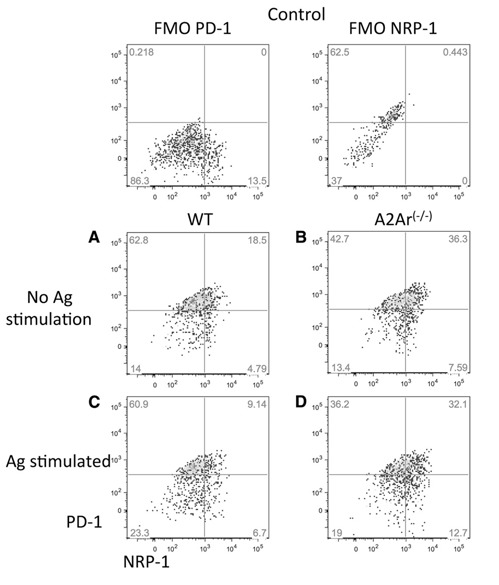
Post‐EAU iTregs express PD‐1. Spleen cells from post‐EAU wild‐type and A2Ar(−/−) mice were collected and incubated, with or without IRBP, for 48 h. After the 48 h incubation, spleen cells were stained for CD4, CD25, NRP‐1, and PD‐1. Fluorescence minus one (FMO) controls are shown in the top panels. FMO controls were wild‐type cells stained with all antibodies except for the one indicated. The graphs shown were gated on CD25+CD4+ T cells. NRP‐1 expression: x‐axis; PD‐1 expression: y‐axis. Resting T cells from (A) wild‐type mice or (B) A2Ar(−/−) mice. Antigen‐stimulated T cells from (C) wild‐type or (D) A2Ar(−/−) mice. Each graph is representative of results in 4 independent experiments.
Figure 3.
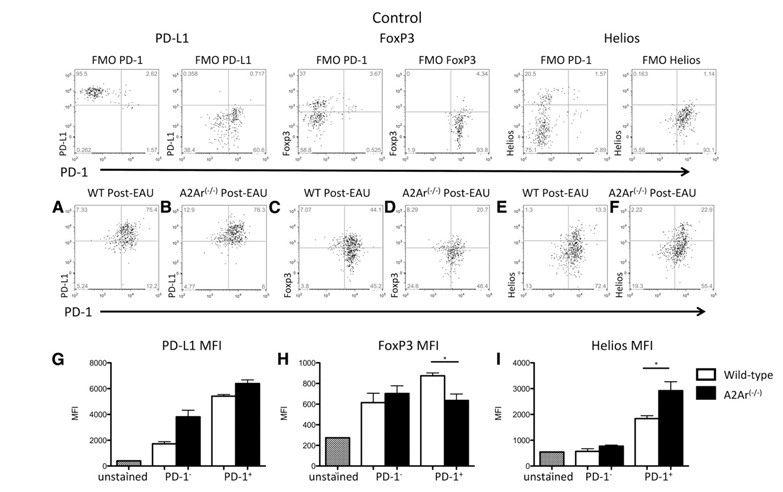
Post‐EAU iTregs express PD‐L1 and FOXP3, but not HELIOS. Post‐EAU spleen cells (d 80–90) were collected from wild‐type (C57BL/6J) and A2Ar(−/−) mice, as in Fig. 1, and stained for CD4, CD25, NRP‐1, PD‐1, PD‐L1, and FOXP3. The graphs are gated on CD4+ CD25+ NRP‐1− T cells. Fluorescence minus one (FMO) controls, which were wild‐type cells stained with all antibodies except for the one indicated, are shown in the top panels. All graphs display PD‐1 expression along the x‐axis with (A, B) PD‐L1, (C, D) FOXP3, or (E, F) HELIOS expression along the y‐axis. Each graph is representative of results in 4 experiments. (G) PD‐L1, (H) FOXP3, and (I) HELIOS show MFI measurements taken after gating on CD4+ CD25+ NRP‐1− T cells that were either PD‐1+ or PD‐1−.. Bar graphs are the mean with sem of results in 4 independent experiments. *P ≤ 0.05; significantly different from control cells, by 1‐way ANOVA with Bonferroni post hoc analysis.
In vitro treatment of APCs with α‐MSH promotes regulatory APCs capable of inducing Tregs
It has been demonstrated that post‐EAU APC induction of the post‐EAU Tregs requires the expression of MC5r on the APC [3, 4–5]. Therefore, does MC5r‐stimulation by its ligand α‐MSH on APCs activate APCs capable of inducing Tregs? IRBP‐specific T cells were collected from the draining lymph nodes of mice immunized with IRBP in CFA. The T cells were CD3 enriched and activated by splenic APCs that were treated with α‐MSH and pulsed with antigen. After the 48 h restimulation of the T cells, the supernatants were collected and analyzed for IFN‐γ, TGF‐β, and IL‐17. The supernatants from cultures of T cells restimulated with α‐MSH‐treated APCs showed significantly lower IFN‐γ and significantly higher TGF‐β production than did the cultures of T cells restimulated with untreated APCs ( Fig. 4A and B ). IL‐17 expression showed no change between the treated and untreated APCs (Fig. 4C), and the levels were very low. Given that the post‐EAU Tregs require A2Ar expression on the T cells [4], primed IRBP‐specific A2Ar(−/−) T cells were used as the control. The supernatants from cultures of A2Ar(−/−) T cells restimulated with α‐MSH‐treated or untreated APCs showed no change in cytokine profile (Fig. 4A–C). To show functional suppression, the T cells restimulated with α‐MSH‐treated APCs were adoptively transferred into recipient mice immunized for EAU. The mice that received a transfer of T cells restimulated with α‐MSH‐treated APCs were significantly suppressed in EAU (Fig. 4D). The conversion pathway of ATP into adenosine is necessary for the post‐EAU regulatory APCs to activate Tregs [4]. To show that α‐MSH‐treated APCs need the adenosine‐generating pathway to induce Tregs, the APCs from CD73(−/−) mice were treated with α‐MSH, pulsed with antigen, and used in the adoptive transfer assay. The T cells stimulated with α‐MSH‐treated or untreated CD73(−/−) APCs showed no significant ability to suppress EAU (Fig. 4E and F). These observations showed that α‐MSH stimulates APCs to induce Tregs, and this melanocortin‐driven activity is dependent on CD73 expression by the APCs and the adenosine receptor A2Ar on the T cells.
Figure 4.
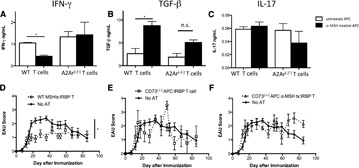
In vitro treatment of APCs with α‐MSH promotes APC stimulation of iTregs. IRBP‐specific T cells were prepared by enriching T cells from the popliteal lymph nodes of wild‐type or A2Ar(−/−) mice 1 wk after injection of IRBP/CFA into the foot pad. APCs from the spleen of unimmunized wild‐type or CD73(−/−) mice were incubated, with or without α‐MSH, pulsed with antigen, and incubated for 48 h. The treated APCs were washed, mixed with the IRBP‐specific T cells, and incubated for another 48 h. (A–C) Supernatants were collected from cultures containing wild‐type APCs and either wild‐type IRBP‐specific T cells or A2Ar(−/−) IRBP‐specific T cells. Supernatants were assayed for (A) IFN‐γ, (B) TGF‐β, or (C) IL‐17. Cells were collected and transferred to recipient mice immunized for EAU. (D–F) Graphs are the EAU scores of recipient mice and of recipient mice immunized for EAU. The cells used for adoptive transfer experiments were wild‐type IRBP‐specific T cells activated by wild‐type APCs treated with (D) α‐MSH (n = 19), (E) wild‐type IRBP‐specific T cells activated by CD73(−/−) APCs (n = 4), and (F) wild‐type IRBP‐specific T cells activated by CD73(−/−) APCs treated with α‐MSH (n = 7). *P ≤ 0.05; significantly different from control cells, by (A–C) 1‐way ANOVA with Bonferroni post hoc analysis or (D–F) 2‐way ANOVA.
In vitro α‐MSH‐treated APCs induce PD‐1+ iTregs
To see whether the in vitro‐generated melanocortin‐driven Tregs are the same as the in vivo generated post‐EAU Tregs, IRBP‐specific Teffs were restimulated by untreated and treated APCs and stained for CD4, CD25, NRP‐1, and PD‐1. Most of the NRP‐1− cells stimulated by untreated and α‐MSH‐treated APCs were PD‐1+ ( Fig. 5A and B ). When the T cells activated by α‐MSH‐treated APCs were sorted for NRP‐1 expression, the NRP‐1− Tregs suppressed EAU in the recipient mice (Supplemental Fig. 1). We next sorted the NRP‐1− T cells activated by α‐MSH‐treated APCs for PD‐1 expression to determine whether the Tregs were PD‐1+. The mice that received the PD‐1− iTreg subset induced by the α‐MSH‐treated APCs showed a course of EAU identical to that of the mice that received no transfer of cells (Fig. 5C). In contrast, the mice that received the PD‐1+ iTreg subset activated by α‐MSH‐treated APCs showed a significant suppression of EAU compared to that in the mice that received no transfer of cells (Fig. 5D). These observations indicate that the α‐MSH‐treated APCs generate PD‐1+ iTregs that suppress autoimmune disease.
Figure 5.
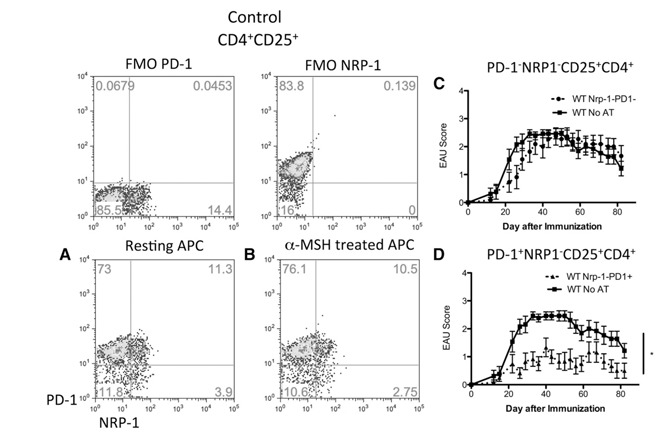
In vitro α‐MSH‐treated APCs induce Tregs that are similar to the in vivo post‐EAU iTregs. Tregs were generated by activating IRBP‐specific T cells with α‐MSH‐treated APCs, as described in Fig. 1. In vitro induced Tregs were stained for CD4, CD25, NRP‐1, and PD‐1. Graphs are gated on CD25+CD4+ T cells. NRP‐1 expression: x‐axis; PD‐1 expression: y‐axis. FMO controls are included to indicate the gating strategy for PD‐1 and NRP‐1. (A) Resting APCs were used to activate wild‐type IRBP‐specific T cells or the APCs were treated with (B) α‐MSH and used to activate wild‐type IRBP‐specific T cells. In vitro induced Tregs were sorted and transferred to mice immunized for EAU. The EAU scores for mice that received (C) PD‐1−NRP‐1−CD25+CD4+ T cells (n = 11) or (D) PD‐1+NRP‐1−CD25+CD4+ T cells (n = 12). *P ≤ 0.05; significantly different from control cells, by 2‐way ANOVA.
iTregs function though the PD‐1/PD‐L1 pathway
In that the Tregs are PD‐1+PD‐L1+, we asked whether the PD‐1/PD‐L1 pathway is necessary for suppression of Teffs. IRBP‐specific CD4+ T cells were restimulated for 48 h by α‐MSH‐treated splenic APCs and sorted for PD‐1+ iTregs. The sorted iTregs were added to wells seeded with untreated APCs pulsed with IRBP, and IRBP‐specific CD4+ responder T cells were added at a 1:1 ratio of Tregs to Teff cells. The responder cells were preincubated with or without the addition of PD‐1‐blocking antibody. Supernatants from the coculture were collected after 48 h and assayed for TGF‐β, IL‐17, and IFN‐γ. When responder Teffs were incubated alone, there was no significant change in cytokine production (Supplemental Fig. 2). The coculture of Tregs with responder Teffs showed significantly lower IFN‐γ production compared to that of responder Teffs cultured alone ( Fig. 6A ). There was no significant difference in TGF‐β production, but it trended lower in cultures with Teffs alone (Fig. 6B). There was no detectible IL‐17 in any of the in vitro cultures (data not shown). When sorted, the iTregs were cocultured with Teffs that were preincubated with PD‐1‐blocking antibody, the production of IFN‐γ was significantly higher, with TGF‐β production significantly lower compared to that in cultures where the Teffs were not preincubated with PD‐1‐blocking antibody (Fig. 6C and D). This result demonstrated that the iTregs induced by melanocortin‐activated APCs suppress other Teffs in a PD‐1/PD‐L1‐pathway‐dependent manner.
Figure 6.
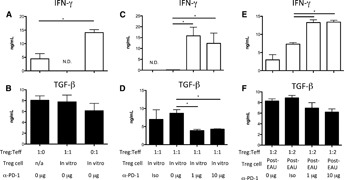
PD‐1 is required for iTreg suppression of Teffs. IRBP‐specific T cells from immunized mice and from post‐EAU spleens were activated by naive splenic APCs pretreated with α‐MSH for 48 h. After the T cells were activated, they were sorted for PD‐1+ iTregs and cocultured with CD4+ IRBP‐specific responder T cells and splenic APCs with IRBP for 48 h. Responder T cells were incubated with 0, 1, or 10 μg of α‐PD‐1‐blocking antibody or isotype antibody (Iso); washed twice; and incubated with the sorted Tregs. (A, B) Responder T cells were cultured alone, iTregs were cultured alone, and responder and iTregs were cultured together. Responder T cells are cocultured with (C, D) iTregs or (E, F) post‐EAU Tregs with 0, 1, or 10 μg of α‐PD‐1‐blocking antibody or isotype antibody. After the 48 h incubation, supernatants were collected and assayed for (A, C, E) IFN‐γ and (B, D, F) TGF‐β. N.D., not detectable. *P ≤ 0.05; significantly different from control cells, by 1‐way ANOVA with Bonferroni post hoc analysis.
We next asked if the in vivo post‐EAU Tregs function through the PD‐1/PD‐L1 pathway to suppress the responder Teffs. Post‐EAU Tregs were collected from wild‐type mice and sorted for PD‐1+ NRP‐1− CD25+ CD4+ Tregs. As above, the responder Teffs were preincubated with or without PD‐1‐blocking antibody before being added to the cocultures. The post‐EAU Treg‐to‐responder Teff ratio was 1:2. The supernatants were collected from the coculture after 48 h and assayed for TGF‐β and IFN‐γ. When the Teff cells were preincubated with PD‐1‐blocking antibody, there was significantly more IFN‐γ production (Fig. 6E), and TGF‐β production (Fig. 6F) trended lower when the PD‐1‐blocking antibody was used, but levels were not significantly different. This result indicates that the iTregs from post‐EAU mice also function in a PD‐1/PD‐L1‐pathway‐dependent manner.
DISCUSSION
We have shown that mice that recover from EAU require MC5r and A2Ar expression to induce the post‐EAU regulatory immunity found in the spleen that provides resistance to EAU [3, 4–5]. The expression of MC5r is required for expansion of a regulatory APC, and the expression of A2Ar by the T cells is required for the APC to induce the Treg [3, 4]. Our earlier work focused on the APC and how it produces adenosine to induce Tregs that suppress EAU [4]. In this work, we focused on the aspects of this post‐EAU regulatory immunity that are downstream of the melanocortin‐driven pathway, and we showed that the post‐EAU Treg is an iTreg and how it functions to suppress Teffs.
This work identified the post‐EAU Tregs as iTregs that express PD‐L1 and PD‐1. These cells are dependent on the PD‐1/PD‐L1 pathway for functional suppression. Although PD‐1 was expressed on post‐EAU splenic T cells from A2Ar(−/−) mice compared with its expression in wild‐type post‐EAU mice, we have shown, here and in prior work, that these cells are not Tregs [4]. Evidence of the PD‐1/PD‐L1 pathway in ocular immune privilege has been shown, with the observation that the CD4+ Tregs involved in anterior chamber–associated immune deviation express PD‐1 [33] and that PD‐1 is expressed on retinal neurons during EAU [34]. Treg expression of PD‐1 and suppression through this pathway also suggest that the induction of Tregs may be through the contraconversion model—a model described by Francisco et al. [22], whereby Teffs are stimulated through PD‐1 by PD‐L1 on the Tregs or on the APCs to both suppress inflammatory function and induce regulatory function. Furthermore, given that these Tregs are found in the spleen, it is possible that they further induce a regulatory immune response outside the eye. Since PD‐L1 is expressed in the eye [34, 35–36] it would follow that Teffs trafficking into the eye would be converted into Tregs as a mechanism for maintaining ocular immune privilege. Another mechanism of ocular immune privilege is the suppression by retinal pigmented epithelial cells of IL‐22 production of Th22 cells through the PD/PD‐L1 pathway [37].
Our published report showed that A2Ar stimulation on the T cell is necessary to promote Treg function [4], and in the current study, we showed that these Tregs express PD‐1. There is a possibility that stimulation of both PD‐1 and A2Ar are necessary to augment the intracellular signaling cascade of each other. There are reports in the literature that they both inhibit a similar intracellular signaling pathway [22, 38]. T cell activation through the TCR and coreceptor CD28 involves a signaling cascade through both ZAP70 and the AKT‐mTOR pathway. The intracellular portion of PD‐1 binds SHP‐1 and ‐2 [26, 39, 40], which then target ZAP70 and PI3K [22, 41]. A2Ar signaling increases cAMP to inhibit the AKT‐mTOR pathway, also at ZAP70 and PI3K [14, 38]. These findings show that these 2 receptors suppress T cell activation by targeting the same kinases, thus reinforcing the signal received by the other receptor. These 2 pathways may also act synergistically in the suppression of NF‐κB, given that A2Ar signaling and inhibition of the AKT‐mTOR pathway both have been demonstrated to down‐regulate NF‐κB [13, 42]. It has also been reported that A2Ar stimulation up‐regulates PD‐1 expression on Tregs in a kidney inflammation model and on Tregs associated with tumor survival [32, 43, 44–45], suggesting that both A2Ar and PD‐1 are necessary, because neither is sufficient to inhibit mTOR signaling to the extent that Treg function is induced, but the combined signals from both receptors is enough.
This work demonstrated that antigen‐specific iTregs can be generated by α‐MSH‐treated APCs, a process that has been shown to be mediated by adenosine and A2Ar stimulation on the T cells [4]. In addition, these new findings show that both Tregs from post‐EAU mice and those generated by α‐MSH‐treated APCs suppressed Teffs through the PD‐1/PD‐L1 pathway, suggesting an effective form of ex vivo treatment for human autoimmune uveitis. Autoreactive CD4+ T cells isolated from the blood of patients with uveitis could be stimulated with α‐MSH ex vivo and converted into iTregs with the cells reintroduced into the patient to suppress ocular inflammation. The current results demonstrated that the natural recovery of mice from EAU is associated with the emergence of iTregs induced by the melanocortin‐adenosinergic pathway, which prevents recall immunity to autoantigen and provides long‐term protection from the recurrence of EAU.
AUTHORSHIP
D.J.L. and A.W.T. are responsible for the conceptual design of the study and the writing of the manuscript. D.J.L. performed all the experiments and data analyses.
DISCLOSURE
The authors declare no conflict of interest.
Supporting information
Supplementary data
Supplementary data
Supplementary data
ACKNOWLEDGMENTS
The authors thank the Boston University Flow Cytometry Core facility for lending their expertise in sorting the various T cell populations isolated in this work and the Jiang‐Fen Chen Lab at Boston University School of Medicine for providing the A2Ar(−/−) mice and CD73(−/−) mice.
REFERENCES
- 1. Caspi, R.R. , Roberge, F.G. , Chan, C.C. , Wiggert, B. , Chader, G.J. , Rozenszajn, L.A. , Lando, Z. , Nussenblatt, R.B. (1988) A new model of autoimmune disease: experimental autoimmune uveoretinitis induced in mice with two different retinal antigens. J. Immunol. 140, 1490–1495. [PubMed] [Google Scholar]
- 2. Kitaichi, N. , Namba, K. , Taylor, A.W. (2005) Inducible immune regulation following autoimmune disease in the immune‐privileged eye. J. Leukoc. Biol. 77, 496–502. [DOI] [PMC free article] [PubMed] [Google Scholar]
- 3. Lee, D.J. , Taylor, A.W. (2011) Following EAU recovery there is an associated MC5r‐dependent APC induction of regulatory immunity in the spleen. Invest. Ophthalmol. Vis. Sci. 52, 8862–8867. [DOI] [PMC free article] [PubMed] [Google Scholar]
- 4. Lee, D.J. , Taylor, A.W. (2013) Both MC5r and A2Ar are required for protective regulatory immunity in the spleen of post‐experimental autoimmune uveitis in mice. J. Immunol. 191, 4103–4111. [DOI] [PMC free article] [PubMed] [Google Scholar]
- 5. Taylor, A.W. , Kitaichi, N. , Biros, D. (2006) Melanocortin 5 receptor and ocular immunity. Cell. Mol. Biol. (Noisy‐le‐grand) 52, 53–59. [PubMed] [Google Scholar]
- 6. Ernst, P.B. , Garrison, J.C. , Thompson, L.F. (2010) Much ado about adenosine: adenosine synthesis and function in regulatory T cell biology. J. Immunol. 185, 1993–1998. [DOI] [PMC free article] [PubMed] [Google Scholar]
- 7. Sitkovsky, M. , Lukashev, D. (2005) Regulation of immune cells by local‐tissue oxygen tension: HIF1 alpha and adenosine receptors. Nat. Rev. Immunol. 5, 712–721. [DOI] [PubMed] [Google Scholar]
- 8. Kaczmarek, E. , Koziak, K. , Sévigny, J. , Siegel, J.B. , Anrather, J. , Beaudoin, A.R. , Bach, F.H. , Robson, S.C. (1996) Identification and characterization of CD39/vascular ATP diphosphohydrolase. J. Biol. Chem. 271, 33116–33122. [DOI] [PubMed] [Google Scholar]
- 9. Antonioli, L. , Pacher, P. , Vizi, E.S. , Haskó, G. (2013) CD39 and CD73 in immunity and inflammation. Trends Mol. Med. 19, 355–367. [DOI] [PMC free article] [PubMed] [Google Scholar]
- 10. Zarek, P.E. , Huang, C.T. , Lutz, E.R. , Kowalski, J. , Horton, M.R. , Linden, J. , Drake, C.G. , Powell, J.D. (2008) A2A receptor signaling promotes peripheral tolerance by inducing T‐cell anergy and the generation of adaptive regulatory T cells. Blood 111, 251–259. [DOI] [PMC free article] [PubMed] [Google Scholar]
- 11. Ohta, A. , Kini, R. , Ohta, A. , Subramanian, M. , Madasu, M. , Sitkovsky, M. (2012) The development and immunosuppressive functions of CD4(+) CD25(+) FOXP3(+) regulatory T cells are under influence of the adenosine‐A2A adenosine receptor pathway. Front. Immunol. 3, 190. [DOI] [PMC free article] [PubMed] [Google Scholar]
- 12. Blackburn, M.R. , Vance, C.O. , Morschl, E. , Wilson, C.N. (2009) Adenosine receptors and inflammation. In Handb Exp Pharmacol, (C. N. Wilson, S. J. Mustafa, eds.), 193, 215–269. [DOI] [PubMed] [Google Scholar]
- 13. Romio, M. , Reinbeck, B. , Bongardt, S. , Hüls, S. , Burghoff, S. , Schrader, J. (2011) Extracellular purine metabolism and signaling of CD73‐derived adenosine in murine Treg and Teffs. Am. J. Physiol. Cell Physiol. 301, C530–C539. [DOI] [PubMed] [Google Scholar]
- 14. Sevigny, C.P. , Li, L. , Awad, A.S. , Huang, L. , McDuffie, M. , Linden, J. , Lobo, P.I. , Okusa, M.D. (2007) Activation of adenosine 2A receptors attenuates allograft rejection and alloantigen recognition. J. Immunol. 178, 4240–4249. [DOI] [PubMed] [Google Scholar]
- 15. Bluestone, J.A. , Abbas, A.K. (2003) Natural versus adaptive regulatory T cells. Nat. Rev. Immunol. 3, 253–257. [DOI] [PubMed] [Google Scholar]
- 16. Bilate, A.B. , Lafaille, J.J. (2011) It takes two to tango. Immunity 35, 6–8. [DOI] [PubMed] [Google Scholar]
- 17. Haribhai, D. , Williams, J.B. , Jia, S. , Nickerson, D. , Schmitt, E.G. , Edwards, B. , Ziegelbauer, J. , Yassai, M. , Li, S.H. , Relland, L.M. , Wise, P.M. , Chen, A. , Zheng, Y.Q. , Simpson, P.M. , Gorski, J. , Salzman, N.H. , Hessner, M.J. , Chatila, T.A. , Williams, C.B. (2011) A requisite role for induced regulatory T cells in tolerance based on expanding antigen receptor diversity. Immunity 35, 109–122. [DOI] [PMC free article] [PubMed] [Google Scholar]
- 18. Curotto de Lafaille, M.A. , Lafaille, J.J. (2009) Natural and adaptive foxp3+ regulatory T cells: more of the same or a division of labor? Immunity 30, 626–635. [DOI] [PubMed] [Google Scholar]
- 19. Haribhai, D. , Lin, W. , Edwards, B. , Ziegelbauer, J. , Salzman, N.H. , Carlson, M.R. , Li, S.H. , Simpson, P.M. , Chatila, T.A. , Williams, C.B. (2009) A central role for induced regulatory T cells in tolerance induction in experimental colitis. J. Immunol. 182, 3461–3468. [DOI] [PMC free article] [PubMed] [Google Scholar]
- 20. Weiss, J.M. , Bilate, A.M. , Gobert, M. , Ding, Y. , Curotto de Lafaille, M.A. , Parkhurst, C.N. , Xiong, H. , Dolpady, J. , Frey, A.B. , Ruocco, M.G. , Yang, Y. , Floess, S. , Huehn, J. , Oh, S. , Li, M.O. , Niec, R.E. , Rudensky, A.Y. , Dustin, M.L. , Littman, D.R. , Lafaille, J.J. (2012) Neuropilin 1 is expressed on thymus‐derived natural regulatory T cells, but not mucosa‐generated induced + T reg cells. J. Exp. Med. 209, 1723–1742, S1. [DOI] [PMC free article] [PubMed] [Google Scholar]
- 21. Yadav, M. , Louvet, C. , Davini, D. , Gardner, J.M. , Martinez‐Llordella, M. , Bailey‐Bucktrout, S. , Anthony, B.A. , Sverdrup, F.M. , Head, R. , Kuster, D.J. , Ruminski, P. , Weiss, D. , Von Schack, D. , Bluestone, J.A. (2012) Neuropilin‐1 distinguishes natural and inducible regulatory T cells among regulatory T cell subsets in vivo. J. Exp. Med. 209, 1713–1722, S1–S19. [DOI] [PMC free article] [PubMed] [Google Scholar]
- 22. Francisco, L.M. , Sage, P.T. , Sharpe, A.H. (2010) The PD‐1 pathway in tolerance and autoimmunity. Immunol. Rev. 236, 219–242. [DOI] [PMC free article] [PubMed] [Google Scholar]
- 23. Riella, L.V. , Paterson, A.M. , Sharpe, A.H. , Chandraker, A. (2012) Role of the PD‐1 pathway in the immune response. Am. J. Transplant. 12, 2575–2587. [DOI] [PMC free article] [PubMed] [Google Scholar]
- 24. Agata, Y. , Kawasaki, A. , Nishimura, H. , Ishida, Y. , Tsubata, T. , Yagita, H. , Honjo, T. (1996) Expression of the PD‐1 antigen on the surface of stimulated mouse T and B lymphocytes. Int. Immunol. 8, 765–772. [DOI] [PubMed] [Google Scholar]
- 25. Parry, R.V. , Chemnitz, J.M. , Frauwirth, K.A. , Lanfranco, A.R. , Braunstein, I. , Kobayashi, S.V. , Linsley, P.S. , Thompson, C.B. , Riley, J.L. (2005) CTLA‐4 and PD‐1 receptors inhibit T‐cell activation by distinct mechanisms. Mol. Cell. Biol. 25, 9543–9553. [DOI] [PMC free article] [PubMed] [Google Scholar]
- 26. Chemnitz, J.M. , Parry, R.V. , Nichols, K.E. , June, C.H. , Riley, J.L. (2004) SHP‐1 and SHP‐2 associate with immunoreceptor tyrosine‐based switch motif of programmed death 1 upon primary human T cell stimulation, but only receptor ligation prevents T cell activation. J. Immunol. 173, 945–954. [DOI] [PubMed] [Google Scholar]
- 27. Fife, B.T. , Pauken, K.E. (2011) The role of the PD‐1 pathway in autoimmunity and peripheral tolerance. Ann. N. Y. Acad. Sci. 1217, 45–59. [DOI] [PubMed] [Google Scholar]
- 28. Greaves, P. , Gribben, J.G. (2013) The role of B7 family molecules in hematologic malignancy. Blood 121, 734–744. [DOI] [PMC free article] [PubMed] [Google Scholar]
- 29. Namba, K. , Kitaichi, N. , Nishida, T. , Taylor, A.W. (2002) Induction of regulatory T cells by the immunomodulating cytokines alpha‐melanocyte‐stimulating hormone and transforming growth factor‐beta2. J. Leukoc. Biol. 72, 946–952. [PubMed] [Google Scholar]
- 30. Kawanaka, N. , Taylor, A.W. (2011) Localized retinal neuropeptide regulation of macrophage and microglial cell functionality. J. Neuroimmunol. 232, 17–25. [DOI] [PMC free article] [PubMed] [Google Scholar]
- 31. Taylor, A.W. , Alard, P. , Yee, D.G. , Streilein, J.W. (1997) Aqueous humor induces transforming growth factor‐beta (TGF‐beta)‐producing regulatory T‐cells. Curr. Eye Res. 16, 900–908. [DOI] [PubMed] [Google Scholar]
- 32. Kinsey, G.R. , Huang, L. , Jaworska, K. , Khutsishvili, K. , Becker, D.A. , Ye, H. , Lobo, P.I. , Okusa, M.D. (2012) Autocrine adenosine signaling promotes regulatory T cell‐mediated renal protection. J. Am. Soc. Nephrol. 23, 1528–1537. [DOI] [PMC free article] [PubMed] [Google Scholar]
- 33. Meng, Q. , Yang, P. , Li, B. , Zhou, H. , Huang, X. , Zhu, L. , Ren, Y. , Kijlstra, A. (2006) CD4+PD‐1+ T cells acting as regulatory cells during the induction of anterior chamber‐associated immune deviation. Invest. Ophthalmol. Vis. Sci. 47, 4444–4452. [DOI] [PubMed] [Google Scholar]
- 34. Chen, L. , Pai, V. , Levinson, R. , Sharpe, A.H. , Freeman, G.J. , Braun, J. , Gordon, L.K. (2009) Constitutive neuronal expression of the immune regulator, programmed death 1 (PD‐1), identified during experimental autoimmune uveitis. Ocul. Immunol. Inflamm. 17, 47–55. [DOI] [PubMed] [Google Scholar]
- 35. Sugita, S. , Usui, Y. , Horie, S. , Futagami, Y. , Aburatani, H. , Okazaki, T. , Honjo, T. , Takeuchi, M. , Mochizuki, M. (2009) T‐cell suppression by programmed cell death 1 ligand 1 on retinal pigment epithelium during inflammatory conditions. Invest. Ophthalmol. Vis. Sci. 50, 2862–2870. [DOI] [PubMed] [Google Scholar]
- 36. Sugita, S. , Usui, Y. , Horie, S. , Futagami, Y. , Yamada, Y. , Ma, J. , Kezuka, T. , Hamada, H. , Usui, T. , Mochizuki, M. , Yamagami, S. (2009) Human corneal endothelial cells expressing programmed death‐ligand 1 (PD‐L1) suppress PD‐1+ T helper 1 cells by a contact‐dependent mechanism. Invest. Ophthalmol. Vis. Sci. 50, 263–272. [DOI] [PubMed] [Google Scholar]
- 37. Sugita, S. , Kawazoe, Y. , Imai, A. , Usui, Y. , Takahashi, M. , Mochizuki, M. (2013) Suppression of IL‐22‐producing T helper 22 cells by RPE cells via PD‐L1/PD‐1 interactions. Invest. Ophthalmol. Vis. Sci. 54, 6926–6933. [DOI] [PubMed] [Google Scholar]
- 38. Cekic, C. , Sag, D. , Day, Y.J. , Linden, J. (2013) Extracellular adenosine regulates naive T cell development and peripheral maintenance. J. Exp. Med. 210, 2693–2706. [DOI] [PMC free article] [PubMed] [Google Scholar]
- 39. Riley, J.L. (2009) PD‐1 signaling in primary T cells. Immunol. Rev. 229, 114–125. [DOI] [PMC free article] [PubMed] [Google Scholar]
- 40. Okazaki, T. , Maeda, A. , Nishimura, H. , Kurosaki, T. , Honjo, T. (2001) PD‐1 immunoreceptor inhibits B cell receptor‐mediated signaling by recruiting src homology 2‐domain‐containing tyrosine phosphatase 2 to phosphotyrosine. Proc. Natl. Acad. Sci. USA 98, 13866–13871. [DOI] [PMC free article] [PubMed] [Google Scholar]
- 41. Dai, S. , Jia, R. , Zhang, X. , Fang, Q. , Huang, L. (2014) The PD‐1/PD‐Ls pathway and autoimmune diseases. Cell. Immunol. 290, 72–79. [DOI] [PubMed] [Google Scholar]
- 42. Bruzzese, L. , Fromonot, J. , By, Y. , Durand‐Gorde, J.M. , Condo, J. , Kipson, N. , Guieu, R. , Fenouillet, E. , Ruf, J. (2014) NF‐κB enhances hypoxia‐driven T‐cell immunosuppression via upregulation of adenosine A(2A) receptors. Cell. Signal. 26, 1060–1067. [DOI] [PubMed] [Google Scholar]
- 43. Allard, B. , Pommey, S. , Smyth, M.J. , Stagg, J. (2013) Targeting CD73 enhances the antitumor activity of anti‐PD‐1 and anti‐CTLA‐4 mAbs. Clin. Cancer Res. 19, 5626–5635. [DOI] [PubMed] [Google Scholar]
- 44. Mittal, D. , Young, A. , Stannard, K. , Yong, M. , Teng, M.W. , Allard, B. , Stagg, J. , Smyth, M.J. (2014) Antimetastatic effects of blocking PD‐1 and the adenosine A2A receptor. Cancer Res. 74, 3652–3658. [DOI] [PubMed] [Google Scholar]
- 45. Sitkovsky, M.V. , Hatfield, S. , Abbott, R. , Belikoff, B. , Lukashev, D. , Ohta, A. (2014) Hostile, hypoxia‐A2‐adenosinergic tumor biology as the next barrier to overcome for tumor immunologists. Cancer Immunol. Res. 2, 598–605. [DOI] [PMC free article] [PubMed] [Google Scholar]
Associated Data
This section collects any data citations, data availability statements, or supplementary materials included in this article.
Supplementary Materials
Supplementary data
Supplementary data
Supplementary data