

Short abstract
Dietary Trp restriction linked to B cell development in BM and gut microbial composition.
Keywords: bone marrow, gut microbiota, hematopoiesis, proliferation
Abstract
With aging, tryptophan metabolism is affected. Tryptophan has a crucial role in the induction of immune tolerance and the maintenance of gut microbiota. We, therefore, studied the effect of dietary tryptophan restriction in young wild‐type (WT) mice (118‐wk life span) and in DNA‐repair deficient, premature‐aged (Ercc1−/Δ7) mice (20‐wk life span). First, we found that the effect of aging on the distribution of B and T cells in bone marrow (BM) and in the periphery of 16‐wk‐old Ercc1−/Δ7 mice was comparable to that in 18‐mo‐old WT mice. Dietary tryptophan restriction caused an arrest of B cell development in the BM, accompanied by diminished B cell frequencies in the periphery. In general, old Ercc1−/Δ7 mice showed similar responses to tryptophan restriction compared with young WT mice, indicative of age‐independent effects. Dietary tryptophan restriction increased microbial diversity and made the gut microbiota composition of old Ercc1−/Δ7 mice more similar to that of young WT mice. The decreased abundances of Alistipes and Akkermansia spp. after dietary tryptophan restriction correlated significantly with decreased B cell precursor numbers. In conclusion, we report that dietary tryptophan restriction arrests B cell development and concomitantly changes gut microbiota composition. Our study suggests a beneficial interplay between dietary tryptophan, B cell development, and gut microbial composition on several aspects of age‐induced changes.
Abbreviations
- BM
bone marrow
- Ercc1
excision repair cross‐complementation group 1
- FO
follicular
- FSC
forward light scatter
- FVB
Friend virus B
- MLN
mesenteric lymph node
- MZ
marginal zone
- NAMPT
nicotinamide phosphoribosyltransferase
- PD
phylogenetic diversity
- PP
Peyer's patch
- RDA
redundancy analysis
- SP
single positive
- Treg
regulatory T cell
- TN
triple negative
- TrpR
tryptophan‐restricted/restriction
- WT
wild‐type
- XPF
xeroderma pigmentosum group F
Introduction
With age, hematopoietic stem cells acquire defects [1, 2] and do not efficiently generate lymphoid cells, whereas relatively more myeloid cells are generated [3, 4]. Furthermore, thymus and BM involute, and long‐lived B cells accumulate with age, leading to decreased T and B cell production [3, 5, 6]. This immunologic decline coincides with gut microbiota composition changes, with, for example, an age‐related decline in Akkermansia spp. abundance [7]. Immunosenescence induces low‐grade inflammation, also known as inflammaging [8, 9–10].
It is known that calorie restriction is associated with life span extension [11], but its effects on immunity are the subject of few studies. Tryptophan is involved in the induction of immune tolerance [12], and its breakdown is gradually enhanced during aging [13]. It is also increased in several autoimmune and neurodegenerative diseases [14, 15]. Tryptophan is, therefore, an important target ingredient to study the effect of nutrient restriction on immunosenescence. Tryptophan is mainly metabolized by IDO, leading to production of kynurenine, and is, in addition to being involved in immune tolerance, also essential for maintenance of microbiota diversity [16, 17]. Decreased serum levels of tryptophan and increased serum levels of kynurenine, suggestive of increased IDO activity, have been observed in elderly people and were associated with elevated inflammatory markers, such as IL‐6 [18]. Dietary TrpR has been associated with delay of the aging process and longer life spans in rats [19, 20] and mice [21], but it is unclear what the effect is on immunity and gut microbiota.
The effects of aging can be accelerated by multiple factors [22]. Several mouse models exist that display features of accelerated aging and expedite research on dietary components for healthy aging. Based on a variety of histologic, functional, metabolomic, and proteomic data, it has been concluded that the accelerated aging Ercc1−/Δ7 mouse model resembles multiple characteristics of normal murine aging [23]. The ERCC1 protein is involved in at least 3 repair processes: transcription‐coupled repair, global genome nucleotide excision repair, and interstrand cross‐link repair (and likely subpathways of double‐strand break repair) [24]. Ercc1−/Δ7 mice are deficient for fully functional ERCC1 protein. The mice have a mutated allele, encoding a protein lacking the last 7 amino acids of the protein. Because of the lack of the last amino acids, the interaction between ERCC1 and XPF is less stable, and the free proteins are, therefore, more quickly degraded. Consequently, the expression of ERCC1‐XPF DNA repair endonuclease is reduced to about 5% compared with that of WT mice [23]. Less ERCC1 protein activity leads to increased accumulation of (primarily endogenous) DNA damage and, consequently, enhanced mutation, cellular senescence, and cell death. This results in an accelerated aging phenotype with a life span of ∼20 wk (compared with ∼118 wk in WT mice) [25, 26]. A recent review pointed out that Ercc1−/Δ7 mice have the broadest spectrum of age‐related pathologies and that they could be useful in the fast screening of interventions to reduce age‐related pathology [27].
The aim of this study was to investigate the effects of dietary TrpR on immunity and gut microbiota in WT mice and in Ercc1−/Δ7 mice as a model for aging. Before testing the effect of dietary TrpR, the cellular composition of the immune system of Ercc1−/Δ7 mice was evaluated and compared with the aging immune system of WT mice. Because it is well known that aging causes a decline in B cell precursors in BM [28] and T cell precursors in thymus [29, 30] and affects their subsequent distribution in the periphery [30, 31], we focused on these cell populations. We found, in particular, that B cells were affected by long‐term TrpR and that this effect might be linked with the abundance of specific gut microbes.
MATERIALS AND METHODS
Mice and genotyping
Female C57Bl/6J mice (3 or 17 mo old) were ordered from ENVIGO (Horst, The Netherlands). Ercc1−/Δ7 and Ercc1+/+ mice (C57Bl6/FVB F1 hybrid genetic background) were bred in the animal facility of the Erasmus University Medical Centre (Rotterdam, The Netherlands). The mice were housed in a specific–pathogen‐free environment in individually ventilated cages in the animal facility of Wageningen University (Wageningen, The Netherlands) or in the animal facility of the Erasmus University Medical Centre for the dietary tryptophan‐restriction experiment. Mice had ad libitum access to AIN93G diet (Research Diets, Wijk bij Duurstede, The Netherlands), unless otherwise stated. The generation and genotyping of Ercc1−/Δ7 mice has been previously described [25, 26]. All mice were sacrificed at indicated times (6 wk, 16 wk, or 18 mo of age). Experiments were conducted with the approval of the animal care and use committee of Wageningen University or Erasmus University Medical Centre. Two types of control mice were used in this study, C57Bl/6J mice for the first part of the study and mixed genetic background mice (half C57Bl/6J) for the second part of the study. Given the overlap in genetic background and for reasons of clarity, both C57Bl6/J and Ercc1+/+ mice are presented as WT. Typical unfavorable characteristics, such as blindness in an FVB background or deafness in a C57BL6/J background, do not occur in this hybrid background. Mice with a mixed genetic background (2 or 24 mo old) were included to compare differences between genetic backgrounds.
Dietary TrpR
Diet with 95% reduction in tryptophan (hereafter named TrpR) was produced by Research Diets with the ingredients of the synthetic AIN93G diet as the basis. The total amount of casein (protein source) was reduced from 200 g/kg diet to 10 g/kg diet. All individual amino acids, except tryptophan, were supplemented back to their original levels, taking into account the purity of each amino acid. Control animals received food similarly reduced in casein but with the addition of all amino acids, including tryptophan. Directly after weaning, at 4 wk of age, the animals were divided into the different groups and were given food with or without lower tryptophan levels. Because the mice on TrpR ate approximately 10% less food compared with control animals, all control animals received 10% dietary restriction for the entire experimental period.
Organ collection and flow cytometry
BM, spleen, MLN, PP, and thymus were collected for flow cytometric purposes. PBS lavage of peritoneal cavity was performed to obtain peritoneal cells, which were filtered with a 40‐µm cell strainer. Single‐cell suspensions of BM were obtained by crushing bones with mortar and pestle. Cells were then filtered with a 40‐µm cell strainer. Spleen, MLN, PP, and thymus single‐cell suspensions were obtained by gently forcing cells with a syringe through a 40‐µm cell strainer. Cells were counted using a Z1 Coulter Counter (Beckman Coulter, Fullerton, CA, USA). At least 0.5–2 × 10⁶ cells were stained with Aqua live/dead Efluor506 (eBioscience, San Diego, CA, USA) stain and for extracellular markers; after which, intracellular staining was performed by fixing and permeabilizing cells with Fix/Perm buffer (eBioscience) according to manufacturer's instructions. Antibodies used are listed in Supplemental Table 1. Stained cells were analyzed on a FACSCanto II (BD Biosciences, Erembodegem, Belgium). FlowJo version X.07 software (Tree Star, Ashland, OR, USA) was used for data analysis. Doublets were excluded using FSC‐A and FSC‐H parameters.
16S sequencing
Feces were used for 16S rRNA gene analysis for microbiota profiling. DNA extraction was performed using a combination of the bead‐beating plus column method and the Maxwell 16 Tissue LEV Total RNA purification kit (Promega, Madison, WI, USA). Beating of the fecal pellets took place as previously described [32], but with STAR (stool transport and recovery) buffer (Roche Diagnostics USA, Indianapolis, IN, USA). After centrifugation, 250 µl supernatant was taken for the Maxwell 16 Tissue LEV Total RNA Purification Kit, and the DNA was eluted in 50 µl DNase‐free water. For amplification of the 16S rRNA gene, 20 ng of DNA was used with primers 27F‐DegS and 338R I + 338R II for 25 cycles as previously described [33]; only primers had UniTag linkers attached: UniTag I (forward) and II (reverse) (I: GAGCCGTAGCCAGTCTGC; II: GCCGTGACCGTGACATCG). The size of the PCR products (∼375 bp) was confirmed by gel electrophoresis using 5 μl of the amplification reaction mixture on a 1% (w/v) agarose gel containing 1× SYBR Safe (Thermo Fisher Scientific, Waltham, MA, USA). To add adaptors, 5 µl of these PCR products were taken and an 8‐nt, sample‐specific barcode was added in an additional 5‐cycle PCR amplification. PCR products were purified with magnetic beads (MagBio Genomics, Gaithersburg, MD, USA) according to the HighPrep protocol of the manufacturer's instructions and quantified using Qubit (Thermo Fisher Scientific). Purified PCR products were mixed in approximately equimolar amounts and concentrated by magnetic beads similar to the previous purification. Purified amplicon pools were 250‐bp, paired‐end sequenced using Illumina Miseq (GATC Biotech, Konstanz, Germany).
The Illumina Miseq data analysis was carried out with a workflow employing the Quantitative Insights Into Microbial Ecology (QIIME) pipeline [34] and a set of in‐house scripts, as previously described (unpublished results) for Illumina Hiseq 16S rRNA gene sequences. The set of in‐house scripts processed the reads as follows: reads were filtered for barcodes that did not match; OTU picking and chimera removal were performed by matching the sequences to the Silva 111 database, with only one mismatch allowed, to a BIOM (biological observation matrix), with ClustalW—a multiple alignment and phylogenetic tree file. Further outputs were generated via QIIME, such as filtered reads per sample, PD whole‐tree diversity measurements, and the level 1 to 6 taxonomic distributions with relative abundances.
Statistical analysis
Values are expressed as means ± sem. Statistical comparisons were performed using the 2‐tailed Student's t test. We applied the nonparametric Mann‐Whitney U test if no normal distribution was found using the Kolmogorov‐Smirnov test. Where no equal variances were observed, we applied the 2‐tailed Student's t test with Welch's correction. Correlations were determined by Spearman's rank correlation. GraphPad Prism (version 5.0.3; La Jolla, CA, USA) was used to perform statistical tests. The microbial composition analysis was performed in Canoco 5.0, where variables were tested for their significance by the Monte Carlo permutation. Differences in microbial genera (L6) were compared using the Wilcoxon test. Values of P < 0.05 were considered statistically significant. Significant differences are indicated by asterisks: *P < 0.05; **P < 0.01; ***P < 0.001.
RESULTS
Ercc1−/Δ7 mice show an accelerated process of aging because of deficiency in DNA‐repair capacity [27]. We compared the aging process of Ercc1−/Δ7 mice (6 wk vs. 16 wk) with WT controls (16 wk vs. 18 mo). Information on body weights, organ weights, and organ counts are summarized in Supplemental Table 2. Except for a difference in splenic monocyte numbers with age, no abnormalities were observed in erythroid or myeloid cells (Supplemental Fig. 1D).
B and T cell precursors decrease, and memory T cells and Tregs increase, with aging
To determine the effects of age on B cells, we first studied the distribution of total B lineage cells (CD19+CD45R+) in BM by flow cytometry. The numbers of B lineage cells tended to decrease with age but did not reach significance ( Fig. 1B ). B cell precursor frequencies and numbers were reduced, both in aged WT (P < 0.05) and in 16‐wk‐old Ercc1−/Δ7 mice (P < 0.001; Fig. 1A). Immature B cell frequencies were slightly increased in aged WT mice (P < 0.05; Fig. 1A) but were unaltered in numbers (Fig. 1B). Mature B cell frequencies were significantly increased in the BM of aged Ercc1−/Δ7 mice but not in WT mice (Fig. 1A). Mature B cell counts in WT were not increased with age, whereas they were increased in aged Ercc1−/Δ7 mice (P < 0.05; Fig. 1B). No major effects were observed in periphery (spleen, MLN, PP), except for a significant age‐dependent increase in B cell frequencies in MLN (Supplemental Fig. 1E). To validate the effect of the difference in genetic background on B cell development between C57Bl/6 and C57Bl/6 × FVB F1 mice, we compared young and old F1 mice (2 mo vs. 24 mo) and identified similar changes in B cell development in the BM, with a decrease primarily in B cell precursors (P < 0.05; Supplemental Fig. 1C). In the spleen, no significant changes were observed in B cell numbers between old F1 mice and young F1 mice (Supplemental Fig. 1F).
Figure 1.
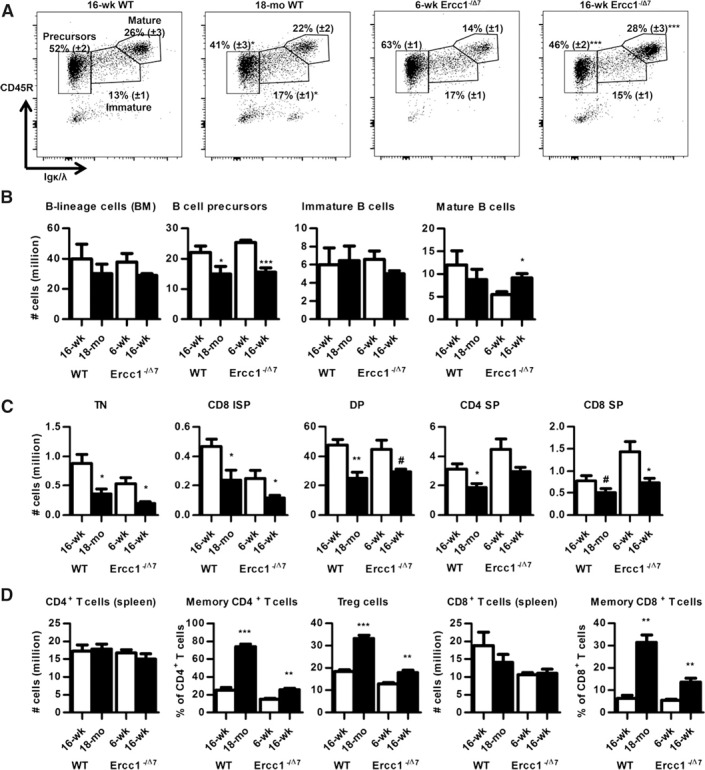
Aging reduces B and T cell precursors in WT and Ercc1−/Δ7 mice and increases memory T cells and Treg cells. (A) Flow cytometric analysis of B lineage cells in BM. Live, single, CD19+ cells were gated for Igκ/λ and CD45R to distinguish Igκ/λ−CD45R+ B cell precursors from Igκ/λ+CD45R+ immature and Igκ/λ+CD45Rhi mature B cells. A representative example from each group is shown, with means ± sem for the frequencies of gated populations within CD19+ BM cells. (B) Mean absolute numbers of total B lineage cells, B cell precursors, and immature and mature B cells were determined by flow cytometry. BM counts based on 2 femurs, 2 tibias, 2 iliac crests, and the sternum. (C) Mean counts of TN (Lin−CD3−CD4−CD8−) cells, CD8 ISP (Lin−CD3−CD8+CD69−), DP (Lin−CD3−/loCD4+CD8+), CD4 SP (Lin−CD3+CD4+CD8−), and CD8 SP (Lin−CD3+CD4−CD8+) cells with aging. Lineage (Lin) cocktail consisted of CD11b, CD11c, CD19, CD45R, NK1.1, and TER‐119. D) Mean counts of CD4+ T cells and CD8+ T cells, and mean frequencies of memory CD4+ T cells (CD44hiCD62L−), Tregs (FoxP3+), and memory CD8+ T cells (CD44hiCD62L−) in spleen. Data represent n = 6 mice, expressed as means ± sem. # P < 0.1; *P < 0.05; **P < 0.01; ***P < 0.001.
Next, we studied the effect of aging on T cell differentiation. Thymus weights decreased with age, accompanied by reduced cellularity in WT mice as well as in Ercc1−/Δ7 mice (P < 0.01; Supplemental Table 2). Numbers of Lin−CD3−CD4−CD8− TN cells, Lin−CD3−CD8+CD69− ISP cells, Lin−CD3+CD4+CD8− SP cells, and Lin−CD3+CD4−CD8+ SP cells were (in most cases significantly) reduced in a similar magnitude in normal‐aged WT and accelerated‐aged Ercc1−/Δ7 mice (Fig. 1C).
In spleen, neither CD4+ nor CD8+ T cell numbers changed with age in Ercc1−/Δ7 mice (Fig. 1D). We found decreased frequencies of CD44−/loCD62L+ naïve CD4+ (P < 0.05; data not shown) and increased frequencies of CD62L−CD44hi memory CD4+ (P < 0.01), memory CD8+ T cells (P < 0.01), and CD4+FoxP3+ Treg (P < 0.01) in spleens of aged WT and Ercc1−/Δ7 mice (Fig. 1D). Naïve CD8+ T cell frequencies decreased in aged WT mice only (P < 0.001; data not shown).
In MLN, we found decreased CD4+ T cell frequencies with aging (P < 0.01). Alterations in distribution within CD4+ T cells were similar to those in spleen (Supplemental Fig. 1E). Frequencies of total CD8+ T cells decreased and frequencies of memory CD8+ T cells increased in aged WT mice (P < 0.001 and P < 0.01, respectively), but not in Ercc1−/Δ7 mice (Supplemental Fig. 1E).
Collectively, these data indicate that the effect of aging on B and T cell precursors in 16‐wk‐old Ercc1−/Δ7 mice is for the most part similar to that of WT aging mice. Furthermore, alterations in distribution of T cells in the periphery are, to a large extent, similarly present in WT and Ercc1−/Δ7 mice.
Dietary TrpR arrests B cell development in BM and decreases B cell frequencies in spleen and MLN
To assess the effect of dietary TrpR on immune cell development and microbiota, we studied the effect of 12 wk of TrpR in 16‐wk‐old WT mice and Ercc1−/Δ7 mice.
First, we evaluated development of body and spleen weights and the cellularity of spleen, MLN, and BM ( Table 1 ). Average body weight was reduced by up to 2‐fold by TrpR (P < 0.001). Spleen weight was also reduced by at least 2‐fold (P < 0.01). Moreover, relative spleen weight (corrected for body weight) was consistently, albeit not significantly, reduced in WT and Ercc1−/Δ7 mice. Cellularity of spleen was decreased by >60% in WT and Ercc1−/Δ7 mice (P < 0.07), while cellularity of MLN was reduced in Ercc1−/Δ7 mice only (P < 0.05). TrpR did not affect BM cellularity in either WT or Ercc1−/Δ7 mice.
Table 1.
Body weight, spleen weight, and cellularity of spleen, MLNs, and BM of 16‐wk‐old WT and Ercc1−/Δ7 mice, with or without dietary TrpR
| Parameters | WT control | WT TrpR | Ercc1−/Δ7 control | Ercc1−/Δ7 TrpR |
|---|---|---|---|---|
| Body weight (g) | 24.0 ± 0.64 | 15.4 ± 0.70*** | 14.2 ± 0.43 | 7.3 ± 0.28*** |
| Spleen weight (mg) | 50 ± 4.0 | 25 ± 1.5** | 24 ± 1.3 | 11 ± 0.71*** |
| Relative spleen weight (%) | 0.21 ± 0.012 | 0.16 ± 0.012# | 0.17 ± 0.0047 | 0.15 ± 0.0062# |
| Spleen (No. ×106) | 115 ± 27 | 35 ± 7.8# | 42 ± 9.5 | 15 ± 1.6# |
| MLN (No. ×106) | 6.5 ± 2.0 | 5 ± 2.3 | 4.2 ± 0.53 | 1.1 ± 0.11* |
| BM (No. ×106) | 81 ± 6.7 | 97 ± 15 | 45 ± 5.6 | 40 ± 2.3 |
Two femurs were counted for the BM count. Data represent the means ± sem of n = 3–4 mice per group. Significant differences between control and TrpR are depicted with asterisks. # P < 0.1; *P < 0.05; **P < 0.01; ***P < 0.001.
Next, we assessed development of B cells in the BM upon TrpR. We observed a reduction in frequencies of B lineage cells within total BM cells (P < 0.03; data not shown) and numbers of total B lineage cells in TrpR WT and Ercc1−/Δ7 mice (P < 0.09; Fig. 2B ). We found a near‐complete absence of pro‐B cells and pre‐B cells in the BM of TrpR WT mice and a complete absence of these cells in the BM of TrpR Ercc1−/Δ7 mice (Fig. 2A and B). Immature B cell numbers were decreased by >2‐fold in WT and Ercc1−/Δ7 mice (P < 0.1), whereas mature B cell numbers were unchanged (Fig. 2A and B).
Figure 2.
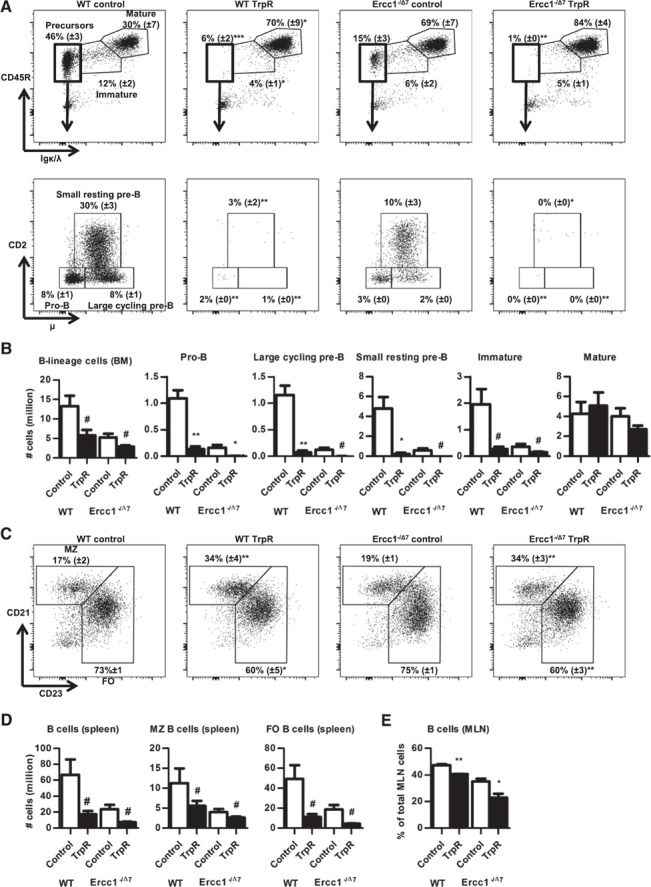
Dietary TrpR arrests B cell development in BM in WT and Ercc1−/Δ7 mice and diminishes B cell numbers in the periphery. (A) Flow cytometric analysis of B cells in BM. Live, single, CD19+ cells were gated for Igκ/λ and CD45R to distinguish Igκ/λ−CD45R+ B cell precursors from Igκ/λ+CD45R+ immature and Igκ/λ+CD45Rhi mature B cells (upper panels). B cell precursors were further distinguished by micron and CD2, to identify CD2−µ− pro‐B cells, CD2−µ+ large cycling pre‐B cells, and CD2+µ+ small resting pre‐B cells (lower panels). A representative example of each group is shown, with means ± sem of the frequencies of the indicated populations within the total B lineage cells. (B) Mean absolute numbers of B cells, pro‐B, large cycling pre‐B, small resting pre‐B, immature, and mature B cells were determined by flow cytometry. (C) Flow cytometric analysis of B cells in spleen. Live, single, CD19+ cells were gated for CD21 and CD23 to distinguish CD21+CD23− MZ B cells from CD21−CD23+ FO B cells and CD21−CD23− B cells. Representative example of each group is shown, with means ± sem of the frequencies of the indicated populations within total splenic B cells. (D) Mean absolute numbers of splenic B cells, MZ B cells, and FO B cells. (E) Mean frequencies of CD19+ B cells in MLNS. Data represent means ± sem of n = 3–4 mice per group. # P < 0.1; *P < 0.05; **P < 0.01; ***P < 0.001. BM counts based on 2 femurs.
To evaluate the consequence of the arrest in B cell development by TrpR, we investigated the distribution of B cells in spleen and MLN. Frequencies and absolute numbers of B cells in the spleens of WT and Ercc1−/Δ7 mice were decreased upon TrpR (although this did not reach significance; Fig. 2D). FO B cells were more affected than MZ B cells were (Fig. 2C and 2D). In MLN, frequencies of B cells were significantly decreased by TrpR in WT and Ercc1−/Δ7 mice (Fig. 2E).
Taken together, these data show that dietary TrpR arrests B cell development in BM of 16‐wk‐old WT and Ercc1−/Δ7 mice and affects the ratio of MZ and FO B cells in the spleen.
T cells and myeloid cells appear less affected by TrpR
TrpR decreased total T cell numbers in spleen of WT (P < 0.05) and Ercc1−/Δ7 mice (P = 0.05; data not shown), with similar reduction in CD4+ T cell numbers (P < 0.07) and CD8+ T cell numbers (P < 0.05; Fig. 3A ). Reduction in T cell numbers was in line with the reduction in spleen cellularity. T cell frequencies, however, increased after TrpR, albeit not significantly (data not shown). Hereby, we observed a relative increase in the frequencies of memory CD4+ T cells in WT and Ercc1−/Δ7 mice (P < 0.09; Fig. 3A) and, to a lesser extent, an increase of memory CD8+ T cells in WT mice only (P < 0.08; Fig. 3A). Splenic Treg frequencies were unchanged by TrpR (Fig. 3A).
Figure 3.
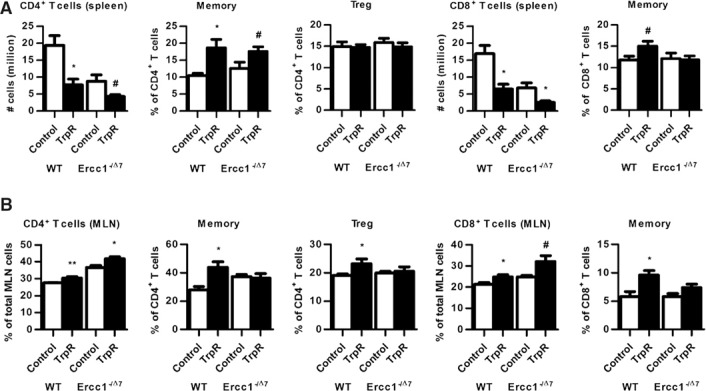
T cell numbers and frequencies in spleen and MLN affected by TrpR. (A–B) Mean numbers of CD4+ T cells and CD8+ T cells, and mean frequencies of CD62L−CD44+ memory CD4+or CD8+ T cells and FoxP3+ Tregs were determined by flow cytometry in spleen and MLNs. # P < 0.1; *P < 0.05; **P < 0.01. Data represent the means ± sem of n = 3–4 mice per group.
In the MLN of TrpR WT mice, total CD4+ T cell frequencies (P < 0.01) and CD8+ T cell frequencies (P < 0.05) were increased after TrpR (Fig. 3B). In TrpR Ercc1−/Δ7 mice, the same changes were observed for CD4+ T cells (P < 0.05) and CD8+ T cells (P < 0.01). However, memory CD4+ and CD8+ T cells and Tregs were significantly increased after TrpR in WT mice only (Fig. 3B).
Neutrophil numbers in BM were unchanged after TrpR of WT and Ercc1−/Δ7 mice, whereas monocyte numbers were significantly increased after TrpR of WT mice only (P < 0.05; Supplemental Fig. 2). Splenic neutrophil and monocyte numbers decreased significantly after TrpR (Supplemental Fig. 2).
These observations show that dietary TrpR affects T cells in the periphery but to a lesser extent than observed for B cells and mostly in line with the general decrease of spleen cellularity. In addition, myeloid cell development in BM was unaffected.
Microbiota composition is enriched after TrpR
Dietary tryptophan is an important substrate for microbiota metabolism [35]. To study the effect of dietary TrpR on microbiota composition, we analyzed fecal microbiota composition by 16S rRNA gene analysis. Between 2.9 × 10⁴ and 3.2 × 10⁵ reads were obtained per sample. Because a difference in reads may bias the number of species (microbial diversity) found, we performed a rarefaction ( Fig. 4 ) to determine the number of reads that were needed to reliably calculate the microbial diversity (PD) [36]. Control (young) 16‐wk‐old WT mice had significantly higher microbial diversity indexes than (aged) Ercc1−/Δ7 mice of the same age (Fig. 4). Moreover, TrpR resulted in a greater diversity in both genotypes, with TrpR Ercc1−/Δ7 mice having similar diversity indexes as WT mice on the control diet (P < 0.05; Fig. 4).
Figure 4.
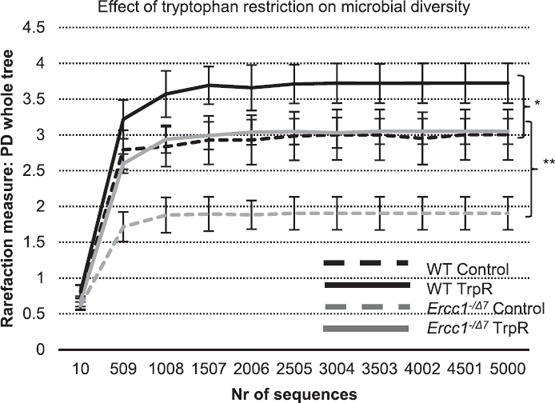
Tryptophan restriction increased microbial diversity in WT and Ercc1−/Δ7 mice. PD whole‐tree diversity indexes at 5000 sequences were used to calculate differences in diversity. Data represent the means ± sem of n = 4 mice per group. *P < 0.05; **P < 0.01. Nr, number of sequences.
To investigate the effect of the diet and the genotypes on the microbial profile, a multivariate analysis was carried out, as previously published [7]. The resulting ordination plots show the RDA. The differences shown in the RDAs were significant (P < 0.05). On genus level (L6), the RDA indicated that both genotype and diet had a significant effect on the microbial composition (P < 0.05). The RDA plot showed a distinct microbial profile for each of the experimental groups ( Fig. 5 ). A total of 34.9% of the total variation in the microbial data set could be related to diet and genotype. Most of the variation was plotted on the first ordination axis (20.0%) and mainly separates on the genotype, whereas the second ordination axis mainly separates on diet (9.7%). The microbial composition of (aged) Ercc1−/Δ7 on TrpR closely resembled the microbial composition of (young) TrpR WT mice, implying that TrpR preserved microbial composition in the premature‐aging repair mutant.
Figure 5.
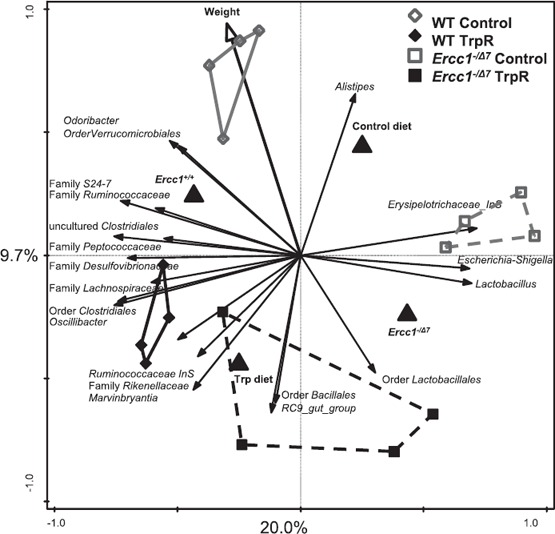
Tryptophan restriction changes microbial composition in the gut of WT and Ercc1−/Δ7 mice. Redundancy analysis on genus level (L6). Mice belonging to WT control, WT TrpR, Ercc1−/Δ7 control, and Ercc1−/Δ7 TrpR are indicated by gray diamonds, black diamonds, gray squares, and black squares, respectively. Besides the abundance of microbial species, genotype, diet, and weight were included in the variables, and together they explain 34.9% of the variability in the data set. First‐ and second‐ordination axes are plotted, showing 20.0% and 9.7% of the variability in the data set, respectively. The third‐ordination axis explains an additional 5.2% of the variability in the data set (not shown). Both genotype and diet had a significant impact on the microbial composition (P < 0.05). Each small symbol represents 1 animal. Larger triangle symbols represent the 2 genotypes or 2 diets.
Decreased relative abundances of Parabacteroides spp., Lachnospiraceae, and Ruminococcaceae were found in control Ercc1−/Δ7 mice compared with control WT mice ( Fig. 6 ). Relative abundance of Lactobacillus spp. was increased >6‐fold, and relative abundance of Akkermansia spp. was decreased >20‐fold, albeit not significantly. TrpR of WT and Ercc1−/Δ7 mice resulted in significantly greater abundances of the Bacteroidetes RC9 gut group and the order Clostridiales, and lower abundances of Alistipes spp. in the top 15 abundant species, as indicated in Fig. 6.
Figure 6.
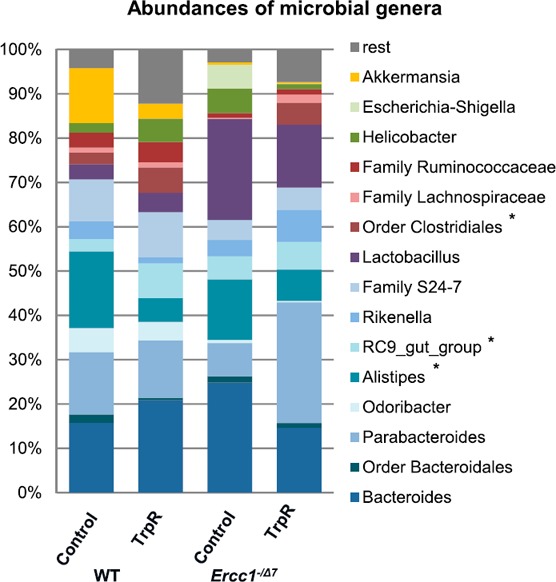
TrpR leads to higher abundances of Bacteroidetes RC9 gut and Clostridiales and lower abundance of Alistipes. Relative abundance profile of the top 15 most‐abundant genus level groups, where ‘rest’ indicates all other groups, including the unclassified groups. *P < 0.05. Data represent the means ± sem of n = 4 mice per group.
Finally, we correlated the abundance of microbial species in all different mouse samples to the B cell precursor numbers (pro‐B cells and pre‐B cells together) to investigate a putative association between microbiota composition and the main immune effect of TrpR. We found that Alistipes and Akkermansia spp. were positively correlated with B cell precursor numbers (P < 0.05; Fig. 7 ), with no other microbial species correlating with B cell precursor numbers. We also tested for correlation of pro‐B or pre‐B cells with specific microbiota. Akkermansia spp. consistently correlated with pro‐B cells (P < 0.01; Fig. 7), large cycling pre‐B cells (P < 0.05; data not shown), and small resting pre‐B cells (P < 0.05; data not shown), whereas Alistipes spp. only significantly correlated with small resting pre‐B cells (P < 0.05; data not shown).
Figure 7.
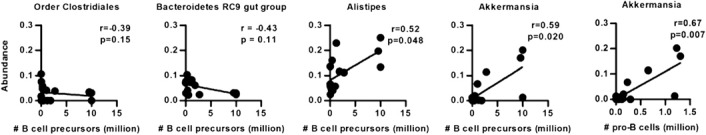
Correlation between B cell precursor numbers and abundance of Alistipes and Akkermansia. Spearman correlation between total B cell precursor numbers (pro‐B cells plus pre‐B cells) or pro‐B cell numbers and abundance of Alistipes and Akkermansia spp. Each circle represents an animal (control and TrpR mice together used in correlation analysis).
Thus, we found a profound effect of dietary TrpR on fecal microbial composition and that Alistipes and Akkermansia spp. abundances were positively correlated with B cell precursor numbers.
DISCUSSION
Four key findings have been made in this study, namely (1) the prematurely aging Ercc1−/Δ7 mice largely resemble normal mice in age‐related changes of the immune system; (2) dietary TrpR similarly arrests B cell development in BM of 16‐wk‐old WT and Ercc1−/Δ7 mice, and affects B cells much more than T cells or myeloid cells; (3) dietary TrpR increases gut microbial diversity in 16‐wk‐old WT and Ercc1−/Δ7 mice; and (4) the abundance of Alistipes and Akkermansia spp. is positively correlated with the number of B cell precursors.
In this study, we compared the aging process of normal‐aging WT mice (16‐wk‐old vs. 18‐mo‐old) with the accelerated‐aging process of Ercc1−/Δ7 mice (6‐wk‐old vs. 16‐wk‐old). When determining cell frequencies (Fig. 1, Supplemental Fig. 1), most of the changes we observed for the aging process in WT mice were also observed for the Ercc1−/Δ7 model and were in line with previous findings. This should not be interpreted as a suggestion that the model completely resembles natural aging. The model is used for specific age–induced anomalies that are accelerated in Ercc1−/Δ7 mice. These include a decrease in B cell precursors in BM [3], an increased memory formation [37], and increased Treg formation [38]. We feel this model allows us to test interventions on these parameters, such as food restriction experiments, in an expedited way. Nevertheless, others have concluded that the aging process in other organs of Ercc1−/Δ7 mice resembles that of normal‐aging mice, based on histologic, proteomic, and metabolomic parameters [23].
When comparing the decline in B cell development in 16‐wk‐old Ercc1−/Δ7 mice (Fig. 1) with the decline observed in control‐fed, 16‐wk‐old Ercc1−/Δ7 mice (Fig. 2), a difference in the magnitude of the decline in B cell precursors was observed. Two major aspects, however, may explain the difference between the data, as presented in Figs. 1 and 2. First, control‐fed mice (Fig. 2) received 10% dietary restriction. Second, feed for control‐fed mice (Fig. 2) was produced in a way to remove tryptophan. Both aspects might have had an unknown influence on the B cell compartment in the BM, which prevented a direct comparison. Nevertheless, the decline in B cell development as such (as a trend) is confirmed by the data as presented in both figures.
The mechanisms by which dietary TrpR affects immunity and microbiota have not, to our knowledge, been previously studied. Surprisingly, TrpR mice showed a profound decrease in body weight (Table 1). This decrease in body weight could not be accounted for by food intake, which was similar to their controls. This finding indicates that dietary TrpR induces metabolic changes. There is remarkable similarity between the effect of dietary tryptophan and methionine restriction on body weight. Dietary methionine restriction decreased body weight in mice by >30% and increased resistance of liver cells to oxidative stress [39, 40]. In addition, dietary methionine restriction decreased the generation of oxygen radicals from mitochondria, and subsequent damage to mitochondrial DNA and proteins [41]. Energy expenditure in methionine‐restricted rats was 1.5‐fold higher, which was linked to metabolic changes in brown and white adipose tissues [42]. Further research is warranted to understand how dietary TrpR causes such a marked weight loss. It would be interesting to investigate levels of cytokines and subsequent effects on immunity that might explain our data on development of B cells in the BM but not in the myeloid cells. Interestingly, adiponectin levels were increased after dietary methionine restriction [42]. Adiponectin is produced by adipocytes, which are also present in the BM. Adiponectin indirectly (via stromal cells) inhibits lymphopoiesis in early B cell precursors but slightly enhances myelopoiesis in myeloid precursors [43]. Lowered adiponectin levels in the BM could thus explain the arrest in B cell development but not myeloid cell development.
Strikingly, we found a pronounced effect on B cells; their precursors were almost absent from the BM after dietary TrpR (Fig. 2). It suggests that B cell development critically requires a lifelong need for tryptophan or its metabolites. The decline of the downstream tryptophan metabolite NAD+ with aging [44] might explain the decrease in B cell precursors with aging that was reported [3, 45], and we have described here. Interestingly, NAD+ is produced by NAMPT [46]. NAMPT also declines with aging [44], and it exerts antiapoptotic functions [47]. NAMPT was initially identified as pre‐B cell–enhancing factor because of its capacity to enhance pre‐B cell colony forming [48]. A role for NAMPT in enhancing early B cell stages could explain our finding that B cell development was dependent on age and dietary tryptophan supplies.
We found that in spleen and MLN, B cell numbers and frequencies were more affected by TrpR (Fig. 2) than were T cells (Fig. 3) or myeloid cells (Supplemental Fig. 2). These data demonstrate that B cells are particularly affected by TrpR, in contrast to cells from erythroid and myeloid lineages.
In comparing WT and Ercc1−/Δ7 mice, we observed that the Ercc1−/Δ7 genotype caused a decrease in microbial diversity (Fig. 5), in line with the prediction that microbial diversity in aging humans decreases [49]. Dietary TrpR increased microbial diversity and composition (5, 7), and it might, therefore, prove to be a valuable nutritional intervention to improve age‐related decline of gut microbial diversity.
The abundance of 2 microbial species (Alistipes and Akkermansia) was positively correlated with the decline of B cell precursors (Fig. 7). Low abundance of Akkermansia spp. correlated with fewer of each of the different B cell precursor stadia (pro‐B, large cycling pre‐B, and small resting pre‐B). Akkermansia muciniphila is positively correlated with health status because its numbers are fewer in the elderly compared with adults [50] and are fewer in obese adults compared with healthy adults [51]. Abundance of Alistipes spp. is decreased in HIV+ patients [52] and in patients suffering from inflammatory bowel disease [53], which is characterized by overexpression of IDO in the colon [54]. Importantly, Akkermansia and Alistipes spp. are both known to harbor tryptophanase, which transforms tryptophan into indole [55, 56], indicating that these microbes might be dependent on a direct source of tryptophan. However, so far, no evidence has been reported, to our knowledge, that abundances of Alistipes and Akkermansia species are related to tryptophan metabolism or whether these 2 species are extremely sensitive to TrpR. Interestingly, Zelante et al. [35] found that tryptophan metabolites from microbiota engage with the aryl hydrocarbon receptor and balance mucosal reactivity via IL‐22, providing the first evidence that tryptophan metabolism by gut microbiota shapes immunity.
TrpR strongly altered the immune system of aged Ercc1−/Δ7 mice, indicating the high responsiveness of the model to dietary interventions. When comparing WT mice with Ercc1−/Δ7 mice, we found similar trends for most of the measured parameters, showing an age‐independent effect of TrpR. However, the effect of TrpR causes a further increase of the effect seen in the aging of Ercc1−/Δ7 mice in B cell precursors and microbiota composition. The combined effect of TrpR and aging is reflected by a more pronounced impact on B cell precursors (Fig. 2) and microbiota composition (Fig. 5). With aging, the loss of lymphoid tissue in the BM leads to a decline in B cell lymphopoiesis in the BM [3, 5]. Recently, a progressive decline in blood B cells was observed in aging [57]. The ratio of naïve/memory B cells is reduced with aging [58]. In addition to the decreased generation, functional defects are present in B cells of the elderly. Humoral immune responses are impaired in the elderly [59], accompanied by a decrease in total Ab production but an increase in autoantibody production [60, 61]. A demise in B cell precursors after TrpR could, therefore, imply an exacerbated functional impairment to mount a proper humoral immune response. An Ag‐specific challenge, like TNP–KLH, could give insight in the ability to mount a humoral immune response.
In conclusion, our results show that dietary TrpR is a powerful intervention to shape immunity and gut microbiota and also in aging. Dietary TrpR arrests B cell development. Further studies are warranted to investigate the role of microbial or host tryptophan metabolism and the changing gut microbiota composition on the major effect of dietary TrpR on B cell development. In particular, more studies are needed to directly test whether the microbiota instructs B cell development in the BM.
AUTHORSHIP
A.A.V., W.P.V., J.H.J.H., P.D., P.J.M.L., R.W.H., and H.F.J.S. designed the study. A.A.B., F.H., B.M., B.S., O.P., W.P.V., R.M.C.B., and S.B. performed the experiments. A.A.B. wrote the manuscript, and F.H., B.M., B.S., O.P., W.P.V., R.M.C.B., S.B., J.H.J.H., P.V., P.J.M.L., R.W.H., and H.F.J.S. helped with the writing.
DISCLOSURES
The authors declare no conflicts of interest.
Supporting information
Supplementary Material Files
ACKNOWLEDGMENTS
This work was supported by a project from the Top Institute Food and Nutrition, Wageningen, The Netherlands. The funders had no role in study design, data collection and analysis, decision to publish, or preparation of the manuscript. J.H.J.H., W.P.V., R.M.C.B., and S.B. acknowledge the financial support of the European Commission FP7 Markage (FP7‐Health‐2008‐200880) and LifeSpan (LSHG‐CT‐2007‐036894), the U.S. National Institutes of Health (NIH) National Institute on Aging (NIA) Grant 1PO1 AG‐17242‐02 and NIH National Institute of Environmental Health Sciences Grant 1UO1 ES011044, the Royal Academy of Arts and Sciences of the Netherlands (academia professorship to J.H.J.H.), and a European Research Council (ERC) advanced grant “DamAge” with project number GA 233424 to J.H.J.H. The research leading to these results has received funding from the European Community's Seventh Framework Programme (FP7/2007‐2013) under Grant HEALTH‐F2‐2010‐259893. Ineke Heikamp‐de Jong is acknowledged for support during experimental work. The authors thank Sangeeta Badloe and the animal caretakers for general assistance with mouse experiments.
Footnotes
SEE CORRESPONDING EDITORIAL ON PAGE 807
REFERENCES
- 1. Chambers, S. M. , Shaw, C. A. , Gatza, C. , Fisk, C. J. , Donehower, L. A. , Goodell, M. A. (2007) Aging hematopoietic stem cells decline in function and exhibit epigenetic dysregulation. PLoS Biol. 5, e201. [DOI] [PMC free article] [PubMed] [Google Scholar]
- 2. Rossi, D. J. , Bryder, D. , Zahn, J. M. , Ahlenius, H. , Sonu, R. , Wagers, A. J. , Weissman, I. L. (2005) Cell intrinsic alterations underlie hematopoietic stem cell aging. Proc. Natl. Acad. Sci. USA 102, 9194–9199. [DOI] [PMC free article] [PubMed] [Google Scholar]
- 3. Min, H. , Montecino‐Rodriguez, E. , Dorshkind, K. (2006) Effects of aging on the common lymphoid progenitor to pro‐B cell transition. J. Immunol. 176, 1007–1012. [DOI] [PubMed] [Google Scholar]
- 4. Beerman, I. , Bhattacharya, D. , Zandi, S. , Sigvardsson, M. , Weissman, I. L. , Bryder, D. , Rossi, D. J. (2010) Functionally distinct hematopoietic stem cells modulate hematopoietic lineage potential during aging by a mechanism of clonal expansion. Proc. Natl. Acad. Sci. USA 107, 5465–5470. [DOI] [PMC free article] [PubMed] [Google Scholar]
- 5. Keren, Z. , Naor, S. , Nussbaum, S. , Golan, K. , Itkin, T. , Sasaki, Y. , Schmidt‐Supprian, M. , Lapidot, T. , Melamed, D. (2011) B‐cell depletion reactivates B lymphopoiesis in the BM and rejuvenates the B lineage in aging. Blood 117, 3104–3112. [DOI] [PubMed] [Google Scholar]
- 6. George, A. J. , Ritter, M. A. (1996) Thymic involution with ageing: obsolescence or good housekeeping? Immunol. Today 17, 267–272. [DOI] [PubMed] [Google Scholar]
- 7. Biagi, E. , Nylund, L. , Candela, M. , Ostan, R. , Bucci, L. , Pini, E. , Nikkïla, J. , Monti, D. , Satokari, R. , Franceschi, C. , Brigidi, P. , De Vos, W. (2010) Through ageing, and beyond: gut microbiota and inflammatory status in seniors and centenarians [published correction in) Through ageing, and beyond: gut microbiota and inflammatory status in seniors and centenarians [published correction in PLoS One (2010) 5, doi:NIEHS] PLoS One 5, e10667. [DOI] [PMC free article] [PubMed] [Google Scholar]
- 8. Ershler, W. B. , Sun, W. H. , Binkley, N. , Gravenstein, S. , Volk, M. J. , Kamoske, G. , Klopp, R. G. , Roecker, E. B. , Daynes, R. A. , Weindruch, R. (1993) Interleukin‐6 and aging: blood levels and mononuclear cell production increase with advancing age and in vitro production is modifiable by dietary restriction. Lymphokine Cytokine Res. 12, 225–230. [PubMed] [Google Scholar]
- 9. Franceschi, C. , Bonafè, M. , Valensin, S. , Olivieri, F. , De Luca, M. , Ottaviani, E. , De Benedictis, G. (2000) Inflamm‐aging: an evolutionary perspective on immunosenescence. Ann. N. Y. Acad. Sci. 908, 244–254. [DOI] [PubMed] [Google Scholar]
- 10. Harris, T. B. , Ferrucci, L. , Tracy, R. P. , Corti, M. C. , Wacholder, S. , Ettinger, W. H., Jr. , Heimovitz, H. , Cohen, H. J. , Wallace, R. (1999) Associations of elevated interleukin‐6 and C‐reactive protein levels with mortality in the elderly. Am. J. Med. 106, 506–512. [DOI] [PubMed] [Google Scholar]
- 11. Ball, Z. B. , Barnes, R. H. , Visscher, M. B. (1947) The effects of dietary caloric restriction on maturity and senescence, with particular reference to fertility and longevity. Am. J. Physiol. 150, 511–519. [DOI] [PubMed] [Google Scholar]
- 12. Terness, P. , Bauer, T. M. , Röse, L. , Dufter, C. , Watzlik, A. , Simon, H. , Opelz, G. (2002) Inhibition of allogeneic T cell proliferation by indoleamine 2,3‐dioxygenase‐expressing dendritic cells: mediation of suppression by tryptophan metabolites. J. Exp. Med. 196, 447–457. [DOI] [PMC free article] [PubMed] [Google Scholar]
- 13. Frick, B. , Schroecksnadel, K. , Neurauter, G. , Leblhuber, F. , Fuchs, D. (2004) Increasing production of homocysteine and neopterin and degradation of tryptophan with older age. Clin. Biochem. 37, 684–687. [DOI] [PubMed] [Google Scholar]
- 14. Schröcksnadel, K. , Wirleitner, B. , Winkler, C. , Fuchs, D. (2006) Monitoring tryptophan metabolism in chronic immune activation. Clin. Chim. Acta 364, 82–90. [DOI] [PubMed] [Google Scholar]
- 15. Van der Goot, A. T. , Nollen, E. A. (2013) Tryptophan metabolism: entering the field of aging and age‐related pathologies. Trends Mol. Med. 19, 336–344. [DOI] [PubMed] [Google Scholar]
- 16. Grohmann, U. , Fallarino, F. , Puccetti, P. (2003) Tolerance, DCs and tryptophan: much ado about IDO. Trends Immunol. 24, 242–248. [DOI] [PubMed] [Google Scholar]
- 17. Le Floc'h, N. , Otten, W. , Merlot, E. (2011) Tryptophan metabolism, from nutrition to potential therapeutic applications. Amino Acids 41, 1195–1205. [DOI] [PubMed] [Google Scholar]
- 18. Capuron, L. , Schroecksnadel, S. , Féart, C. , Aubert, A. , Higueret, D. , Barberger‐Gateau, P. , Layé, S. , Fuchs, D. (2011) Chronic low‐grade inflammation in elderly persons is associated with altered tryptophan and tyrosine metabolism: role in neuropsychiatric symptoms. Biol. Psychiatry 70, 175–182. [DOI] [PubMed] [Google Scholar]
- 19. Ooka, H. , Segall, P. E. , Timiras, P. S. (1988) Histology and survival in agedelayed low‐tryptophan‐fed rats. Mech. Ageing Dev. 43, 79–98. [DOI] [PubMed] [Google Scholar]
- 20. Segall, P. E. , Timiras, P. S. (1976) Patho‐physiologic findings after chronic tryptophan deficiency in rats: a model for delayed growth and aging. Mech. Ageing Dev. 5, 109–124. [DOI] [PubMed] [Google Scholar]
- 21. De Marte, M. L. , Enesco, H. E. (1986) Influence of low tryptophan diet on survival and organ growth in mice. Mech. Ageing Dev. 36, 161–171. [DOI] [PubMed] [Google Scholar]
- 22. López‐Otín, C. , Blasco, M. A. , Partridge, L. , Serrano, M. , Kroemer, G. (2013) The hallmarks of aging. Cell 153, 1194–1217. [DOI] [PMC free article] [PubMed] [Google Scholar]
- 23. Gurkar, A. U. , Niedernhofer, L. J. (2015) Comparison of mice with accelerated aging caused by distinct mechanisms. Exp. Gerontol. 68, 43–50. [DOI] [PMC free article] [PubMed] [Google Scholar]
- 24. Vermeij, W. P. , Hoeijmakers, J. H. , Pothof, J. (2014) Aging: not all DNA damage is equal. Curr. Opin. Genet. Dev. 26, 124–130. [DOI] [PubMed] [Google Scholar]
- 25. Dollé, M. E. , Kuiper, R. V. , Roodbergen, M. , Robinson, J. , de Vlugt, S. , Wijnhoven, S. W. , Beems, R. B. , de la Fonteyne, L. , de With, P. , van der Pluijm, I. , Niedernhofer, L. J. , Hasty, P. , Vijg, J. , Hoeijmakers, J. H. , van Steeg, H. (2011) Broad segmental progeroid changes in short‐lived Ercc1–/δ7 mice. Pathobiol. Aging Age Relat. Dis. 1, 1. [DOI] [PMC free article] [PubMed] [Google Scholar]
- 26. Weeda, G. , Donker, I. , de Wit, J. , Morreau, H. , Janssens, R. , Vissers, C. J. , Nigg, A. , van Steeg, H. , Bootsma, D. , Hoeijmakers, J. H. (1997) Disruption of mouse ERCC1 results in a novel repair syndrome with growth failure, nuclear abnormalities and senescence. Curr. Biol. 7, 427–439. [DOI] [PubMed] [Google Scholar]
- 27. Vermeij, W. P. , Hoeijmakers, J. H. , Pothof, J. (2016) Genome integrity in aging: human syndromes, mouse models, and therapeutic options. Annu. Rev. Pharmacol. Toxicol. 56, 427–445. [DOI] [PubMed] [Google Scholar]
- 28. Sherwood, E. M. , Blomberg, B. B. , Xu, W. , Warner, C. A. , Riley, R. L. (1998) Senescent BALB/c mice exhibit decreased expression of λ5 surrogate light chains and reduced development within the pre‐B cell compartment. J. Immunol. 161, 4472–4475. [PubMed] [Google Scholar]
- 29. Min, H. , Montecino‐Rodriguez, E. , Dorshkind, K. (2004) Reduction in the developmental potential of intrathymic T cell progenitors with age. J. Immunol. 173, 245–250. [DOI] [PubMed] [Google Scholar]
- 30. Nikolich‐Žugich, J. (2014) Aging of the T cell compartment in mice and humans: from no naive expectations to foggy memories. J. Immunol. 193, 2622–2629. [DOI] [PMC free article] [PubMed] [Google Scholar]
- 31. Kilpatrick, R. D. , Rickabaugh, T. , Hultin, L. E. , Hultin, P. , Hausner, M. A. , Detels, R. , Phair, J. , Jamieson, B. D. (2008) Homeostasis of the naive CD4+ T cell compartment during aging. J. Immunol. 180, 1499–1507. [DOI] [PMC free article] [PubMed] [Google Scholar]
- 32. Yu, Z. , Morrison, M. (2004) Improved extraction of PCR‐quality community DNA from digesta and fecal samples. Biotechniques 36, 808–812. [DOI] [PubMed] [Google Scholar]
- 33. Van den Bogert, B. , Erkus, O. , Boekhorst, J. , de Goffau, M. , Smid, E. J. , Zoetendal, E. G. , Kleerebezem, M. (2013) Diversity of human small intestinal Streptococcus and Veillonella populations. FEMS Microbiol. Ecol. 85, 376–388. [DOI] [PubMed] [Google Scholar]
- 34. Caporaso, J. G. , Kuczynski, J. , Stombaugh, J. , Bittinger, K. , Bushman, F. D. , Costello, E. K. , Fierer, N. , Peña, A. G. , Goodrich, J. K. , Gordon, J. I. , Huttley, G. A. , Kelley, S. T. , Knights, D. , Koenig, J. E. , Ley, R. E. , Lozupone, C. A. , McDonald, D. , Muegge, B. D. , Pirrung, M. , Reeder, J. , Sevinsky, J. R. , Turnbaugh, P. J. , Walters, W. A. , Widmann, J. , Yatsunenko, T. , Zaneveld, J. , Knight, R. (2010) QIIME allows analysis of high‐throughput community sequencing data. Nat. Methods 7, 335–336. [DOI] [PMC free article] [PubMed] [Google Scholar]
- 35. Zelante, T. , Iannitti, R. G. , Cunha, C. , De Luca, A. , Giovannini, G. , Pieraccini, G. , Zecchi, R. , D'Angelo, C. , Massi‐Benedetti, C. , Fallarino, F. , Carvalho, A. , Puccetti, P. , Romani, L. (2013) Tryptophan catabolites from microbiota engage aryl hydrocarbon receptor and balance mucosal reactivity via interleukin‐22. Immunity 39, 372–385. [DOI] [PubMed] [Google Scholar]
- 36. Faith, D. P. , Baker, A. M. (2007) Phylogenetic diversity (PD) and biodiversity conservation: some bioinformatics challenges. Evol. Bioinform. Online 2, 121–128. [PMC free article] [PubMed] [Google Scholar]
- 37. Herndler‐Brandstetter, D. , Landgraf, K. , Tzankov, A. , Jenewein, B. , Brunauer, R. , Laschober, G. T. , Parson, W. , Kloss, F. , Gassner, R. , Lepperdinger, G. , Grubeck‐Loebenstein, B. (2012) The impact of aging on memory T cell phenotype and function in the human bone marrow. J. Leukoc. Biol. 91, 197–205. [DOI] [PubMed] [Google Scholar]
- 38. Fessler, J. , Ficjan, A. , Duftner, C. , Dejaco, C. (2013) The impact of aging on regulatory T‐cells. Front. Immunol. 4, 231. [DOI] [PMC free article] [PubMed] [Google Scholar]
- 39. Miller, R. A. , Buehner, G. , Chang, Y. , Harper, J. M. , Sigler, R. , Smith‐Wheelock, M. (2005) Methionine‐deficient diet extends mouse lifespan, slows immune and lens aging, alters glucose, T4, IGF‐I and insulin levels, and increases hepatocyte MIF levels and stress resistance. Aging Cell 4, 119–125. [DOI] [PMC free article] [PubMed] [Google Scholar]
- 40. Caro, P. , Gómez, J. , López‐Torres, M. , Sánchez, I. , Naudí, A. , Jove, M. , Pamplona, R. , Barja, G. (2008) Forty percent and eighty percent methionine restriction decrease mitochondrial ROS generation and oxidative stress in rat liver. Biogerontology 9, 183–196. [DOI] [PubMed] [Google Scholar]
- 41. Sanz, A. , Caro, P. , Ayala, V. , Portero‐Otin, M. , Pamplona, R. , Barja, G. (2006) Methionine restriction decreases mitochondrial oxygen radical generation and leak as well as oxidative damage to mitochondrial DNA and proteins. FASEB J. 20, 1064–1073. [DOI] [PubMed] [Google Scholar]
- 42. Hasek, B. E. , Stewart, L. K. , Henagan, T. M. , Boudreau, A. , Lenard, N. R. , Black, C. , Shin, J. , Huypens, P. , Malloy, V. L. , Plaisance, E. P. , Krajcik, R. A. , Orentreich, N. , Gettys, T. W. (2010) Dietary methionine restriction enhances metabolic flexibility and increases uncoupled respiration in both fed and fasted states. Am. J. Physiol. Regul. Integr. Comp. Physiol. 299, R728–R739. [DOI] [PMC free article] [PubMed] [Google Scholar]
- 43. Yokota, T. , Meka, C. S. , Kouro, T. , Medina, K. L. , Igarashi, H. , Takahashi, M. , Oritani, K. , Funahashi, T. , Tomiyama, Y. , Matsuzawa, Y. , Kincade, P. W. (2003) Adiponectin, a fat cell product, influences the earliest lymphocyte precursors in bone marrow cultures by activation of the cyclooxygenase‐prostaglandin pathway in stromal cells. J. Immunol. 171, 5091–5099. [DOI] [PubMed] [Google Scholar]
- 44. Yoshino, J. , Mills, K. F. , Yoon, M. J. , Imai, S. (2011) Nicotinamide mononucleotide, a key NAD+ intermediate, treats the pathophysiology of diet‐ and age‐induced diabetes in mice. Cell Metab. 14, 528–536. [DOI] [PMC free article] [PubMed] [Google Scholar]
- 45. Allman, D. , Miller, J. P. (2005) The aging of early B‐cell precursors. Immunol. Rev. 205, 18–29. [DOI] [PubMed] [Google Scholar]
- 46. Rongvaux, A. , Shea, R. J. , Mulks, M. H. , Gigot, D. , Urbain, J. , Leo, O. , Andris, F. (2002) Pre‐B‐cell colony‐enhancing factor, whose expression is up‐regulated in activated lymphocytes, is a nicotinamide phosphoribosyltransferase, a cytosolic enzyme involved in NAD biosynthesis. Eur. J. Immunol. 32, 3225–3234. [DOI] [PubMed] [Google Scholar]
- 47. Jia, S. H. , Li, Y. , Parodo, J. , Kapus, A. , Fan, L. , Rotstein, O. D. , Marshall, J. C. (2004) Pre‐B cell colony‐enhancing factor inhibits neutrophil apoptosis in experimental inflammation and clinical sepsis. J. Clin. Invest. 113, 1318–1327. [DOI] [PMC free article] [PubMed] [Google Scholar]
- 48. Samal, B. , Sun, Y. , Stearns, G. , Xie, C. , Suggs, S. , McNiece, I. (1994) Cloning and characterization of the cDNA encoding a novel human pre‐B‐cell colony‐enhancing factor. Mol. Cell. Biol. 14, 1431–1437. [DOI] [PMC free article] [PubMed] [Google Scholar]
- 49. Biagi, E. , Candela, M. , Fairweather‐Tait, S. , Franceschi, C. , Brigidi, P. (2011) Ageing of the human metaorganism: the microbial counterpart. Age (Dordr) 34, 247–267. [DOI] [PMC free article] [PubMed] [Google Scholar]
- 50. Collado, M. C. , Derrien, M. , Isolauri, E. , de Vos, W. M. , Salminen, S. (2007) Intestinal integrity and Akkermansia muciniphila, a mucindegrading member of the intestinal microbiota present in infants, adults, and the elderly.) Intestinal integrity and Akkermansia muciniphila, a mucindegrading member of the intestinal microbiota present in infants, adults, and the elderly. Appl. Environ. Microbiol. 73, 7767–7770. [DOI] [PMC free article] [PubMed] [Google Scholar]
- 51. Everard, A. , Belzer, C. , Geurts, L. , Ouwerkerk, J. P. , Druart, C. , Bindels, L. B. , Guiot, Y. , Derrien, M. , Muccioli, G. G. , Delzenne, N. M. , de Vos, W. M. , Cani, P. D. (2013) Cross‐talk between Akkermansia muciniphila and intestinal epithelium controls diet‐induced obesity. Proc. Natl. Acad. Sci. USA 110, 9066–9071. [DOI] [PMC free article] [PubMed] [Google Scholar]
- 52. Vujkovic‐Cvijin, I. , Dunham, R. M. , Iwai, S. , Maher, M. C. , Albright, R. G. , Broadhurst, M. J. , Hernandez, R. D. , Lederman, M. M. , Huang, Y. , Somsouk, M. (2013) Dysbiosis of the gut microbiota is associated with HIV disease progression and tryptophan catabolism. Sci. Transl. Med. 5, 193ra91. [DOI] [PMC free article] [PubMed] [Google Scholar]
- 53. Frank, D. N. , St Amand, A. L. , Feldman, R. A. , Boedeker, E. C. , Harpaz, N. , Pace, N. R. (2007) Molecular‐phylogenetic characterization of microbial community imbalances in human inflammatory bowel diseases. Proc. Natl. Acad. Sci. USA 104, 13780–13785. [DOI] [PMC free article] [PubMed] [Google Scholar]
- 54. Wolf, A. M. , Wolf, D. , Rumpold, H. , Moschen, A. R. , Kaser, A. , Obrist, P. , Fuchs, D. , Brandacher, G. , Winkler, C. , Geboes, K. , Rutgeerts, P. , Tilg, H. (2004) Overexpression of indoleamine 2,3‐dioxygenase in human inflammatory bowel disease. Clin. Immunol. 113, 47–55. [DOI] [PubMed] [Google Scholar]
- 55. Watsuji, T. O. , Takano, H. , Yamabe, T. , Tamazawa, S. , Ikemura, H. , Ohishi, T. , Matsuda, T. , Shiratori‐Takano, H. , Beppu, T. , Ueda, K. (2014) Analysis of the tryptophanase expression in Symbiobacterium thermophilum in a coculture with Geobacillus stearothermophilus . Appl. Microbiol. Biotechnol. 98, 10177–10186. [DOI] [PubMed] [Google Scholar]
- 56. Zhang, C. , Yin, A. , Li, H. , Wang, R. , Wu, G. , Shen, J. , Zhang, M. , Wang, L. , Hou, Y. , Ouyang, H. , Zhang, Y. , Zheng, Y. , Wang, J. , Lv, X. , Wang, Y. , Zhang, F. , Zeng, B. , Li, W. , Yan, F. , Zhao, Y. , Pang, X. , Zhang, X. , Fu, H. , Chen, F. , Zhao, N. , Hamaker, B. R. , Bridgewater, L. C. , Weinkove, D. , Clement, K. , Dore, J. , Holmes, E. , Xiao, H. , Zhao, G. , Yang, S. , Bork, P. , Nicholson, J. K. , Wei, H. , Tang, H. , Zhang, X. , Zhao, L. (2015) Dietary modulation of gut microbiota contributes to alleviation of both genetic and simple obesity in children. EBioMedicine 2, 968–984. [DOI] [PMC free article] [PubMed] [Google Scholar]
- 57. Valiathan, R. , Ashman, M. , Asthana, D. (2016) Effects of ageing on the immune system: infants to elderly. Scand. J. Immunol. 83, 255–266. [DOI] [PubMed] [Google Scholar]
- 58. Listì, F. , Candore, G. , Modica, M. A. , Russo, M. , Di Lorenzo, G. , Esposito‐Pellitteri, M. , Colonna‐Romano, G. , Aquino, A. , Bulati, M. , Lio, D. , Franceschi, C. , Caruso, C. (2006) A study of serum immunoglobulin levels in elderly persons that provides new insights into B cell immunosenescence. Ann. N. Y. Acad. Sci. 1089, 487–495. [DOI] [PubMed] [Google Scholar]
- 59. Gibson, K. L. , Wu, Y. C. , Barnett, Y. , Duggan, O. , Vaughan, R. , Kondeatis, E. , Nilsson, B. O. , Wikby, A. , Kipling, D. , Dunn‐Walters, D. K. (2009) B‐cell diversity decreases in old age and is correlated with poor health status. Aging Cell 8, 18–25. [DOI] [PMC free article] [PubMed] [Google Scholar]
- 60. Tachikawa, S. , Kawamura, T. , Kawamura, H. , Kanda, Y. , Fujii, Y. , Matsumoto, H. , Abo, T. (2008) Appearance of B220low autoantibody‐producing B‐1 cells at neonatal and older stages in mice. Clin. Exp. Immunol. 153, 448–455. [DOI] [PMC free article] [PubMed] [Google Scholar]
- 61. Frasca, D. , Blomberg, B. B. (2011) Aging affects human B cell responses. J. Clin. Immunol. 31, 430–435. [DOI] [PMC free article] [PubMed] [Google Scholar]
Associated Data
This section collects any data citations, data availability statements, or supplementary materials included in this article.
Supplementary Materials
Supplementary Material Files