

Short abstract
S100A8 promotes Treg generation by activity on modulating immature DCs in the presence of GM‐CSF and IL‐4.
Keywords: CD4+ iNKT cells, TLR‐4, regulatory T cell, ATF‐2, HSF‐1
Abstract
In this study, we used the culture supernatant of iNKT cells to identify human myeloid DC maturation factors produced by human CD4+ iNKT cells. S100A8 had a strong maturation effect. Notably, the recombinant S100A8 protein displayed properties of DC maturation functioning, and the induction of DC differentiation by both the purified and the recombinant protein were blocked by anti‐S100A8 and anti‐TLR‐4 mAbs. DC differentiation induced by anti‐major histocompatibility complex class II/CD1d Ab, S100A8, or both was qualitatively indistinguishable from that induced by the coculture of DCs and iNKT cells or via culture supplementation with supernatants from activated CD4+ iNKT cells. S100A8 also induced CD4+/CD25+/Foxp3+ Treg cells from naïve T cells. S100A8 may contribute to DC differentiation by elevating transcription factors or activating transcription factor‐2, heat shock factor‐1, or both, in mature DCs. S100A8 is a novel candidate iNKT cell‐dependent DC maturation factor.
Abbreviations
- α‐GalCer
α‐galactosylceramide
- ATF
activating transcription factor
- BMDC
bone marrow‐derived dendritic cell
- CDR
complementarity determining region
- CFSE
carboxyfluorescein diacetate succinimidyl ester
- DC
dendritic cell
- DN
double negative
- FPLC
fast protein liquid chromatography
- HIF
hypoxia inducible factor
- Hsp70
heat shock protein 70
- iDC
immature dendritic cell
- iNKT cell
invariant natural killer T cell
- PBMC
peripheral blood mononuclear cell
- PDL
programmed death ligand
- PIP
prolactin‐induced protein
- RAGE
receptor for advanced glycation end products
- S100A8
S100 calcium‐binding protein A8
- S100A9
S100 calcium‐binding protein A9
- siRNA
small interfering ribonucleic acid
- Treg
regulatory T cell
Introduction
Human iNKT cells show restricted use of the invariant Vα24‐Jα15 TCR and express several cell surface proteins found on NK cells [1]. Therefore, iNKT cells share functional and phenotypic homology with both NK and T cells and are distinguished by the nonpolymorphic class Ib molecule CD1d, which is involved in the presentation of glycolipid antigen [2]. This presentation results in a burst of secretion of several cytokines—particularly, IL‐4 and IFN‐γ [3]. The rapid secretion of cytokines implies that iNKT cells play a key role in the modulation of immune response and immunopathology. iNKT cells are also involved in tumor immunity [4], diabetes regulation [5, 6–7], and protection against bacterial [8], viral [9], and parasitic infections [10].
iNKT cells have also been shown to promote peripheral tolerance in several model systems, but their regulatory effects remain poorly understood. The soluble factors secreted by human iNKT cells instruct human PBMCs to differentiate into myeloid APCs with suppressive properties. In addition, human iNKT cells direct primary human PBMCs to differentiate into cells resembling immature myeloid DCs [11]. iNKT cell activation via the recognition of CD1d expressed on monocytes results in the secretion of GM‐CSF and IL‐13, which promotes monocyte differentiation. The resulting myeloid cells show upregulation of DC‐specific intercellular adhesion molecule‐3‐grabbing nonintegrin, little or no expression of CD14, and moderate expression levels of the costimulatory markers CD40 and CD86. Thus, the cell surface phenotype is consistent with that of immature myeloid DCs. The localization of MHC class II molecules to lysosomal‐associated membrane protein 1‐positive intracellular vesicles, which is characteristic of immature myeloid DCs, was also observed. After exposure to LPS, immature myeloid DCs undergo changes associated with maturation, including the upregulation of CD83 and chemokine receptor 7 and the relocation of MHC class II molecules to the cell surface [11]. DCs fail to mature normally in both human and rodent autoimmune diabetes.
The transfer of highly mature DCs protects nonobese diabetic mice from disease. Therefore, defects in APCs and CD1d‐restricted T cells may underlie the development of pathogenic autoimmune T cells and type 1 diabetes. Based on our observations, the natural history of type 1 diabetes progression is influenced by a fine balance in which a Th 1‐like response is critical for β‐cell destruction and progression toward overt disease. If the autoimmune T‐cell pool becomes biased toward Th2‐like cells (e.g., those that can inhibit Th1 cells via IL‐4 or ‐10), either naturally or via the activation or transfer of the appropriate CD1d‐restricted T‐cell subset, the disease process can be halted.
S100A8 (encoded by the Mrp8 gene) and S100A9 (encoded by the Mrp14 gene) are the most abundant cytoplasmic proteins in neutrophils and monocytes [12]. S100A8 and S100A9 belong to the calcium‐binding S100 protein family, and S100A8 forms Ca2+‐dependent heterodimer/heterotetramer complexes with S100A9. Human S100A8 is 93 aa (10.8 kDa) and contains 2 EF‐hand motifs (aa 12–47 and aa 46–81) and 1 high‐affinity Ca2+ binding site (aa 59–70). Human S100A9 is also an EF‐hand calcium‐binding protein. It consists of 114 aa (13.2 kDa) and is expressed in granulocytes, monocytes, and macrophages during acute and chronic inflammation. S100A8 is detected in epithelial cells during dermatoses and has antimicrobial activity against bacteria and fungi. This molecule plays a role in the development of endotoxic shock in response to bacterial LPS. In addition, S100A8 functions as a proinflammatory mediator during acute and chronic inflammation and upregulates the release of IL‐8 and the cell surface expression of ICAM‐1 on the endothelium.
S100A8 shares a 57% amino acid identity with mouse S100A8 [12, 13]. A recent report showed that S100A8 is an endogenous activator of TLR‐4; thus, it elevates the expression of TNF‐α [14]. In the present study, mass spectrometric analysis of the supernatant from activated CD4+ iNKT cells demonstrated that S100A8 is induced during anti‐CD3 Ab or α‐GalCer activation. Furthermore, our results demonstrated that S100A8 induces the maturation of iDCs and generates Treg cells.
MATERIALS AND METHODS
Cell lines
CD1d‐restricted T‐cell clones were generated via single‐cell sorting by using MoFlo (BD Biosciences, Mountain View, CA, USA). In brief, NKT cells were sorted by using 6B11‐fluorochrome conjugated Ab (an mAb specific for the invariant Vα24JαQ CDR 3 loop) [15], and single‐cell sorts were grown with a mixture of irradiated (5000 rad) allogeneic PBMCs at a density of 75,000 cells per well. The NKT cell clones were frozen in liquid nitrogen until further use. After thawing, the clones were expanded with 100 ng/ml α‐GalCer and γ‐irradiated PBMCs. These experiments were conducted with the informed consent of each participant and the approval of the Inha University ethics committee.
Culture of iNKT cell clones and transfection
iNKT cell clones were expanded via culture in RPMI 1640 (BioWhittaker, Walkersville, MD, USA) supplemented with 10% heat‐inactivated FBS (Atlanta Biologicals, Norcross, GA, USA), 25 × 106 irradiated PBMCs, 100 ng/ml α‐GalCer, 2 mM l‐glutamine, 10 mM HEPES buffer, 100 U/ml penicillin (BioWhittaker), and 100 μg/ml streptomycin sulfate (BioWhittaker) [16]. Cells were incubated at 37°C in a humidified chamber with 5% CO2. After 18–24 h, 50 U/ml human recombinant IL‐2 (Roche, Mannheim, Germany) and 10 U/ml human IL‐7 (Roche) were added to cocultured iNKT and feeder cells. On d 5, half of the medium was replaced with fresh medium supplemented with 50 U/ml IL‐2 and 10 U/ml IL‐7. During d 10–14, the iNKT cells were split for further expansion [17]. The purity of the expanded cells was checked with flow cytometry by using anti‐CD4, ‐CD8, and ‐6B11‐fluorochrome–conjugated Abs. Cell transfection with siRNA against S100A8 and PIP was performed with S100A8 and PIP Trilencer‐27 Human siRNA (OriGene, Rockville, MD, USA), according to the manufacturer's protocol. Cells were allowed to recover for 24 h before use.
Human cytokine Ab array
CD4+ and DN iNKT cells were stimulated with anti‐CD3 Ab, as described above. The supernatants were collected after 24 h and stored at −80°C. The conditioned medium was analyzed with a RayBio Human Cytokine Antibody Array C Series 1000 (RayBiotech, Norcross, GA, USA), according to the manufacturer's protocol. In brief, the membranes were incubated in blocking buffer for 30 min, followed by overnight incubation with conditioned medium at 4°C. The membranes were washed 5 times with washing buffer and incubated for 2 h with biotin‐conjugated Abs. The membranes were then washed 5 times with washing buffer and incubated for 2 h with HRP‐conjugated streptavidin. After the washing process, human cytokines were detected with enhanced chemiluminescence reagents.
RT‐PCR analysis
For RT‐PCR, mRNA was isolated with the RNeasy mini kit (Qiagen, Valencia, CA, USA), according to the manufacturer's instructions. Total RNA (1 μg), S100A8‐F (sense, ACC GAG CTG GAG AAA GCC TTG AAC TCT), and S100A8‐R (antisense, CTC TTT GTG GCT TTC ATG GCT TTT) primers and the RT Super Script II enzyme (Thermo Fisher Scientific, Carlsbad, CA, USA) were used for the RT‐PCR experiments. The first strand of complementary DNA was synthesized at 50°C for 30 min, and 34 cycles (94°C for 30 s, 55°C for 30 s, and 72°C for 60 s) were used to amplify the S100A8 gene, yielding a PCR product with an expected size of 273 bp.
Preparation of anti‐CD3‐activated NKT cell culture supernatant
For the preparation of supernatant from CD4+ iNKT cells activated with anti‐CD3 Ab, a plate was treated with 100 ng/ml of anti‐CD3 Ab (Ancell, Bayport, MN, USA) and incubated at 4°C overnight. The plates were washed 3 times with 10% FBS RPMI 1640 medium, and the CD4+ iNKT cells were added and cultured in a 5% CO2 incubator at 37°C. After 7 d, the supernatant was collected and passed through a 0.22 µm filter to remove cellular debris.
Purification of DC maturation factors with FPLC
To purify DC maturation factors, we applied protein samples to an AKTA Explorer 100 FPLC instrument (GE Healthcare, Piscataway, NJ, USA). In brief, 50 ml of anti‐CD3 Ab‐activated supernatant from iNKT cells was loaded onto an anion exchange chromatography column (5 ml; HiTrap DEAE FF; GE Healthcare) and eluted with 20 mM Tris‐Cl (pH 8.0) containing 1 M NaCl. This step was repeated 6 times to load 300 ml of sample. To determine the effect of the factors on DC maturation, we removed 50 µl samples of supernatant from each collection tube. The fractions that exhibited DC maturation effects were freeze dried and dialyzed with 20 mM Tris‐Cl binding buffer at 4°C overnight. The active fractions were reloaded onto cation exchange chromatography columns (5 ml; HiTrap CM FF, GE Healthcare), and the active fractions were identified by following the procedure described above for anion exchange column chromatography. The active fractions were reloaded onto affinity chromatography columns (1 ml; HiTrap Blue HP; GE Healthcare) and eluted with 50 mM KH2PO4 containing 1.5 M KCl (pH 7.0). The protein content in the final active fractions was analyzed with mass spectrometry.
Mass spectrometry
The partially purified DC maturation factors from the CD4+ iNKT cell culture supernatant were analyzed with 12% SDS‐PAGE performed at 35 mA for 40 min. The gels were stained with Coomassie Brilliant Blue G‐250 (Boston BioProducts, Worcester, MA, USA), and the areas of interest were manually excised and digested in‐gel with trypsin. Samples were analyzed on an LTQ‐FT Plus Mass Spectrometer (Thermo Fisher Scientific, Waltham, MA, USA). Each reconstituted sample was separated on a C18 column (75 μm × 20 cm) at a flow rate of 375 μl/min with a gradient of 5–60% water/0.1% formic acid and acetonitrile/0.1% formic acid over 150 min. The instrument was operated in a top‐10 configuration with the full Fourier transform scan acquired at a resolution of 100 K with the MS2 selections performed in the ion trap.
Peptides were identified by using Sequest through the Bioworks Browser 3.2, with fragment data searched against the RefSeq Human Database from the National Center for Biotechnology Information (Bethesda, MD, USA) by using differential carbamidomethyl‐modified cysteines and oxidized methionines. Peptide score cutoff values were chosen at an Xcorr score of 1.8 for singly charged ions, 2.5 for doubly charged ions, and 3.0 for triply charged ions, along with deltaCN values of 0.1 and RSp values of 1. These parameters included less than 1% of the dummy reverse database. The cross‐correlation values chosen for each peptide ensured a high‐confidence match for the various charge states, and the deltaCN cutoff value ensured the uniqueness of the peptide hit. The RSp value of 1 ensured that the peptide matched the top hit in preliminary scoring and that the .dta peptide fragment file matched only 1 protein.
DC generation from buffy coats and the maturation test
Buffy coats were obtained from healthy donors according to the institutional guidelines of the University of Florida. PBMCs were prepared via density centrifugation by using Ficoll‐Paque gradients (Amersham Pharmacia Biotech, Uppsala, Sweden). Seventy million PBMCs were added to 10 cm tissue culture plates in 10 ml RPMI 1640 medium supplemented with 10% heat‐inactivated FBS, 2 mM l‐glutamine, 100 U/ml penicillin, and 10 µg/ml streptomycin and incubated for 1 h in a 5% CO2 incubator at 37°C. Nonadherent cells were removed, and adherent cells were collected with a cell scraper. In some instances, PBMCs were mixed with microbead‐conjugated anti‐CD14 Ab (Miltenyi Biotech, Auburn, CA, USA) and incubated on ice for 30 min. After a wash with binding buffer [2% FBS, 2 mM EDTA, 20 mM PBS (pH 7.4)], the CD14+ cells were purified with autoMACS (Miltenyi Biotech). The purified cells were subsequently cultured in 10 cm culture plates in RPMI 1640 medium supplemented with 10% heat‐inactivated FBS, 10 mM HEPES, 2 mM l‐glutamine, 100 U/ml penicillin, 10 µg/ml streptomycin, 50 μM 2‐ME, 5 ng/ml GM‐CSF, and 10 ng/ml IL‐4 (R&D Systems, Minneapolis, MN, USA). Half of the medium was replaced on d 3 and 6.
For DC maturation analysis, the nonadherent cells (iDCs) were harvested on d 7 and stimulated with TNF‐α or purified supernatant from NKT cells. FACS with a FACSCalibur instrument (BD Bioscience) was used to determine the maturation of the iDCs by measuring the levels of CD86, PDL‐1, and HLA‐DR on the cell surface.
Flow cytometry
The phenotypes of iNKT cell clones were characterized by using a panel of cell surface Abs conjugated to fluorescein isothiocyanate or phycoerythrin. In brief, the cells were washed in staining buffer (PBS [pH 7.2] supplemented with 2% FBS and 0.1% sodium azide), incubated at 4°C for 30 min with the appropriate conjugated Abs, and washed twice with staining buffer. The fluorescein isothiocyanate–conjugated Abs were CD4, CD8, and IgG isotype. The phycoerythrin‐conjugated Abs were CD3, CD4, CD8, and NKT (6B11). CD14, HLA‐DR, PDL‐1, and CD86 were used to assess DC maturation. Intracellular staining was performed according to the manufacturer's recommendations (BD Pharmingen, San Diego, CA, USA). Brefeldin A solution (1 × 40 µl per well; BD Biosciences) was added during the last 6–12 h of culture. After staining for extracellular antigens, the cells were incubated with 500 µl of 1× permeabilizing solution 2 (BD Biosciences) for 10 min at room temperature in the dark. Isotype‐matched Abs were included for all experiments to control for nonspecific binding. Forward‐ and side‐scatter gating excluded dead cells. Flow cytometry was performed with a FACSCalibur (BD Biosciences) instrument, and the data were analyzed by using FlowJo software (TreeStar, Ashland, OR, USA).
Western blot analysis
CD4+ iNKT cells activated with anti‐CD3 Ab (Ancell Co., Bayport, MN, USA) were harvested and washed twice with ice‐cold PBS. The pellet was resuspended in RIPA buffer (50 mM Tris‐HCl [pH 7.4], 150 mM NaCl, 1% NP‐40, 0.5% sodium deoxycholate, 0.1% SDS, 5 mM EDTA, and 1 mM EGTA; Boston BioProducts) containing a proteinase inhibitor cocktail (Roche). After incubation on ice for 30 min, the lysate was centrifuged at 14,000 rpm for 10 min, and the supernatant was collected for analysis. One volume of Laemmli's sample buffer (4% SDS, 20% glycerol, 10% 2‐ME, and 4 mg/100 ml bromophenol blue) was added to the supernatant, which was then incubated at 95°C for 5 min.
The samples were analyzed with 12% SDS‐PAGE performed at 35 mA for 40 min. The supernatants from the anti‐CD3 Ab‐activated CD4+ iNKT cells were filtered with 0.2 μm membranes, mixed with Laemmli's sample buffer, and applied to the gels. The proteins were electrotransferred to PVDF membranes at 300 mA for 2 h with transfer buffer containing 25 mM Tris, 190 mM glycine, and 20% methanol. After 2 h of saturation at room temperature in PBS/0.05% Tween 20 containing 5% nonfat milk (Bio‐Rad, Hercules, CA, USA), the membranes were incubated with anti‐S100A8 Ab or anti‐β tubulin Ab (1:500 v/v; Cell Signaling Technology, Danvers, MA, USA) at 4°C overnight. The membranes were washed 3 times with PBS/0.05% Tween 20 and incubated with HRP‐conjugated anti‐mouse IgG (1:1000 v/v) and anti‐rabbit IgG Ab (1:1000 v/v; Cell Signaling Technology) for 1 h at room temperature. The proteins were detected with a Western Lightning Plus‐ECL kit (PerkinElmer, Waltham, MA, USA), according to the manufacturer's instructions.
Cytokine assay
The amounts of G‐CSF, GM‐CSF, IL‐10, IL‐12 (p70), IL‐1β, IL‐2, IL‐4, IL‐5, IL‐6, IL‐7, IL‐8, IL‐17, IFN‐γ, MCP‐1, MIP‐1β, and TNF‐α in the supernatants from the cultured cells were measured with a Bio‐Plex Pro human cytokine 17‐plex assay kit (Bio‐Rad) according to the manufacturer's instructions.
Multiplex transcription factor assay
To investigate the transcription factors of matured DCs differentiated by LPS and S100A8, we treated iDCs with LPS and S100A8 for 6 and 48 h. After harvesting the stimulated iDCs, we washed them 3 times with ice‐cold PBS. Nuclear extracts from the DCs were prepared with a Procarta Transcription Factor assay kit (Panomics, Fremont, CA, USA), according to the manufacturer's instructions. Each nuclear extract sample (0.1–10 μg/ml) was combined with 10 μl of a 24 biotin‐labeled cis‐element probe mixture that contained 2× binding buffer in a total reaction volume of 20 μl [18]. As a control, 10 μl distilled water was added to a sample of the reaction mixture instead of nuclear extract. The mixture was incubated for 30 min at 15°C by using a thermocycler. The transcription factor–probe complex was applied to the spin column included with the Protein/DNA Array kit (Panomics). The probes that formed complexes with active transcription factors were recovered from the spin column. Twenty microliters of the eluted sample was hybridized to the 24‐plex microspheres, and probe recovery was detected by using the Luminex 100 multiplexing system (Luminex, Austin, TX, USA). We evaluated the following transcription factors in mature DCs with LPS and S100A8: AP‐1, ATF‐2, CCAAT, CCAAT displacement protein, CCAAT enhancer‐binding protein, c‐MYC, cAMP, E2F transcription factor 1, early growth response, ELK‐1, ETS/PEA, GATA, HIF‐1, HSF‐1, IFN regulatory factor, IFN stimulatory element, NF of activated T‐cells, NF‐κB, NF‐Y, p53, peroxisome proliferator‐activated receptor, runt‐related transcription factor/acute myeloid leukemia, SMAD, STAT‐1, STAT‐3, transcription factor II D, and X‐box binding protein 1.
Statistical analyses
All values are expressed as means ± sd. To identify genes with statistically significant differences between T‐cell subsets or cell types, we performed 1‐way ANOVA with a P‐value cutoff of 0.01 and used the Benjamini and Hochberg false‐discovery rate for multiple testing corrections. Statistical significance in cluster analyses was determined with 1‐way ANOVA with a P‐value cutoff of 0.05 and the Benjamini and Hochberg false‐discovery rate. The results of other experiments, including the differential effect of CD4+ and DN iNKT cells on DC maturation, were analyzed with 1‐way ANOVA followed by Bonferroni's multiple‐comparison test. P < 0.05 indicated statistical significance.
RESULTS
CD4+ iNKT cells induce DC maturation
To assess the DC maturation capabilities of iNKT cells, we initially isolated iNKT cells from the PBMCs of healthy volunteers by using the 6B11 Ab, which reacts specifically with the TCR CDR3 region of human iNKT cells [15] and a microbead‐conjugated anti‐IgG1 Ab. Next, iNKT cells were separated into CD4+ and DN cells by using CD4 microbeads, which were evaluated with flow cytometry ( Fig. 1A ). The soluble factors of iNKT cells have been shown to have DC maturation capability [6, 19]. Therefore, supernatants were prepared from anti‐CD3 Ab‐activated CD4+ and DN iNKT cells. The cells were washed with complete culture medium 3 times, applied to plates coated with 100 ng/ml anti‐CD3 Ab and incubated with 50 U/ml IL‐2. The supernatant was collected from both CD4+ and DN iNKT cells and added to cultures of iDCs that were induced from freshly purified PBMCs via CD14 magnetic sorting and incubated with GM‐CSF and IL‐4. After 48 h, representative surface markers of mature DCs, HLA‐DR, and CD86, were measured by using flow cytometry [11]. These markers were significantly upregulated after the addition of supernatant from CD4+ iNKT cell clones (iNKT‐27 and ‐67) compared with DN iNKT cell clones (iNKT‐B5, ‐H9, and ‐A13; Fig. 1B, C). The increased number of cells that were positive for both CD86 and HLA‐DR had a FACS profile (Fig. 1B) representative of the CD4+ iNKT cell clone iNKT‐67, as shown in see Fig. 1C. Double‐positive CD86 and HLA‐DR cells increased from 52.1% in untreated control DCs to 81.1% in the supernatant of CD4+ iNKT cell‐treated DCs. These observations prompted us to focus on the soluble factors of CD4+ iNKT cells for further experimentation.
Figure 1.
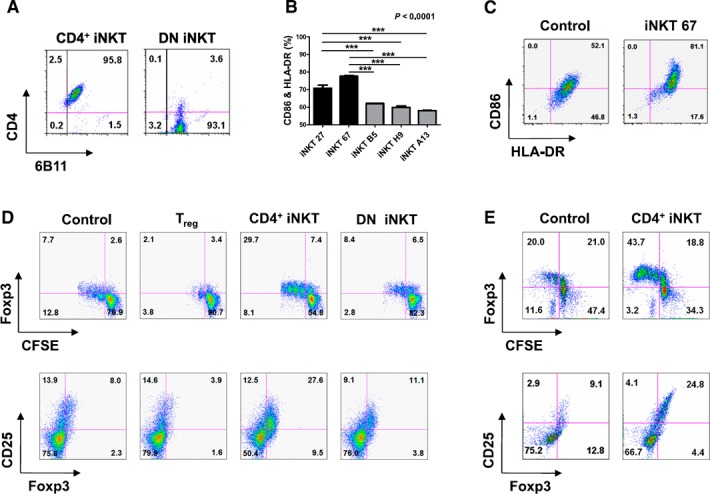
DC maturation and regulatory T‐cell generation in response to CD4+ or DN iNKT cells. (A) FACS profile of representative CD4+ and DN iNKT cells. (B) Human iDCs were differentiated into mature DCs by adding supernatant from anti‐CD3 Ab‐activated CD4+ iNKT cells and DN iNKT cells. The data were obtained from triplicate experiments with each clone. (C) Representative FACS profile of DC maturation induced by PBS only (control) or the culture supernatant from CD4+ iNKT 67. (D) Compared with DN iNKT cells, CD4+ iNKT cells preferentially enhanced Foxp3 and CD25 expression. (E) iDCs were matured with supernatant from CD4+ iNKT cells in Transwells. After 4 d of stimulation with anti‐CD3 and ‐CD28 Abs, CFSE+CD4+T cells were analyzed for Foxp3 and CD25 expression. Significant differences were evaluated with 1‐way analysis of variance followed by Bonferroni's multiple comparison tests. ***P < 0.0001. The results represent 3 independent experiments. Error bars indicate the means ± sd.
CD4+ iNKT cells generate Treg cells and inhibit TH1 and TH17 cell development
Evidence has suggested that iNKT cells could expand the CD4+CD25+Foxp3+ Treg‐cell population [20]. However, the mechanism of iNKT cell function has not been well defined. iNKT cell subsets were tested for their differential capacity to convert CD4+CD25−Foxp3− T cells into Treg cells in a series of in vitro reconstitution experiments. The expression of CD25 and Foxp3 in a coculture of CD4+CD25−Foxp3− T cells with DN iNKT cells was much lower than that with CD4+ iNKT cells (Fig. 1D). Because iNKT cells are believed to control myeloid APC effector function and thereby regulate T‐cell differentiation [21, 22], the coculture experiments in Transwell plates (Corning, Inc., Corning, NY, USA) were repeated with the addition of autologous CD14+‐derived APCs. The iNKT cell‐dependent conversion was markedly enhanced by the inclusion of myeloid APCs, and the conversion was more effective when CD4+ rather than DN iNKT cell lines were used.
In addition, the generation of Treg cells by CD4+ iNKT cells was not caused by cell‐to‐cell contact (Fig. 1E). GalCer stimulation resulted in an expansion of Treg cells from non‐iNKT (6B11−) CD25−CD4+ T cells ( Fig. 2A ). As observed for iNKT cell expansion, IL‐2 neutralization suppressed the expansion of Treg cells in response to α‐GalCer, whereas IL‐15 neutralization did not. Therefore, these results indicate that the IL‐2 secreted by the α‐GalCer‐stimulated iNKT cells enhanced the expansion of Treg cells. Strikingly, iNKT cell‐dependent conversion was markedly enhanced by the inclusion of myeloid APCs, and the conversion was 3‐ to 5‐fold more effective when CD4+ rather than DN iNKT cell lines were used. Owing to phenotypic similarity, Treg cells converted by CD4+ iNKT cells were designated iNKT‐Treg cells (Fig. 2B).
Figure 2.
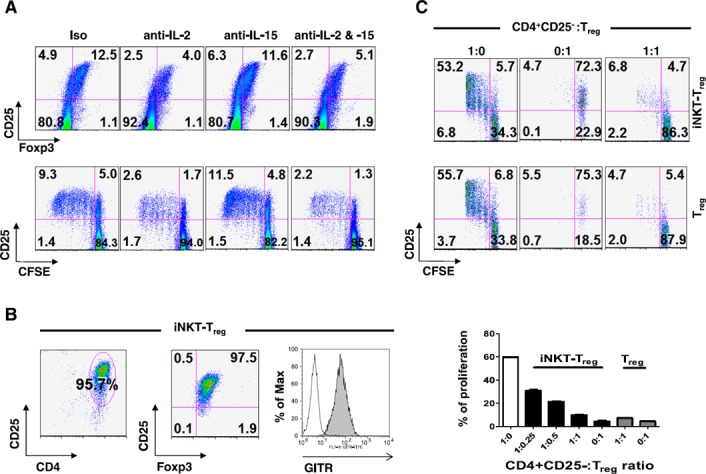
CD4+ iNKT cells selectively generate functional Treg cells (CD4+CD25+Foxp3+) from non‐Treg cells (CD4+CD25−Foxp3−) in an IL‐2‐ and APC‐dependent manner. (A) CFSE‐labeled PBMCs were stimulated with α‐GalCer in the presence of the indicated neutralizing Abs for 5 d. CD4+ T cells (gated at 6B11−) were analyzed for the percentage of CD4+CD25+Foxp3+ cells and CFSE dilution. (B) Established iNKT‐Treg cells were analyzed for purity and Foxp3, CD25, and glucocorticoid‐induced TNF receptor expression. (C) CFSE‐labeled CD4+CD25− T cells were stimulated with anti‐CD3 and anti‐CD28 Abs plus CD14+ APCs in the absence (white bar) or presence (black bars) of iNKT‐Treg cells or presence of CD4+CD25+ T cells (gray bars) for 4 d. The CFSE‐labeled Treg or iNKT‐Treg cells were also stimulated with anti‐CD3 and ‐CD28 Abs plus CD14+ APCs. Proliferation of CFSE+ cells was analyzed with the CFSE dilution method. The data are means ± sd of triplicate experiments.
The iNKT‐Treg cells were analyzed for their suppressive activity on the proliferation of CD4+CD25− T cells. Indeed, the iNKT‐Treg cells and Treg cells were equally efficient in suppressing the proliferation of CD4+CD25− T cells (Fig. 2C). The generation of Treg cells by CD4+ iNKT cells is intriguing, because it explains the immunoregulatory functions of iNKT cells in inflammatory disease. Therefore, it seems reasonable to postulate that CD4+ iNKT cells regulate the differentiation of proinflammatory TH1 and TH17 cells by generating Treg cells ( Fig. 3A and B ). The inclusion of CD4+ iNKT cells or iNKT‐Treg cells with CD4+CD25−Foxp3− T cells and CD14+‐derived APCs significantly suppressed the differentiation of TH1 and TH17 cells (Fig. 3C–F). Even under conditions that efficiently induced TH1 and TH17 cell development, the inclusion of CD4+ iNKT cells suppressed this pathway and skewed the outcome toward the development of Treg cells (Fig. 3F), whereas iNKT‐Treg cells suppressed all forms of differentiation (Fig. 3C). These results allow us to hypothesize that Treg cells suppress the differentiation of proinflammatory TH1 and TH17 cells, even under proinflammatory conditions.
Figure 3.
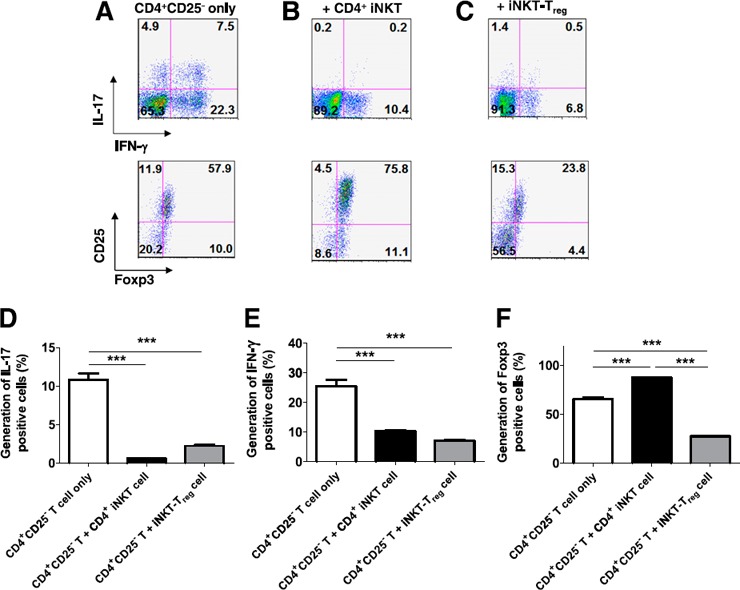
CD4+ iNKT cells suppress Th1 and Th17 cell differentiation by generating Treg cells. CFSE‐labeled CD4+CD25− T cells were stimulated with anti‐CD3 and ‐CD28 Abs plus CD14+ APCs (A) in the presence of CD4+ iNKT (B) or iNKT‐Treg cells (C) for 5 d. CFSE+CD4+ T cells were analyzed for IL‐17+ (D), IFN‐γ+ (E), and Foxp3+ (F) cells. The graphs show present the means ± sd of triplicate experiments. The results represent 3 experiments.
Neutralizing Abs against several cytokines did not block DC maturation
Human and murine iNKT cells have been implicated in the differentiation of tolerogenic myeloid DC subsets [11, 20], and the CD4+ iNKT cell phenotype appears to correspond to an anti‐inflammatory profile [19, 23]. The supernatant from activated CD4+ iNKT cells induces myeloid DC differentiation [11]. In the characterization of CD4+ and DN iNKT cells, it was important to ascertain the cytokines that these cell types secrete after activation. We used the same pair of iNKT cell lines, CD4+ and DN, and harvested the supernatants 24 h after anti‐CD3 Ab activation. Assay of the supernatants on a RayBio human cytokine Ab array of ∼120 different cytokines showed that the inflammatory mediator ICAM [24, 25] and TIMP‐1 [26], as well as the inflammatory cytokines IL‐5, IL‐6, IL‐8, IL‐13, and GM‐CSF, were detected in the supernatants of both types of iNKT cells (Table 1). Of these molecules, TIMP‐1 and IL‐8 have not been described as products of iNKT cells.
Table 1.
Cytokine and chemokine profiling of supernatant of CD4+ and DN iNKT cells
| Intensity | CD4+ iNKT | DN iNKT |
|---|---|---|
| High a | IL‐5, IL‐8, IL‐13, GM‐CSF, TNF‐α, TNF‐β | IL‐5, IL‐6, IL‐8, IL‐13, GM‐CSF, IFN‐γ, TNF‐α, TNF‐β |
| Medium b | IL‐6, MIP‐1 β | TIMP1, MIP‐1 β |
| Low c | IL‐2, Acrp30, ICAM‐1, Oncostatin M, RANTES, sTNFRII, TIMP1, uPAR | Acrp30, FGF‐4, ICAM‐1, NAP‐2, Oncostatin M, RANTES, sTNFRII, uPAR |
Acrp = adipocyte complement‐related protein, RANTES = regulated on activation, normal T cell expressed and secreted, uPAR = urokinase‐type plasminogen activator
Cytokines detected within a minute in the ELISA reaction.
Cytokines detected between 1 and 5 min in the ELISA reaction.
Cytokines detected between 5 and 10 min in the ELISA reaction.
However, the iNKT cell types differed in that the DN iNKT cells produced IFN‐γ but the CD4+ iNKT cells did not. The panel of cytokines and chemokines secreted by both the CD4+ and DN iNKT cells could be expected to induce DC maturation, but only TNF‐α is a strong stimulus for the terminal differentiation of myeloid DCs. Most of the cytokines and chemokines derived from iNKT cells (i.e., GM‐CSF, IL‐4, MIP‐1α, and MIP‐1β) are more crucial for the early maturation of myeloid DCs. IL‐10, IL‐13, and IFN‐γ have been shown to regulate effector function instead of inducing terminal differentiation.
Therefore, we examined the supernatants of anti‐CD3 Ab‐stimulated CD4+ and DN iNKT cells and were unable to discern any significant differences in the levels of these cytokines secreted into the media. The addition of anti‐IL‐4, anti‐IL‐10, anti‐IL‐13, IFN‐γ, and TNF‐α mAbs did not completely inhibit the DC maturation effect of the supernatant prepared from the CD4+ iNKT cells (Supplemental Fig. 1A). In addition, all combinations of IL‐4, IL‐13, and GM‐CSF lacked the DC maturation effect (Supplemental Fig. 1B), and IL‐13 did not induce Treg‐cell generation (Supplemental Fig. 1C). We found no reasonable candidates for promoting DC maturation. Therefore, we investigated DC maturation factors originating from the supernatant of CD4+ iNKT cells by using mass spectrometry.
Purification of DC maturation factors from CD4+ iNKT cells
Previous data have shown that DC maturation factors do not belong to the cytokine or chemokine families of proteins. In addition, the DC maturation effect is not due to cell‐to‐cell contact. Therefore, we prepared culture supernatant of CD4+ iNKT cells activated by anti‐CD3 Ab to purify the DC maturation factors. The prepared supernatant was applied to anion exchange, cation exchange, and affinity chromatography columns as described in Materials and Methods. We then investigated the active regions of anion exchange column chromatography (unbound fractions, collection tubes 3–15; Fig. 4A ), cation exchange column chromatography (bound fractions, collection tubes 27–42; Fig. 4B), and affinity chromatography (bound fractions, collection tubes 9–17; Fig. 4C). DC maturation states were examined by assaying cell surface expression levels of HLA‐DR and CD86 with FACS. We designated as active fractions the samples containing DCs that exhibited high surface expression levels of HLA‐DR and CD86. The final active regions of affinity chromatography were analyzed with SDS‐PAGE, after which we used mass spectrometry for protein identification.
Figure 4.
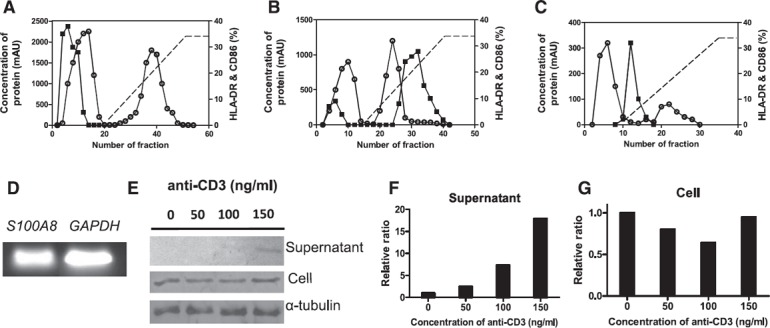
Purification of DC maturation factors secreted by CD4+ iNKT cells with FPLC and the expression of S100A8 in CD4+ iNKT cells. (A) Anti‐CD3 Ab‐activated supernatants from CD4+ iNKT cells were loaded onto an anion exchange chromatography column and eluted with 20 mM Tris‐Cl (pH 8.0) containing 1 M NaCl. To determine the effect on DC maturation, 50 µl of supernatant was taken from each collection tube. The collection tubes in which factors showed effects on DC maturation were freeze dried and dialyzed with 20 mM Tris‐Cl binding buffer at 4°C overnight. (B) The active region was reloaded onto a cation exchange chromatography column, and the active fractions were identified as described for DEAE FF. (C) The active fraction prepared using CM FF was reloaded onto an affinity chromatography column and eluted with 50 mM KH2PO4 containing 1.5 M KCl (pH 7.0). The protein content of the final active fraction was analyzed with mass spectrometry. ○, protein concentration; ▪, DC maturation capacity as assessed via FACS analysis with HLA‐DR and CD86 Abs. RT‐PCR (D), Western blot analysis (E), relative expression and secretion levels of S100A8 (F) , and relative expression level of S100A8 in cells (G), according to the concentration of anti‐CD3 Ab.
Effect of S100A8 on DC maturation
Several noteworthy proteins were obtained in the active chromatography fraction that demonstrated effects on DC maturation in 9 different experiments. The candidate proteins were sorted according to the number of hits from 9 independent purification series (Table 2). Among them, S100A8 was detected 8 times in 9 analyses, and PIP was detected 7 times. ATP‐binding cassette, desmoplakin isoform 1, haptoglobin, serpin peptidase inhibitor clade A (member 3), transferrin, and transthyretin were detected 6 times, whereas ceruloplasmin, hemopexin, mesotrypsin, orosomucoid 1, and serine (or cysteine) proteinase (clade B) were detected 5 times. S100A9, the counterpartner of S100A8, was detected 3 times, along with arginase I. Among these components, we chose several candidates and tested their effects on DC maturation. These candidates included arginase I (R&D Systems), which was identified only 3 times, but was a possible hit; mesotrypsin (rhTrypsin‐3, R&D Systems); S100A8 (Sino Biologic, Beijing, China); S100A9 (Sino Biologic); and PIP (OriGene). The results of Western blot analysis verified that these proteins were expressed in CD4+ iNKT cells. Among them, S100A8 and PIP demonstrated an effect on DC maturation. We focused on the characteristics of S100A8 in this study.
Table 2.
The supernatant of CD4+ iNKT cells’ protein components analyzed by mass spectrometry
| Group a | Protein |
|---|---|
| A | S100A8 |
| B | PIP |
| C | ATP‐binding cassette |
| Desmoplakin isoform 1 | |
| Haptoglobin | |
| Serpin peptidase inhibitor clade A, member 3 | |
| Transferrin | |
| Transthyretin | |
| D | Ceruloplasmin |
| Hemopexin | |
| Mesotrypsin | |
| Orosomucoid 1 | |
| Serine (or cysteine) proteinase inhibitor, clade B |
A: proteins detected 8 times of 9 sample analysis of 4 independent experiments. B: proteins detected 7 times. C: proteins that were detected 6 times. D: proteins detected 5 times.
The gene expression of S100A8 was confirmed in CD4+ iNKT cells with RT‐PCR (Fig. 4D). This expression was also verified in cells, and we used Western blot analysis to check the existence of S100A8 protein in the culture supernatant of CD4+ iNKT cells (Fig. 4E–G). In the supernatant, the level of S100A8 expression increased as the concentration of anti‐CD3 Ab increased (Fig. 4E, F). Next, we tested whether anti‐S100A8 Ab blocked the DC maturation induced by culture supernatant of CD4+ iNKT cells by treating iDCs with 1 µg/ml anti‐S100A8 Ab (R&D Systems) or IgG (control) for 1 h before adding the supernatant from CD4+ iNKT cells. The maturation of iDCs was assessed by measuring the DC surface expression levels of CD86 and HLA‐DR with FACS. The anti‐S100A8 Ab signal decreased to 34.2% in the iDC maturation‐induced culture supernatant of CD4+ iNKT cells (P = 0.0001; Fig. 5A ).
Figure 5.
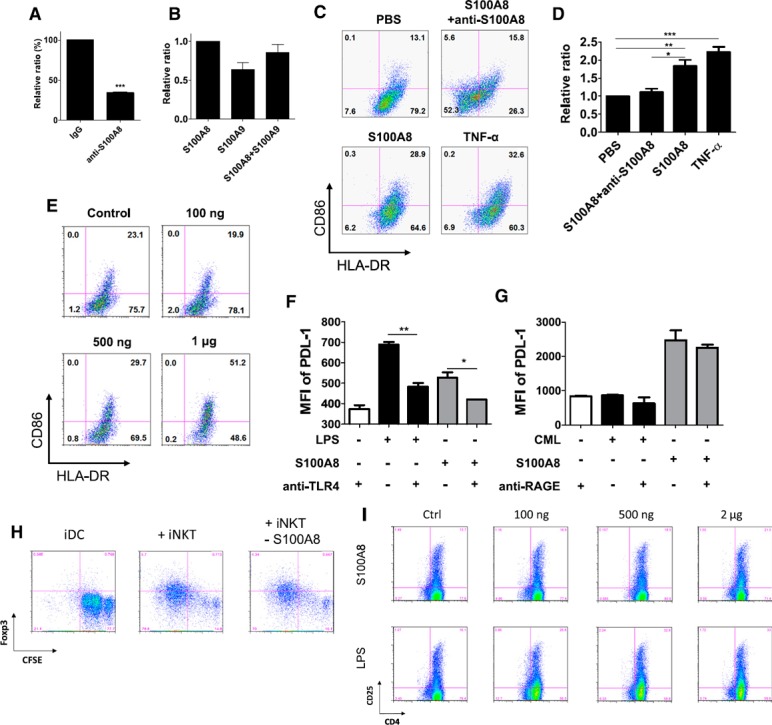
Blocking effect of anti‐S100A8 and anti‐TLR‐4 on DC maturation and inhibition of Treg generation by S100A8 siRNA treatment in CD4+ iNKT cells. (A) A concentration of 1 µg/ml anti‐S100A8 Ab or IgG control was preincubated with the supernatant from CD4+ iNKT cells before iDCs were added. iDC maturation was assessed by measuring the DC surface expression levels of CD86 and HLA‐DR as determined with FACS (t test, P = 0.0001). (B) Effects of recombinant S100A8 and S100A9 and the S100A8‐S100A9 complex on DC maturation (n = 2). (C) Comparison of the effects of S100A8 and TNF‐α on DC maturation. iDCs were treated with PBS as a control, 1 µg/ml S100A8, 1 µg/ml S100A8, and 1 µg/ml anti‐S100A8 Ab, and 100 ng/ml TNF‐α. (D) The data indicate the relative ratios of the various treatments. (E) Maturation effects of various concentrations of S100A8 on iDCs. PDL‐1 expression in DCs after stimulation with LPS, Nɛ‐carboxymethyllysine, and S100A8 with or without anti‐TLR‐4 (F) or anti‐RAGE Ab (G). (H) Reduced Treg‐cell generation after treatment of CD4+ iNKT cells with S100A8 siRNA (10 nM). (I) Comparison of Treg cell generation by S100A8 and LPS in PBMCs. *P < 0.05; **P < 0.001; ***P < 0.0001. Results represent 3 independent experiments. Error bars indicate means ± sd. See also Supplemental Fig. 3.
When we compared this result to the effects of the individual subunits of the S100A8‐S100A9 complex on iDC maturation, we found that both S100A8 alone and the S100A8‐S100A9 complex induced iDC maturation. S100A9 did not induce the level of iDC maturation observed in response to S100A8 alone (P = 0.0386; Fig. 5B). We then compared the effect of recombinant S100A8 protein on iDC maturation to that of TNF‐α and found that S100A8 and TNF‐α had similar effects. Moreover, anti‐S100A8 Ab blocked the effect of S100A8 on DC maturation (Fig. 5C, D). The effect of S100A8 on DC maturation was concentration dependent (Fig. 5E).
S100A8 generates Treg cells from naïve T cells through TLR‐4
S100A8 is known to bind RAGE as well as TLR‐4 and can be associated with inflammation [14, 27, 28–29]. DC maturation induced by S100A8 was blocked by the addition of an anti‐TLR‐4 Ab (Fig. 5F). Nɛ‐carboxymethyllysine, an agonist of RAGE, neither induced DC maturation nor inhibited the maturation‐inducing effect of S100A8 (Fig. 5G). CD4+ iNKT cells were treated with siRNA toward S100A8 to silence the S100A8 gene before adding it to immature DCs, which, compared with the untreated group, induced fewer Treg cells (Fig. 5H). In addition, when S100A8 was added to PBMCs, Treg cells were generated in an S100A8‐concentration–dependent manner (Fig. 5I). These observations may indicate that S100A8 signals for DC maturation are transduced via TLR‐4 signaling, similar to the case with LPS.
TLR activation with LPS is reportedly an on/off signal that controls proinflammatory or tolerogenic DC maturation after interaction with iNKT cells [30]. In addition, iNKT cells have long been known to have quixotic Janus‐like behavior with respect to immune regulation [22]. Given that both human and murine iNKT cells have been implicated in the differentiation of “tolerogenic” myeloid DC subsets [6, 21], we attempted to determine the combination of S100A8, anti‐CD1d, and MHC class II proteins needed to induce tolerogenic DCs. The DC surface expression levels of CD86 and PDL‐1 induced in iDCs by the combination of anti‐CD1d/MHC class II Ab and S100A8 were higher than those induced by any other combination or single agent, but HLA‐DR expression was unaffected ( Fig. 6A ). Several cytokines were secreted by S100A8‐treated DCs, including G‐CSF, GM‐CSF, IFN‐γ, IL‐10, IL‐6, IL‐8, MCP‐1, MIP‐1β, and TNF‐α (Fig. 6B). However, the combination of anti‐CD1d and anti‐MHC class II Abs clearly induced IL‐8. With the exception of IL‐8, the levels of most cytokines—particularly IL‐6—induced by S100A8 were reduced or blocked by combined treatment with anti‐CD1d and anti‐MHC class II Abs (Fig. 6B; Supplemental Fig. 2). Notably, we found that S100A8 activates DCs via TLR‐4 and unidentified receptors. Compared with LPS, S100A8 induces IL‐10, G‐CSF, and PDL‐1, but the induction of IL‐1β, IL‐12, TNF‐α, and IL‐6 is significantly weaker (Fig. 6B, C). The combination of anti‐CD1d and anti‐MHC class II Abs did not induce IL‐10 to the extent observed with S100A8 (Supplemental Fig. 2).
Figure 6.
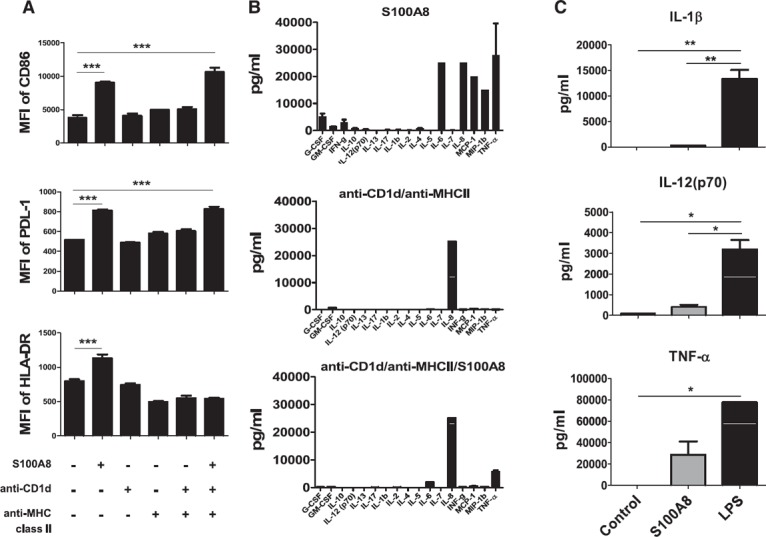
DC maturation with a combination of S100A8, anti‐CD1d Ab, and anti‐MHC class II Ab. Stimulation with a combination of plate‐bound anti‐CD1d/MHC class II Abs iDC maturation (A), cytokine production (B), and lower production of proinflammatory cytokines in S100A8‐treated iDCs (C). iDCs were transferred onto anti‐CD1d/MHC class II Ab‐coated plates and cultured for 48 h with or without soluble S100A8 to induce tolerogenic DCs. Cytokines were analyzed with a human cytokine 17‐plex assay kit. *P < 0.05; **P < 0.001. Error bars indicate means ± sd. See also Supplemental Fig. 2.
Next, we evaluated whether S100A8‐induced mature DCs or a combination of anti‐CD1d and MHC class II Abs could induce Treg cells. The S100A8‐treated DC group ( Fig. 7A, B ), the combination of anti‐CD1d and anti‐MHC class II Abs and S100A8‐treated DC groups treated with the combination of anti‐CD1d and anti‐MHC class II Abs generated Treg cells, but Treg cells were not generated in the anti‐CD1d and anti‐MHC class II Ab‐treated groups (Fig. 7A, B). In addition, Treg‐cell generation was enhanced depending on the concentration of S100A8 (from 100 ng to 2 μg; Supplemental Fig. 3A) and reduced by S100A8 siRNA (Supplemental Fig. 3B).
Figure 7.
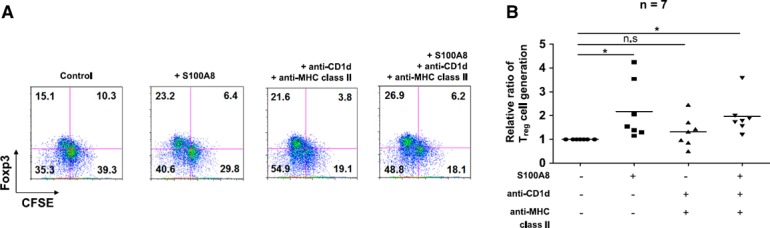
S100A8 and the combination of plate‐bound anti‐CD1d/MHC class II Abs stimulate iDCs to induce CD4+CD25+Foxp3+ T cells. (A) Representative FACS profiles of Treg‐cell generation induced by the combination of S100A8, anti‐CD1d, and anti‐MHC class II Abs. (B) Treg‐cell generation by the combination of S100A8, anti‐CD1d, and ‐MHC class II Abs. iDCs were transferred to anti‐CD1d/MHC class II Ab–coated plates and cultured for 48 h with or without soluble S100A8 to induce tolerogenic DCs. Tolerogenic DCs were cocultured with CFSE‐labeled CD4+CD25−Foxp3− T cells with 1 µg/ml anti‐CD3, 500 ng/ml anti‐CD28, and 50 U/ml IL‐2 for 5 d. The development of Treg cells was assessed by determining the expression levels of CD4, CD25, and Foxp3 via FACS analysis. See also Supplemental Fig. 3.
Transcription factors induced by S100A8 in tolerogenic DCs
We investigated the transcription factors potentially induced by S100A8 by activating iDCs with S100A8 and including an LPS‐treated iDC group as a positive control and an untreated iDC group as a negative control. Before preparing the samples for transcription factor assays, we used FACS to analyze the iDC maturation state after 6 h (Supplemental Fig. 4) and 48 h ( Fig. 8 ) of S100A8 and LPS treatment. We then analyzed the expression levels of 28 transcription factors with a Procarta Transcription Factor Plex kit (Affymetrix, Santa Clara, CA, USA). After 6 h of treatment, we found no significant increase in DC maturation state, and no changes were observed in the levels of several transcription factors, including NF‐κB, AP‐1, ATF‐2, and HSF‐1 (Supplemental Fig. 4). However, after 48 h of treatment, the expression of CD86, PDL‐1, and HLA‐DR significantly increased. In addition, we found that NF‐κB and AP‐1 were upregulated by both S100A8 and LPS treatment, and ATF‐2 and HSF‐1 were upregulated by S100A8 (Fig. 8).
Figure 8.
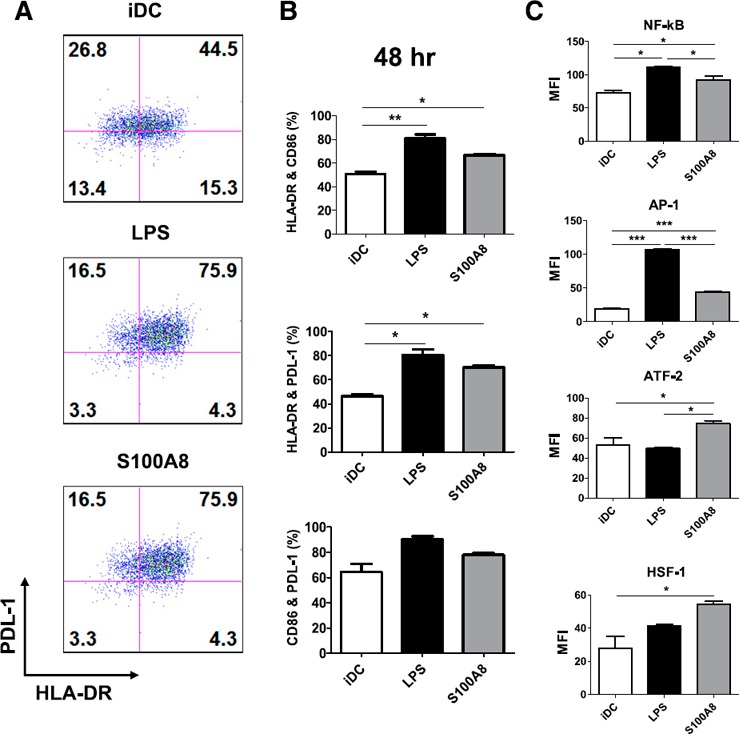
Profiling S100A8‐induced activation of transcription factors with a microsphere‐based active transcription factor assay system. Nuclear extracts were prepared from DCs treated with S100A8 and LPS for 48 h. The maturation states of iDCs were evaluated with FACS analysis for PDL‐1 and HLA‐DR expression levels (A, B). Nuclear extracts (2 μg each) were incubated with a biotin‐labeled probe mix. The protein‐bound probes were isolated, hybridized to the transcription factor probe‐conjugated microsphere mix, and analyzed. (C) LPS and S100A8 treatment significantly increased transcription factor levels. See also Supplemental Fig. 4.
DISCUSSION
DCs are key mediators of adaptive immunity. In the absence of bodily infection, DCs in peripheral tissue rest in an immature state with limited capacity to stimulate naïve T cells. However, once infection occurs, DCs mature in a process characterized by phenotypic changes that results in an improved potential to promote T‐cell responses. DC maturation can be induced directly via stimulation through DC‐expressed TLRs or indirectly via exposure to cytokines released by local immune or nonimmune cells stimulated through their own TLRs. iNKT cells promote enhanced T‐cell responses when activated by a powerful stimulus, such as the synthetic glycolipid α‐GalCer, which implies that iNKT cells can provide all of the signals required for DC activation [31].The mechanism controlling the generation of proinflammatory DCs, as opposed to tolerogenic DCs, remains a critical question in the ontogeny of autoimmunity.
Steinman and Nussenzweig [32] proposed that in the absence of infection or inflammation, a steady‐state flux of immature DCs captures and processes endogenous antigens [32]. These DCs then define immunologic “self” and induce tolerance by specifically silencing autoreactive T‐cells and promoting the development of Treg cells [33]. Although iDCs appear to harbor the capacity to induce tolerance to self and foreign antigens, there are many recent examples of DCs with potent tolerogenic capacity differentiated both in vivo and in vitro [11, 34]. Notably, the Bluestone group [35] recently demonstrated that Treg cells interact directly with DCs bearing islet antigens in vivo and that this interaction precedes the inhibition of Th cell activation by DCs. The explanation for these apparently contradictory functions appears to lie in the remarkable capability of iDCs to differentiate into specific functional subtypes during maturation [36]. Depending on the lineage (i.e., myeloid or lymphoid) and maturation stimulus, DCs potently control T‐cell effector function and cytokine profiles [20. 37].
The exchange of information between DCs and T cells is not unilateral. Although DCs are necessary for the efficient priming of antigen‐specific lymphocyte responses, T cells are also essential for optimal DC maturation [37]. Several studies, including our own, have underscored the regulatory importance of the cross talk between DCs and iNKT cells in shaping immune response and controlling the relative percentage of DC subsets [11, 38].
Autoreactive iNKT cells have also recently been demonstrated to induce DC maturation directly and potently. Moreover, mature DCs exposed to iNKT cells produce more IL‐10 than IL‐12, a phenotype consistent with tolerogenic function [19]. When we examined the supernatants of anti‐CD3 Ab‐stimulated CD4+ and DN iNKT cells, we found that the CD4+ iNKT cells produced more Treg cells by generating tolerogenic DCs. Conventional CD4+ T cells did not behave similarly (Supplemental Fig. S5). In addition, our results demonstrated that stimulation with anti‐CD3 Ab increased only the level of S100A8 in the supernatant. The levels of S100A8 remaining in the cells were similar regardless of the amount of anti‐CD3 Ab, indicating that the increase in S100A8 observed under CD3 stimulation results from secretion, not from cell death (Fig. 4). Therefore, we attempted to identify the factors that could induce tolerogenic DCs to generate Treg cells. The addition of anti‐IL‐4, IL‐10, GM‐CSF, IFN‐γ, and TGF‐β1 mAbs did not inhibit the activity of the supernatant or the partially purified proteins from CD4+ iNKT cells (Supplemental Fig. 1A). Furthermore, combinations of mAbs did not abrogate the effect on DC maturation. The lack of inhibition by mAbs is consistent with cytokine array data and enzyme‐linked immunosorbent assay findings, which demonstrated no differences in the upregulation or secretion of these cytokines between CD4+ and DN iNKT cells ( Table 1 ; Supplemental Fig. 1A, B).
Several proteins were identified by mass spectrometry analysis ( Table 2 ). PIP was detected 7 times in this analysis. PIP binds to CD4 [39] and exerts a potent inhibitory effect on T‐lymphocyte apoptosis mediated by CD4 and TCR activation [40]. It also initiates fibronectin‐specific aspartyl protease activity [41]. PIP overexpression has been demonstrated in primary and metastatic breast cancers [42] and in some breast carcinoma cell lines. The exact function of this protein in mammary tumor progression remains unclear [43]. However, we discovered that PIP induced Treg cells through tolerogenic DC generation (data not shown). Among them, S100A8 manifested the most hits. This molecule was expressed and secreted by iNKT cells (Fig. 4) and exhibited an effect on DC maturation (Fig. 5E) equal to those of LPS and TNF‐α (Fig. 5C, D). S100A8 forms a complex with S100A9 and is upregulated in inflammatory diseases such as sepsis, rheumatoid arthritis, inflammatory bowel disease, allograft rejection, lung disease, vasculitis, and cancer [44, 45, 46–47].
The S100A8‐S100A9 complex is secreted by activated phagocytes and has proinflammatory effects. The abnormally elevated expression of these proteins was recently identified in an inflammatory disorder characterized by recurrent infections and systematic inflammation, which also indicates a central role for the S100A8‐S100A9 complex in the inflammatory process. In addition, the extracellular function of these proteins was recently observed in sepsis. S100A8 is an active component that induces the intracellular translocation of myeloid differentiation primary response protein 88 and the activation of IL‐1 receptor‐associated kinase‐1 and NF‐κB, which results in the elevated expression of TNF‐α. S100A8 interacts with the TLR‐4‐MD2 complex, thus representing an endogenous ligand for TLR‐4. Therefore, the S100A8‐S100A9 complex is a novel inflammatory component that amplifies phagocyte activation upstream of TNF‐α‐dependent effects during sepsis [14].
Similar results have been reported by Petersen et al. [48], who demonstrated the upregulation of CD86 and MHC class II proteins on the surface of BMDCs in C57BL/6 mice after stimulation with S100A8 for 48 h and proliferation of CD4 and CD8 T cells with mature BMDCs. They described the role of S100A8 as proinflammatory in innate immunity and regulatory in adaptive immunity, which may be a key mechanism for preventing tissue damage owing to overwhelming immune responses [48].
During DC maturation, S100A9 did not enhance the function of S100A8 (Fig. 5B), and S100A8‐mediated signaling was transduced via TLR‐4 (Fig. 5F). A similar result reported previously showed that BMDC activation by S100A8 in mice was mediated by TLR‐4, whereas RAGE was not involved [48]. In addition, S100A8 generated Treg cells in a concentration‐dependent manner (Supplemental Fig. 3), which was enhanced by the addition of anti‐CD1d and anti‐MHC class II Abs (Fig. 7). However, S100A8 was expressed in both CD4+ iNKT and DN iNKT cells. We hypothesize that CD4+ iNKT cells generate tolerogenic DCs that support the differentiation of Treg cells from naïve T cells, and this result suggests that other candidates described above for DC maturation are expressed only in CD4+ iNKT cells or that other control mechanisms reduce or inhibit the function of S100A8 in DN iNKT cells.
Notably, 2 transcription factors, ATF‐2 and HSF‐1, were elevated by S100A8 stimulation in mature DCs, but were not elevated by LPS stimulation (Fig. 8). Various forms of cellular stress, including genotoxic agents, inflammatory cytokines, and ultraviolet irradiation, stimulate the transcriptional activity of ATF‐2 [49, 50]. ATF‐2 is activated by TGF‐β signaling and cooperates with Smad3 to mediate TGF‐β effects on chondrocyte maturation [51]. The relationship between TLR signaling and ATF‐2 expression was recently explained by Altmayr et al. [52], who showed that ATF‐2 is involved in the transcriptional regulation of TLR‐stimulated (especially TLR2) TNF‐α production in DCs [52]. However, whether ATF‐2 correlates with TLR‐4 signaling remains unclear.
In addition, ATF‐2 plays a central role in TGF‐β signaling by acting as a common nuclear target of both the Smad and TGF‐β activated kinase‐1 pathways [53]. The regulation of TNF‐α expression is rigorous and redundant. At the transcriptional level, LPS‐induced TNF‐α expression is regulated by NF‐κB, which interacts with multiple sites in the TNF‐α promoter [54] and the assembly of the core enhanceosome complex containing Sp1, ATF‐2, and Ets proteins on the proximal TNF‐α promoter [55, 56]. In this regulation mechanism, another transcription factor induced by S100A8‐stimulated DCs, HSF‐1 (Fig. 8), represses LPS‐induced TNF‐α transcription by binding to a heat‐shock response element in the murine TNF‐α 5′‐flanking sequence [57, 58–59]. In Caenorhabditis elegans, HSF‐1 interconnects the insulin/insulin‐like growth factor‐1, TGF‐β, and cGMP neuroendocrine systems to control development and longevity in response to diverse environmental stimuli. Furthermore, HSF‐1 upregulates another TGF‐β pathway‐interacting gene, daf‐9/cytochrome P450, thereby fine tuning the decision between normal growth and dauer formation [60].
The presence of endogenous Hsp70 in mice, guaranteed by the presence of its transcription factor HSF‐1, protects against induced colitis [61]. More recently, treatment with whole endotoxin‐free Mycobacterium tuberculosis‐Hsp70 inhibited the acute rejection of skin and tumor allografts [62]. Consequently, disease‐suppressive effects have been observed for both microbial and self (mammalian) Hsp70 in some studies of whole proteins and in others examining only peptides. The transfer of Hsp70 peptide‐induced Treg cells suppresses ongoing experimental arthritis [63]. S100A8 appears to belong to damage‐associated molecular patterns such as Hsp70, which is expressed in stressed cells. It may share a signaling pathway or the transcription factor HSF‐1 to generate Treg cells for tolerance to cell stress [64].
In conclusion, this study demonstrates that S100A8 is a factor secreted by CD4+ iNKT cells that induces tolerogenic DC maturation involved in Treg generation ( Fig. 9 ). However, many other factors in the culture supernatant produced by iNKT cells remain to be elucidated, because a combination of S100A8 siRNA and PIP siRNA reduced Treg generation compared to that resulting from the application of each siRNA alone (Fig. 5H; Supplemental Fig. 3B).
Figure 9.
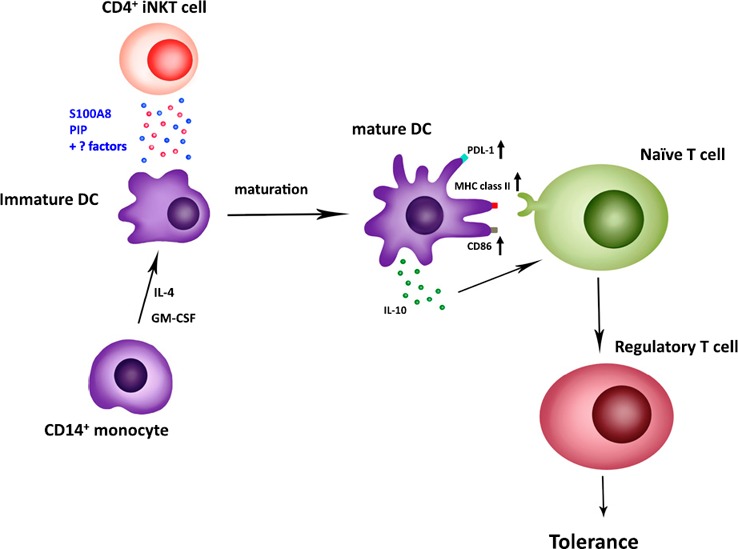
Dendritic cell maturation induced by S100A8 secreted from CD4+iNKT cells. Anti‐CD3 Ab with anti‐CD28 Ab or α‐GalCer‐activated CD4+ iNKT cells secrete S100A8 or PIP, or both, to upregulate PDL‐1, MHC class II, and CD86 on the surface of DCs. Mature DCs also secrete IL‐10. Finally, both results lead to the induction of Treg‐cell proliferation from naïve T cells.
AUTHORSHIP
H.W.L. conceived the study, performed the experiments, analyzed the data, prepared the figures, and wrote the manuscript. H.B.J. performed the Th1 and Th17 cell differentiation experiments. P.L.B. performed the cytokine profiling of supernatant of NKT cells. D.S. performed mass spectrometry. T.S.K. supervised the study. B.S.W. designed and supervised the study.
DISCLOSURES
The authors declare no conflicts of interest.
Supporting information
Supplementary Material Files
Supplementary Material Files
ACKNOWLEDGMENTS
This work was supported in part by grants 2RO1 AI 45051‐06AI, JDRF 1‐2004‐771, and U.S. National Institutes of Health U19AI046130 awarded to S. B. Wilson, and a research grant by Inha University awarded to T. S. Kim. The authors thank Ms. Sangeun Lee (University of Pennsylvania) for developing a conceptual figure.
Contributor Information
Tong‐Soo Kim, Email: tongsookim@inha.ac.kr.
Brian S. Wilson, Email: bwilson1@ufl.edu
REFERENCES
- 1. Porcelli, S. , Yockey, C. E. , Brenner, M. B. , Balk, S. P. (1993) Analysis of T cell antigen receptor (TCR) expression by human peripheral blood CD4‐8‐ alpha/beta T cells demonstrates preferential use of several V beta genes and an invariant TCR alpha chain. J. Exp. Med. 178, 1–16. [DOI] [PMC free article] [PubMed] [Google Scholar]
- 2. Naidenko, O. V. , Maher, J. K. , Ernst, W. A. , Sakai, T. , Modlin, R. L. , Kronenberg, M. (1999) Binding and antigen presentation of ceramidecontaining glycolipids by soluble mouse and human CD1d molecules. J. Exp. Med. 190, 1069–1080. [DOI] [PMC free article] [PubMed] [Google Scholar]
- 3. Wilson, S. B. , Kent, S. C. , Horton, H. F. , Hill, A. A. , Bollyky, P. L. , Hafler, D. A. , Strominger, J. L. , Byrne, M. C. (2000) Multiple differences in gene expression in regulatory Vα24JαQT cells from identical twins discordant for type I diabetes. Proc. Natl. Acad. Sci. USA 97, 7411–7416. [DOI] [PMC free article] [PubMed] [Google Scholar]
- 4. Moodycliffe, A. M. , Nghiem, D. , Clydesdale, G. , Ullrich, S. E. (2000) Immune suppression and skin cancer development: regulation by NKT cells. Nat. Immunol. 1, 521–525. [DOI] [PubMed] [Google Scholar]
- 5. Wilson, S. B. , Kent, S. C. , Patton, K. T. , Orban, T. , Jackson, R. A. , Exley, M. , Porcelli, S. , Schatz, D. A. , Atkinson, M. A. , Balk, S. P. , Strominger, J. L. , Hafler, D. A. (1998) Extreme Th1 bias of invariant Valpha24JalphaQ T cells in type 1 diabetes. Nature 391, 177–181. [DOI] [PubMed] [Google Scholar]
- 6. Naumov, Y. N. , Bahjat, K. S. , Gausling, R. , Abraham, R. , Exley, M. A. , Koezuka, Y. , Balk, S. B. , Strominger, J. L. , Clare‐Salzer, M. , Wilson, S. B. (2001) Activation of CD1d‐restricted T cells protects NOD mice from developing diabetes by regulating dendritic cell subsets. Proc. Natl. Acad. Sci. USA 98, 13838–13843. [DOI] [PMC free article] [PubMed] [Google Scholar]
- 7. Sharif, S. , Arreaza, G. A. , Zucker, P. , Mi, Q. S. , Sondhi, J. , Naidenko, O. V. , Kronenberg, M. , Koezuka, Y. , Delovitch, T. L. , Gombert, J. M. , Leite‐De‐Moraes, M. , Gouarin, C. , Zhu, R. , Hameg, A. , Nakayama, T. , Taniguchi, M. , Lepault, F. , Lehuen, A. , Bach, J. F. , Herbelin, A. (2001) Activation of natural killer T cells by α‐galactosylceramide treatment prevents the onset and recurrence of autoimmune type 1 diabetes. Nat. Med. 7, 1057–1062. [DOI] [PubMed] [Google Scholar]
- 8. Behar, S. M. , Dascher, C. C. , Grusby, M. J. , Wang, C. R. , Brenner, M. B. (1999) Susceptibility of mice deficient in CD1D or TAP1 to infection with Mycobacterium tuberculosis. J. Exp. Med. 189, 1973–1980. [DOI] [PMC free article] [PubMed] [Google Scholar]
- 9. Kakimi, K. , Guidotti, L. G. , Koezuka, Y. , Chisari, F. V. (2000) Natural killer T cell activation inhibits hepatitis B virus replication in vivo. J. Exp. Med. 192, 921–930. [DOI] [PMC free article] [PubMed] [Google Scholar]
- 10. Gonzalez‐Aseguinolaza, G. , de Oliveira, C. , Tomaska, M. , Hong, S. , Bruna‐Romero, O. , Nakayama, T. , Taniguchi, M. , Bendelac, A. , Van Kaer, L. , Koezuka, Y. , Tsuji, M. (2000) α‐Galactosylceramide‐activated Valpha 14 natural killer T cells mediate protection against murine malaria. Proc. Natl. Acad. Sci. USA 97, 8461–8466. [DOI] [PMC free article] [PubMed] [Google Scholar]
- 11. Hegde, S. , Chen, X. , Keaton, J. M. , Reddington, F. , Besra, G. S. , Gumperz, J. E. (2007) NKT cells direct monocytes into a DC differentiation pathway. J. Leukoc. Biol. 81, 1224–1235. [DOI] [PubMed] [Google Scholar]
- 12. Roth, J. , Burwinkel, F. , van den Bos, C. , Goebeler, M. , Vollmer, E. , Sorg, C. (1993) MRP8 and MRP14, S‐100‐like proteins associated with myeloid differentiation, are translocated to plasma membrane and intermediate filaments in a calcium‐dependent manner. Blood 82, 1875–1883. [PubMed] [Google Scholar]
- 13. Viemann, D. , Strey, A. , Janning, A. , Jurk, K. , Klimmek, K. , Vogl, T. , Hirono, K. , Ichida, F. , Foell, D. , Kehrel, B. , Gerke, V. , Sorg, C. , Roth, J. (2005) Myeloid‐related proteins 8 and 14 induce a specific inflammatory response in human microvascular endothelial cells. Blood 105, 2955–2962. [DOI] [PubMed] [Google Scholar]
- 14. Vogl, T. , Tenbrock, K. , Ludwig, S. , Leukert, N. , Ehrhardt, C. , van Zoelen, M. A. D. , Nacken, W. , Foell, D. , van der Poll, T. , Sorg, C. , Roth, J. (2007) Mrp8 and Mrp14 are endogenous activators of Toll‐like receptor 4, promoting lethal, endotoxin‐induced shock. Nat. Med. 13, 1042–1049. [DOI] [PubMed] [Google Scholar]
- 15. Exley, M. A. , Hou, R. , Shaulov, A. , Tonti, E. , Dellabona, P. , Casorati, G. , Akbari, O. , Akman, H. O. , Greenfield, E. A. , Gumperz, J. E. , Boyson, J. E. , Balk, S. P. , Wilson, S. B. (2008) Selective activation, expansion, and monitoring of human iNKT cells with a monoclonal antibody specific for the TCR alpha‐chain CDR3 loop. Eur. J. Immunol. 38, 1756–1766. [DOI] [PMC free article] [PubMed] [Google Scholar]
- 16. Kim, D. S. , Cho, H. J. , Yang, S. K. , Shin, J. W. , Huh, C. H. , Park, K. C. (2009) Insulin‐like growth factor‐binding protein contributes to the proliferation of less proliferative cells in forming skin equivalents. Tissue Eng. Part A 15, 1075–1080. [DOI] [PubMed] [Google Scholar]
- 17. Hou, R. , Goloubeva, O. , Neuberg, D. S. , Strominger, J. L. , Wilson, S. B. (2003) Interleukin‐12 and interleukin‐2‐induced invariant natural killer T‐cell cytokine secretion and perforin expression independent of T‐cell receptor activation. Immunology 110, 30–37. [DOI] [PMC free article] [PubMed] [Google Scholar]
- 18. Yaoi, T. , Jiang, X. , Li, X. (2006) Development of a fluorescent microsphere‐based multiplexed high‐throughput assay system for profiling of transcription factor activation. Assay Drug Dev. Technol. 4, 285–292. [DOI] [PubMed] [Google Scholar]
- 19. Hegde, S. , Fox, L. , Wang, X. , Gumperz, J. E. (2010) Autoreactive natural killer T cells: promoting immune protection and immune tolerance through varied interactions with myeloid antigen‐presenting cells. Immunology 130, 471–483. [DOI] [PMC free article] [PubMed] [Google Scholar]
- 20. Liu, R. , La Cava, A. , Bai, X. F. , Jee, Y. , Price, M. , Campagnolo, D. I. , Christadoss, P. , Vollmer, T. L. , Van Kaer, L. , Shi, F. D. (2005) Cooperation of invariant NKT cells and CD4+CD25+ T regulatory cells in the prevention of autoimmune myasthenia. J. Immunol. 175, 7898–7904. [DOI] [PubMed] [Google Scholar]
- 21. Vincent, M. S. , Leslie, D. S. , Gumperz, J. E. , Xiong, X. , Grant, E. P. , Brenner, M. B. (2002) CD1‐dependent dendritic cell instruction. Nat. Immunol. 3, 1163–1168. [DOI] [PubMed] [Google Scholar]
- 22. Wilson, S. B. , Delovitch, T. L. (2003) Janus‐like role of regulatory iNKT cells in autoimmune disease and tumour immunity. Nat. Rev. Immunol. 3, 211–222. [DOI] [PubMed] [Google Scholar]
- 23. Mars, L. T. , Araujo, L. , Kerschen, P. , Diem, S. , Bourgeois, E. , Van, L. P. , Carrié, N. , Dy, M. , Liblau, R. S. , Herbelin, A. (2009) Invariant NKT cells inhibit development of the Th17 lineage. Proc. Natl. Acad. Sci. USA 106, 6238–6243. [DOI] [PMC free article] [PubMed] [Google Scholar]
- 24. Hayflick, J. S. , Kilgannon, P. , Gallatin, W. M. (1998) The intercellular adhesion molecule (ICAM) family of proteins: new members and novel functions. Immunol. Res. 17, 313–327. [DOI] [PubMed] [Google Scholar]
- 25. Takahashi, T. , Nieda, M. , Koezuka, Y. , Nicol, A. , Porcelli, S. A. , Ishikawa, Y. , Tadokoro, K. , Hirai, H. , Juji, T. (2000) Analysis of human V alpha 24+ CD4+ NKT cells activated by alpha‐glycosylceramide‐pulsed monocyte‐derived dendritic cells. J. Immunol. 164, 4458–4464. [DOI] [PubMed] [Google Scholar]
- 26. Contasta, I. , Berghella, A. M. , Pellegrini, P. , Del Beato, T. , Casciani, C. A. , Adorno, D. (1999) Relationships between the activity of MMP1/TIMP1 enzymes and the TH1/TH2 cytokine network. Cancer Biother. Radiopharm. 14, 465–475. [DOI] [PubMed] [Google Scholar]
- 27. Boyd, J. H. , Kan, B. , Roberts, H. , Wang, Y. , Walley, K. R. (2008) S100A8 and S100A9 mediate endotoxin‐induced cardiomyocyte dysfunction via the receptor for advanced glycation end products. Circ. Res. 102, 1239–1246. [DOI] [PubMed] [Google Scholar]
- 28. Yan, S. F. , Yan, S. D. , Ramasamy, R. , Schmidt, A. M. (2009) Tempering the wrath of RAGE: an emerging therapeutic strategy against diabetic complications, neurodegeneration, and inflammation. Ann. Med. 41, 408–422. [DOI] [PMC free article] [PubMed] [Google Scholar]
- 29. Perera, C. , McNeil, H. P. , Geczy, C. L. (2010) S100 calgranulins in inflammatory arthritis. Immunol. Cell Biol. 88, 41–49. [DOI] [PubMed] [Google Scholar]
- 30. Caielli, S. , Conforti‐Andreoni, C. , Di Pietro, C. , Usuelli, V. , Badami, E. , Malosio, M. L. , Falcone, M. (2010) On/off TLR signaling decides proinflammatory or tolerogenic dendritic cell maturation upon CD1dmediated interaction with invariant NKT cells. J. Immunol. 185, 7317–7329. [DOI] [PubMed] [Google Scholar]
- 31. Hermans, I. F. , Silk, J. D. , Gileadi, U. , Masri, S. H. , Shepherd, D. , Farrand, K. J. , Salio, M. , Cerundolo, V. (2007) Dendritic cell function can be modulated through cooperative actions of TLR ligands and invariant NKT cells. J. Immunol. 178, 2721–2729. [DOI] [PubMed] [Google Scholar]
- 32. Steinman, R. M. , Nussenzweig, M. C. (2002) Avoiding horror autotoxicus: the importance of dendritic cells in peripheral T cell tolerance. Proc. Natl. Acad. Sci. USA 99, 351–358. [DOI] [PMC free article] [PubMed] [Google Scholar]
- 33. Jonuleit, H. , Schmitt, E. , Schuler, G. , Knop, J. , Enk, A. H. (2000) Induction of interleukin 10‐producing, nonproliferating CD4(+) T cells with regulatory properties by repetitive stimulation with allogeneic immature human dendritic cells. J. Exp. Med. 192, 1213–1222. [DOI] [PMC free article] [PubMed] [Google Scholar]
- 34. Albert, M. L. , Jegathesan, M. , Darnell, R. B. (2001) Dendritic cell maturation is required for the cross‐tolerization of CD8+ T cells. Nat. Immunol. 2, 1010–1017. [DOI] [PubMed] [Google Scholar]
- 35. Tang, Q. , Adams, J. Y. , Tooley, A. J. , Bi, M. , Fife, B. T. , Serra, P. , Santamaria, P. , Locksley, R. M. , Krummel, M. F. , Bluestone, J. A. (2006) Visualizing regulatory T cell control of autoimmune responses in nonobese diabetic mice. Nat. Immunol. 7, 83–92. [DOI] [PMC free article] [PubMed] [Google Scholar]
- 36. Banchereau, J. , Briere, F. , Caux, C. , Davoust, J. , Lebecque, S. , Liu, Y. J. , Pulendran, B. , Palucka, K. (2000) Immunobiology of dendritic cells. Annu. Rev. Immunol. 18, 767–811. [DOI] [PubMed] [Google Scholar]
- 37. Rissoan, M. C. , Soumelis, V. , Kadowaki, N. , Grouard, G. , Briere, F. , de Waal Malefyt, R. , Liu, Y. J. (1999) Reciprocal control of T helper cell and dendritic cell differentiation. Science 283, 1183–1186. [DOI] [PubMed] [Google Scholar]
- 38. Kitamura, H. , Iwakabe, K. , Yahata, T. , Nishimura, S. , Ohta, A. , Ohmi, Y. , Sato, M. , Takeda, K. , Okumura, K. , Van Kaer, L. , Kawano, T. , Taniguchi, M. , Nishimura, T. (1999) The natural killer T (NKT) cell ligand alpha‐galactosylceramide demonstrates its immunopotentiating effect by inducing interleukin (IL)‐12 production by dendritic cells and IL‐12 receptor expression on NKT cells. J. Exp. Med. 189, 1121–1128. [DOI] [PMC free article] [PubMed] [Google Scholar]
- 39. Autiero, M. , Abrescia, P. , Guardiola, J. (1991) Interaction of seminal plasma proteins with cell surface antigens: presence of a CD4‐binding glycoprotein in human seminal plasma. Exp. Cell Res. 197, 268–271. [DOI] [PubMed] [Google Scholar]
- 40. Gaubin, M. , Autiero, M. , Basmaciogullari, S. , Métivier, D. , Mis hal, Z. , Culerrier, R. , Oudin, A. , Guardiola, J. , Piatier‐Tonneau, D. (1999) Potent inhibition of CD4/TCR‐mediated T cell apoptosis by a CD4‐binding glycoprotein secreted from breast tumor and seminal vesicle cells. J. Immunol. 162, 2631–2638. [PubMed] [Google Scholar]
- 41. Caputo, E. , Manco, G. , Mandrich, L. , Guardiola, J. (2000) A novel aspartyl proteinase from apocrine epithelia and breast tumors. J. Biol. Chem. 275, 7935–7941. [DOI] [PubMed] [Google Scholar]
- 42. Clark, J. W. , Snell, L. , Shiu, R. P. , Orr, F. W. , Maitre, N. , Vary, C. P. , Cole, D. J. , Watson, P. H. (1999) The potential role for prolactin‐inducible protein (PIP) as a marker of human breast cancer micrometastasis. Br. J. Cancer 81, 1002–1008. [DOI] [PMC free article] [PubMed] [Google Scholar]
- 43. Debily, M. A. , Marhomy, S. E. , Boulanger, V. , Eveno, E. , Mariage‐Samson, R. , Camarca, A. , Auffray, C. , Piatier‐Tonneau, D. , Imbeaud, S. (2009) A functional and regulatory network associated with PIP expression in human breast cancer. PLoS One 4, e4696. [DOI] [PMC free article] [PubMed] [Google Scholar]
- 44. Lügering, N. , Stoll, R. , Kucharzik, T. , Schmid, K. W. , Rohlmann, G. , Burmeister, G. , Sorg, C. , Domschke, W. (1995) Immunohistochemical distribution and serum levels of the Ca(2+)‐binding proteins MRP8, MRP14 and their heterodimeric form MRP8/14 in Crohn's disease. Digestion 56, 406–414. [DOI] [PubMed] [Google Scholar]
- 45. Frosch, M. , Vogl, T. , Seeliger, S. , Wulffraat, N. , Kuis, W. , Viemann, D. , Foell, D. , Sorg, C. , Sunderkötter, C. , Roth, J. (2003) Expression of myeloid‐related proteins 8 and 14 in systemic‐onset juvenile rheumatoid arthritis. Arthritis Rheum. 48, 2622–2626. [DOI] [PubMed] [Google Scholar]
- 46. Seeliger, S. , Vogl, T. , Engels, I. H. , Schröder, J. M. , Sorg, C. , Sunderkötter, C. , Roth, J. (2003) Expression of calcium‐binding proteins MRP8 and MRP14 in inflammatory muscle diseases. Am. J. Pathol. 163, 947–956. [DOI] [PMC free article] [PubMed] [Google Scholar]
- 47. Foell, D. , Frosch, M. , Sorg, C. , Roth, J. (2004) Phagocyte‐specific calcium‐binding S100 proteins as clinical laboratory markers of inflammation. Clin. Chim. Acta 344, 37–51. [DOI] [PubMed] [Google Scholar]
- 48. Petersen, B. , Wolf, M. , Austermann, J. , van Lent, P. , Foell, D. , Ahlmann, M. , Kupas, V. , Loser, K. , Sorg, C. , Roth, J. , Vogl, T. (2013) The alarmin Mrp8/14 as regulator of the adaptive immune response during allergic contact dermatitis. EMBO J. 32, 100–111. [DOI] [PMC free article] [PubMed] [Google Scholar]
- 49. Gupta, S. , Campbell, D. , Dérijard, B. , Davis, R. J. (1995) Transcription factor ATF2 regulation by the JNK signal transduction pathway. Science 267, 389–393. [DOI] [PubMed] [Google Scholar]
- 50. Livingstone, C. , Patel, G. , Jones, N. (1995) ATF‐2 contains a phosphorylation‐dependent transcriptional activation domain. EMBO J. 14, 1785–1797. [DOI] [PMC free article] [PubMed] [Google Scholar]
- 51. Ionescu, A. M. , Schwarz, E. M. , Zuscik, M. J. , Drissi, H. , Puzas, J. E. , Rosier, R. N. , O'Keefe, R. J. (2003) ATF‐2 cooperates with Smad3 to mediate TGF‐beta effects on chondrocyte maturation. Exp. Cell Res. 288, 198–207. [DOI] [PubMed] [Google Scholar]
- 52. Altmayr, F. , Jusek, G. , Holzmann, B. (2010) The neuropeptide calcitonin gene‐related peptide causes repression of tumor necrosis factor‐alpha transcription and suppression of ATF‐2 promoter recruitment in Toll‐like receptor‐stimulated dendritic cells. J. Biol. Chem. 285, 3525–3531. [DOI] [PMC free article] [PubMed] [Google Scholar]
- 53. Sano, Y. , Harada, J. , Tashiro, S. , Gotoh‐Mandeville, R. , Maekawa, T. , Ishii, S. (1999) ATF‐2 is a common nuclear target of Smad and TAK1 pathways in transforming growth factor‐β signaling. J. Biol. Chem. 274, 8949–8957. [DOI] [PubMed] [Google Scholar]
- 54. Kuprash, D. V. , Udalova, I. A. , Turetskaya, R. L. , Kwiatkowski, D. , Rice, N. R. , Nedospasov, S. A. (1999) Similarities and differences between human and murine TNF promoters in their response to lipopolysaccharide. J. Immunol. 162, 4045–4052. [PubMed] [Google Scholar]
- 55. Barthel, R. , Tsytsykova, A. V. , Barczak, A. K. , Tsai, E. Y. , Dascher, C. C. , Brenner, M. B. , Goldfeld, A. E. (2003) Regulation of tumor necrosis factor alpha gene expression by mycobacteria involves the assembly of a unique enhanceosome dependent on the coactivator proteins CBP/p300. Mol. Cell. Biol. 23, 526–533. [DOI] [PMC free article] [PubMed] [Google Scholar]
- 56. Tsai, E. Y. , Falvo, J. V. , Tsytsykova, A. V. , Barczak, A. K. , Reimold, A. M. , Glimcher, L. H. , Fenton, M. J. , Gordon, D. C. , Dunn, I. F. , Goldfeld, A. E. (2000) A lipopolysaccharide‐specific enhancer complex involving Ets, Elk‐1, Sp1, and CREB binding protein and p300 is recruited to the tumor necrosis factor alpha promoter) A lipopolysaccharide‐specific enhancer complex involving Ets, Elk‐1, Sp1, and CREB binding protein and p300 is recruited to the tumor necrosis factor alpha promoter in vivo. Mol. Cell. Biol. 20, 6084–6094. [DOI] [PMC free article] [PubMed] [Google Scholar]
- 57. Cooper, Z. A. , Singh, I. S. , Hasday, J. D. (2010) Febrile range temperature represses TNF‐a gene expression in LPS‐stimulated macrophages by selectively blocking recruitment of Sp1 to the TNF‐a promoter. Cell Stress Chaperones 15, 665–673. [DOI] [PMC free article] [PubMed] [Google Scholar]
- 58. Singh, I. S. , Calderwood, S. , Kalvakolanu, I. , Viscardi, R. , Hasday, J. D. (2000) Inhibition of tumor necrosis factor‐a transcription in macrophages exposed to febrile range temperature: a possible role for heat shock factor‐1. J. Biol. Chem. 275, 9841–9848. [DOI] [PubMed] [Google Scholar]
- 59. Singh, I. S. , He, J. R. , Calderwood, S. , Hasday, J. D. (2002) A high affinity HSF‐1 binding site in the 5’‐untranslated region of the murine tumor necrosis factor‐a gene is a transcriptional repressor. J. Biol. Chem. 277, 4981–4988. [DOI] [PubMed] [Google Scholar]
- 60. Barna, J. , Princz, A. , Kosztelnik, M. , Hargitai, B. , Takács‐Vellai, K. , Vellai, T. (2012) Heat shock factor‐1 intertwines insulin/IGF‐1, TGF‐β and cGMP signaling to control development and aging. BMC Dev. Biol. 12, 32. [DOI] [PMC free article] [PubMed] [Google Scholar]
- 61. Tanaka, K. , Namba, T. , Arai, Y. , Fujimoto, M. , Adachi, H. , Sobue, G. , Takeuchi, K. , Nakai, A. , Mizushima, T. (2007) Genetic evidence for a protective role for heat shock factor 1 and heat shock protein 70 against colitis. J. Biol. Chem. 282, 23240–23252. [DOI] [PubMed] [Google Scholar]
- 62. Borges, T. J. , Porto, B. N. , Teixeira, C. A. , Rodrigues, M. , Machado, F. D. , Ornaghi, A. P. , de Souza, A. P. , Maito, F. , Pavanelli, W. R. , Silva, J. S. , Bonorino, C. (2010) Prolonged survival of allografts induced by mycobacterial Hsp70 is dependent on CD4+CD25+ regulatory T cells. PLoS One 5, e14264. [DOI] [PMC free article] [PubMed] [Google Scholar]
- 63. van Herwijnen, M. J. , Wieten, L. , van der Zee, R. , van Kooten, P. J. , Wagenaar‐Hilbers, J. P. , Hoek, A. , den Braber, I. , Anderton, S. M. , Singh, M. , Meiring, H. D. , van Els, C. A. , van Eden, W. , Broere, F. (2012) Regulatory T cells that recognize a ubiquitous stress‐inducible self‐antigen are long‐lived suppressors of autoimmune arthritis. Proc. Natl. Acad. Sci. USA 109, 14134–14139. [DOI] [PMC free article] [PubMed] [Google Scholar]
- 64. Borges, T. J. , Wieten, L. , van Herwijnen, M. J. C. , Broere, F. , van der Zee, R. , Bonorino, C. , van Eden, W. (2012) The anti‐inflammatory mechanisms of Hsp70. Front. Immunol. 3, 95. [DOI] [PMC free article] [PubMed] [Google Scholar]
Associated Data
This section collects any data citations, data availability statements, or supplementary materials included in this article.
Supplementary Materials
Supplementary Material Files
Supplementary Material Files