Short abstract
Engagement of ADAM23 on DCs with cognate α(v)β(3) integrin receptor serves as a co‐stimulatory signal to drive CD4+ T effector responses.
Keywords: disintegrin, adhesion, antigen presentation, cytoskeleton, costimulation
Abstract
ADAM23 is a member of the brain macrophage‐derived chemokine family. Structural homology of ADAM proteins suggests their function as integrin receptors. Previous studies have linked ADAM23 as a dominant contributor to brain development and cancer metastasis. The present studies now show that ADAM23 expression on DCs partially governs antigen‐presentation capacities to responder CD4+ T cells. With the use of RNAi approaches, knockdown of ADAM23 in murine BMDCs resulted in impaired T cell activation, proliferation, and cytokine production. Knockdown did not alter the maturation profile of DCs (i.e., costimulatory molecule expression or production of proinflammatory cytokines) but markedly impaired cognate T cell responses. There was a significant decrease in antigen‐specific clonal expansion coupled with a global decrease in Th cytokine production. Impaired early activation and proliferation did not alter/skew the balance of Th polarization but significantly depressed total levels of IL‐2, IFN‐γ, IL‐4, and IL‐17 cytokine production in CD4+ T cells primed by ADAM23 knockdown versus control DCs. Finally, neutralizing antibodies targeting the α(v)β(3) integrin receptors resulted in similar phenotypes of impaired CD4+ T cell responses. Taken together, these studies show a novel role of ADAM23 in governing DC antigen presentation to cognate CD4+ T cells.
Abbreviations
- Ab/anti‐
= antibody against
- ADAM
= a disintegrin and metalloprotease
- BMDC
= bone marrow‐derived dendritic cell
- DC
= dendritic cell
- FACS
= PBS supplemented with 2.5% FBS and EDTA
- Foxp3
= forkhead box p3
- mDC
= mature dendritic cell
- OT‐II
= OVA‐transgenic MHC class II
- p
= phosphorylation
- RNAi
= RNA interference
- si
= small interfering
- siControl
= scrambled small interfering RNA
- WT
= wild‐type
Introduction
The ADAM gene family is a cluster of transmembrane proteins that contain both integrin receptor‐binding and metalloprotease domains [1, 2]. Found in vertebrates, the ADAM family member of proteins has myriad functions that include modulation of embryonic development, cell migration, neuronal processes, and inflammatory responses [1, 3, 4–5]. Uniquely, ADAM23 has an inactive metalloprotease domain; the integrin receptor‐binding disintegrin domain is functional. This would suggest that ADAM23 functions as a receptor for cell‐surface integrins [2, 6]. ADAM23 is expressed predominately as a membrane‐bound receptor that localizes to sites of intercellular contact [6]. Particularly, Cal et al. [7] showed that ADAM23 interacted (through specific binding of the disintegrin domain) with the α(v)β(3) integrin. Studies have further reported that ADAM23 plays an important role in CNS processes [6, 8], with loss in function leading to tremors and epileptic episodes [9]. Additionally, deregulation of ADAM23 expression and/or function has been shown to be involved in cancer and tumor metastasis events [10, 11–12].
The α(v)β(3) integrin (also known as the vitronectin receptor [13]) is a heterodimer of α(v)/CD51 and β(3)/CD61 subunits [13, 14–15]. Sequences show strong homology for key molecules associated with cell–cell adhesion and signaling activities, which include the LFA‐1 and macrophage antigen 1 [13, 16, 17]. The transmembrane proteins have cytoplasmic regions that connect to the actin cytoskeleton. The heterodimer shows wide tissue expression, notably in endothelial cells, osteoclasts, and activated T cells and has been widely associated with cell adhesion and migration. Although α(v)β(3) is not expressed on naïve T cells, reports have shown that phorbol ester mitogen can increase expression of the integrin [18]. Roberts et al. [19] have further shown that the α(v)β(3) receptor can serve as a costimulatory molecule in the activation of γδ‐T cells, particularly in induction of IL‐4 cytokine production. During T cell activation events, intracellular signaling activities trigger conformational changes that allow exposure of the cognate ligand‐binding site, which ADAM23 has been shown to engage [20]. Cayrol et al. [14] further showed that engagement of α(v)β(3) integrins as cognate ligands induces T cell lymphoma proliferation, suggesting a direct role of ADAM23 engagement with T cells in promotion of clonal expansion. Luzina et al. [21] has also shown that α(v)β(3) in T cells (during pulmonary infections) is required for lymphocytic infiltration and that neutralizing antibodies [to the α(v) region] largely attenuated these effector functions.
DCs are professional APCs responsible for initiating adaptive immune responses [22]. DCs present antigen peptides on the surface of MHC molecules to antigen‐specific cognate responder T cells through the TCR [22]. Correct recognition and engagement of the TCR to the peptide presented in the context of MHC class molecules drive T cell activation, proliferation, and polarization [23]. In addition to peptide–MHC, additional receptor–ligand interactions serve in costimulatory and adhesion capacities that support intracellular behavioral and gene‐expression changes [23, 24–25]. Importantly, combinations of these costimulatory and adhesion interactions occurring at the DC–T cell contact plane, known as the immunological synapse, are required to relay stably intercellular communication and promote sustained signaling events required for full T cell effector functions [24, 26].
In this study, the functional role of ADAM23 in DCs is characterized using RNAi approaches. Read‐out indices reveal that antigen‐specific responder CD4+ T cells had impaired activation, proliferation, and production of cytokines upon priming by ADAM23 knockdown DC. Corroborative studies determined that disrupting interactions between ADAM23 on DCs and α(v)β(3) on T cells also ablated these responses. Collectively, the studies show a novel role of ADAM23 engagement with α(v)β(3) as a costimulatory mechanism for driving T cell activation, proliferation, and cytokine production.
MATERIALS AND METHODS
Animals
All animal procedures were performed in accordance and approved by the Institutional Animal Care and Use Committee. All mice were purchased from The Jackson Laboratory (Bar Harbor, ME, USA). Mice were housed in specific pathogen‐free facilities at Howard University (Washington, DC, USA). C57BL/6 (WT) mice between 8 and 12 wk of age were used to harvest femur and tibia bones to generate BMDCs. OT‐II mice between 6 and 10 wk of age were used to harvest naive CD4+ OVA‐responsive T cells isolated from spleen and lymph nodes. For MLR assays, CD4+ T cells were isolated from the NOD mouse on the g7 haplotype.
Generation of BMDCs and isolation of CD4+ T cells
BMDCs were generated, as described, by a modified protocol of Inaba et al. [27]. In brief, cells from murine tibias and femurs were passed through a 70 μ nylon mesh to remove debris. Next, 2 × 10⁶ cells were plated in 6‐well plates containing IMDM (Thermo Fisher Scientific, Waltham, MA, USA), supplemented with 10% FBS (Thermo Fisher Scientific), 2 mM l‐glutamine (Thermo Fisher Scientific), 100 U/ml penicillin/streptomycin (Thermo Fisher Scientific), and 150 U/ml GM‐CSF. Fresh complete medium was replenished on d 3 of the culture. On d 6, cells were stimulated with 250 ng/ml LPS (or other TLR agonists) for an additional 24 h to induce maturation. On d 7, mDCs were used to prime naïve CD4+ OT‐II T cells or assess immunophenotype. For isolation of CD4+ T cells, negative selection using BioMag (Qiagen, Hilden, Germany) goat anti‐rat IgG magnetic microbeads and primary antibodies to CD8 and MHC class II (BioLegend, San Diego, CA, USA) was used to deplete cytotoxic T cells and APCs (i.e., DCs, macrophages, and B cells). The approach yielded 93% ± 4.3 purity of CD4+ T cells.
Antibodies and other reagents
ADAM23 antibody clones H‐65 (Santa Cruz Biotechnology, Dallas, TX, USA), ab101638 (Abcam, Cambridge, MA, USA), and BS‐5853R (Bioss, Woburn, MA, USA) were used. Rabbit IgG isotype antibodies (Thermo Fisher Scientific) served as controls. For flow cytometric analysis, fluorochrome‐labeled antibodies to MHC class I (H2Db), MHC class II (I‐A/E), CD40, CD54, CD80 (B7.1), CD83, and CD86 (B7.2) were used to evaluate surface expression of maturation markers on DCs; all antibodies were purchased from BioLegend. For T cell profile analyses, fluorochrome‐labeled antibodies to CD4, CD8, CD25, CD69, IFN‐γ, IL‐4, IL‐17, IL‐10, T‐bet, Foxp3, and GATA‐3 were used; all antibodies were purchased from BioLegend and BD Biosciences (San Jose, CA, USA). For p‐antibodies, p‐Syk (Cell Signaling Technology, Danvers, MA, USA), p‐tyrosine (Cell Signaling Technology), p38 MAPK (ECM Biosciences, Versailles, KY, USA), and p‐ERK1 were used; all antibodies were purchased from Cell Signaling Technology. Additionally, Syk, ERK, and p38α (ECM Biosciences) were used (as internal loading controls). Antibodies to α(v) (CD51; BD Biosciences and BioLegend) and β(3) (CD61; BD Biosciences and BioLegend) were used to both detect or block the surface‐bound molecules on responder T cells. In all flow cytometric analyses and neutralizing experiments, isotype antibodies were used to establish nonspecific background staining and provide controls to neutralization.
siRNA oligonucleotides and knockdown
In brief, 2 ×10⁶ DCs on d 5 of the maturation process were transfected with 0.5 (6.65 µg) or 1.5 (20 µg) nm of respective siRNA. Two, 21‐bp ADAM23 siRNAs were used in the studies, with the 5’ to 3’ sequences for ADAM23‐A (GCTCCACGTATCGGTCAACTT) and ADAM23‐B (AAAATCAACAGTGGTATGATG); ADAM23‐B sequences were derived from the publication by Kim et al. [28]. siControl sequences were generated using GTGTGATAATCGACATAAGAA. In all experiments, 0.5 or 1.5 nm siControl was used comparatively with ADAM23 siRNA oligonucleotides; unless otherwise indicated, datasets of T cell stimulations used 1.5 nm. Oligonucleotides were purchased from Thermo Fisher Scientific (Silencer Select, 20 nm with standard purification). siRNA oligonucleotides were added with DCs in 4 mm gap electroporation cuvettes before pulsing, using a square‐wave electroporator [310 V, 10 ms, 1 pulse; ECM 830 (BTX Harvard Apparatus, Holliston MA, USA)]. Cells were next replated into fresh DC medium to continue the differentiation processes. Knockdown efficiency was evaluated (and quantified) by Western blot and flow cytometric analyses on d 7.
Western blot analysis
Cell lysates were prepared by incubating Nonidet P‐40 cell lysis buffer (Amresco, Solon, OH, USA) with cells for 30 min before high‐speed centrifugation. Lysates were collected and run using vertical gel electrophoresis in 10% hand‐casted gels. Protein content was transferred from gels to nitrocellulose blots using the Pierce Power Blotter (Thermo Fisher Scientific). GAPDH served as a loading control. For p‐antibodies, total respective protein content or GAPDH served as an internal control. After primary antibody staining, secondary antibodies conjugated to fluorochrome were used for visualizing protein bands on the Odyssey (Li‐Cor, Lincoln, NE, USA) imaging system. For p‐tyrosine analyses, chemiluminescence was used for detection (in addition to fluorescence measurements). Multiplex measurements were applied using the Odyssey Fc Image Studio 4.0 software (Li‐Cor) to calculate relative intensities and generate quantitative datasets based on fluorescence (or chemiluminescence).
Flow cytometric analysis of cell populations
Cell‐surface staining was performed with FACS buffer. Single‐cell suspensions were washed with FACS buffer 2–3 times before staining with fluorochrome‐tagged antibodies. Cells were stained for 15 min at 4°C; dilutions were antibody specific, but roughly 10 µl of 10 µg/ml working concentration was used per 2 × 10⁵ cells. Respective isotype controls were used in all assays. Cells were then fixed for 20 min with 3% paraformaldehyde in PBS. For intracellular antibody labeling, fixed cells were permeabilized with 0.2% saponin in PBS for 1 h. Next, primary antibodies (also diluted in 0.2% saponin in PBS) were added at ∼10 µg/ml concentrations. Likewise, respective fluorochrome‐labeled isotype controls were used in all assays. Cells were incubated with antibodies for 1 h; for some studies, overnight incubation was allowed to occur. Cells were then washed 4 times in 0.2% saponin in PBS. For primary unconjugated antibodies, secondary‐tagged, fluorochrome‐labeled antibodies were prepared and used to stain. These secondary antibodies were diluted to 1:1000–1:3000 working concentrations, with ∼10 μl added per 2 × 10⁵ cells. Cells were allowed to incubate for 1 h or overnight before extensive washing. Cells were then acquired and analyzed using BD FACSVerse or BD Accuri C6 flow cytometric analyzers. Datasets were analyzed using FlowJo v10 (Tree Star, Ashland, OR, USA). Values in quadrants, gated areas, and/or interval gates indicate percentages in each population; gating strategies were established based on respective isotype controls.
ELISA
After specific time points of DC or DC–T cell incubation periods, cells were spun down and supernatant collected. Supernatant was stored at −80°C until use. In brief, IL‐12p70 (BD Biosciences), IL‐6 (BD Biosciences), IL‐1β (BioLegend), TNF‐α (BioLegend), IL‐10 (BioLegend), IL‐4 (BD Biosciences), IL‐17 (BioLegend), and IFN‐γ (BioLegend) were used (following manufacturers' recommended protocols) to measure expression of respective cytokines. Absorbance values were collected and quantified using the Synergy HT (BioTek, Winnoski, VT, USA) multimode microplate reader.
T cell stimulation and CFSE dilution assays
Naïve CD4+ OT‐II T cells were cultured with OVA323–339‐pulsed DCs at a ratio of 10:1, respectively, in vitro. Cells were harvested at the 24 h time point to evaluate early‐activation markers by flow cytometry and 24–72 h time points for IL‐2 production by ELISA. For proliferation studies, naïve CD4+ OT‐II T cells were labeled with 2.5 µM CFSE (Thermo Fisher Scientific) in PBS at room temperature for 10–15 min. Cells were washed thoroughly before and after incubation at 37°C for 1 h. Labeled T cells were then cultured with OVA323–339‐pulsed DCs for 72–96 h. Cells were evaluated for proliferation by flow cytometric analyses. For T cell polarization studies, OVA323–339‐pulsed DCs were cultured with naïve OT‐II CD4+ T cells for 12 d. Cells were restimulated on d 5 with respective peptide‐pulsed DCs supplemented with 200 μ/ml IL‐2. T cells were then evaluated on d 12 by stimulation with 20 ng/ml PMA and 1 µg/ml ionomycin in the presence of 10 µg/ml Brefeldin A for 4 h before intracellular staining and flow cytometric analysis. For T cell polarization, cells were stimulated under the following conditions: 1) TH0: 20 ng/ml IL‐2; 2) TH1: 20 ng/ml IL‐2, 20 ng/ml IL‐12p70, 5 ng/ml IFN‐γ, and 10 µg/ml anti‐IL‐4; 3) TH2: 20 ng/ml IL‐2, 100 ng/ml IL‐4, 10 µg/ml anti‐IFN‐γ, and 10 µg/ml anti‐IL‐12p70; 4) TH17: 20 ng/ml IL‐2, 5 ng/ml TGF‐β, 40 ng/ml IL‐6, 10 µg/ml anti‐IL‐4, anti‐IFN‐γ, and anti‐IL‐12p70. For T regulatory cell conditions, cells were cultured with 2 ng/ml TGF‐β and 20 ng/ml IL‐2; “anti” denotes antibodies targeting molecules for blocking/neutralizing.
In vivo T cell stimulation assays
Naïve CD4+ T cells were isolated from OT‐II mice and stained with 5 µM CFSE. Additionally, d 7 LPS‐matured BMDCs (from C57BL/6 WT mice), knocked down for ADAM23 or controls, were pulsed with OVA323–339 peptide for 5 h in vitro at 37°C. First, 107 CFSE‐labeled CD4+ OT‐II T cells were intravenously injected (through tail vein in 250 µl PBS) into WT mice. Next, 4–5 h later, 5 × 10⁶ ADAM23 knockdown or control DCs were injected. A control group contained CFSE‐labeled CD4+ T cells only (with no addition of OVA‐pulsed DCs). After 3 and 5 d, mice were euthanized. Spleen and lymph nodes were harvested. Cells were immediately fixed, permeabilized, and intracellular stained for CD4, IFN‐γ, and IL‐4. Samples were assessed by flow cytometric analyses; nonlabeled CFSE T cells were gated out/excluded from dot plots in presented flow cytometric datasets.
MLR assays
Naïve CD4+ T cells were isolated from the NOD mouse; the model has the g7 haplotype. For proliferation assays, cells were stained with 2.5 µM CFSE. LPS‐matured WT (d 7; C57BL/6) BMDCs, knocked down for ADAM23 or control DCs, were subsequently used to prime T cells.
Neutralization studies of α(v)β(3) on early‐activated T cells
Neutralization studies included blocking α(v) only, β(3) only, or both α(v) and β(3) during the T cell priming stages by DCs. Blocking antibodies were used at 10 µg/ml targeting α(v)/CD51 and/or β(3)/CD61 (BD Biosciences and BioLegend). Antibodies were added at an initial culture of OVA‐pulsed DCs with naïve CD4+ T cells and 6 h into the cell coculture; mice used were from the WT C57BL/6 strain.
Statistical analysis
GraphPad Prism v6.0 (GraphPad Software, La Jolla, CA, USA) was used to determine statistical significance. Student unpaired 2‐tailed t test was used to evaluate the significance of 2 groups. One‐way or 2‐way ANOVA was used to evaluate the significance among the means of 3 or more independent groups. P < 0.05 was considered statistically significant; error bars for all figures indicate se.
RESULTS
siRNA knockdown of ADAM23 in BMDCs
DCs were generated from BMDCs harvested from WT C57BL/6 mice. During the 7 d DC generation process, cells were knocked down for ADAM23 on d 5 using siRNA oligonucleotides at 0.5 or 1.5 nm. Next, respective groups were stimulated with the TLR agonist LPS on d 6 (to generate mDCs). After 24 h, mDCs were harvested and evaluated for knockdown efficiency by Western blot and flow cytometry. Western blot analyses shows successful knockdown of ADAM23. With the siControl group established as a 100% baseline level, 0.5 nm siADAM23 reduced levels to 64%, and the 1.5 nm reduced levels down to 31% ( Fig. 1A ). Studies corroborated knockdown on a single‐cell level using flow cytometric analysis. Datasets revealed that ∼40% of CD11c+ DCs express ADAM23 (i.e., CD11C+ADAM23+ population). Knockdown reduced the population to 29% (for the 0.5 nm siADAM23) and 7.58% (for the 1.5 nm siADAM23; Fig. 1B). That is ∼80% knockdown for the 1.5 nm. With the use of >1.5 nm siADAM23, electroporation into DCs did not lead to increases >80% knockdown (Fig. 1C). Collectively, ADAM23 was able to be successfully knocked down in DCs using RNAi approaches.
Figure 1.
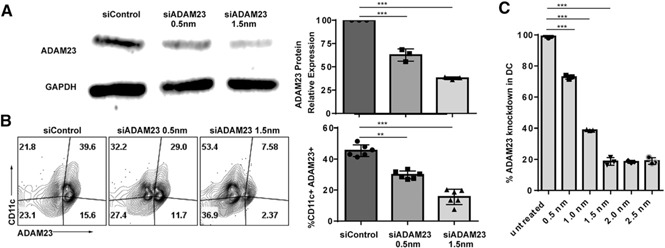
Successful knockdown of ADAM23 in DCs using siRNA. DCs were electroporated with 0.5 or 1.5 nm siRNA oligonucleotides targeting ADAM23 on d 5 of the BMDC generation into DCs. Cells were allowed to culture for an additional 2 d in the presence of GM‐CSF, with LPS maturation occurring on d 6 to generate mDCs. (A) To examine knockdown efficiency, protein lysate samples were run on SDS‐PAGE gels before blotting on nitrocellulose membranes and probed using ADAM23 antibodies. Lane 1, control oligonucleotides (siControl), transfected with 1.5 nm nontargeting siControl; lane 2, transfected with 0.5 nm, and lane 3, with 1.5 nm siRNA targeting ADAM23. Probing for GAPDH was used as an internal loading control. Relative expression of ADAM23 standardized to GAPDH was calculated and presented as a bar graph (right); data are representation of 3 independent experiments. (B) Flow cytometric analysis was performed to evaluate expression of ADAM23 on a single‐cell level upon 0.5 and 1.5 nm ADAM23 siRNA knockdown. siControl was used at 1.5 nm for internal controls. Isotype controls were used to establish gating strategies. Plots are gated on live cells, displayed as a dot plot of CD11c against ADAM23. Bar graph (right) of the percentage of CD11c+ADAM23+ subsets is shown and is a representation of 3 independent experiments. (C) Concentration‐dependent knockdown of ADAM23 was determined using untreated (control) and 0.5, 1.0, 1.5, 2.0, and 2.5 nm siRNA oligonucleotides. Flow cytometric analysis was performed; data are represented as percent knockdown relative to untreated control. Experiments were performed in triplicate and bar graph representative of mean. **P < 0.01, ***P < 0.001.
Loss of ADAM23 in DCs does not alter survival or maturation phenotype
Given that no published study has intricately assessed ADAM23 expression in DCs, these investigations set to determine whether ADAM23 modulates cell survival and/or a maturation profile. No significant alteration in cell death (or survival) was observed between the ADAM23 knockdown and control groups using cell viability assays (data not shown). Next, studies used flow cytometry to evaluate changes in phenotypical marker expression of MHC class I, MHC class II, and costimulatory molecules (i.e., CD40, CD54, CD80, CD83, and CD86; Fig. 2A ). No significant changes in expression were observed. Follow‐up studies evaluated cytokine profiles of common pro (i.e., TNFα, IL‐1β, IL‐6, and IL‐12p70)‐ and anti (i.e., IL‐10)‐inflammatory cytokines by ELISA (Fig. 2B). Similar to membrane‐bound receptor analyses, no significant alteration in cytokine profiles was detected. To evaluate the impact of ADAM23 by other TLR agonists, studies treated ADAM23 knockdown versus control DC with TLR1 (palmitoyl‐3‐cysteine‐serine‐lysine; synthetic triacylated lipopeptide), ‐2 (heat‐killed Listeria monocytogenes), ‐3 (polyinosinic:polycytidylic acid), ‐4 (LPS), ‐5 (flagellin from Salmonella typhimurium), ‐6 (synthetic diacylated lipoprotein), ‐7 (ssRNA), and ‐9 (CpG oligos). Although there was a dynamic shift in production of cytokines between among TLR agonists, no significant changes were detected when comparing ADAM23 knockdown with that of control DCs (data not shown). These results suggest that loss of ADAM23 does not directly influence the ability of DCs to express surface‐bound receptors or inflammatory cytokines.
Figure 2.
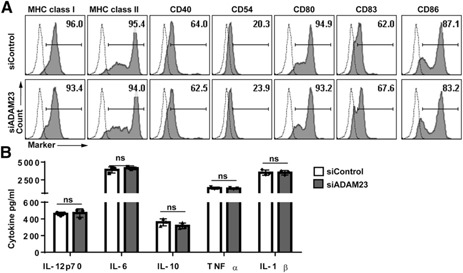
Phenotype of DCs is not altered upon ADAM23 knockdown. mDCs (d 7) were evaluated for changes in surface markers associated with maturation and cytokine production. (A) Flow cytometric analysis was used to detect surface marker expression of MHC class I, MHC class II, CD40, CD54 (ICAM‐1), CD80 (B7.1), CD83, and CD86 (B7.2). Knockdown using siADAM23 (at 1.5 nm) was compared with siControl (1.5 nm) populations; dashed lines represent isotype control, and filled histogram plots are the respective molecule expression. (B) Supernatant from ADAM23 knockdown versus siControl‐treated DCs was collected on d 7. Samples were then analyzed by ELISA for IL‐12p70, IL‐6, IL‐10, TNF‐α, and IL‐1β. Values are expressed as pg/ml based on internal standard; data are representations of 3 independent experiments. ns, Not significant.
Expression of ADAM23 in DCs governs cognate CD4+ T cell early activation, IL‐2 production, and proliferation responses
ADAM23 is a surface‐bound molecule that has been shown to engage integrins, specifically α(v)β(3) [7]. Although ADAM23 lacks a functional metalloprotease domain, these studies investigated whether the functional disintegrin (i.e., integrin binding) domain plays a role in modulating antigen‐specific T cell responses. ADAM23 knockdown versus control (siControl‐treated) DCs was used to prime naïve CD4+ T cells. Studies evaluated activation, proliferation, and IL‐2 production. T cells stimulated by ADAM23 knockdown DCs had reduced early‐activation profiles, as measured by CD69 expression, when compared with control DCs ( Fig. 3A ). Control DCs resulted in 37% CD69+CD4+ T cells activated, whereas the ADAM23 knockdown group resulted in reduction to 28.9% (at 0.5 nm) and 19% (at 1.5 nm). Impaired effector responses were further seen with markedly diminished proliferation capacities. Control DCs promoted 66% dividing CD4+ T cells, whereas the 0.5 and 1.5 nm ADAM23 knockdown DCs resulted in diminished proliferation to 42% and 33%, respectively (Fig. 3B). This correlated with reduced IL‐2 expression; there was a reduction in IL‐2 production at 24, 48, and 72 h after normalizing equal cell numbers between the ADAM23 knockdown and control groups (Fig. 3C). Given the depressed ability of early activation, we next evaluated early signaling activities; studies evaluated Syk, MAPK, and total tyrosine phosphorylation changes at the 24 h time point (of DC–T cell priming). No significant alterations between phospho‐signaling was observed (Supplemental Fig. 1). Finally, to ensure that impaired T cell responses were not an artifact of the OT‐II system, MLR assays were performed. In brief, CD4+ T cells from the g7 haplotype were cultured with ADAM23 knockdown or control DCs (of the MHC b background of the C576BL/6 mouse). Studies corroboratively found reduced T cell proliferation and IL‐2 production (Supplemental Fig. 2), reinforcing that ADAM23 plays an important role in promoting T cell effector responses.
Figure 3.
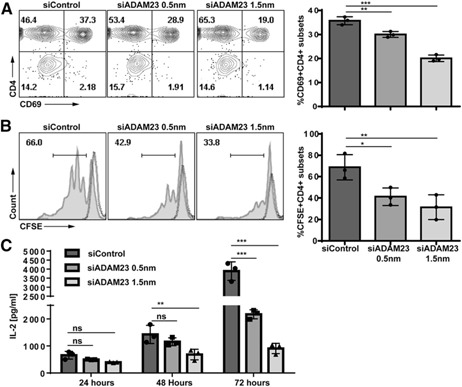
Loss of ADAM23 expression in DCs impairs antigen‐specific T cell proliferation and IL‐2 production. ADAM23 knockdown (at 0.5 or 1.5 nm) or siControl‐treated DCs (at 1.5 nm) were pulsed with OVA323–339 peptides before culture with cognate OT‐II naïve CD4+ T cells. (A) After 24 h, cells were collected and analyzed for CD69 expression by flow cytometric analyses. Bar graph depicts the percentage of CD69 in CD4+ T cells in 3 independent experiments. (B) Proliferation is measured using CFSE dilution assays by flow cytometric analyses. T cells were prelabeled with 2.5 µm CFSE before culturing with ADAM23 knockdown or control (siControl) OVA‐pulsed DCs. After 72 h, cells were collected and analyzed for proliferation. Each peak represents a single round of cell division. Dashed lines represent unstimulated CFSE‐labeled T cells as nondividing control. Filled histograms are CFSE‐labeled T cells primed by respective siControl or siADAM23‐treated DC populations. Bar graph depicts percentage of proliferating CD4+ T cells in 3 independent experiments. (C) IL‐2 ELISA was performed on supernatants harvested at 24, 48, and 72 h of the DC–T cell culture per the manufacturer's recommended protocols. Total cell numbers were normalized to yield an equal number of cells before stimulation by ADAM23 knockdown versus control DCs; the concentration of IL‐2 represents 3 independent experiments normalized to equal cell numbers. *P < 0.05, **P < 0.01, ***P < 0.001.
ADAM23 in DCs does not alter T cell polarization state
Given that reduced expression of ADAM23 in DCs resulted in abrogated activation and proliferation events, the studies next evaluated whether T cell polarization was altered/skewed. In brief, OVA323–339‐pulsed ADAM23 knockdown or control DCs were used to prime naïve OT‐II CD4+ T cells. T cells were then evaluated on d 10–12 for expression of IFN‐γ, IL‐4, or IL‐17 after restimulation with PMA/ionomycin mitogen cocktail. Under nonpolarizing (TH0) conditions, there was not a significant change in production of IL‐4, IFN‐γ, or IL‐17 ( Fig. 4 ). However, there was impaired production of TH‐associated cytokines when stimulated under polarizing conditions. Under TH1 conditions, IFN‐γ production was reduced from 52.9 to 28.7% and under TH2 conditions, IL‐4 was restrained from 8.9 to 6.0% (Fig. 4A). The IFN‐γ production correlated directly with intracellular T‐bet expression profiles; depressed T‐bet expression in T cells was observed when primed by ADAM23 knockdown DCs under TH1 stimulatory conditions (data not shown). Likewise, under TH17 stimulatory conditions, IL‐17 production was largely reduced in T cells primed by ADAM23 knockdown DCs (Fig. 4B). Finally, the studies found, especially under the TH1 polarizing conditions, reduced CD25+Foxp3− subsets; overall, there was a greater reduction of CD25+‐activated CD25+ T cells, as opposed to their conversion to CD25+Foxp3+ T regulatory cell subsets (Fig. 4C). These results reflect an observed, decreased CD69 activation marker in early T cell priming events, whereby T cells primed by ADAM23 knockdown DCs had restrained activation profiles.
Figure 4.
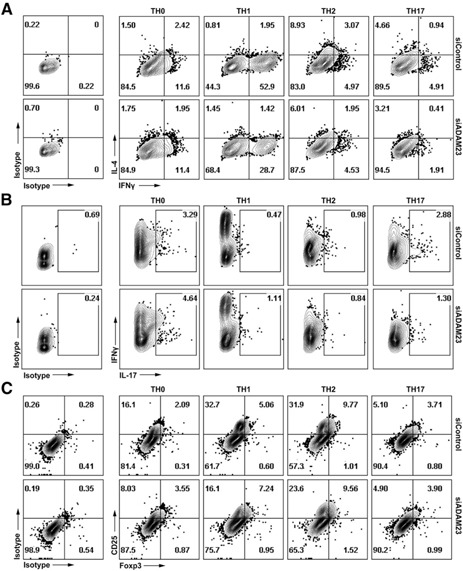
ADAM23 expression in DCs impairs production of TH cytokine production under polarizing conditions. ADAM23 knockdown or control DCs pulsed with OVA323–339 were used to stimulate naïve CD4+ T cell responders for 10–12 d under TH0 (IL‐2 cytokine), TH1 (IL‐2, IL‐12p70, and IFN‐γ cytokines with anti‐IL‐4 neutralizing antibodies), TH2 (IL‐2 and IL‐4 cytokines with anti‐IFN‐γ and anti‐IL‐12p70 neutralizing antibodies), or TH17 (IL‐2, TGF‐β, and IL‐6 cytokines with anti‐IFN‐γ, ‐IL‐4, and ‐IL‐12p70 neutralizing antibodies) conditions. Restimulation using respective OVA323–339‐bearing DCs was on d 5, supplemented with respective cytokine/neutralizing antibody cocktails. On d 10–12, cells were stimulated with PMA and ionomycin mitogens in the presence of Brefeldin A for 4 h before staining for IFN‐γ, IL‐4, IL‐17, CD25, Foxp3, and CD4. Cells were then analyzed by flow cytometry. Dot plots show (A) IL‐4 versus IFN‐γ‐, (B) IFN‐γ versus IL‐17‐, and (C) CD25 versus Foxp3‐gated CD4+ T cell subsets. Isotype controls were used to establish gating strategies for all flow cytometric analyses. Data are representative of 3 independent experiments.
ADAM23 expression in splenic CD11c+ DC populations
To corroborate evaluation of BMDC expression of ADAM23, the studies next evaluated endogenous ADAM23 expression in splenic‐derived DC subsets. Total splenocytes were harvested from WT mice. Subsets were stained and assessed for ADAM23 coexpression with CD11c, CD8, 33D1, and/or CD4. Predominately, CD11c+CD8α+33D1− populations expressed the most ADAM23 (34.3%), with the CD11c+CD8α−33D1+ population expressing modest amounts (16.7%; Fig. 5A ). There was also strong correlative expression of ADAM23 in the CD11c+CD4−33D1− (52.5%) and CD11c+CD4+33D1+ (27.9%) populations (Fig. 5B). No ADAM23 was detected in the CD11c−CD8α+ or CD11c−CD4+ populations. Collectively, ADAM23 is most expressed in CD11c+CD8α+CD4−33D1− DC populations.
Figure 5.
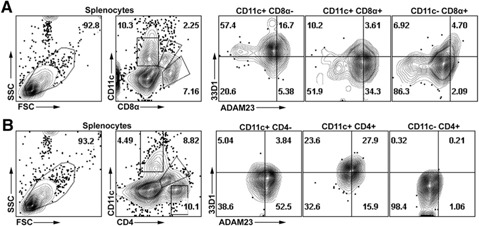
ADAM23 expression in splenic CD11c+ DC populations. Splenocytes were harvested from WT mice. Cells were stained for CD11c, CD8α, CD4, 33D1, and ADAM23 antibodies. (A) Splenocytes were gated to define CD11c+CD8α−, CD11c+CD8α+, or CD11c−CD8α+ populations and assessed for expression of ADAM23 versus 33D1. (B) Cells were gated on CD11c+CD4−, CD11c+CD4+, or CD11c−CD4+ and assessed for ADAM23 versus 33D1. Data are representative of 3 independent experiments; isotype controls were used to establish gating strategies of all dot plots presented. SSC, Side‐scatter; FSC, forward‐scatter.
Impairment of T cell responses upon priming by ADAM23 knockdown DCs in vivo
Adoptive transfer studies were performed to characterize the in vivo relevance of ADAM23 antigen‐presentation capacity to responder T cells. In brief, CFSE‐labeled OT‐II CD4+ T cells were injected into a WT mice along with OVA323–339‐pulsed control or ADAM23 knockdown DCs; T cells injected alone served as internal controls (T cells only). After 3–5 d, mice were euthanized to harvest spleen and lymph nodes. Cells were then collected and assessed for proliferation and IFN‐γ versus IL‐4 production. Similar to the in vitro datasets, T cells primed by ADAM23 knockdown DCs had restrained proliferation capacity, coupled with depressed total levels of IFN‐γ and IL‐4 production ( Fig. 6 ). These studies reinforce that ADAM23 knockdown DCs have an impaired ability to prime T cell responses, leading to restrained proliferation and acquisition of effector functions.
Figure 6.
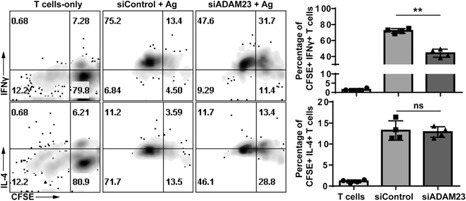
Adoptive transfer of ADAM23 knockdown DCs results in impaired T cell response in vivo. OT‐II CD4+ T cells were harvested and labeled with CFSE before intravenous injection into a WT mouse. Subsequently, ADAM23 knockdown or control mDCs pulsed with OVA323–339 peptide were injected into the same WT mouse. The CFSE‐labeled, T cell‐only group served as internal controls. After 3–5 d, mice were euthanized, and spleen and lymph nodes were collected. Cells were stained for IFN‐γ, IL‐4, and CD4 before flow cytometric analysis. Isotype controls were used to establish gating strategies. All CD4+CFSE+ cells were gated and displayed in the dot plot; nonlabeled CFSE subsets were excluded (by gating out). (Upper) Dot plots show CFSE versus IFN‐γ expression in T cells from the following groups: T cells only (i.e., no antigen‐bearing DC added), control DC (siControl) pulsed with antigen, and ADAM23 knockdown DC (siADAM23) pulsed with antigen. (Lower) CFSE versus IL‐4. Bar graphs represent that of quadruplicates per group; the study is representative of 2 independent experiments. **P < 0.01.
Neutralization of α(v)β(3) impairs T cell activation and proliferation
Although ADAM23 loss impaired T cell effector responses, it remained to be seen whether blocking α(v)β(3) on T cells resulted in similar fates. α(v)β(3) is not expressed on naïve splenic‐ and lymph node‐derived CD4+ T cells ( Fig. 7A ) [29]. However, stimulation of naïve T cells with anti‐CD3/CD28 microbeads resulted in increased α(v)/CD51 and β(3)/CD61 surface expression (Fig. 7B). Studies found that only activated subsets, identified by CD4+CD25+ cell populations, were able to up‐regulate α(v) and β(3) expression. Approximately 42% ± 5.3 α(v)β(3)‐positive subsets were found in the CD4+CD25+ cells (from either Foxp3+ or Foxp3− populations; Fig. 7B). The nonstimulated group had very few CD25+‐activated subsets; this was the small frequency of naturally activated T cells found in the mouse. However, stimulation of naïve CD4+ T cells in presence of TGF‐β resulted in decreased α(v)β(3) expression in the CD25+Foxp3+ cohort, depressing levels from 44% without TGF‐β to 23% in the presence of the cytokine (Fig. 7B).
Figure 7.
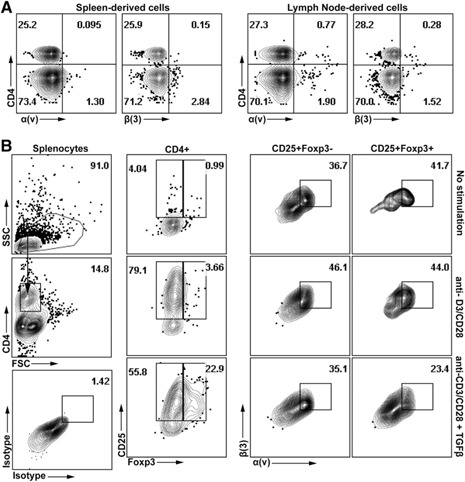
Expression of α(v) and β(3) on activated T cells. Splenocytes or lymphocytes were harvested from naïve WT mice. (A) Isolated lymph node‐ or spleen‐derived cells were stained with CD4 and α(v)/CD51 or β(3)/CD61 antibodies before flow cytometric analysis. (B) Spleen‐derived cells were stimulated with anti‐CD3/CD28 for 24 h in the presence or absence of TGF‐β. Cells were then stained with antibodies to CD25, Foxp3, and CD4, along with α(v) or β(3). Dot plot (left) shows gating strategy; CD4+ T cells were gated from forward‐ versus side‐scatter subsets. Isotype control (left, bottom) was used to establish gating strategies for α(v) versus β(3). First, of the CD4+ subsets, dot plot analysis was used to identify CD25+Foxp3− versus CD25+Foxp3+ T cells. In each treatment condition (i.e., no stimulation, anti‐CD3/CD28, or anti‐CD3/CD28 + TGF‐β), subsets were assessed for α(v) versus β(3) expression in CD4+CD25+Foxp3− and CD4+CD25+Foxp3+ populations. Data are representative of 3 independent experiments. All gating strategies for fluorescence channels used respective fluorochrome‐labeled isotype controls.
To evaluate further the important role of ADAM23–α(v)β(3) engagement in governing T cell responses, studies next used neutralizing antibodies to block α(v) and/or β(3). In brief, DCs pulsed with OVA323–339 peptide were used to prime naïve CD4+ T cells in the presence of neutralizing antibodies. Isotype antibodies were used as internal controls. Similar to studies using ADAM23 knockdown in DCs, neutralization of α(v) and/or β(3) resulted in reduced proliferation by ∼15% for α(v) and 30% for β(3) ( Fig. 8A ). There was concomitant lower IL‐2 production, with an average decrease of 33% compared with isotype controls (Fig. 8B). These results support the ADAM23 knockdown studies in DCs, suggesting that ADAM23 engagement with α(v)β(3) is partly responsible for governing T cell responses.
Figure 8.
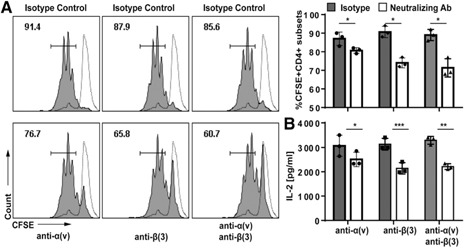
Neutralization of α(v)β(3) restrains T cell proliferation and IL‐2 production. Neutralizing antibodies to α(v)/CD51 or β(3)/CD61 were added at the point of OVA323–339‐pulsed mDCs culturing with naïve CD4+ T cells. Additionally, respective antibodies were added again at 6 h into the DC–T cell coculture. Isotype‐matched antibodies were used as internal controls. (A) For proliferation, T cells were prelabeled with 2.5 µM CFSE before culture with DCs in the presence of neutralizing or isotype control antibodies. After 72 h, T cells were harvested and evaluated for proliferation using flow cytometric analyses. Dashed lines represent unstimulated, CFSE‐labeled T cells as nondividing control. Filled histograms are CFSE‐labeled T cells primed by respective DC populations in the presence of respective neutralizing antibodies or isotype controls. Bar graph depicts mean percentage of proliferating CD4+ T cells in 3 independent experiments. (B) Supernatant was collected at the 72 h time point and evaluated for production IL‐2; data are representative of 3 independent experiments. *P < 0.05, **P < 0.01, ***P < 0.001.
DISCUSSION
Although ADAM23 does not directly modulate expression of known MHC, costimulatory, or secreted molecules in DCs, this study demonstrated that the protein governs cognate antigen‐specific T cell responses. In particular, disruption of ADAM23 or α(v)β(3) interactions resulted in reduced activation events, clonal T cell expansion, and cytokine production. The present studies corroborated work by Sturmhöfel et al. [30] in that the α(v)β(3) receptor is important in modulating IL‐2 production in αβ‐T cells, as was reported for γδ‐T cells. Interestingly, loss of ADAM23 expression in DCs resulted in significant reduction of TH‐associated cytokines under potent TH1, TH2, or TH17 stimulatory conditions. Neutral conditions did not yield a noticeable difference in the ability to produce IFN‐γ, IL‐4, or IL‐17. However, depressed effector responses were largely observed when the T cells were primed under respective polarizing cytokines. This follows reports by Roberts et al. [19] in studies of γδ‐T cells, whereby these studies corroborated decreased IL‐4 production by αβ‐T cells upon priming by ADAM23 knockdown DCs (in TH2 polarizing conditions). Taken together, the studies show an overall depressed activation, proliferation, and cytokine profile of responder CD4+ T cells when primed by DCs deficient in ADAM23 expression.
Given that ADAM23 is able to serve as an integrin receptor, this would suggest that cognate interaction with α(v)β(3) serves an important role in modulating intracellular signaling and/or actin cytoskeletal events. Although the present studies did not identify alterations in early T cell signaling events, additional studies using conditional knockout models will better delineate disrupted signaling patterns that may restrain T cell effector response in the acute versus late phases. It may be that α(v)β(3) engagement with ADAM23 is required during later time points associated with modulating proliferation events or coordinated polarization states. Importantly, as these studies identified ADAM23 as expressed within splenic‐derived CD11c+ DC subsets, ADAM23 knockout models may serve to tease further apart these signaling mechanisms and depressed immune responses.
Neutralization studies evaluating cognate T cell responses using α(v) or β(3) blocking antibodies were less pronounced than in ADAM23 knockdown experiments. This observed fate may be a result of the inability of the (blocking) antibody to enter the cell–cell contact site between DC and T cells (during antigen‐presentation events). The close proximity of the DC–T cell contact plane may exclude (or greatly reduce) antibody access to the α(v) and/or β(3) regions for neutralization. Additionally, the rate kinetics and affinity of ADAM23 may out‐compete the neutralizing antibody for access to α(v)β(3). Therefore, future studies using α(v) and/or β(3) knockout mice may best address this concern. However, the studies consistently identified impaired cytokine production coupled with reduced proliferation events upon neutralization of α(v)β(3).
There is largely a question of whether disruption of ADAM23–α(v)β(3) engagement abrogates IL‐2 production, which then leads to impaired proliferation responses. Alternatively, it may be that disruption of this engagement inhibits proliferation and IL‐2 production through independent events. Results from these studies suggest the latter, as experimental approaches took care to plate equal numbers of primed T cells expanded from the ADAM23 knockdown versus control groups to measure cytokine production; this allowed for normalization of cell numbers. The polarization studies corroborate a global depression in ability of responder CD4+ T cells to produce TH‐associated cytokines. In all cases of TH1, TH2, and TH17 priming/stimulatory conditions, there was a concomitant reduction in ability to produce respective IFN‐γ, IL‐4, or IL‐17 in T cells stimulated by ADAM23 knockdown versus control DCs. This was correlated directly with lower levels of CD25/IL‐2Rα expression, suggesting an overall restrained activation and reduced ability to proliferate (with diminished IL‐2 signaling). Importantly, the studies found that skewing of T cell fates was not observed (i.e., shift from TH1 to a TH2 fate), but rather, the studies consistently identified overall impaired T cell responses.
AUTHORSHIP
D.M.E. designed and performed experiments, analyzed data, and wrote the paper. T.E.A. performed experiments and analyzed data. A.M.Z. and K.M.M. performed experiments. M.W.L. designed and performed experiments, analyzed data, and wrote the paper.
DISCLOSURES
The authors declared no conflicts of interest.
ACKNOWLEDGMENTS
This work was funded, in part, by the U.S. National Institutes of Health (Grant #1SC2GM103741), Department of Defense (Grant #W911NF‐14‐1‐0123), and National Science Foundation (Grant #1428768). The authors thank Dr. Franklin Ampy for assistance in statistical analyses and Dr. Winston Anderson for revisions and edits of the manuscript.
Supporting information
Supplementary material 1
Supplementary material 2
Footnotes
SEE CORRESPONDING EDITORIAL ON PAGE 838
References
- 1. Primakoff, P. , Myles, D. G. (2000) The ADAM gene family: surface proteins with adhesion and protease activity. Trends Genet. 16, 83–87. [DOI] [PubMed] [Google Scholar]
- 2. Seals, D. F. , Courtneidge, S. A. (2003) The ADAMs family of metalloproteases: multidomain proteins with multiple functions. Genes Dev. 17, 7–30. [DOI] [PubMed] [Google Scholar]
- 3. Sagane, K. , Yamazaki, K. , Mizui, Y. , Tanaka, I. (1999) Cloning and chromosomal mapping of mouse ADAM11, ADAM22 and ADAM23. Gene 236, 79–86. [DOI] [PubMed] [Google Scholar]
- 4. McHugh, K. P. , Hodivala‐Dilke, K. , Zheng, M. H. , Namba, N. , Lam, J. , Novack, D. , Feng, X. , Ross, F. P. , Hynes, R. O. , Teitelbaum, S. L. (2000) Mice lacking beta3 integrins are osteosclerotic because of dysfunctional osteoclasts. J. Clin. Invest. 105, 433–440. [DOI] [PMC free article] [PubMed] [Google Scholar]
- 5. Patsenker, E. , Popov, Y. , Wiesner, M. , Goodman, S. L. , Schuppan, D. (2007) Pharmacological inhibition of the vitronectin receptor abrogates PDGF‐BB‐induced hepatic stellate cell migration and activation in vitro. J. Hepatol. 46, 878–887. [DOI] [PubMed] [Google Scholar]
- 6. Goldsmith, A. P. , Gossage, S. J. , ffrench‐Constant, C. (2004) ADAM23 is a cell‐surface glycoprotein expressed by central nervous system neurons. J. Neurosci. Res. 78, 647–658. [DOI] [PubMed] [Google Scholar]
- 7. Cal, S. , Freije, J. M. , López, J. M. , Takada, Y. , López‐Otín, C. (2000) ADAM 23/MDC3, a human disintegrin that promotes cell adhesion via interaction with the alphavbeta3 integrin through an RGD‐independent mechanism. Mol. Biol. Cell 11, 1457–1469. [DOI] [PMC free article] [PubMed] [Google Scholar]
- 8. Sun, Y. , Wang, Y. , Zhang, J. , Tao, J. , Wang, C. , Jing, N. , Wu, C. , Deng, K. , Qiao, S. (2007) ADAM23 plays multiple roles in neuronal differentiation of P19 embryonal carcinoma cells. Neurochem. Res. 32, 1217–1223. [DOI] [PubMed] [Google Scholar]
- 9. Owuor, K. , Harel, N. Y. , Englot, D. J. , Hisama, F. , Blumenfeld, H. , Strittmatter, S. M. (2009) LGI1‐associated epilepsy through altered ADAM23‐dependent neuronal morphology. Mol. Cell. Neurosci. 42, 448–457. [DOI] [PMC free article] [PubMed] [Google Scholar]
- 10. Costa, F. F. , Verbisck, N. V. , Salim, A. C. , Ierardi, D. F. , Pires, L. C. , Sasahara, R. M. , Sogayar, M. C. , Zanata, S. M. , Mackay, A. , O'Hare, M. , Soares, F. , Simpson, A. J. , Camargo, A. A. (2004) Epigenetic silencing of the adhesion molecule ADAM23 is highly frequent in breast tumors. Oncogene 23, 1481–1488. [DOI] [PubMed] [Google Scholar]
- 11. Costa, F. F. , Colin, C. , Shinjo, S. M. , Zanata, S. M. , Marie, S. K. , Sogayar, M. C. , Camargo, A. A. (2005) ADAM23 methylation and expression analysis in brain tumors. Neurosci. Lett. 380, 260–264. [DOI] [PubMed] [Google Scholar]
- 12. Choi, J. S. , Kim, K. H. , Jeon, Y. K. , Kim, S. H. , Jang, S. G. , Ku, J. L. , Park, J. G. (2009) Promoter hypermethylation of the ADAM23 gene in colorectal cancer cell lines and cancer tissues. Int. J. Cancer 124, 1258–1262. [DOI] [PubMed] [Google Scholar]
- 13. Suzuki, S. , Argraves, W. S. , Pytela, R. , Arai, H. , Krusius, T. , Pierschbacher, M. D. , Ruoslahti, E. (1986) cDNA and amino acid sequences of the cell adhesion protein receptor recognizing vitronectin reveal a transmembrane domain and homologies with other adhesion protein receptors. Proc. Natl. Acad. Sci. USA 83, 8614–8618. [DOI] [PMC free article] [PubMed] [Google Scholar]
- 14. Cayrol, F. , Díaz Flaqué, M. C. , Fernando, T. , Yang, S. N. , Sterle, H. A. , Bolontrade, M. , Amorós, M. , Isse, B. , Farías, R. N. , Ahn, H. , Tian, Y. F. , Tabbò, F. , Singh, A. , Inghirami, G. , Cerchietti, L. , Cremaschi, G. A. (2015) Integrin αvβ3 acting as membrane receptor for thyroid hormones mediates angiogenesis in malignant T cells. Blood 125, 841–851. [DOI] [PMC free article] [PubMed] [Google Scholar]
- 15. Hynes, R. O. (2002) Integrins: bidirectional, allosteric signaling machines. Cell 110, 673–687. [DOI] [PubMed] [Google Scholar]
- 16. Takada, Y. , Strominger, J. L. , Hemler, M. E. (1987) The very late antigen family of heterodimers is part of a superfamily of molecules involved in adhesion and embryogenesis. Proc. Natl. Acad. Sci. USA 84, 3239–3243. [DOI] [PMC free article] [PubMed] [Google Scholar]
- 17. Corbi, A. L. , Kishimoto, T. K. , Miller, L. J. , Springer, T. A. (1988) The human leukocyte adhesion glycoprotein Mac‐1 (complement receptor type 3, CD11b) alpha subunit. Cloning, primary structure, and relation to the integrins, von Willebrand factor and factor B. J. Biol. Chem. 263, 12403–12411. [PubMed] [Google Scholar]
- 18. Suzuki, S. , Argraves, W. S. , Arai, H. , Languino, L. R. , Pierschbacher, M. D. , Ruoslahti, E. (1987) Amino acid sequence of the vitronectin receptor alpha subunit and comparative expression of adhesion receptor mRNAs. J. Biol. Chem. 262, 14080–14085. [PubMed] [Google Scholar]
- 19. Roberts, K. , Yokoyama, W. M. , Kehn, P. J. , Shevach, E. M. (1991) The vitronectin receptor serves as an accessory molecule for the activation of a subset of gamma/delta T cells. J. Exp. Med. 173, 231–240. [DOI] [PMC free article] [PubMed] [Google Scholar]
- 20. Verbisck, N. V. , Costa, E. T. , Costa, F. F. , Cavalher, F. P. , Costa, M. D. , Muras, A. , PaixaTo, V. A. , Moura, R. , Granato, M. F. , Ierardi, D. F. , Machado, T. , Melo, F. , Ribeiro, K. B. , Cunha, I. W. , Lima, V. C. , Maciel, Mdo. S. , Carvalho, A. L. , Soares, F. F. , Zanata, S. , Sogayar, M. C. , Chammas, R. , Camargo, A. A. (2009) ADAM23 negatively modulates alpha(v)beta(3) integrin activation during metastasis. Cancer Res. 69, 5546–5552. [DOI] [PubMed] [Google Scholar]
- 21. Luzina, I. G. , Todd, N. W. , Nacu, N. , Lockatell, V. , Choi, J. , Hummers, L. K. , Atamas, S. P. (2009) Regulation of pulmonary inflammation and fibrosis through expression of integrins alphaVbeta3 and alphaVbeta5 on pulmonary T lymphocytes. Arthritis Rheum. 60, 1530–1539. [DOI] [PMC free article] [PubMed] [Google Scholar]
- 22. Inaba, K. , Inaba, M. (2005) Antigen recognition and presentation by dendritic cells. Int. J. Hematol. 81, 181–187. [DOI] [PubMed] [Google Scholar]
- 23. Hivroz, C. , Chemin, K. , Tourret, M. , Bohineust, A. (2012) Crosstalk between T lymphocytes and dendritic cells. Crit. Rev. Immunol. 32, 139–155. [DOI] [PubMed] [Google Scholar]
- 24. Dustin, M. L. , Tseng, S. Y. , Varma, R. , Campi, G. (2006) T cell‐dendritic cell immunological synapses. Curr. Opin. Immunol. 18, 512–516. [DOI] [PubMed] [Google Scholar]
- 25. Song, J. , Lei, F. T. , Xiong, X. , Haque, R. (2008) Intracellular signals of T cell costimulation. Cell. Mol. Immunol. 5, 239–247. [DOI] [PMC free article] [PubMed] [Google Scholar]
- 26. Van Kooyk, Y. , Geijtenbeek, T. B. (2002) A novel adhesion pathway that regulates dendritic cell trafficking and T cell interactions. Immunol. Rev. 186, 47–56. [DOI] [PubMed] [Google Scholar]
- 27. Inaba, K. , Inaba, M. , Romani, N. , Aya, H. , Deguchi, M. , Ikehara, S. , Muramatsu, S. , Steinman, R. M. (1992) Generation of large numbers of dendritic cells from mouse bone marrow cultures supplemented with granulocyte/macrophage colony‐stimulating factor. J. Exp. Med. 176, 1693–1702. [DOI] [PMC free article] [PubMed] [Google Scholar]
- 28. Kim, H. A. , Park, W. J. , Jeong, H. S. , Lee, H. E. , Lee, S. H. , Kwon, N. S. , Baek, K. J. , Kim, D. S. , Yun, H. Y. (2012) Leucine‐rich glioma inactivated 3 regulates adipogenesis through ADAM23. Biochim. Biophys. Acta 1821, 914–922. [DOI] [PubMed] [Google Scholar]
- 29. Brando, C. , Shevach, E. M. (1995) Engagement of the vitronectin receptor (alpha V beta 3) on murine T cells stimulates tyrosine phosphorylation of a 115‐kDa protein. J. Immunol. 154, 2005–2011. [PubMed] [Google Scholar]
- 30. Sturmhöfel, K. , Brando, C. , Martinon, F. , Shevach, E. M. , Coligan, J. E. (1995) Antigen‐independent, integrin‐mediated T cell activation. J. Immunol. 154, 2104–2111. [PubMed] [Google Scholar]
Associated Data
This section collects any data citations, data availability statements, or supplementary materials included in this article.
Supplementary Materials
Supplementary material 1
Supplementary material 2


