

Short abstract
Reversal of age‐related CAR‐T dysfunction with M‐CSF or TGF‐β1 treatments can be implemented to bioengineer highly efficacious CAR‐T cells in aged cancer patients.
Keywords: TGF‐β1, M‐CSF, transduction, retronectin
Abstract
Chimeric antigen receptor expressing T cells (CAR‐T) are a promising form of immunotherapy, but the influence of age‐related immune changes on CAR‐T production remains poorly understood. We showed that CAR‐T cells from geriatric donors (gCAR‐T) are functionally impaired relative to CAR‐T from younger donors (yCAR‐T). Higher transduction efficiencies and improved cell expansion were observed in yCAR‐T cells compared with gCAR‐T. yCAR‐T demonstrated significantly increased levels of proliferation and signaling activation of phosphorylated (p)Erk, pAkt, pStat3, and pStat5. Furthermore, yCAR‐T contained higher proportions of CD4 and CD8 effector memory (EM) cells, which are known to have enhanced cytolytic capabilities. Accordingly, yCAR‐T demonstrated higher levels of tumor antigen‐specific cytotoxicity compared with gCAR‐T. Enhanced tumor killing by yCAR‐T correlated with increased levels of perforin and granzyme B. yCAR‐T had increased α5β1 integrin expression, a known mediator of retroviral transduction. We found that treatment with M‐CSF or TGF‐β1 rescued the impaired transduction efficiency of the gCAR‐T by increasing the α5β1 integrin expression. Neutralization of α5β1 confirmed that this integrin was indispensable for CAR expression. Our study suggests that the increase of α5β1 integrin expression levels enhances CAR expression and thereby improves tumor killing by gCAR‐T.
Abbreviations
- γc
γ chain
- ACT
adoptive T cell therapy
- CAR‐T
chimeric antigen receptor expressing T
- CD62L
cluster of differentiation 62 ligand
- CEA
carcinoembryonic antigen
- EC
effector cell
- EM
effector memory
- gCAR‐T
chimeric antigen receptor‐T from geriatric donor
- gT
geriatric donor T cells
- LDH
lactate dehydrogenase
- p
phosphorylated
- yCAR‐T
chimeric antigen receptor‐T from young donor
- yT
young donor T cells
Introduction
Cancer disproportionately affects elderly people, the median age being 70 yr in industrialized countries [1]. The elderly have accumulated more genetic damage related to environmental carcinogens and have reduced immune function or immunosenescence [1]. Immunosenescence is characterized by a contraction of the naive T cell compartment and CD4+ and CD8+ T cell functional deficiencies, which impair anti‐tumor immunity [2]. As such, cancer immunotherapy must account for age‐related immune changes.
There has been significant progress in the field of ACT, primarily through development of CAR‐T cell platforms. Autologous T cells can be genetically engineered to express proteins that confer exquisite specificity for tumor antigens by introducing genes that encode CARs. In our recent CAR‐T Phase I/II systemic infusion (NCT00429078, NCT00673322, NCT00673829) and Phase I/Ib regional hepatic artery infusion (NCT01373047, NCT02416466) trials, we have tested the safety of CAR‐T cells that are specific for CEA, which is expressed in several adenocarcinoma subtypes, including colorectal and pancreatic cancers [3]. The infusion of CAR‐T cells that are tumor antigen specific offers patients an immediate, highly specific immune response, in contrast to vaccines that are designed to generate immunity within the host.
In elderly patients, there is a major phenotypic shift away from naive T cell phenotypes that could render ACT less effective compared with younger patients [4]. To gain insight into potential age‐related CAR‐T deficiencies, we are interested in exploring how responses to T cell‐activating cytokines differ between yCAR‐T and gCAR‐T. IL‐2 and IL‐15 both signal through the common γc and IL‐2β chain receptors but are functionally distinct regulators of T cell proliferation and differentiation. Both IL‐2 and IL‐15 are known to activate the Jak/Stat, PI3K/Akt, and Mek/Erk signaling pathways [5], but they have differential immunotherapeutic effects. IL‐15 preferentially induces memory and effector T cell programming, and hence, there is growing interest in using exogenous IL‐15 instead of IL‐2 for CAR‐T support [6]. We speculated that IL‐15 may compensate for age‐related defects in gCAR‐T.
In the present study, we investigated the production and anti‐tumor activity of gCAR‐T and evaluated whether gCAR‐T or yCAR‐T responds differently to IL‐2 or IL‐15. Given the emergence of CAR‐T therapies in the context of an aging population that is at high risk for cancer, we undertook the present study to address potential age‐related CAR‐T cell deficiencies. We hypothesized that gCAR‐T donors would demonstrate functional impairments relative to yCAR‐T. Furthermore, we define a mechanism to explain gCAR‐T impairment and a strategy for rescuing gCAR‐T after production.
MATERIALS AND METHODS
Cell cultures, transduction, and cell expansion
PBMCs were isolated using Histopaque (Sigma‐Aldrich, St. Louis, MO, USA) from whole blood, obtained from 8 young (18–45 yr) and 8 geriatric (>65 yr) healthy donors. PBMC was activated for 48 h with anti‐CD3 (50 ng/ml, OKT3; Centocor Ortho Biotech, Raritan, NJ, USA), and cells were maintained at 2 × 10⁶/ml. PBMCs from young and geriatric donors were transduced thrice using the retroviral delivery system to generate CAR that combines portions of CD28, TCR zeta and a single chain antibody domain (sFv) specific for carcinoembryonic antigen into a single molecule [7]. CAR expression was measured 48 h post‐transduction using an anti‐idiotype antibody (WI2; Immunomedics, Morris Plains, NJ, USA) or Fc‐CEA fusion protein by flow cytometry [7, 8]. Cells were expanded in the presence of IL‐2 (3000 IU/ml; Prometheus, Sharon, MA, USA) or with IL‐15 (5 ng/ml; National Cancer Institute) for 20 d. For M‐CSF and TGF‐β1 treatments, PBMCs were activated as mentioned above and treated simultaneously with M‐CSF (5 ng/ml; PeproTech, Rocky Hill, NJ, USA) or TGF‐β1 (10 ng/ml; PeproTech) for 48 h. For functional blocking of α5β1, 106 untransduced cells from geriatric donors were blocked with 1 µg α5β1 integrin antibody (MAB1969; EMD Millipore, Billerica, MA, USA) at 37°C for 30 min before transduction.
Antibodies and flow cytometry
Antibodies specific for the following surface markers were used: CD3 (Thermo Fisher Scientific Waltham, MA, USA), CD4 (Thermo Fisher Scientific), CD8 (eBioscience, San Diego, CA, USA), CD45RA (Thermo Fisher Scientific), CD45RO (Thermo Fisher Scientific), CD62L (Thermo Fisher Scientific), CCR7 (BD PharMingen, San Diego, CA, USA), and CAR expression, as described above. A CyAn ADP flow cytometer (Beckman Coulter, Brea, CA, USA) was used to collect cells for analysis. Unstained cells and single‐stained controls were used to determine laser voltages and calculate compensations. Flow cytometry data analysis was carried out using Flow Jo software (TreeStar, Ashland, OR, USA).
Western blot
T Cells were lysed with radioimmunoprecipitation assay buffer (Thermo Fisher Scientific), supplemented with protease inhibitor cocktail (Roche Diagnostics, Indianapolis, IN, USA), 1 mM NaVO4, and 1 mM NaF (Sigma‐Aldrich). Lysates were centrifuged at 10,000 rpm for 10 min at 4°C, supernatants were collected, and protein quantification was performed using a Bradford protein assay (Thermo Fisher Scientific) with BSA as the standard. Lysates were denatured using 2‐ME (Thermo Fisher Scientific) and Laemmli sample buffer (Bio‐Rad Laboratories, Hercules, CA, USA) and heated at 70°C for 10 min, electrophoresed in Mini‐Protean TGX 4–15% gels (Bio‐Rad Laboratories), transferred on the Trans‐Blot Turbo polyvinylidene difluoride membrane (Bio‐Rad Laboratories), and immunoblotted with specific primary antibodies. Primary antibody binding was detected using HRP‐conjugated secondary antibodies (Cell Signaling Technology, Danvers, MA, USA) and ECL Prime Western blotting reagents (Amersham; GE Healthcare Bio‐Sciences, Pittsburgh, PA, USA) as chemiluminescence substrates. The immunoblots were analyzed and quantified using ImageJ software (NIH, Bethesda, MD, USA). Antibodies to pStat3, total Stat3, pAkt, total Akt, pErk, total Erk, and GAPDH‐HRP mAb were from Cell Signaling Technology. pStat5 and total Stat5 were purchased from Santa Cruz Biotechnology (Dallas, TX, USA).
Cytotoxicity, perforin, and granzyme assays
MC38‐CEA (CEA+) and MC38 (CEA−) cells were plated at specified target cell:effector cell ratios (1:1, 1:10, 1:20) into 96‐well plates. Untransduced or transduced T cells treated with either IL‐2 (3000 IU/ml) or IL‐15 (5 ng/ml) were cocultured for 4 h in a 37°C incubator with both cell types. CEA‐specific cytotoxicity was detected by the release of LDH, according to the manufacturer's instructions (Promega, Madison, WI, USA). MC38 (CEA−) cells served as a negative control to ensure CEA‐specific tumor killing. The absorbance was measured at 490 nm with a Multiskan MS microplate reader. Human granzyme B and perforin ELISA (Abcam, Cambridge, MA, USA) was also performed from the same supernatants obtained from the coculture, as per the manufacturer's instructions.
RT‐PCR for perforin and granzyme B
Total RNA was isolated using the RNeasy Mini Kit (Qiagen, Germantown, MD, USA) from n = 8 samples of gT, yT, gT + M‐CSF, and gT + TGF‐β1 cells that were expanded in IL‐2 or IL‐15 for 20 d. For RT, iScript cDNA Synthesis kit and SYBR Select Master Mix (Thermo Fisher Scientific) were used for quantitative PCR, respectively. Granzyme B forward primer 5′‐TGC AGG AAG ATC GAA AGT GCG‐3′, granzyme B reverse primer 5′‐GAG GCA TGC CAT TGT TTC GTC‐3′, perforin forward primer 5′‐CAG TAC AGC TTC AGC ACT GAC‐3′, and perforin reverse primer 5′‐ATG AAG TGG GTG CCG TAG TTG‐3′ were used for RT‐PCR [9]. For any sample, comparative threshold values were calculated, and GAPDH was used to normalize. RT‐PCR of cDNA was performed using ABI Prism 7000 Sequence Detection System (Thermo Fisher Scientific).
Statistics
All data are expressed as means with sem. Statistical significance was performed using one‐way ANOVA, and when ANOVA was significant, individual differences were evaluated using Bonferroni post hoc test using GraphPad Prism software (GraphPad Software, La Jolla, CA, USA). Values of P < 0.05 were considered statistically significant.
RESULTS AND DISCUSSION
To examine the differences in CAR expression between gT and yT, PBMCs were isolated from both groups and activated with anti‐CD3 for 48 h, followed by retroviral transduction to generate anti‐CEA CAR‐Ts. Transduction efficiency was measured in 8 subjects per group using flow cytometric analysis ( Fig. 1A ) and was found to be significantly lower in gCAR‐T cells (21.3 ± 2.2%) compared with yCAR‐T (36.9 ± 4.3%, P = 0.002). Prior reports indicate that aging causes a decrease in lymphocyte proliferative capacity as a result of changes in signal transduction pathways [10]. Untransduced and transduced cells were maintained in IL‐2 (3000 IU/ml) or IL‐15 (5 ng/ml) for 20 d. There was significantly higher expansion of yCAR‐T compared with gCAR‐T (2.4‐fold for IL‐2 and 2.1‐fold for IL‐15, P < 0.005) that was not affected by transduction (Fig. 1B). IL‐15 did not confer a significant benefit for gCAR‐T expansion compared with IL‐2 (Fig. 1B).
Figure 1.
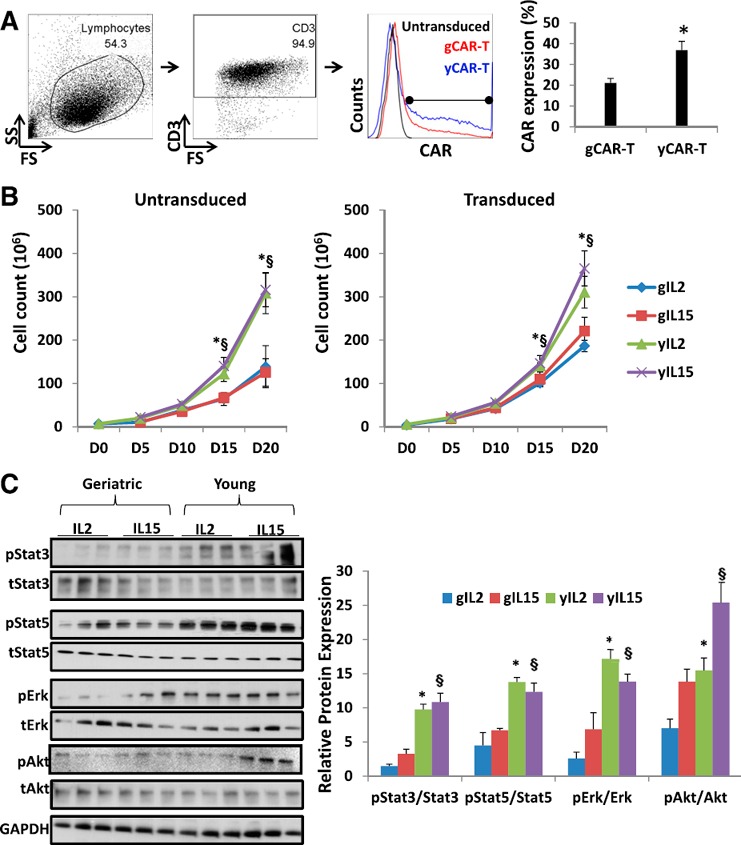
Transduction efficiency and expansion profile of CAR‐T cells. (A) Transduction efficiency of human PBMCs of 8 healthy young and geriatric donors (yCAR‐T and gCAR‐T, respectively) was evaluated 48 h after transduction using the illustrated gating strategy. FS, Forward‐scatter; SS, side‐scatter. (B) Cell expansion curve for untransduced and transduced geriatric (g) and young (y) T cells in the presence of IL‐2 (3000 IU/ml) or IL‐15 (5 ng/ml). Results are shown as means ± sem. D, Day. (C) Total protein was isolated from gCAR‐T and yCAR‐T cells treated with IL‐2 or IL‐15 on day 20. Protein lysates were prepared and subjected to Western blot analysis using antibodies against total (t) and pErk, pAkt, pStat3, and pStat5 proteins. Each lane represents an individual donor. Triplicate samples were loaded for each treated group, and the signals were quantified by densitometric analysis and normalized to respective total proteins from 3 independent experiments. ∗,§ P < 0.05, geriatric vs. young for respective groups (∗IL‐2 or §IL‐15).
The IL‐2 and IL‐15 receptors signal through multiple proliferation pathways that include Akt‐, Erk‐, and Jak‐dependent activation of Stat3 and Stat5 [11]. pAkt, pErk, pStat3, and pStat5 were increased significantly in yCAR‐T cells (Fig. 1C), indicating that gCAR‐T cells had relatively impaired pro‐proliferation signaling despite being treated with IL‐2 or IL‐15. Enhanced pStat3 and pStat5 protein levels are observed in the presence of IL‐2 (3000 IU/ml) and IL‐15 (5 ng/ml) in the media used for expansion of CAR‐T during production. IL‐2 and IL‐15 are known to induce Jak/Stat signaling via the IL‐2/IL‐15βR and common γc [12]. Similar results were observed in untransduced cells, implying that CAR expression had no impact on the differences in cellular signaling (data not shown).
TCR ligation, CD3 activation, and CD28 costimulation induce an intricate signaling cascade that leads to naive T cell proliferation and EC programming [13]. This differentiation depends on the cytokine milieu and on other contextual factors, such as antigen type, antigen presentation, and other costimulatory molecules. Studies show the importance of memory CD8+ T cells, which are known to recognize and destroy tumor cells [14] and prevent tumor relapse [15].
Phenotypic profiling was performed for both untransduced and transduced T cells treated with IL‐2 or IL‐15 ( Fig. 2 ). We identified CD45RA+CD45RO−CCR7+CD62L+ naive cells, CD45RA−CD45RO+CCR7+CD62L+ central memory cells, CD45RA−CD45RO+CCR7−CD62L− EM cells, and CD45RA+CD45RO−CCR7−CD62L− ECs [16]. All cell populations were gated as CD3+CAR+ and either CD4+ or CD8+ (Fig. 2A). yCAR‐T contained higher proportions of CD4+ ECs (64.3 ± 7.6%, P = 0.003) and CD4+ EM (43.2 ± 6.8%, P = 0.002) and CD8+ EM (16.5 ± 3.6%, P = 0.002) cells. EM cells provide immediate protection from a peripheral challenge, whereas central memory cells provide a source of new EC [17]. We did not observe any significant differences in the phenotypes between IL‐2‐ or IL‐15‐treated cells. Similar results were also observed in the untransduced cells (data not shown). Although studies show a relative decrease in naive populations in elderly patients [4], ex vivo expansion resulted in similar proportions of naive T cells among gCAR‐T and yCAR‐T cells (data not shown). For both CD4+ and CD8+ gCAR‐T cells, we noted significantly higher numbers of CD45RA+CD45RO+ cells (83.5 + 3.6 for gCAR‐T vs. 11.3 + 2.1 for yCAR‐T, P = 0.0003, for CD4+ cells; 75.6 + 5.3 for gCAR‐T vs. 8.5 + 1.6 for yCAR‐T, P = 0.0004, for CD8+ cells) that could represent either a transitional or an EC type [18], known to represent a small proportion of CD4+ T cells [19]. This could possibly imply that gCAR‐T cells do not terminally differentiate into memory cells and ECs, where they express either CD45RA or CD45RO [16].
Figure 2.
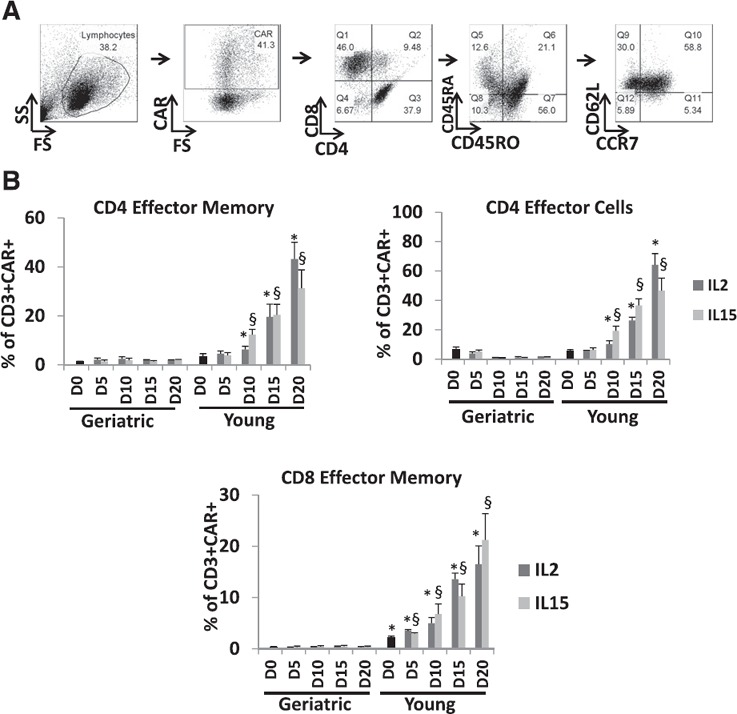
Phenotyping of gCAR‐T and yCAR‐T cells. (A) CD4 or CD8 memory and effector T cell phenotypic analysis was performed based on CD45RA, CD45RO, CD62L, and CCR7 expression (n = 8), as per the gating strategy. Q, Quadrant. (B) CEA‐specific CD4 and CD8 T cells were phenotyped for EM and ECs. Data shown are for 8 geriatric and young healthy donors. Results are shown as means ± sem. ∗,§ P < 0.05, for comparison of yCAR‐T vs. gCAR‐T within IL‐2 (∗) or IL‐15 (§) groups.
To determine if the enhanced effector programming among yCAR‐T cells correlated with function, we performed cytotoxicity assays, where CAR‐T cells were incubated with CEA+ or CEA− tumor cells, and the latter served as a CEA‐specific cytotoxicity control. As expected, yCAR‐T cells exposed to IL‐2 or IL‐15 had significantly higher CEA‐specific cytotoxicity compared with gCAR‐T (1.7‐fold for IL‐2 and 1.6‐fold for IL‐15 over respective gCAR‐T, P < 0.005), with no difference among untransduced CAR‐T cells ( Fig. 3A and B ).
Figure 3.
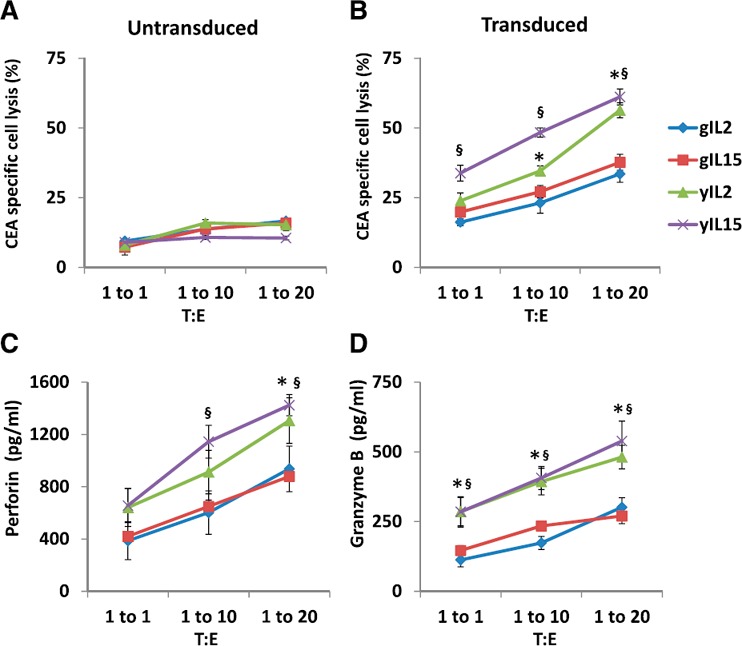
Anti‐tumor cytotoxicity of gCAR‐T and yCAR‐T cells. (A and B) The in vitro cytotoxic activity of IL‐2 (3000 IU/ml)‐ or IL‐15 (5 ng/ml)‐treated gCAR‐T and yCAR‐T cells was evaluated by incubating MC38 (CEA+; target) cells at 1:1, 1:10, or 1:20 target cell:EC (T:E) ratios. MC38 (CEA−) cells were used as a negative control to show CEA‐specific cytotoxicity of CAR‐T cells. Cell lysis was determined by measuring the LDH released in the culture supernatant. (C and D) Secretion of perforin and granzyme B by CAR‐T cells cocultured with MC38 (CEA+) was measured. Results are shown as means ± sem. ∗,§ P < 0.05 vs. gCAR‐T cells for respective groups (∗IL‐2 or §IL‐15).
Human CD8+ EM cells exhibit direct ex vivo lytic activity and constitutively express granzyme and perforin [20], proteins used for lysis of target cells [21]. Enhanced tumor killing by yCAR‐T correlated with increased levels of perforin (1305.6 ± 174.1 ng/ml, P = 0.01) and granzyme B (481.1 ± 32.5 ng/ml, P = 0.02) compared with gCAR‐T for both IL‐2 or IL‐15 treatments (Fig. 3C and D). Overall, we found that there were enhanced numbers of CD4+ ECs and CD8+ EM cells among yCAR‐T cells compared with gCAR‐T cells, and possibly, this was accounting for the increased cytotoxicity observed in that group. Interestingly, when the cytotoxicity was normalized for transduction efficiency, gCAR‐T cytotoxic function was similar to yCAR‐T cells (data not shown). As such, further experiments were focused on rescuing gCAR‐T transduction to enhance CAR expression.
Integrins mediate cell adhesion and are responsible for cell–cell adhesion and cell migration [22]. α5β1 integrins play a crucial role in RetroNectin‐based transduction of T cells, which was used for transducing T cells in this study [23]. RetroNectin, a recombinant human fibronectin fragment, contains a cell‐binding domain that interacts with α5β1 integrins and thereby aids in colocalization of the cells with viral particles. The viral particles interact with the H‐domain of the RetroNectin reagent and target the α5β1 integrin receptors on T cells facilitating physical proximity and thereby enhancing transduction efficiency. Flow cytometric analysis ( Fig. 4A ) demonstrated significantly higher expression of the α5β1 integrin among yT cells compared with gT cells (44.4 ± 4.2 vs. 22.3 ± 2.0, P = 0.0003; Fig. 4B), which correlated with the lower gCAR‐T transduction efficiencies (Fig. 4C).
Figure 4.
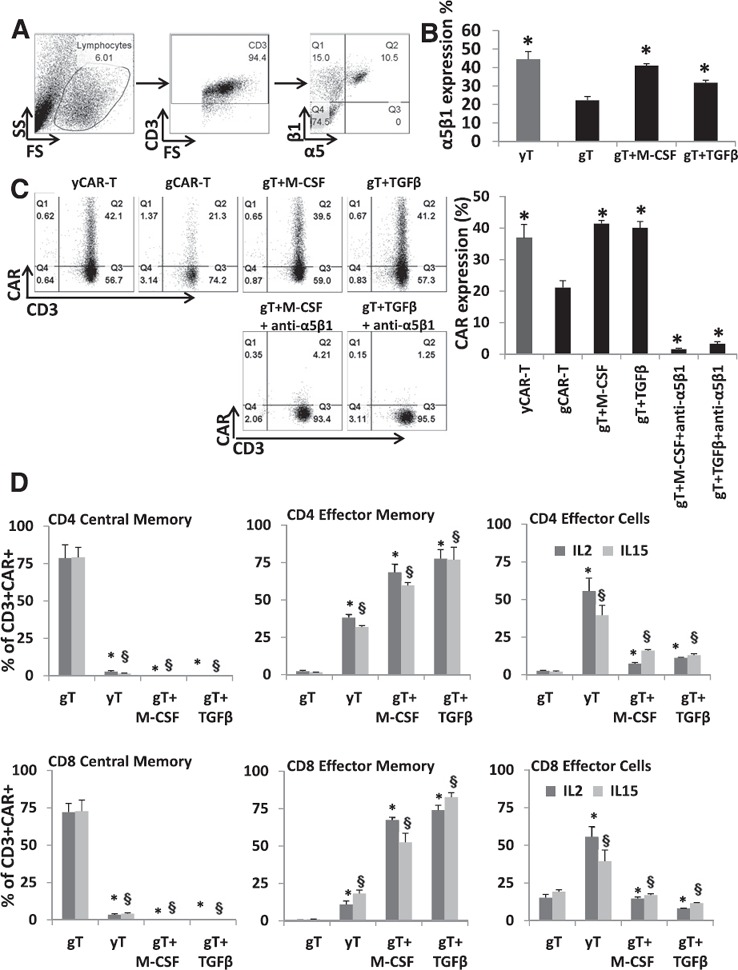
Rescuing gCAR‐T α5β1 integrin expression and phenotyping. (A) α5β1 integrin expression levels were measured using flow cytometry, as shown in the representative gating strategy for both activated gT and yT. (B) The relative expression of α5β1 integrin in M‐CSF (5 ng/ml)‐ or TGF‐β1 (10 ng/ml)‐treated activated gT cells was quantified in all 8 donors and compared with untreated yT and gT cells (n = 8 for each group). Results represent means ± sem. ∗P < 0.0005 vs. untreated gT cells. (C) Transduction efficiency of M‐CSF (5 ng/ml)‐ or TGF‐β1 (10 ng/ml)‐treated gT cells (n = 8) was evaluated after 48 h after transduction. Representative dot plots show the transduction efficiency expressed as a percentage of viable cell population. Results are shown as mean ± sem. ∗P < 0.005 vs. untreated gCAR‐T cells. (D) Day 20 CD4+ or CD8+ naive, memory, and effector T cell phenotypic analysis was performed based on CD45RA, CD45RO, CD62L, and CCR7 expression (n = 8). Results indicate means ± sem. ∗,§ P < 0.05 for comparison of M‐CSF or TGF‐β1 treatment vs. untreated gCAR‐T cells (∗‐IL2 or §‐IL15).
M‐CSF and TGF‐β1 are known to up‐regulate α5β1 integrin expression [24, 25] and modulate integrins, such as α1, α2, α3, α5, and β1, on many different cell types [26]. A previous study on hepatocellular carcinoma cells shows that TGF‐β1 treatment causes an increase in α5 integrin subunit expression at protein and mRNA levels [24]. The increase in the β1 integrin subunit by TGF‐β1 treatment is not a result of its increased mRNA levels but of its faster maturation and increased α5 subunit expression [27]. Studies performed on mature monocytes treated with M‐CSF showed that enhanced mRNA levels of α5 and β1 and increased surface expression of β1 integrin could be a result of accelerated synthesis of the rate‐limiting α5 subunit similar to TGF‐β1 treatment [28]. In an effort to rescue the decreased α5β1 integrin expression levels in gT, we treated PBMCs isolated from geriatric donors with either M‐CSF (5 ng/ml) or TGF‐β1 (10 ng/ml) for 48 h during activation. We observed a significant increase of α5β1 integrin expression with both treatments among gT to levels comparable with yT (gT + M‐CSF 41.0 ± 1.0, gT + TGF‐β1 31.8 ± 1.4, yT 44.4 ± 4.2, P < 0.0005; Fig. 4B). There was also an increase in α5β1 integrin expression in yT cells treated with M‐CSF or TGF‐β1. However, the fold increase in yT cell α5β1 was not as pronounced as gT cells with M‐CSF (1.5‐ vs. 2.3‐fold) or TGF‐β1 (1.2‐ vs. 1.8‐fold; data not shown).
The treated cells were then transduced, and the CAR expression was rescued in gT cells (yCAR‐T 36.9 ± 4.3, gCAR‐T 21.1 ± 2.2, g‐T + M‐CSF 41.4 ± 1.0, g‐T + TGF‐β1 40.1 ± 2.0, P < 0.002 vs. gCAR‐T; Fig. 4C). To establish a direct link between the α5β1 integrin expression and the rescue of gT CAR expression, we neutralized α5β1 with an antibody before transduction. We confirmed minimal CAR expression (gT + M‐CSF + anti‐α5β1 1.8 ± 0.5, gT + TGF‐β1 + anti‐α5β1 0.9 ± 2.0, P < 0.0000001 vs. gCAR‐T) in α5β1‐blocked geriatric cells that were rescued with M‐CSF or TGF‐β treatments. Efficiency of α5β1 neutralization was confirmed in a competitive binding assay (data not shown). The intracellular signaling events in which M‐CSF and TGF‐β1 preferentially enhance α5β1 expression in gT cells require further study. Phenotypic analysis was performed on the gCAR‐T cells treated with M‐CSF or TGF‐β1 and expanded for 20 d. yCAR‐T contained higher proportions of CD4+ ECs (64.3 ± 7.6%, P = 0.003) and CD4+ EM (43.2 ± 6.8%, P = 0.002) and CD8+ EM (16.5 ± 3.6%, P = 0.002) cells. Interestingly, gCAR‐T cells treated with M‐CSF or TGF‐β1 contained significantly higher levels of CD4+ EM cells (68.5 ± 5.4, P = 0.004, for M‐CSF; 77.5 ± 6.2, P = 0.002, for TGF‐β1), CD4+ ECs (17.5 ± 2.6, P = 0.006, for M‐CSF; 11.3 ± 2.3, P = 0.002, for TGF‐β1), and CD8+ EM cells (67 ± 1.8, P = 0.003, for M‐CSF; 73.3 ± 3.4, P = 0.003, for TGF‐β1) compared with untreated gCAR‐T cells (Fig. 4D). No significant differences between phenotypes were observed between IL‐2‐ or IL‐15‐treated cells. Thus, the treatment with M‐CSF and TGF‐β1 reprogrammed the skewed gCAR‐T phenotype to more closely resemble that of untreated yCAR‐T cells.
As we did not observe any phenotypic or signaling differences between IL‐2‐ or IL‐15‐treated gCAR‐T or yCAR‐T cells, we analyzed the signaling profile of gCAR‐T cells treated with M‐CSF or TGF‐β1 and expanded in the presence of IL‐2. Interestingly, the intrinsic signaling defect observed in gCAR‐T cells was rescued with both treatments ( Fig. 5A ), except for pStat5 protein expression. Integrins are known to regulate several intracellular signaling pathways, such as MAPK/Erk and PI3K/Akt, and could be a probable cause of the rescue phenotype observed in the treated gCAR‐T cells [29]. We also analyzed mRNA transcript levels of perforin and granzyme B, and as expected, we found significantly diminished levels in gCAR‐T cells compared with yT, which was reversed with M‐CSF and TGF‐β1 treatments (Fig. 5B). To evaluate the anti‐tumor efficiency of M‐CSF‐ and TGF‐β1‐treated gCAR‐T cells, we performed cytotoxicity assays, as described earlier, and demonstrated that M‐CSF‐ or TGF‐β1‐treated gCAR‐T cells had increased CEA‐specific tumor killing compared with untreated gCAR‐T. Cytotoxicity efficacy of the gCAR‐T cells was rescued with M‐CSF or TGF‐β1 treatments in IL‐2‐ or IL‐15‐treated cells (Fig. 5C). Thus, our data support the fact that through enhancing α5β1 integrin levels in gCAR‐T cells, we can overcome their functional deficiencies, which may improve the success of gCAR‐T patient therapies.
Figure 5.
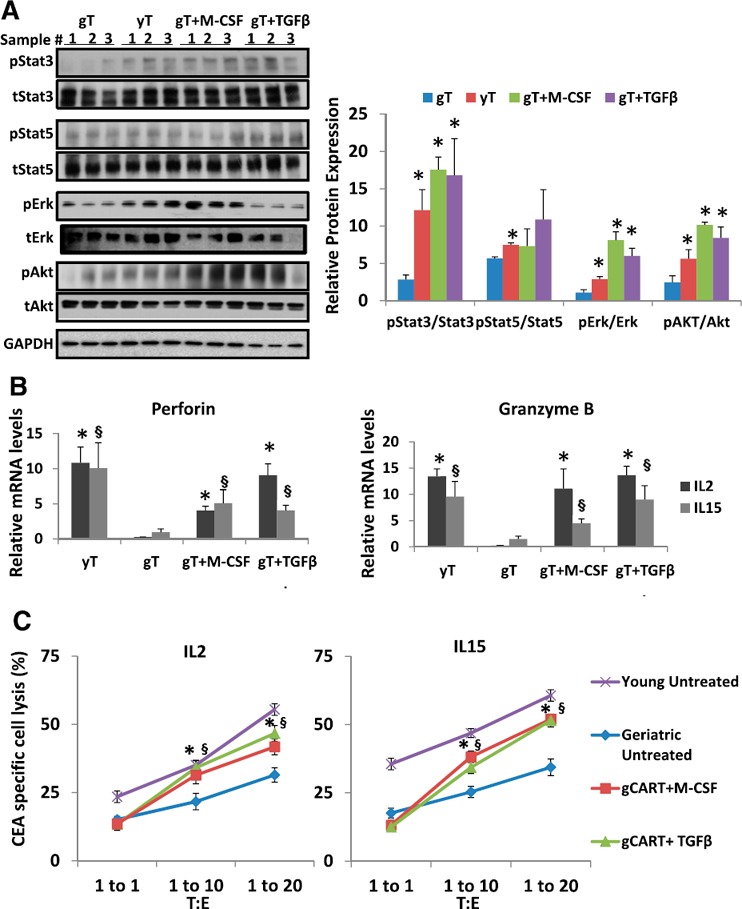
Rescued gCAR‐T signaling and cytotoxic function: (A). Total protein isolated from M‐CSF (5 ng/ml)‐ or TGF‐β1 (10 ng/ml)‐treated activated gT cells treated with IL‐2 for 20 d. Protein lysates were prepared and subjected to Western blot analysis using antibodies against and total (t) and pErk, pAkt, pStat3, and pStat5 proteins. The immunoblots were reprobed with antibody against GAPDH to control for equal loading. Triplicate samples were loaded for each treated group, and the signals were quantified by densitometric analysis and normalized to respective total proteins Results are shown as means ± sem. ∗P < 0.05, treated gCAR‐T or yCAR‐T was compared with gCAR‐T. (B) RNA isolated from M‐CSF (5 ng/ml)‐ or TGF‐β1 (10 ng/ml)‐treated activated gCAR‐T cells expanded in the presence of IL‐2 or IL‐15 for 20 d was subjected to quantitative PCR. Results are shown as means ± sem. ∗,§ P < 0.05, geriatric vs. young for respective groups (∗IL‐2 or §IL‐15). (C) The in vitro anti‐tumor activity of M‐CSF (5 ng/ml)‐ or TGF‐β1 (10 ng/ml)‐treated gT cells. Treated and untreated gCAR‐T (effector) was evaluated for cytotoxicity. Results indicate means ± sem. ∗,§ P < 0.0005 for comparison of M‐CSF (∗) or TGF‐β1 (§) treatment vs. untreated gCAR‐T cells.
In conclusion, this study suggests that impaired CAR expression among gCAR‐T can hinder anti‐tumor efficacy, which can cause deficiencies in immunotherapy of geriatric cancer patients. Whereas IL‐15 did not rescue gCAR‐T function in keeping with our initial hypothesis, M‐CSF and TGF‐β1 mitigated age‐related CAR‐T production defects through support of α5β1 integrin expression. Our preclinical in vitro data suggest that treatment of gT with M‐CSF or TGF‐β1 is a viable strategy for enhancing gCAR‐T function to a level comparable with products created from younger donors. This study has translational impact, as it suggests that age‐related CAR‐T deficiencies are reversible. Confirmation of these findings in other CAR‐T products, in addition to in vivo testing, is required before clinical application.
AUTHORSHIP
P.G. conceived, designed and performed experiments, analyzed and interpreted data and wrote the manuscript; M.C. performed the experiments; P.S. and N.J.E. critically reviewed the manuscript and designed experiments; R.P.J. provided crucial reagents, designed experiments, and critically reviewed the manuscript; S.C.K. conceived and designed experiments and wrote the manuscript.
DISCLOSURES
The authors declare no conflicts of interest.
ACKNOWLEDGMENTS
This work was supported by the U.S. National Institutes of Health (NIH; 1K08CA160662‐01A1). The authors thank Immunomedics for generously providing the WI2 anti‐idiotype CAR antibody, Prometheus for providing Proleukin (IL‐2), and Dr. Thomas Waldmann (National Cancer Institute, NIH) for providing IL‐15. The authors also thank Dr. John Morgan and the Roger Williams Medical Center Core Facility for providing us with the Flow Cytometry Core Facility and Jillian Gardell for technical assistance.
SEE CORRESPONDING EDITORIAL ON PAGE 188
REFERENCES
- 1. Gloeckler Ries, L. A. , Reichman, M. E. , Lewis, D. R. , Hankey, B. F. , Edwards, B. K. (2003) Cancer survival and incidence from the surveillance, epidemiology, and end results (SEER) program. Oncologist 8, 541–552. [DOI] [PubMed] [Google Scholar]
- 2. Naylor, K. , Li, G. , Vallejo, A. N. , Lee, W. W. , Koetz, K. , Bryl, E. , Witkowski, J. , Fulbright, J. , Weyand, C. M. , Goronzy, J. J. (2005) The influence of age on T cell generation and TCR diversity. J. Immunol. 174, 7446–7452. [DOI] [PubMed] [Google Scholar]
- 3. Katz, S. C. , Burga, R. A. , McCormack, E. , Wang, L. J. , Mooring, W. , Point, G. R. , Khare, P. D. , Thorn, M. , Ma, Q. , Stainken, B. F. , Assanah, E. O. , Davies, R. , Espat, N. J. , Junghans, R. P. (2015) Phase I hepatic immunotherapy for metastases study of intra‐arterial chimeric antigen receptor‐modified T‐cell therapy for CEA+ liver metastases. Clin. Cancer Res. 21, 3149–3159. [DOI] [PMC free article] [PubMed] [Google Scholar]
- 4. Kovaiou, R. D. , Weiskirchner, I. , Keller, M. , Pfister, G. , Cioca, D. P. , Grubeck‐Loebenstein, B. (2005) Age‐related differences in phenotype and function of CD4+ T cells are due to a phenotypic shift from naive to memory effector CD4+ T cells. Int. Immunol. 17, 1359–1366. [DOI] [PubMed] [Google Scholar]
- 5. Marzec, M. , Halasa, K. , Kasprzycka, M. , Wysocka, M. , Liu, X. , Tobias, J. W. , Baldwin, D. , Zhang, Q. , Odum, N. , Rook, A. H. , Wasik, M. A. (2008) Differential effects of interleukin‐2 and interleukin‐15 versus interleukin‐21 on CD4+ cutaneous T‐cell lymphoma cells. Cancer Res. 68, 1083–1091. [DOI] [PubMed] [Google Scholar]
- 6. Waldmann, T. A. (2006) The biology of interleukin‐2 and interleukin‐15: implications for cancer therapy and vaccine design. Nat. Rev. Immunol. 6, 595–601. [DOI] [PubMed] [Google Scholar]
- 7. Emtage, P. C. , Lo, A. S. , Gomes, E. M. , Liu, D. L. , Gonzalo‐Daganzo, R. M. , Junghans, R. P. (2008) Second‐generation anti‐carcinoembryonic antigen designer T cells resist activation‐induced cell death, proliferate on tumor contact, secrete cytokines, and exhibit superior antitumor activity in vivo: a preclinical evaluation. Clin. Cancer Res. 14, 8112–8122. [DOI] [PMC free article] [PubMed] [Google Scholar]
- 8. Ma, Q. , DeMarte, L. , Wang, Y. , Stanners, C. P. , Junghans, R. P. (2004) Carcinoembryonic antigen‐immunoglobulin Fc fusion protein (CEA‐Fc) for identification and activation of anti‐CEA immunoglobulin‐T‐cell receptor‐modified T cells, representative of a new class of Ig fusion proteins. Cancer Gene Ther. 11, 297–306. [DOI] [PubMed] [Google Scholar]
- 9. Wagner, C. , Iking‐Konert, C. , Denefleh, B. , Stegmaier, S. , Hug, F. , Hänsch, G. M. (2004) Granzyme B and perforin: constitutive expression in human polymorphonuclear neutrophils. Blood 103, 1099–1104. [DOI] [PubMed] [Google Scholar]
- 10. Fülöp, T. , Larbi, A. , Hirokawa, K. , Mocchegiani, E. , Lesourds, B. , Castle, S. , Wikby, A. , Franceschi, C. , Pawelec, G. (2007) Immunosupportive therapies in aging. Clin. Interv. Aging 2, 33–54. [DOI] [PMC free article] [PubMed] [Google Scholar]
- 11. Cornish, G. H. , Sinclair, L. V. , Cantrell, D. A. (2006) Differential regulation of T‐cell growth by IL‐2 and IL‐15. Blood 108, 600–608. [DOI] [PubMed] [Google Scholar]
- 12. Ikemizu, S. , Chirifu, M. , Davis, S. J. (2012) IL‐2 and IL‐15 signaling complexes: different but the same. Nat. Immunol. 13, 1141–1142. [DOI] [PubMed] [Google Scholar]
- 13. Brownlie, R. J. , Zamoyska, R. (2013) T cell receptor signalling networks: branched, diversified and bounded. Nat. Rev. Immunol. 13, 257–269. [DOI] [PubMed] [Google Scholar]
- 14. Wrzesinski, C. , Restifo, N. P. (2005) Less is more: lymphodepletion followed by hematopoietic stem cell transplant augments adoptive T‐cell‐based anti‐tumor immunotherapy. Curr. Opin. Immunol. 17, 195–201. [DOI] [PMC free article] [PubMed] [Google Scholar]
- 15. Straetemans, T. , Berrevoets, C. , Coccoris, M. , Treffers‐Westerlaken, E. , Wijers, R. , Cole, D. K. , Dardalhon, V. , Sewell, A. K. , Taylor, N. , Verweij, J. , Debets, R. (2015) Recurrence of melanoma following T cell treatment: continued antigen expression in a tumor that evades T cell recruitment. Mol. Ther. 23, 396–406. [DOI] [PMC free article] [PubMed] [Google Scholar]
- 16. Sallusto, F. , Geginat, J. , Lanzavecchia, A. (2004) Central memory and effector memory T cell subsets: function, generation, and maintenance. Annu. Rev. Immunol. 22, 745–763. [DOI] [PubMed] [Google Scholar]
- 17. Bouneaud, C. , Garcia, Z. , Kourilsky, P. , Pannetier, C. (2005) Lineage relationships, homeostasis, and recall capacities of central‐ and effector‐memory CD8 T cells in vivo. J. Exp. Med. 201, 579–590. [DOI] [PMC free article] [PubMed] [Google Scholar]
- 18. Muraro, P. A. , Pette, M. , Bielekova, B. , McFarland, H. F. , Martin, R. (2000) Human autoreactive CD4+ T cells from naive CD45RA+ and memory CD45RO+ subsets differ with respect to epitope specificity and functional antigen avidity. J. Immunol. 164, 5474–5481. [DOI] [PubMed] [Google Scholar]
- 19. Hengel, R. L. , Jones, B. M. , Kennedy, M. S. , Hubbard, M. R. , McDougal, J. S. (1999) Markers of lymphocyte homing distinguish CD4 T cell subsets that turn over in response to HIV‐1 infection in humans. J. Immunol. 163, 3539–3548. [PubMed] [Google Scholar]
- 20. Marzo, A. L. , Yagita, H. , Lefrançois, L. (2007) Cutting edge: migration to nonlymphoid tissues results in functional conversion of central to effector memory CD8 T cells. J. Immunol. 179, 36–40. [DOI] [PMC free article] [PubMed] [Google Scholar]
- 21. Cullen, S. P. , Martin, S. J. (2008) Mechanisms of granule‐dependent killing. Cell Death Differ. 15, 251–262. [DOI] [PubMed] [Google Scholar]
- 22. Weber, G. F. , Bjerke, M. A. , DeSimone, D. W. (2011) Integrins and Cadherins join forces to form adhesive networks. J. Cell Sci. 124, 1183–1193. [DOI] [PMC free article] [PubMed] [Google Scholar]
- 23. Yu, S. S. , Nukaya, I. , Enoki, T. , Chatani, E. , Kato, A. , Goto, Y. , Dan, K. , Sasaki, M. , Tomita, K. , Tanabe, M. , Chono, H. , Mineno, J. , Kato, I. (2008) In vivo persistence of genetically modified T cells generated ex vivo using the fibronectin CH296 stimulation method. Cancer Gene Ther. 15, 508–516. [DOI] [PubMed] [Google Scholar]
- 24. Cai, T. , Lei, Q. Y. , Wang, L. Y. , Zha, X. L. (2000) TGF‐beta 1 modulated the expression of alpha 5 beta 1 integrin and integrin‐mediated signaling in human hepatocarcinoma cells. Biochem. Biophys. Res. Commun. 274, 519–525. [DOI] [PubMed] [Google Scholar]
- 25. Shima, M. , Teitelbaum, S. L. , Holers, V. M. , Ruzicka, C. , Osmack, P. , Ross, F. P. (1995) Macrophage‐colony‐stimulating factor regulates expression of the integrins alpha 4 beta 1 and alpha 5 beta 1 by murine bone marrow macrophages. Proc. Natl. Acad. Sci. USA 92, 5179–5183. [DOI] [PMC free article] [PubMed] [Google Scholar]
- 26. Hynes, R. O. (2002) Integrins: bidirectional, allosteric signaling machines. Cell 110, 673–687. [DOI] [PubMed] [Google Scholar]
- 27. Busk, M. , Pytela, R. , Sheppard, D. (1992) Characterization of the integrin alpha v beta 6 as a fibronectin‐binding protein. J. Biol. Chem. 267, 5790–5796. [PubMed] [Google Scholar]
- 28. Sheppard, D. , Cohen, D. S. , Wang, A. , Busk, M. (1992) Transforming growth factor beta differentially regulates expression of integrin subunits in guinea pig airway epithelial cells. J. Biol. Chem. 267, 17409–17414. [PubMed] [Google Scholar]
- 29. Lambert, A. W. , Ozturk, S. , Thiagalingam, S. (2012) Integrin signaling in mammary epithelial cells and breast cancer. ISRN Oncol. 2012, 493283. [DOI] [PMC free article] [PubMed] [Google Scholar]