

Short abstract
Alcohol downregulates IRAK‐M, SHIP1, SOCS1, and IL‐10, inhibitors of TLR4 signaling, via NF‐κB‐induced miR‐155 and HDAC11 in Kupffer cells.
Keywords: miR‐155, IRAK‐M, TNF‐α, HDAC11, MyD88
Abstract
Inflammation promotes the progression of alcoholic liver disease. Alcohol sensitizes KCs to gut‐derived endotoxin (LPS); however, signaling pathways that perpetuate inflammation in alcoholic liver disease are only partially understood. We found that chronic alcohol feeding in mice induced miR‐155, an inflammatory miRNA in isolated KCs. We hypothesized that miR‐155 might increase the responsiveness of KCs to LPS via targeting the negative regulators of LPS signaling. Our results revealed that KCs that were isolated from alcohol‐fed mice showed a decrease in IRAK‐M, SHIP1, and PU.1, and an increase in TNF‐α levels. This was specific to KCs, as no significant differences were observed in these genes in hepatocytes. We found a causal effect of miR‐155 deficiency on LPS responsiveness, as KCs that were isolated from miR‐155 KO mice showed a greater induction of IRAK‐M, SHIP1, and suppressor of cytokine signaling 1 after LPS treatment. C/EBPβ, a validated miR‐155 target, stimulates IL‐10 transcription. We found a higher induction of C/EBPβ and IL‐10 in KCs that were isolated from miR‐155 KO mice after LPS treatment. Gain‐ and loss‐of‐function studies affirmed that alcohol‐induced miR‐155 directly regulates IRAK‐M, SHIP1, suppressor of cytokine signaling 1, and C/EBPβ, as miR‐155 inhibition increased and miR‐155 overexpression decreased these genes in LPS or alcohol‐pretreated wild‐type KCs. HDAC11, a regulator of IL‐10, was significantly increased and IL‐10 was decreased in KCs that were isolated from alcohol‐fed mice. Functionally, knockdown of HDAC11 with small interfering RNA resulted in an IL‐10 increase in LPS or alcohol‐pretreated Mϕ. We found that acetaldehyde and NF‐κB pathways regulate HDAC11 levels. Collectively, our results indicate that the alcohol‐induced responsiveness of KCs to LPS, in part, is governed by miR‐155 and HDAC11.
Abbreviations
- ALD
alcoholic liver disease
- ALDH
aldehyde dehydrogenase
- HDAC
histone deacetylase
- IRAK‐M
IL‐1 receptor–associated kinase
- KC
Kupffer cell
- KO
knockout
- miR
microRNA
- SEAP
secreted alkaline phosphatase
- SHIP1
phosphatidylinsolitol polyphosphate 5 phosphatase
- siRNA
small interfering RNA
- SOCS1
suppressor of cytokine signaling
- TRIF
Toll/IL–immune response domain–containing adaptor inducing IFN β
- UTR
untranslated region
- WT
wild type
Introduction
ALD is manifested in the form of steatosis and inflammation; inflammation is the major component of ALD. Among the many factors that contribute to the pathogenesis of ALD, gut‐derived LPS plays a central role in the initiation of steatosis, inflammation, and fibrosis in the liver [1, 2, 3–4]. At the cellular and molecular level, LPS is recognized by the TLR4 complex and induces specific intracellular activation pathways [5, 6–7]. TLR4 activation is fundamental for the development of immunity, and the role of LPS in ALD has been demonstrated in several studies [4, 5–6, 8, 9]. When excess amounts of LPS are not cleared efficiently by the liver and accumulate in blood circulation, innate immune cells, including KCs (liver Mϕ), become activated, which results in the release of various proinflammatory cytokines, chemokines, and other factors [5, 6–7]. Alcohol‐mediated responsiveness of KCs to gut‐derived LPS is a major component in the pathogenesis of ALD. On the basis of these studies, the currently accepted model of ALD is that KC activation by gut‐derived LPS leads to the induction of chemokines and the up‐regulation of the inflammatory cascade that represents an essential component of the pathomechanisms of ALD [6].
Ethanol changes the sensitivity of KCs to LPS and there is ample evidence that acute alcohol treatment results in immunosuppression and LPS tolerance [10, 11–12], whereas chronic alcohol exposure sensitizes KCs to LPS to promote inflammation [6, 11, 13]. An initial LPS exposure to second LPS was shown to lead to LPS tolerance that is a result of the induction of various negative regulators of the TLR4 pathway, such as IRAK‐M, SOCS1, SHIP, and ST2 [14, 15]. It has also been shown that TLR4/LPS tolerance can be lost because of a decreased expression of the negative regulators of TRL4 signaling [15, 16, 17, 18–19].
TLR4 activates two signaling pathways via the recruitment of adaptor molecules. Recruitment of the common TLR adaptor, MyD88, leads to rapid activation of NF‐κB and increased TNF‐α production, whereas recruitment of TRIF activates tank‐binding kinase 1/inhibitor of κB kinase‐∊ and IFN regulatory factor 3, which results in the production of type I IFNs and delayed NF‐κB activation [9].
The severity of the clinical outcome of acute alcoholic hepatitis and death correlates with serum levels of proinflammatory cytokines, particularly TNF‐α [20]; therefore, better understanding of the pathways that perpetuate and sustain inflammation in ALD is essential for designing interventions in this disease. Here, we hypothesized that chronic alcohol treatment inhibits the negative regulators of the TLR4 pathway by inducing the molecular signature of TLR4 tolerance via microRNA and histone modifications, thereby resulting in KC activation to an inflammatory phenotype.
In recent years, microRNAs have emerged as regulators of immune response via the targeting of multiple molecules of the TLRs pathway [14, 21, 22]. Among miRNAs, miR‐155 is widely studied and has been shown to be rapidly induced by LPS to promote inflammation by targeting SHIP1 [23, 24], SOCS1 [25], and TNF‐α [26]. Previously, we demonstrated that alcohol activates miR‐155 to induce inflammation in Mϕ [27], and miR‐155 KO mice showed protection from alcohol‐induced inflammation and steatosis [28]. Here, we hypothesized that alcohol‐induced miR‐155 inhibits negative regulators of the LPS/TLR4 pathways in KCs and, thus, promotes inflammation. There are a myriad of TLR regulators and, to be specific, in this study, we focused on miR‐155 target genes (SHIP1, SOCS1, and PU.1) that are known to be involved in inflammation and regulators of TLR4 signaling [23, 25, 29].
Our results indicate that miR‐155 was increased in isolated KCs and hepatocytes after an alcohol diet. Chronic alcohol diet caused a decrease in IRAK‐M, SHIP1, SOCS1, and PU.1 levels only in isolated KCs and but not in hepatocytes. KCs that were isolated from miR‐155–deficient mice showed a higher induction of negative regulators of the TLR4 pathway (IRAK‐M, SHIP1, and SOCS1) after LPS treatment. miR‐155 inhibition by using miR‐155 inhibitor oligonucleotide resulted in increases in IRAK‐M, SHIP1, SOCS1, and C/EBPβ, whereas overexpression of miR‐155 with miR‐155 mimic oligonucleotide caused decreases in IRAK‐M, SHIP1, SOCS1, and C/EBPβ in LPS or alcohol‐pretreated plus LPS‐challenged KCs.
KCs are the major sources of IL‐10—the most potent immunosuppressive cytokine [30]. Induction of IL‐10 from activated KCs can shift their function from immunity to tolerance and, thus, the loss of LPS sensitization [31]. Alcohol treatment was shown to have effect on histone modifications (HATs and HDACs) [32, 33–34]; however, the in vivo cell‐specific effects of alcohol on HDACs are not well defined. It was recently demonstrated that HDAC11 could negatively regulate the expression of IL‐10 in murine RAW264.7 Mϕ [35]. Here, we hypothesized that alcohol affects HDAC11 to regulate IL‐10 and promote responsiveness of KCs to LPS. We investigated the expression of various HDACs and found that chronic alcohol diet specifically increased HDAC11 in KCs and functionally regulated IL‐10 transcription.
MATERIALS AND METHODS
Animal studies and liver cells isolation
All animals received humane care in agreement with animal protocols approved by the Institutional Animal Care and Use Committee of the University of Massachusetts Medical School. C57BL/6J female mice (8 wk old) were divided into 2 groups, alcohol or control (pair) diet (n = 15 mice/group). Alcohol‐fed mice received the Lieber‐DeCarli diet (Bio‐Serv, Flemington, NJ, USA) with 5% (v/v) ethanol (32.4% alcohol‐derived calories) for 5 wk as described [27]. Pair‐fed control mice received an equal number of calories as alcohol‐fed mice, and alcohol‐derived calories were substituted with dextran‐maltose. miR‐155 KO mice were obtained from The Jackson Laboratory (Bar Harbor, ME, USA) and the colony was maintained in the animal facility at the University of Massachusetts Medical School. For KC isolation, mice were administered anesthesia with ketamine (100 mg/kg), followed by perfusion as previously described [27]. In brief, livers were perfused with saline solution for 10 min followed by in vivo digestion with liberase enzyme for 5 min. The perfused liver was placed in a petri dish that contained liberase enzyme, and cells were released by separating the liver lobes and were incubated at 37°C for 30 min for in vitro digestion as described [27]. Parenchymal cells were removed by centrifugation at low speed (200 g) at room temperature. Nonparenchymal cells were separated by percoll gradient and centrifuged for 25 min at 800 g at room temperature. The intercushion fraction was washed 3 times with PBS that contained 2% FBS at 4°C. Cells were plated in 12‐well plates and cultured in low‐glucose DMEM with 10% FBS. After 3–4 h of plating, nonadherent cells were washed with PBS 2 times and fresh medium was added. As a result of the limited number of KCs, cells from 3–4 mice were pooled. KCs were treated with or without LPS (100 ng/ml) for 6 h and harvested for RNA analysis. Cell‐free supernatant was collected and stored at −80°C for ELISA. For LPS sensitization experiment, KCs were isolated from chow‐fed WT or miR‐155 KO mice and treated with LPS (100 ng/ml) for 18 h. For TNF‐α treatment, KCs were isolated from chow‐fed WT mice and treated or not with TNF‐α (10 ng/ml) for 6 h.
For hepatocyte isolation, livers were perfused with saline solution for 10 min, followed by in vivo digestion with liberase enzyme for 5 min as described [36]. Perfused liver was placed in a petri dish and cells were released by separating liver lobes at room temperature. The suspension was centrifuged at low speed (200 g) for 5 min at room temperature. The pellet that contained hepatocytes was washed 2 times with PBS and cultured in low‐glucose DMEM medium (10% FBS + antibiotics) that contained insulin, transferrin, and selenium and placed on collagen‐coated 6‐well plates as described [36]. After 3–4 h of plating, nonadherent cells were removed and washed with 1× PBS for 2 times and fresh medium was added. On the next day, cells were treated or not with LPS (100 ng/ml) for 6 h and, at the end of treatment, cells were washed 2 times with PBS and lysed with Qiazole (Qiagen, Germantown, MD, USA), incubated at 4°C for 20 min on rocker, and stored at −80°C for further analysis.
Cell culture and reagents
RAW 264.7 Mϕ were cultured and maintained in Dulbecco's modified high‐glucose medium (Thermo Fisher Scientific, Waltham, MA, USA) that contained 10% FBS (HyClone Laboratories, Logan, UT, USA) at 37°C in a 5% CO2 atmosphere. Cells were either treated or not with 50 mM alcohol and incubated in a Billups‐Rothenburg chamber with twice the alcohol concentration in the bottom of the chamber to saturate the chamber and maintain a stable alcohol concentration (50 mM) as previously described [27]. LPS (Escherichia coli strain 0111:B4) was purchased from Sigma‐Aldrich (St. Louis, MO, USA). RAW 264.7 Mϕ were stimulated with LPS (100 ng/ml), 50 mM alcohol, or were pretreated with alcohol and then challenged with LPS at the times indicated in the figure legends.
RNA analysis
Total RNA was isolated with miRNeasy isolation kit (Qiagen). The quality and quantity of RNA were measured by Nanodrop. cDNA synthesis was carried out by using iScript kit (Bio‐Rad, Hercules, CA, USA) in an Eppendorf mastercycler (Eppendorf, Hamburg, Germany). Real‐time quantitative PCR was performed by using the iCycler (Bio‐Rad) as described and relative expression was calculated by using comparative threshold cycle (Ct) method [36]. Cq value for the target gene was normalized to 18S rRNA Cq and relative expression was calculated by ΔΔCt method [36]. Primer sequences of genes have been described previously [28]. For miRNA analysis, TaqMan miRNA assays were employed (Thermo Fisher Scientific) and snoRNA202 was used as a normalizer control [36].
ELISA
TNF‐α and IL‐10 were measured in cell‐free supernatants by ELISA kits according to manufacturer instructions (BD Biosciences, San Jose, CA, USA).
Transfection
For miR‐155 inhibition, KCs were transfected with either negative control miRNA or miR‐155–specific inhibitor at 50 nM (Applied Biosystems, Foster City, CA, USA) using RNAi max transfection reagent (Thermo Fisher Scientific) [27, 28]. For miR‐155 overexpression, KCs were transfected with either negative control or miR‐155–specific mimic at 5 nM (Applied Biosystems) using RNAi max transfection reagent (Thermo Fisher Scientific). Some cells were treated or not with 50 mM alcohol for 48 h. Some cells (naive or alcohol) were challenged with LPS (100 ng/ml) for the last 18 h of the experiment. For knockdown of HDAC11, RAW 264.7 Mϕ were transfected with either control or HDAC11 siRNA at 10 nM (Applied Biosystems) using RNAi max transfection reagent (Thermo Fisher Scientific) [10]. After transfection, cells were treated or not with 50 mM alcohol for 72 h. Some cells (naive or alcohol) were challenged with LPS (100 ng/ml) for the last 6 h of the experiment.
Dual‐luciferase gene reporter assay
Dual‐luciferase assay was performed according to manufacturer protocol (Genecopoeia, Rockville, MD, USA). In brief, a segment of the 3′‐UTR of IRAK‐M gene that contained the miR‐155 binding site (MmiT035717‐MT05; Genecopoeia) was cloned into a pEZX‐MT05 vector with Gaussia luciferase and SEAP reporter driven by a CMV promoter (Genecopoeia). Raw Mϕ were cotransfected with IRAK‐M 3′‐UTR target sequence expression plasmid (Genecopoeia) with either mmu‐miR‐155 mimic or miRNA mimic negative control (Thermo Fisher Scientific) using Lipofectamine RNAi‐max transfection reagent per manufacturer protocol (Thermo Fisher Scientific). After 24 h of transfection, medium was changed and cells were treated with either LPS (18 h before the end of experiment) or alcohol (48 h) or alcohol‐pretreated (30 h) and LPS (18 h)‐challenged cells. Both the Gaussia luciferase activity and internal control SEAP activity were determined 48 h post‐transfection in culture medium of the same samples by using Genecopoeia's Secrete‐Pair Dual Luminescence Assay Kit. This kit is designed to analyze the activities of Gaussia luciferase and SEAP in a dual‐reporter system. The activity ratio of Gaussia luciferase to SEAP was set to 100 for the control mimic transfected sample with expression vector against which the activity of the cotransfection sample was compared.
Western blot analysis
At the conclusion of the experiment, RAW Mϕ were washed twice with PBS and lysed in RIPA buffer that contained protease and phosphatase inhibitors [28]. The suspension was incubated on ice for 15 min, then centrifuged at 13,000 rpm for 10 min. Supernatants were stored at −80°C and used for SDS‐PAGE as described [28]. The following Abs were used: IRAK‐M (Millipore, Billerica, MA, USA), SHIP1 (Cell Signaling Technology, Danvers, MA, USA), and HDAC11 (Thermo Fisher Scientific). β‐Actin (Abcam, Cambridge, MA, USA) was used as loading control.
Alcohol metabolite inhibition assay
To determine the mechanism by which alcohol increases HDAC11/miR‐155 in Mϕ, we used various alcohol‐metabolizing inhibitors, cyanamide (an ALDH inhibitor), alcohol dehydrogenase inhibitor, 4‐methylpyrazole, ERK/MAPK inhibitor (PD98059), and MG‐132 (NF‐κB inhibitor) as described previously [37]. After 1 h of inhibitor treatment, cells were treated with or without alcohol (50 mM for 72 h). At the end of the experiment, cells were washed 2 times with 1× PBS and total RNA was extracted and analyzed for HDAC11 and miR‐155 expression by q‐RT PCR.
Statistical analysis
Data are presented as means ± se and statistical analysis was performed by using either Student's t test (2‐tailed) or Mann‐Whitney U test according to data distribution. P < 0.05 was considered significant.
RESULTS
KCs have decreased expression of negative regulators of the TLR4/LPS signaling pathway in ALD
Animal and human studies suggest that ALD is associated with increased endotoxin (LPS) levels in the portal and systemic circulation and that increased LPS contributes to alcoholic steatohepatitis [1, 2, 3–4]. LPS is a TLR4 ligand that initiates inflammatory cytokine activation in immune cells and has a wide range effects on various cell types in different organs [5, 38]. The effect of chronic alcohol feeding on the negative regulators of LPS signaling, such as IRAK‐M, SHIP1, and SOCS1, in liver Mϕ (KCs) is not well defined. We have previously shown that miR‐155 was induced by chronic alcohol in Mϕ both in vitro and in vivo [27]. miR‐155 promotes inflammation and is involved in M1 Mϕ phenotype [39]. In this study, we studied KCs from livers with ALD, which are characterized by liver steatosis, increased liver damage (alanine aminotransferase), and inflammation as previously described [27]. Here, we found that chronic alcohol diet increases miR‐155 in KCs and that an in vitro LPS challenge further augmented the alcohol‐induced increase in miR‐155 compared with KCs that were isolated from pair‐fed mice ( Fig. 1A ). We hypothesized that alcohol‐induced miR‐155 inhibits the negative regulators of the TLR4/LPS pathway in KCs, thereby promoting inflammation.
Figure 1.

KCs have decreased expression of the negative regulators of TLR4/LPS signaling in ALD. C57BL/6J WT mice (n = 15/group) were fed with Lieber DeCarli diet that contained either 5% ethanol or isocaloric control diet for 5 wk. At the end of the regimen, KCs were isolated and cultured in DMEM medium as indicated in Materials and Methods. The next day, cells were treated or not with LPS (100 ng/ml) for 6 h and harvested for RNA isolation, and cell‐free supernatant was used for ELISA. (A) Total RNA was used to quantify miR‐155 levels with TaqMan miRNA assay, and SnoRNA202 was used to normalize Cq values. (B–H) mRNA expression of IRAK‐M (B), SHIP1 (C), SOCS1 (D), PU.1 (E), C/EBPβ (F), MyD88 (G), and TRIF (H) was evaluated by quantitative PCR. 18S was used to normalize Cq values. (I) TNF‐α levels were determined from cell‐free supernatants with ELISA. KCs were isolated from chow‐fed WT mice and treated or not with TNF‐α (10 ng/ml) for 6 h, and total RNA was isolated. (J) Expression of miR‐155, IRAK‐M, SHIP1, SOCS1 and PU.1 was evaluated by quantitative PCR as indicated above. ns, nonsignificant. Data are presented as means ± sem. ∗P < 0.05 vs. KCs isolated from pair‐fed mice.
We found that KCs that were isolated from alcohol‐fed mice had a significant decrease in the expression in the levels of miR‐155 target genes, IRAK‐M (Fig. 1B), SHIP1 (Fig. 1C), and PU.1 (Fig. 1E), compared with KCs from pair‐fed mice (control KCs). An in vitro LPS treatment resulted in an additional significant decrease in SHIP1 mRNA expression in KCs that were isolated from alcohol‐fed mice compared with control KCs (Fig. 1C). SOCS1 levels displayed a nonsignificant decrease after alcohol diet (Fig. 1D). We also determined C/EBPβ levels—validated miR‐155 target gene—and found no significant difference in KCs that were isolated from mice with alcohol‐fed diet compared with pair‐fed controls, whereas in vitro LPS treatment significantly increased its levels in KCs that were isolated from mice fed with alcohol diet (Fig. 1F). TLR4 activates 2 signaling pathways via MyD88 and TRIF and activates NF‐κB differentially [9]; therefore, we investigated these TLR4‐regulated genes and found up‐regulation of MyD88 (Fig. 1G) but not TRIF (Fig. 1H) mRNA levels in KCs that were isolated from alcohol‐fed mice. LPS treatment further increased MyD88 (Fig. 1H) but not TRIF (Fig. 1I) mRNA levels in KCs that were isolated from pair‐fed or alcohol‐fed mice. We next assessed proinflammatory cytokine, TNF‐α, production. Compared with control KCs, a higher production of TNF‐α was detected in KCs of alcohol‐fed mice that were treated with or without LPS (Fig. 1I).
It has been previously shown that TNF‐α treatment induces miR‐155 levels [26]; therefore, we investigated the effect of TNF‐α on the expression of miR‐155 and the negative regulators of TLR4 signaling in KCs that were isolated from WT mice (chow‐fed mice). We found that TNF‐α treatment significantly increased miR‐155 levels but that there was a significant decrease in the levels of its target genes, IRAK‐M and SOCS1 mRNA (Fig. 1J). No significant change was observed in SHIP1 and PU.1 mRNA after TNF‐α treatment (Fig. 1J).
Hepatocytes exhibited an increase in MyD88 and TRIF mRNA levels in ALD
To confirm whether this phenomenon was specific to KCs, we isolated hepatocytes from mice that received the alcohol or pair‐fed diet for 5 wk. Chronic alcohol diet resulted in an induction of miR‐155 in isolated hepatocytes ( Fig. 2A ); however, no significant changes were observed in IRAK‐M (Fig. 2B), SHIP1 (Fig. 2C), SOCS1 (Fig. 2D), and PU.1 (Fig. 2E) mRNA levels (miR‐155 target genes) compared with hepatocytes that were isolated from pair‐fed mice, which suggested a cell‐specific regulation of the TLR4 signaling inhibitory genes in KCs. Our results indicated that in vitro LPS treatment caused a significant increase in miR‐155 levels in pair‐ or alcohol‐fed mice (Fig. 2A), and a significant decrease in SHIP1 mRNA levels was detected in hepatocytes that were isolated from pair‐fed but not alcohol‐fed mice (Fig. 2C), with a significant increase also in SOCS1 levels in hepatocytes that were isolated from either pair‐fed or alcohol‐fed mice (Fig. 2D). No significant changes were observed in IRAK‐M and PU.1 after LPS treatment in hepatocytes that were isolated from either control or alcohol‐fed mice. We also checked other TLR4‐regulated genes, MyD88 and TRIF, and found significant increases in MyD88 (Fig. 2F) and TRIF (Fig. 2G) mRNA levels in hepatocytes that were isolated from alcohol‐fed mice compared with control mice. We detected a further significant increase in MyD88 and TRIF (Fig. 2F and G) mRNA levels after in vitro LPS treatment in hepatocytes that were isolated from pair‐fed and alcohol‐fed mice. TRIF levels were further increased by LPS in hepatocytes that were isolated from alcohol‐fed mice (Fig. 2G). We next evaluated protein levels of IL‐10 and found that LPS treatment induced IL‐10 levels to a similar extent in hepatocytes that were isolated from either control or alcohol‐fed mice (Fig. 2H).
Figure 2.
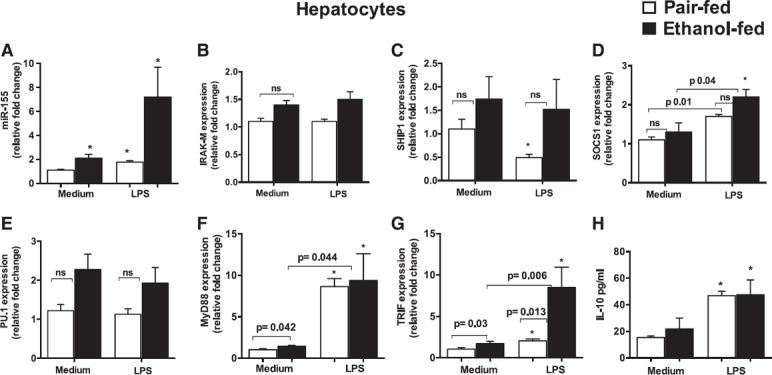
Hepatocytes exhibited an increase in MyD88 and TRIF mRNA levels in ALD. C57BL/6J WT mice (n = 8/group) were fed with Lieber DeCarli diet that contained either 5% ethanol or isocaloric control diet for 5 wk. At the end of the regimen, hepatocytes were isolated and cultured in low‐glucose DMEM medium as described in Materials and Methods. The next day, cells were treated or not with LPS (100 ng/ml) for 6 h and harvested for RNA isolation. (A) Total RNA was used to quantify miR‐155 levels with TaqMan miRNA assay, and SnoRNA202 was used to normalize Cq values. (B–G) Expression of IRAK‐M (B), SHIP1 (C), SOCS1 (D), PU.1 (E), MyD88 (F), and TRIF (G) was evaluated by quantitative PCR. 18S was used to normalize Cq values. (H) IL‐10 protein levels were determined from cell‐free supernatants with ELISA. ns, nonsignificant. Data are presented as means ± sem. ∗P < 0.05 vs. hepatocytes isolated from pair‐fed mice.
miR‐155–deficient KCs respond to LPS with robust induction of the negative regulators of the TLR4 pathway/signaling
Our results indicate that negative regulators of the LPS/TLR4 pathway (IRAK‐M and SHIP1) were decreased and miR‐155 was increased in KCs that were isolated from alcohol‐fed mice (Fig. 1). miR‐155 was shown to promote inflammation via modulation of SHIP1 and SOCS1 in other disease models [23, 25]. To determine the effect of miR‐155 deficiency on these genes, we isolated KCs from WT and miR‐155 KO mice and treated them with or without LPS for 18 h. In LPS‐challenged KCs, we found a greater induction of IRAK‐M ( Fig. 3A ) and SOCS1 (Fig. 3C) in KCs from miR‐155 KO mice compared with WT‐KCs (KCs isolated from WT mice). LPS treatment caused a significant decrease in SHIP1 mRNA levels in WT‐KCs, and this decrease was prevented in KCs that were isolated from miR‐155 KO mice (Fig. 3B). These results suggest that miR‐155 deficiency in KCs caused an anti‐inflammatory phenotype.
Figure 3.
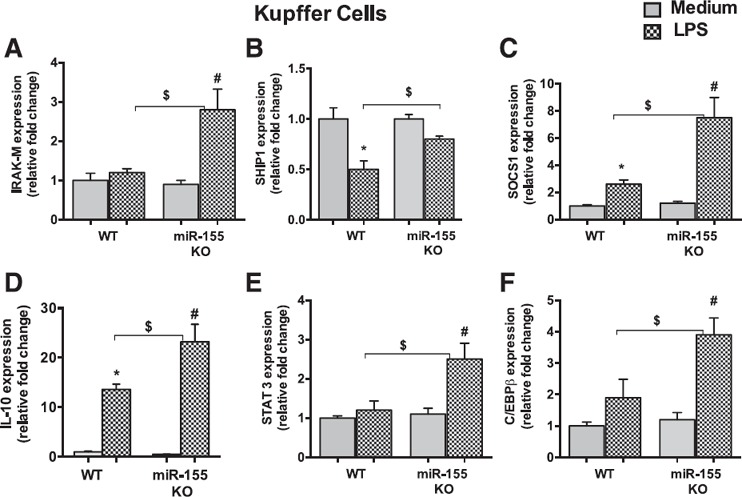
miR‐155–deficient KCs respond to LPS with robust induction of the negative regulators of TLR4 pathway/signaling. KCs were isolated from WT or miR‐155 KO mice (n = 6) and treated with or without LPS (100 ng/ml) for 18 h. (A–F) Total RNA was isolated and evaluated for IRAK‐M (A), SHIP1 (B), SOCS1 (C), IL‐10 (D), STAT3 (E), and C/EBPβ (F) levels. 18S was used to normalize Cq values. Data are presented as means ± sem. ∗P < 0.05 vs. KCs isolated from WT mice; # P < 0.05 vs. KCs isolated from miR‐155 KO mice; $ P < 0.05 vs. KCs isolated from WT mice treated with LPS.
Release of IL‐10 and the subsequent induction of sustained activation of STAT3 are critical anti‐inflammatory feedback mechanisms in Mϕ after LPS treatment [40, 41–42]. We found a significantly higher induction of IL‐10 (Fig. 3D) and STAT3—a well‐known miR‐155 target gene (Fig. 3E)—in KCs that were isolated from miR‐155 KO mice compared with WT‐KCs after LPS treatment. miR‐155 does not have a direct binding site at the 3′‐UTR of the IL‐10 gene; therefore, to find the possible mechanism by which miR‐155 affects IL‐10, we searched for miR‐155 direct target genes that may regulate IL‐10. It has been shown that the transcription factor, C/EBPβ, binds to the IL‐10 promoter and stimulates its transcription [43]. C/EBPβ is a validated target of miR‐155 [44]. We hypothesized that the increased production of IL‐10 in miR‐155 KO‐KCs is a result of an increase in C/EBPβ levels. Consistent with our hypothesis, we found significantly increased induction of C/EBPβ in KCs that were isolated from miR‐155 KO mice compared with WT‐KCs after LPS treatment (Fig. 3F). Surprisingly, no significant differences were observed in TNF‐α gene expression between genotypes (Supplemental Fig. 1A). These results suggest that miR‐155 promotes sensitization to LPS via the regulation of various genes of the TLR4 pathway and accelerates inflammation.
miR‐155 regulates negative regulators of TLR4 signaling after LPS or alcohol pretreatment
To test for gain and loss of miR‐155 function, we carried out mechanistic studies in KCs that were isolated from WT mice by using a specific inhibitor or mimic of miR‐155. We found that transfection of the miR‐155 mimic caused a significant increase in miR‐155 levels and that the miR‐155 inhibitor significantly reduced miR‐155 levels in KCs (Supplemental Fig. 1B). Our results indicate that miR‐155 inhibition caused an increase in IRAK‐M, SHIP1, SOCS1, and C/EBPβ levels in LPS or alcohol‐pretreated, LPS‐challenged cells ( Fig. 4A–D ). In contrast, overexpression of miR‐155 caused a significant decrease in IRAK‐M, SHIP1, SOCS1, and C/EBPβ levels in LPS or alcohol‐pretreated, LPS‐challenged cells (Fig. 4A–D). We found that LPS treatment resulted in an increase in IRAK‐M, SHIP1, and C/EBPβ levels in KCs that were transfected with a negative control inhibitor, and this increase was further significantly augmented in KCs that were transfected with an miR‐155 inhibitor (Fig. 4A–D). Compared with negative control mimic‐transfected KCs, miR‐155 overexpression resulted in a significant decrease in the LPS‐induced increases in IRAK‐M (Fig. 4A), SHIP1 (Fig. 4B), and C/EBPβ (Fig. 4D) levels. miR‐155 overexpression in alcohol‐treated KCs resulted in a significant decrease in IRAK‐M (Fig. 4A) and SOCS1 (Fig. 4C) levels compared with control mimic‐transfected KCs. Alcohol pretreatment for 30 h significantly decreased LPS‐induced increases in IRAK‐M (Fig. 4A) and SHIP1 levels (Fig. 4B). miR‐155 inhibition in alcohol‐pretreated, LPS‐challenged KCs resulted in a significant increase in IRAK‐M (Fig. 4A), SHIP1 (Fig. 4B), SOCS1 (Fig. 4C), and C/EBPβ (Fig. 4D) levels compared with control inhibitor, whereas overexpression of the miR‐155 mimic resulted in a significant decrease in these genes (Fig. 4A–D). Consistent with our previous finding that miR‐155 regulates TNF‐α [27], we found that the inhibition of miR‐155 led to a decrease in TNF‐α protein levels and that overexpression of miR‐155 resulted in an increase in TNF‐α protein levels in LPS or alcohol‐pretreated, LPS‐challenged KCs (Fig. 4E).
Figure 4.

miR‐155 regulates the negative regulators of TLR4 signaling in KCs after alcohol or LPS treatment. miR‐155 expression was either inhibited or overexpressed by using miR‐155 inhibitor (50 nM) or miR‐155 mimic (5 nM), respectively, in KCs that were isolated from WT mice (n = 6). Some cells were treated with alcohol (AL; 50 mM) for 48 h. After 2 d of transfection, some cells [naive or alcohol (30 h)] were treated with LPS (100 ng/ml) for the last 18 h of the experiment. (A–D) Total RNA was extracted and assesssed for IRAK‐M (A), SHIP1 (B), SOCS1 (C), and C/EBPβ (D). 18S was used to normalize Cq values. (E) TNF‐α protein levels were determined from cell‐free supernatants with ELISA. (F) For IRAK‐M 3′‐UTR assay, Gaussia luciferase dual‐reporter assay was performed per manufacturer protocol and data are presented as ratio between SEAP and Gaussia luciferase. RAW Mϕ were either transfected with control or miR‐155 mimic (5 nM) and treated with or without LPS (18 h), ethanol (48 h), or pretreated with ethanol (30 h) and challenged with LPS (18 h). After 48 h of transfection, cells were harvested and lysed with RIPA buffer that contained protease and phosphatase inhibitors. (G and H) Whole‐cell lysate was used for Western blot analysis to detect IRAK‐M (G) and SHIP1 (H) protein levels. β‐Actin was used as loading control. Data are presented as means ± sem. ∗P < 0.05 vs. KCs treated with either lipofectamine or control miRNA inhibitor; # P < 0.05 between LPS and AL + LPS‐treated KCs.
IRAK‐M is a direct target of miR‐155 in Mϕ
To confirm that, indeed, miR‐155 directly targets IRAK‐M, we carried out the 3′‐UTR reporter assay in Mϕ. Dual‐luciferase reporter assay was performed to test the interaction of miR‐155 and its targeting sequence in the IRAK‐M 3′‐UTR by using constructs that contained the predicted targeting sequence (vector + mimic miR‐155). Our results show that miR‐155 mimic transfection suppressed the luciferase activity of the GLuc–IRAK‐M–3′‐UTR clone by more than 30% in control, LPS, alcohol, or alcohol‐pretreated, LPS‐challenged Mϕ (Fig. 4F). We also assessed IRAK‐M and SHIP1 protein levels after miR‐155 overexpression in RAW Mϕ (Fig. 4G and H) and found that miR‐155–overexpressed cells demonstrated a decrease in IRAK‐M (Fig. 4G) or SHIP1 (Fig. 4H) protein levels in naive, LPS, or alcohol‐treated Mϕ (Fig. 4G and H). No significant changes were found in alcohol‐pretreated, LPS‐challenged cells. These various mechanistic studies signify a role for miR‐155 in the alcohol‐induced sensitization of KCs to LPS, at least in part, via regulation of these negative regulators of TLR4 signaling.
Chronic alcohol‐induced HDAC11 promotes the LPS responsiveness of Mϕ via regulation of IL‐10
KCs are the major source of IL‐10, the most potent immunosuppressive cytokine [30]. Because we found an increase in TNF‐α levels in KCs after alcohol diet, we evaluated the gene levels of IL‐10 and found that KCs that were isolated from alcohol‐fed mice showed a decrease in IL‐10 mRNA expression ( Fig. 5A ). LPS treatment increased IL‐10 gene expression in KCs from pair‐fed mice, and a significant attenuation in LPS‐induced IL‐10 was observed in KCs from alcohol‐fed mice (Fig. 5A). IL‐10 gene transcription is regulated by various factors, and, recently, HDAC11 was shown to negatively regulate the gene expression of IL‐10 in murine RAW 264.7 Mϕ [35]. Thus, we hypothesized that alcohol affects HDAC11 to regulate IL‐10 gene transcription and promote the sensitization of KCs to LPS. We next investigated HDAC11 levels and found that alcohol diet significantly increased HDAC11 mRNA levels in KCs (Fig. 5B). Furthermore, LPS treatment significantly decreased HDAC11 expression in KCs that were isolated from pair‐fed mice, whereas a significant increase in HDAC11 expression was still observed in KCs from alcohol‐fed mice after LPS treatment (Fig. 5B). Our results suggest that alcohol specifically induces HDAC11, as gene levels of other HDACs, such as HDAC1, were either decreased (Fig. 5C) or not effected (HDAC3) in KCs (Fig. 5D). We also found that alcohol induces HDAC11 mRNA levels in KCs and not in hepatocytes that were isolated from alcohol‐fed mice (Fig. 5E).
Figure 5.
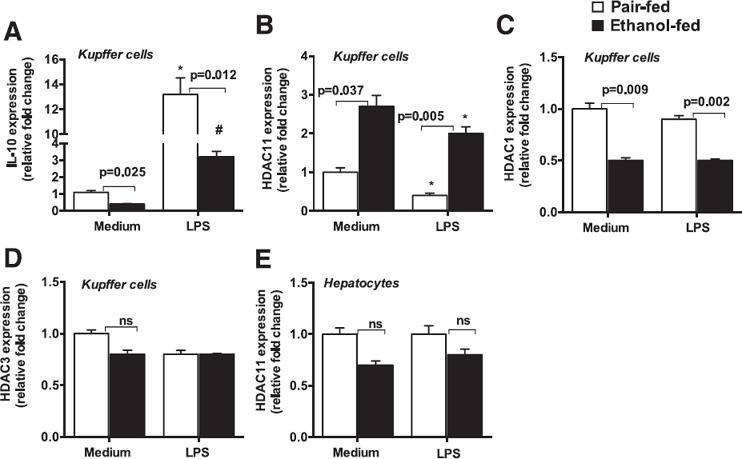
Chronic alcohol diet induces HDAC11 in KCs. C57BL/6J WT mice (n = 15/group) were fed with Lieber DeCarli diet that contained either 5% ethanol or isocaloric control diet for 5 wk. At the end of the regimen, KCs were isolated and cultured in DMEM medium as described in Materials and Methods. The next day, cells were treated or not with LPS (100 ng/ml) for 6 h and harvested for RNA isolation. (A–D) Expression of IL‐10 (A), HDAC11 (B), HDAC1 (C), and HDAC3 (D) was determined by quantitative PCR. (E) Hepatocytes were isolated as described in Materials and Methods and levels of HDAC11 mRNA were evaluated by quantitative PCR. 18S was used to normalize Cq values. ns, nonsignificant. Data are presented as means ± sem. ∗,# P < 0.05 vs. KCs isolated from pair‐fed (PF) mice (A and B).
To determine the functional role of HDAC11 in ALD, we knocked down HDAC11 by using an siRNA approach in RAW 264.7 Mϕ ( Fig. 6A ). We found the cells that were treated with HDAC11 siRNA showed significant reduction at the mRNA (Fig. 6A) and protein levels (Fig. 6B) of HDAC11. Our results reveal that knockdown of HDAC11 by using specific siRNA resulted in an increase in IL‐10 gene transcription in naive, LPS, alcohol, or alcohol‐pretreated, LPS‐challenged RAW cells compared with control siRNA‐treated cells (Fig. 6C). As a consequence of the increase in IL‐10 transcription in HDAC11 siRNA‐treated cells, we found a reduction in TNF‐α protein levels in LPS or alcohol‐pretreated, LPS‐challenged RAW cells (Fig. 6D). These results suggest that HDAC11 also plays a role in the alcohol‐induced sensitization of Mϕ to LPS via IL‐10 regulation/inhibition.
Figure 6.

HDAC11 regulates IL‐10 and promotes LPS responsiveness of alcohol‐treated Mϕ. For HDAC11 knockdown, RAW 264.7 Mϕ (n = 4) were transfected with either control or HDAC11 siRNA (10 nM) by using RNAi max transfection reagent for 48 h. Cells were treated with either LPS (100 ng/ml for 6 h), alcohol (AL; 50 mM for 48 h), or alcohol‐pretreated and challenged with LPS [AL (40 h) + LPS (6 h before the end of the experiment)]. Cells were harvested for RNA and protein analyses. (A and B) HDAC11 mRNA (A) and protein (B) levels were detected by quantitative PCR and Western blot analyses, respectively. (C) IL‐10 mRNA levels were determined by using quantitative PCR. (D) Cell‐free supernatant was assessed for TNF‐α protein production. (E and F) RAW cells were treated with various alcohol‐metabolizing inhibitors, cyanamide (an ALDH inhibitor), alcohol dehydrogenase (ADH) inhibitor, 4‐methylpyrazole (4‐MP), ERK/MAPK inhibitor (PD98059), and MG‐132 (NF‐κB inhibitor) for 1 h. After 1 h of inhibitor treatment, cells were treated with or without alcohol (50 mM) for 72 h. Cells were washed with PBS and harvested and total RNA was analyzed for HDAC11 (E) and miR‐155 expression (F) by real time quantitative PCR. For mRNA or miRNA analysis, 18S or SnoRNA202, respectively, was used to normalize Cq values. Data are presented as means ± sem. ∗P < 0.05 vs. medium or control siRNA treated RAW Mϕ (G and H); $ P < 0.05 vs. LPS‐treated RAW Mϕ.
Next, to determine the mechanism by which alcohol regulates HDAC11 and miR‐155, we used various alcohol‐metabolizing inhibitors. Acetaldehyde is metabolized to acetate by the ALDH enzyme, and we found that cyanamide (an ALDH inhibitor), and MG‐132 (an NF‐κB inhibitor) treatment caused a significant decrease in alcohol‐induced HDAC11 levels in Mϕ (Fig. 6E). Alcohol dehydrogenase inhibitor, 4‐methylpyrazole, and ERK/MAPK inhibitor (PD98059) showed no significant effect on alcohol‐induced HDAC11 mRNA levels (Fig. 6E). These results suggested that acetaldehyde and NF‐κB regulate HDAC11 mRNA levels. Consistent with our previous findings [27], we observed that only MG‐132 (the NF‐κB inhibitor) had a significant effect on alcohol‐induced miR‐155 levels (Fig. 6F).
DISCUSSION
Inflammation is a central component in ALD. TLR4 is the major pathogen recognition receptor that is involved in the detection of gram‐negative bacteria and associated endotoxins (eg, LPS and lipid A) [5, 6–7]. Gut leakiness by alcohol triggers LPS release into the circulation. The importance of gut‐derived LPS in ALD has been demonstrated by several independent studies in which treating mice either with antibiotics or with lactobacilli to remove or reduce gut microflora provided protection from ALD [45, 46]. Continuous LPS exposure can lead to the activation of KCs, which results in the production of proinflammatory cytokines and chemokines, thereby promoting inflammation. The duration of ethanol exposure changes the sensitivity of KCs and monocytes to LPS. Acute ethanol treatment induces tolerance, whereas longer and/or prolonged ethanol treatment results in the sensitization of KCs and monocytes to LPS [11, 47]; however, the precise mechanism by which chronic alcohol brings about the switch from tolerance to sensitization in KC plasticity is not well known. Here, we show that alcohol modulates various negative regulators of the TLR4 pathway by affecting miR‐155 and HDAC11 to sensitize KCs to LPS and promote inflammation. We found that KCs that were isolated from alcohol‐fed mice demonstrated a decrease in IRAK‐M, SHIP1, and PU.1—the negative regulators of the LPS/TLR4 pathway—and an increase in TNF‐α production. We demonstrate that miR‐155, an inflammation‐promoting miRNA, was increased after alcohol diet in isolated KCs. Functionally, we showed that IRAK‐M is a direct target of miR‐155 in KCs and the miR‐155 regulates SHIP1, SOCS1, and C/EBPβ in the alcohol‐induced sensitization of KCs to LPS. Furthermore, we show that alcohol affects HDAC11 to regulate IL‐10 gene transcription in KCs and functionally provide the evidence of a role for HDAC11 in ALD.
The sensitization of monocytes/Mϕ to LPS to induce immune cell activation has a biologic and clinical significance. Immune cell activation is a well‐established phenomenon in alcoholic patients, and several studies suggest that patients with alcoholic hepatitis exhibited increased LPS levels in the circulation [48, 49–50].
Both TLR4/LPS tolerance and the sensitization of monocytes/Mϕ are associated with molecular signatures of the TLR4 pathway. LPS tolerance via the TLR4 pathway has been shown to induce various negative regulators, such as IRAK‐M, ST2, SOCS1, short version of MyD88 [51], and SHIPs [52]. These regulators inhibit TLR‐mediated signaling and, thus, switch Mϕ to an immunosuppressive, LPS‐tolerant phenotype. The interplay of signaling molecules and transcription factors can reverse the Mϕ phenotype from activation to immunosuppressive/tolerant and vice versa [53].
Acute and chronic alcohol exposure have differential effects on the TLR4 pathway. In previous studies, we have shown that acute alcohol treatment induces TLR4 tolerance via activation of various negative regulators, such as IRAK‐M, Bcl‐3, SOCS1, and IL‐10, and down‐regulation of NF‐κB and TNF‐α in human monocytes/Mϕ [10, 11–12]. Here, we show that prolonged alcohol exposure results in the loss of expression of the negative regulator molecules of TLR signaling via miR‐155 in KCs.
We observed only significant decreases in SHIP1 levels after an in vitro LPS treatment, but not for other miR‐155 target genes (IRAK‐M, SOCS1, and PU.1). It is possible that LPS treatment in alcohol‐fed KCs had an effect on other signaling molecules/pathways independent of miR‐155, and, hence, the increase of miR‐155 had no further effect on these genes. In addition, it is possible that the duration of LPS treatment has different kinetic effects on these genes and we have only one treatment point. Chronic alcohol‐mediated sensitization of KCs to gut‐derived LPS is a major component in the pathogenesis of ALD [3, 7]. miR‐155 is a central regulator of immune responses, and various studies have provided evidence that miR‐155 promotes inflammation by regulating various genes of the TLR4 signaling pathway, such as SOCS1, SHIP,1 TNF‐α, and STAT3 [23, 24, 25–26, 54]. miR‐155 has also been implicated in various inflammation‐related diseases, such as autoimmune inflammation [55], atherosclerosis [56], or cancers [57]. Recently, we demonstrated a role for miR‐155 in alcoholic‐ and nonalcoholic‐induced steatohepatitis [28, 58]. In agreement with a role for miR‐155 in the promotion of inflammation, we found, in this study, a higher induction of the negative regulator of LPS/TLR4 signaling (IRAK‐M, SHIP1, and SOCS1) in miR‐155–deficient KCs after in vitro LPS challenge. In contrast to LPS challenge, we found different kinetic effects for the negative regulator of LPS/TLR4 signaling after TNF‐α treatment in KCs that were isolated from WT mice (chow‐fed diet; Fig. 1J). TNF‐α treatment caused a significant increase in miR‐155 level, a subsequent significant decrease in IRAK‐M and SOCS1 mRNA levels, but no significant changes in mRNA levels of SHIP1 and PU.1. In contrast, LPS treatment caused a significant decrease in SHIP1, an increase in SOCS1 level, but no significant changes in IRAK‐M mRNA level. Our observations suggest that the negative regulators of LPS/TLR4 signaling respond differently to diverse stimuli.
IL‐10 is an important mediator of anti‐inflammatory activities and is a general suppressive cytokine that regulates and represses the production of various proinflammatory cytokines, including TNF‐α [30]. STAT3 is also crucial for the transmission of anti‐inflammatory signals in Mϕ to overcome endotoxic shock. Sensitization toward LPS and IL‐10 mediates the sustained activation of STAT3 to mediate anti‐inflammatory effects [40, 53]. Consistent with these findings, we observed a higher increase in IL‐10 and STAT3 (miR‐155 validated target gene) in miR‐155–deficient KCs after LPS challenge, which suggests that the absence of miR‐155 in KCs causes anti‐inflammatory effects. We also provided the evidence that increased production of IL‐10 in miR‐155–deficient KCs after LPS challenge was a result of the effect of miR‐155 its target gene, C/EBPβ transcription factor [43]. It has been shown previously that C/EBPβ, via binding to the IL‐10 promoter, increases its transcription [43], and we found increased C/EBPβ gene levels in KCs that were isolated from miR‐155 KO mice. Remarkably, no significant differences were found in TNF‐α gene expression in KCs that were isolated from WT or miR‐155 KO mice after in vitro LPS challenge. This could be a result of either the impairment in signaling pathways in miR‐155 KO mice or because miR‐155 KO‐KCs respond differently after in vitro LPS challenge than in in vivo conditions.
Our loss‐ and gain‐of function studies also revealed that miR‐155 regulates the sensitization of KCs to LPS. miR‐155 inhibition caused an increase, whereas overexpression of miR‐155 resulted in a decrease in IRAK‐M, SHIP1, SOCS1, and C/EBPβ levels in KCs that were treated either with LPS or alcohol‐pretreated, LPS‐challenged cells. Our results also revealed that miR‐155 regulates IRAK‐M and SHIP1 at the protein level. Furthermore, dual‐reporter luciferase assay confirmed that IRAK‐M is a direct target of miR‐155 in Mϕ. Of note, we did not observe appreciable changes in C/EBPβ mRNA after miR‐155 inhibition in alcohol only–treated cells. We also did not find any significant changes at the protein level for IRAK‐M and SHIP1 in alcohol‐pretreated, LPS‐challenged Mϕ; however, there were appreciable changes at the protein levels of IRAK‐M and SHIP1 in naive, LPS, or alcohol‐treated Mϕ. This could be a result of the fact that alcohol‐ and LPS‐treated cells had already reached saturation and miR‐155 overexpression had no additional effect at the protein level of these genes. Consistent with our previous findings [27], here we found miR‐155 regulates TNF‐α positively as miR‐155 inhibition caused a decrease, whereas miR‐155 overexpression resulted in a significant increase in TNF‐α protein levels. On the basis of these results, we propose that alcohol‐induced miR‐155 modulates IRAK‐M, SHIP1, SOCS1, and C/EBPβ levels to regulate KC sensitization to LPS. KC activation has been identified as one of the key elements in the pathogenesis of alcoholic steatohepatitis, and our results signify the role of miR‐155 in KCs to promote inflammation.
Although we observed an increase of miR‐155 in hepatocytes that were isolated from alcohol‐fed mice, no significant differences were found in genes that are involved in LPS/TRL4 signaling, which suggests that miR‐155 has a functional role in regulating these genes in KCs. Recently, we have shown that in hepatocytes miR‐155 regulate fat accumulation by targeting PPRE (PPAR response element) signaling [28], which suggests a cell‐specific effect for miR‐155. PU.1 is a miR‐155 target [29] and is important in regulating monocyte‐to‐macrophage differentiation. Recently, a role for PU.1 in promoting an alternative Mϕ phenotype was demonstrated [59], and our results revealed a decrease in PU.1 in KCs after alcohol diet. In addition, we recently showed that miR‐155 levels were decreased in KCs under M2 polarizing conditions [28], which affirmed a role for miR‐155 in promoting inflammation in ALD.
TLR4‐mediated responses are regulated by two adaptor proteins, MyD88 and TRIF. A recent study revealed that TRIF promotes hepatic steatosis but inhibits injury in diet‐induced steatohepatitis, which suggests that the TRIF pathway contributes to hepatic steatosis, but negatively regulates hepatic injury, inflammation, and fibrosis [60]. Our results revealed greater changes in the mRNA levels of MyD88 and TRIF in hepatocytes than in KCs after alcohol diet. Furthermore, in vitro LPS treatment augmented TRIF mRNA levels in hepatocytes that were isolated from alcohol‐fed mice. Our results also revealed increased production of IL‐10 protein in hepatocytes that were isolated from alcohol‐fed mice. The cell‐specific roles of TRIF and MyD88 require additional investigation in ALD. Although we observed an increase in miR‐155 in hepatocytes, we did not find any significant changes in other TLR4 regulators—IRAK‐M, SHIP1, SOCS1, and PU.1—in hepatocytes after alcohol diet. This could be due to the fact that miR‐155 regulation of its target genes is cell and stimuli specific. In KCs. it promotes inflammation by regulating TLR4 signaling genes. Recently, we have shown that miR‐155 in hepatocytes promotes fat accumulation by targeting peroxisome proliferator‐activated receptor (PPAR) signaling [28]. It has been shown previously that LPS treatment of hepatocytes increased SOCS1 levels, and it has been suggested that hepatocytes are desensitized by LPS in a TLR4 signaling–dependent manner [61]. Consistently, we also found a significant increase in SOCS1 in hepatocytes that were isolated from pair‐fed or alcohol‐fed mice after LPS treatment (Fig. 2D); however, there was no significant difference in SOCS1 mRNA expression between naive and alcohol‐fed hepatocytes.
Our current study was focused on liver resident Mϕ. Consistent with our results, it has been previously shown that bone marrow–derived Mϕ, when treated in vitro with alcohol (0, 25 or 50 mM) for 5 d followed by 6 h of stimulation with LPS, demonstrated increases in TNF‐α, MIP‐1α, MIP‐2, and KCs [62]. This study further supports our notion that alcohol pretreatment sensitizes cells to an LPS challenge.
In recent years, the effect of alcohol on histone modifications (HATs and HDACs) has been revealed [32, 33–34]; however, the in vivo cell‐specific effect of alcohol on HDACs is not well defined. Our results suggest that chronic alcohol feeding specifically induces the expression of only HDAC11 and not that of other HDACs in KCs. In addition, the effect of alcohol on HDAC11 was specific to KCs as no significant change in HDAC11 was found in hepatocytes. HDAC11 is shown to negatively regulate IL‐10 to limit its transcription in RAW 264.7 Mϕ [35]. In our study, we found increased HDAC11 and decreased IL‐10 transcription in KCs that were isolated from alcohol‐fed mice. The relationship of HDAC11 and IL‐10 in the context of ALD was further validated in our functional studies, as knocking down HDAC11 with siRNA resulted in an increase in IL‐10 transcription in alcohol‐pretreated, LPS‐challenged RAW Mϕ. Our results also revealed that HDAC11 expression is modulated by alcohol metabolites (an ALDH) and the NF‐κB pathway.
In summary, on the basis of the results of this study, we provide various evidence that chronic alcohol modulates miRNA‐155 and HDAC11 to increase LPS responsiveness in KCs ( Fig. 7 ).
Figure 7.

Summary diagram. Alcohol or its metabolites (acetaldehyde) induce miR‐155 and HDAC11 in KCs by the NF‐κB pathway and down‐regulates TLR4 negative regulators. miR‐155 mimics and inhibitor reciprocally regulated TLR4 regulators (IRAK‐M, SHIP1, SOCS1, and C/EBPβ) in KCs. Knockdown of HDAC11 with siRNA decreased IL‐10 levels, which resulted in an increase in TNF‐α levels. Together, these pathways promote inflammation in ALD.
AUTHORSHIP
S.B. and G.S. conceived the idea and designed and interpreted the results. S.B., K.K., and D.C. performed the experiments. T.C., A.A., I.F., P.L., Y.C., and A.I.‐V. helped in mouse experiments. S.B. analyzed the data. S.B. and G.S. wrote the paper. All authors read and approved the final manuscript.
DISCLOSURES
The authors declare no conflicts of interest.
Supporting information
Supplementary Material Files
Supplementary Material Files
ACKNOWLEDGMENTS
This work was supported by U.S. National Institutes of Health, National Institute on Alcohol Abuse and Alcoholism Grant AA011576 (to G.S.).
REFERENCES
- 1. Bala, S. , Marcos, M. , Gattu, A. , Catalano, D. , Szabo, G. (2014) Acute binge drinking increases serum endotoxin and bacterial DNA levels in healthy individuals. PLoS One 9, e96864. [DOI] [PMC free article] [PubMed] [Google Scholar]
- 2. Lippai, D. , Bala, S. , Catalano, D. , Kodys, K. , Szabo, G. (2014) Micro‐RNA‐155 deficiency prevents alcohol‐induced serum endotoxin increase and small bowel inflammation in mice. Alcohol. Clin. Exp. Res. 38, 2217–2224. [DOI] [PMC free article] [PubMed] [Google Scholar]
- 3. Keshavarzian, A. , Farhadi, A. , Forsyth, C. B. , Rangan, J. , Jakate, S. , Shaikh, M. , Banan, A. , Fields, J. Z. (2009) Evidence that chronic alcohol exposure promotes intestinal oxidative stress, intestinal hyperpermeability and endotoxemia prior to development of alcoholic steatohepatitis in rats. J. Hepatol. 50, 538–547. [DOI] [PMC free article] [PubMed] [Google Scholar]
- 4. Mutlu, E. , Keshavarzian, A. , Engen, P. , Forsyth, C. B. , Sikaroodi, M. , Gillevet, P. (2009) Intestinal dysbiosis: a possible mechanism of alcohol‐induced endotoxemia and alcoholic steatohepatitis in rats. Alcohol. Clin. Exp. Res. 33, 1836–1846. [DOI] [PMC free article] [PubMed] [Google Scholar]
- 5. Szabo, G. , Petrasek, J. , Bala, S. (2012) Innate immunity and alcoholic liver disease. Dig. Dis. 30 (Suppl 1), 55–60. [DOI] [PMC free article] [PubMed] [Google Scholar]
- 6. Gao, B. , Seki, E. , Brenner, D. A. , Friedman, S. , Cohen, J. I. , Nagy, L. , Szabo, G. , Zakhari, S. (2011) Innate immunity in alcoholic liver disease. Am. J. Physiol. Gastrointest. Liver Physiol. 300, G516–G525. [DOI] [PMC free article] [PubMed] [Google Scholar]
- 7. Szabo, G. , Bala, S. (2010) Alcoholic liver disease and the gut‐liver axis. World J. Gastroenterol. 16, 1321–1329. [DOI] [PMC free article] [PubMed] [Google Scholar]
- 8. Yan, A. W. , Fouts, D. E. , Brandl, J. , Stärkel, P. , Torralba, M. , Schott, E. , Tsukamoto, H. , Nelson, K. E. , Brenner, D. A. , Schnabl, B. (2011) Enteric dysbiosis associated with a mouse model of alcoholic liver disease. Hepatology 53, 96–105. [DOI] [PMC free article] [PubMed] [Google Scholar]
- 9. Hritz, I. , Mandrekar, P. , Velayudham, A. , Catalano, D. , Dolganiuc, A. , Kodys, K. , Kurt‐Jones, E. , Szabo, G. (2008) The critical role of toll‐like receptor (TLR) 4 in alcoholic liver disease is independent of the common TLR adapter MyD88. Hepatology 48, 1224–1231. [DOI] [PMC free article] [PubMed] [Google Scholar]
- 10. Bala, S. , Tang, A. , Catalano, D. , Petrasek, J. , Taha, O. , Kodys, K. , Szabo, G. (2012) Induction of Bcl‐3 by acute binge alcohol results in Toll‐like receptor 4/LPS tolerance. J. Leukoc. Biol. 92, 611–620. [DOI] [PMC free article] [PubMed] [Google Scholar]
- 11. Mandrekar, P. , Bala, S. , Catalano, D. , Kodys, K. , Szabo, G. (2009) The opposite effects of acute and chronic alcohol on lipopolysaccharide‐induced inflammation are linked to IRAK‐M in human monocytes. J. Immunol. 183, 1320–1327. [DOI] [PMC free article] [PubMed] [Google Scholar]
- 12. Norkina, O. , Dolganiuc, A. , Catalano, D. , Kodys, K. , Mandrekar, P. , Syed, A. , Efros, M. , Szabo, G. (2008) Acute alcohol intake induces SOCS1 and SOCS3 and inhibits cytokine‐induced STAT1 and STAT3 signaling in human monocytes. Alcohol. Clin. Exp. Res. 32, 1565–1573. [DOI] [PMC free article] [PubMed] [Google Scholar]
- 13. Mandrekar, P. , Szabo, G. (2009) Signalling pathways in alcohol‐induced liver inflammation. J. Hepatol. 50, 1258–1266. [DOI] [PMC free article] [PubMed] [Google Scholar]
- 14. Nahid, M. A. , Pauley, K. M. , Satoh, M. , Chan, E. K. L. (2009) miR‐146a is critical for endotoxin‐induced tolerance: implication in innate immunity. J. Biol. Chem. 284, 34590–34599. [DOI] [PMC free article] [PubMed] [Google Scholar]
- 15. Biswas, S. K. , Lopez‐Collazo, E. (2009) Endotoxin tolerance: new mechanisms, molecules and clinical significance. Trends Immunol. 30, 475–487. [DOI] [PubMed] [Google Scholar]
- 16. Zacharioudaki, V. , Androulidaki, A. , Arranz, A. , Vrentzos, G. , Margioris, A. N. , Tsatsanis, C. (2009) Adiponectin promotes endotoxin tolerance in macrophages by inducing IRAK‐M expression. J. Immunol. 182, 6444–6451. [DOI] [PubMed] [Google Scholar]
- 17. Biswas, S. K. , Bist, P. , Dhillon, M. K. , Kajiji, T. , Del Fresno, C. , Yamamoto, M. , Lopez‐Collazo, E. , Akira, S. , Tergaonkar, V. (2007) Role for MyD88‐independent, TRIF pathway in lipid A/TLR4‐induced endotoxin tolerance. J. Immunol. 179, 4083–4092. [DOI] [PubMed] [Google Scholar]
- 18. Kobayashi, K. , Hernandez, L. D. , Galán, J. E. , Janeway, C. A. Jr. , Medzhitov, R. , Flavell, R. A. (2002) IRAK‐M is a negative regulator of Toll‐like receptor signaling. Cell 110, 191–202. [DOI] [PubMed] [Google Scholar]
- 19. Nakagawa, R. , Naka, T. , Tsutsui, H. , Fujimoto, M. , Kimura, A. , Abe, T. , Seki, E. , Sato, S. , Takeuchi, O. , Takeda, K. , Akira, S. , Yamanishi, K. , Kawase, I. , Nakanishi, K. , Kishimoto, T. (2002) SOCS‐1 participates in negative regulation of LPS responses. Immunity 17, 677–687. [DOI] [PubMed] [Google Scholar]
- 20. Frazier, T. H. , Stocker, A. M. , Kershner, N. A. , Marsano, L. S. , McClain, C. J. (2011) Treatment of alcoholic liver disease. Therap. Adv. Gastroenterol. 4, 63–81. [DOI] [PMC free article] [PubMed] [Google Scholar]
- 21. Szabo, G. , Bala, S. (2013) MicroRNAs in liver disease. Nat. Rev. Gastroenterol. Hepatol. 10, 542–552. [DOI] [PMC free article] [PubMed] [Google Scholar]
- 22. O'Connell, R. M. , Rao, D. S. , Baltimore, D. (2012) microRNA regulation of inflammatory responses. Annu. Rev. Immunol. 30, 295–312. [DOI] [PubMed] [Google Scholar]
- 23. O'Connell, R. M. , Chaudhuri, A. A. , Rao, D. S. , Baltimore, D. (2009) Inositol phosphatase SHIP1 is a primary target of miR‐155. Proc. Natl. Acad. Sci. USA 106, 7113–7118. [DOI] [PMC free article] [PubMed] [Google Scholar]
- 24. Costinean, S. , Sandhu, S. K. , Pedersen, I. M. , Tili, E. , Trotta, R. , Perrotti, D. , Ciarlariello, D. , Neviani, P. , Harb, J. , Kauffman, L. R. , Shidham, A. , Croce, C. M. (2009) Src homology 2 domain‐containing inositol‐5‐phosphatase and CCAAT enhancer‐binding protein beta are targeted by miR‐155 in B cells of Emicro‐miR‐155 transgenic mice. Blood 114, 1374–1382. [DOI] [PMC free article] [PubMed] [Google Scholar]
- 25. Jiang, S. , Zhang, H. W. , Lu, M. H. , He, X. H. , Li, Y. , Gu, H. , Liu, M. F. , Wang, E. D. (2010) MicroRNA‐155 functions as an OncomiR in breast cancer by targeting the suppressor of cytokine signaling 1 gene. Cancer Res. 70, 3119–3127. [DOI] [PubMed] [Google Scholar]
- 26. Tili, E. , Michaille, J. J. , Cimino, A. , Costinean, S. , Dumitru, C. D. , Adair, B. , Fabbri, M. , Alder, H. , Liu, C. G. , Calin, G. A. , Croce, C. M. (2007) Modulation of miR‐155 and miR‐125b levels following lipopolysaccharide/TNF‐alpha stimulation and their possible roles in regulating the response to endotoxin shock. J. Immunol. 179, 5082–5089. [DOI] [PubMed] [Google Scholar]
- 27. Bala, S. , Marcos, M. , Kodys, K. , Csak, T. , Catalano, D. , Mandrekar, P. , Szabo, G. (2011) Up‐regulation of microRNA‐155 in macrophages contributes to increased tumor necrosis factor alpha (TNFalpha) production via increased mRNA half‐life in alcoholic liver disease. J. Biol. Chem. 286, 1436–1444. [DOI] [PMC free article] [PubMed] [Google Scholar]
- 28. Bala, S. , Csak, T. , Saha, B. , Zatsiorsky, J. , Kodys, K. , Catalano, D. , Satishchandran, A. , Szabo, G. (2016) The pro‐inflammatory effects of miR‐155 promote liver fibrosis and alcohol‐induced steatohepatitis. J. Hepatol. 64, 1378–1387. [DOI] [PMC free article] [PubMed] [Google Scholar]
- 29. Martinez‐Nunez, R. T. , Louafi, F. , Friedmann, P. S. , Sanchez‐Elsner, T. (2009) MicroRNA‐155 modulates the pathogen binding ability of dendritic cells (DCs) by down‐regulation of DC‐specific intercellular adhesion molecule‐3 grabbing non‐integrin (DC‐SIGN). J. Biol. Chem. 284, 16334–16342. [DOI] [PMC free article] [PubMed] [Google Scholar]
- 30. Emmanuilidis, K. , Weighardt, H. , Maier, S. , Gerauer, K. , Fleischmann, T. , Zheng, X. X. , Hancock, W. W. , Holzmann, B. , Heidecke, C. D. (2001) Critical role of Kupffer cell‐derived IL‐10 for host defense in septic peritonitis. J. Immunol. 167, 3919–3927. [DOI] [PubMed] [Google Scholar]
- 31. Breous, E. , Somanathan, S. , Vandenberghe, L. H. , Wilson, J. M. (2009) Hepatic regulatory T cells and Kupffer cells are crucial mediators of systemic T cell tolerance to antigens targeting murine liver. Hepatology 50, 612–621. [DOI] [PMC free article] [PubMed] [Google Scholar]
- 32. Shukla, S. D. , Velazquez, J. , French, S. W. , Lu, S. C. , Ticku, M. K. , Zakhari, S. (2008) Emerging role of epigenetics in the actions of alcohol. Alcohol. Clin. Exp. Res. 32, 1525–1534. [DOI] [PubMed] [Google Scholar]
- 33. Moghe, A. , Joshi‐Barve, S. , Ghare, S. , Gobejishvili, L. , Kirpich, I. , McClain, C. J. , Barve, S. (2011) Histone modifications and alcohol‐induced liver disease: are altered nutrients the missing link? World J. Gastroenterol. 17, 2465–2472. [DOI] [PMC free article] [PubMed] [Google Scholar]
- 34. Kirpich, I. , Zhang, J. , Gobejishvili, L. , Kharebava, G. , Barker, D. , Ghare, S. , Joshi‐Barve, S. , McClain, C. J. , Barve, S. (2013) Binge ethanol‐induced HDAC3 down‐regulates Cpt1a expression leading to hepatic steatosis and injury. Alcohol. Clin. Exp. Res. 37, 1920–1929. [DOI] [PMC free article] [PubMed] [Google Scholar]
- 35. Villagra, A. , Cheng, F. , Wang, H. W. , Suarez, I. , Glozak, M. , Maurin, M. , Nguyen, D. , Wright, K. L. , Atadja, P. W. , Bhalla, K. , Pinilla‐Ibarz, J. , Seto, E. , Sotomayor, E. M. (2009) The histone deacetylase HDAC11 regulates the expression of interleukin 10 and immune tolerance. Nat. Immunol. 10, 92–100. [DOI] [PMC free article] [PubMed] [Google Scholar]
- 36. Bala, S. , Csak, T. , Momen‐Heravi, F. , Lippai, D. , Kodys, K. , Catalano, D. , Satishchandran, A. , Ambros, V. , Szabo, G. (2015) Biodistribution and function of extracellular miRNA‐155 in mice. Sci. Rep. 5, 10721. [DOI] [PMC free article] [PubMed] [Google Scholar]
- 37. Saha, B. , Bala, S. , Hosseini, N. , Kodys, K. , Szabo, G. (2015) Krüppel‐like factor 4 is a transcriptional regulator of M1/M2 macrophage polarization in alcoholic liver disease. J. Leukoc. Biol. 97, 963–973. [DOI] [PMC free article] [PubMed] [Google Scholar]
- 38. Csak, T. , Ganz, M. , Pespisa, J. , Kodys, K. , Dolganiuc, A. , Szabo, G. (2011) Fatty acid and endotoxin activate inflammasomes in mouse hepatocytes that release danger signals to stimulate immune cells. Hepatology 54, 133–144. [DOI] [PMC free article] [PubMed] [Google Scholar]
- 39. Cai, X. , Yin, Y. , Li, N. , Zhu, D. , Zhang, J. , Zhang, C. Y. , Zen, K. (2012) Re‐polarization of tumor‐associated macrophages to pro‐inflammatory M1 macrophages by microRNA‐155. J. Mol. Cell Biol. 4, 341–343. [DOI] [PubMed] [Google Scholar]
- 40. Bode, J. G. , Ehlting, C. , Häussinger, D. (2012) The macrophage response towards LPS and its control through the p38(MAPK)‐STAT3 axis. Cell. Signal. 24, 1185–1194. [DOI] [PubMed] [Google Scholar]
- 41. Kühn, R. , Löhler, J. , Rennick, D. , Rajewsky, K. , Müller, W. (1993) Interleukin‐10‐deficient mice develop chronic enterocolitis. Cell 75, 263–274. [DOI] [PubMed] [Google Scholar]
- 42. Takeda, K. , Clausen, B. E. , Kaisho, T. , Tsujimura, T. , Terada, N. , Förster, I. , Akira, S. (1999) Enhanced Th1 activity and development of chronic enterocolitis in mice devoid of Stat3 in macrophages and neutrophils. Immunity 10, 39–49. [DOI] [PubMed] [Google Scholar]
- 43. Csóka, B. , Németh, Z. H. , Virág, L. , Gergely, P. , Leibovich, S. J. , Pacher, P. , Sun, C. X. , Blackburn, M. R. , Vizi, E. S. , Deitch, E. A. , Haskó, G. (2007) A2A adenosine receptors and C/EBPbeta are crucially required for IL‐10 production by macrophages exposed to Escherichia coli. Blood 110, 2685–2695. [DOI] [PMC free article] [PubMed] [Google Scholar]
- 44. He, M. , Xu, Z. , Ding, T. , Kuang, D. M. , Zheng, L. (2009) MicroRNA‐155 regulates inflammatory cytokine production in tumor‐associated macrophages via targeting C/EBPbeta. Cell. Mol. Immunol. 6, 343–352. [DOI] [PMC free article] [PubMed] [Google Scholar]
- 45. Enomoto, N. , Schemmer, P. , Ikejima, K. , Takei, Y. , Sato, N. , Brenner, D. A. , Thurman, R. G. (2001) Long‐term alcohol exposure changes sensitivity of rat Kupffer cells to lipopolysaccharide. Alcohol. Clin. Exp. Res. 25, 1360–1367. [PubMed] [Google Scholar]
- 46. Adachi, Y. , Moore, L. E. , Bradford, B. U. , Gao, W. , Thurman, R. G. (1995) Antibiotics prevent liver injury in rats following long‐term exposure to ethanol. Gastroenterology 108, 218–224. [DOI] [PubMed] [Google Scholar]
- 47. Yamashina, S. , Wheeler, M. D. , Rusyn, I. , Ikejima, K. , Sato, N. , Thurman, R. G. (2000) Tolerance and sensitization to endotoxin in Kupffer cells caused by acute ethanol involve interleukin‐1 receptor‐associated kinase. Biochem. Biophys. Res. Commun. 277, 686–690. [DOI] [PubMed] [Google Scholar]
- 48. Fukui, H. (2005) Relation of endotoxin, endotoxin binding proteins and macrophages to severe alcoholic liver injury and multiple organ failure. Alcohol. Clin. Exp. Res. 29 (Suppl 11), 172S–179S. [DOI] [PubMed] [Google Scholar]
- 49. Fujimoto, M. , Uemura, M. , Nakatani, Y. , Tsujita, S. , Hoppo, K. , Tamagawa, T. , Kitano, H. , Kikukawa, M. , Ann, T. , Ishii, Y. , Kojima, H. , Sakurai, S. , Tanaka, R. , Namisaki, T. , Noguchi, R. , Higashino, T. , Kikuchi, E. , Nishimura, K. , Takaya, A. , Fukui, H. (2000) Plasma endotoxin and serum cytokine levels in patients with alcoholic hepatitis: relation to severity of liver disturbance. Alcohol. Clin. Exp. Res. 24 (Suppl 4), 48S–54S. [PubMed] [Google Scholar]
- 50. Hill, D. B. , Barve, S. , Joshi‐Barve, S. , McClain, C. (2000) Increased monocyte nuclear factor‐kappaB activation and tumor necrosis factor production in alcoholic hepatitis. J. Lab. Clin. Med. 135, 387–395. [DOI] [PubMed] [Google Scholar]
- 51. Liew, F. Y. , Xu, D. , Brint, E. K. , O'Neill, L. A. (2005) Negative regulation of Toll‐like receptor‐mediated immune responses. Nat. Rev. Immunol. 5, 446–458. [DOI] [PubMed] [Google Scholar]
- 52. Rauh, M. J. , Ho, V. , Pereira, C. , Sham, A. , Sly, L. M. , Lam, V. , Huxham, L. , Minchinton, A. I. , Mui, A. , Krystal, G. (2005) SHIP represses the generation of alternatively activated macrophages. Immunity 23, 361–374. [DOI] [PubMed] [Google Scholar]
- 53. Wang, N. , Liang, H. , Zen, K. (2014) Molecular mechanisms that influence the macrophage m1‐m2 polarization balance. Front. Immunol. 5, 614. [DOI] [PMC free article] [PubMed] [Google Scholar]
- 54. Su, C. , Hou, Z. , Zhang, C. , Tian, Z. , Zhang, J. (2011) Ectopic expression of microRNA‐155 enhances innate antiviral immunity against HBV infection in human hepatoma cells. Virol. J. 8, 354. [DOI] [PMC free article] [PubMed] [Google Scholar]
- 55. O'Connell, R. M. , Kahn, D. , Gibson, W. S. , Round, J. L. , Scholz, R. L. , Chaudhuri, A. A. , Kahn, M. E. , Rao, D. S. , Baltimore, D. (2010) MicroRNA‐155 promotes autoimmune inflammation by enhancing inflammatory T cell development. Immunity 33, 607–619. [DOI] [PMC free article] [PubMed] [Google Scholar]
- 56. Nazari‐Jahantigh, M. , Wei, Y. , Noels, H. , Akhtar, S. , Zhou, Z. , Koenen, R. R. , Heyll, K. , Gremse, F. , Kiessling, F. , Grommes, J. , Weber, C. , Schober, A. (2012) MicroRNA‐155 promotes atherosclerosis by repressing Bcl6 in macrophages. J. Clin. Invest. 122, 4190–4202. [DOI] [PMC free article] [PubMed] [Google Scholar]
- 57. Palma, C. A. , Al Sheikha, D. , Lim, T. K. , Bryant, A. , Vu, T. T. , Jayaswal, V. , Ma, D. D. (2014) MicroRNA‐155 as an inducer of apoptosis and cell differentiation in acute myeloid leukaemia. Mol.Cancer. 13, 79. [DOI] [PMC free article] [PubMed] [Google Scholar]
- 58. Csak, T. , Bala, S. , Lippai, D. , Kodys, K. , Catalano, D. , Iracheta‐Vellve, A. , Szabo, G. (2015) MicroRNA‐155 deficiency attenuates liver ateatosis and fibrosis without reducing inflammation in a mouse model of steatohepatitis. PLoS One 10, e0129251. [DOI] [PMC free article] [PubMed] [Google Scholar]
- 59. Qian, F. , Deng, J. , Lee, Y. G. , Zhu, J. , Karpurapu, M. , Chung, S. , Zheng, J. N. , Xiao, L. , Park, G. Y. , Christman, J. W. (2015) The transcription factor PU.1 promotes alternative macrophage polarization and asthmatic airway inflammation. J. Mol. Cell Biol. 7, 557–567. [DOI] [PMC free article] [PubMed] [Google Scholar]
- 60. Yang, L. , Kouichi, M. , Zhang, B. , Matsushita, H. , Yang, Y. M. , Liang, S. , Song, J. , Roh, Y. S. , Seki, E. (2017) TRIF differentially regulates hepatic steatosis and inflammation/fibrosis in mice. Cell Mol. Gastroenterol. Hepatol. 3, 469–483. [DOI] [PMC free article] [PubMed] [Google Scholar]
- 61. Scott, M. J. , Liu, S. , Shapiro, R. A. , Vodovotz, Y. , Billiar, T. R. (2009) Endotoxin uptake in mouse liver is blocked by endotoxin pretreatment through a suppressor of cytokine signaling‐1‐dependent mechanism. Hepatology 49, 1695–1708. [DOI] [PMC free article] [PubMed] [Google Scholar]
- 62. Zahs, A. , Cook, R. T. , Waldschimdt, T. J. , Choudhry, M. A. , Kovacs, E. J. , Bird, M. D. (2012) Alcohol and inflammation and infection: clinical and experimental systems–summary of the 2010 Alcohol and Immunology Research Interest Group Meeting. Alcohol 46, 147–153. [DOI] [PMC free article] [PubMed] [Google Scholar]
Associated Data
This section collects any data citations, data availability statements, or supplementary materials included in this article.
Supplementary Materials
Supplementary Material Files
Supplementary Material Files