

Abstract
The precise branching patterns of dendritic arbors have a profound impact on information processing in individual neurons and the brain. These patterns are established by positive and negative regulation of the dendritic branching. Although the mechanisms for positive regulation have been extensively investigated, little is known about those for negative regulation. Here, we present evidence that mitochondria located in developing dendrites are involved in the negative regulation of dendritic branching. We visualized mitochondria in pyramidal neurons of the mouse neocortex during dendritic morphogenesis using in utero electroporation of a mitochondria-targeted fluorescent construct. We altered the mitochondrial distribution in vivo by overexpressing Mfn1, a mitochondrial shaping protein, or the Miro-binding domain of TRAK2 (TRAK2-MBD), a truncated form of a motor-adaptor protein. We found that dendritic mitochondria were preferentially targeted to the proximal portion of dendrites only during dendritic morphogenesis. Overexpression of Mfn1 or TRAK2-MBD depleted mitochondria from the dendrites, an effect that was accompanied by increased branching of the proximal portion of the dendrites. This dendritic abnormality cannot be accounted for by changes in the distribution of membrane trafficking organelles since the overexpression of Mfn1 did not alter the distributions of the endoplasmic reticulum, Golgi, or endosomes. Additionally, neither did these constructs impair neuronal viability or mitochondrial function. Therefore, our results suggest that dendritic mitochondria play a critical role in the establishment of the precise branching pattern of dendritic arbors by negatively affecting dendritic branching.
Keywords: dendritic development, mitochondria, neocortex, organelle, subcellular distribution
Introduction
The branching patterns of dendritic arbors have a profound impact on information processing in neurons and the brain as these patterns determine the kind of input a neuron receives and govern how the inputs are integrated (for review, see Gulledge et al., 2005; Spruston, 2008). Moreover, alterations in dendritic branching patterns are typically found in patients suffering from neurological disorders (for review, see Kulkarni and Firestein, 2012).
The precise branching pattern of dendritic arbors is established by positive and negative regulation of the dendritic branching (for review, see Cline, 2001; Wong and Ghosh, 2002). In positive regulation, dendritic branches are added to the arbor through a sequential process that includes formation, extension, and stabilization of the nascent branches. This process is governed by diverse signaling pathways, which transmit extracellular stimuli such as secreted ligands and synaptic inputs to regulators of the cytoskeletal assembly, membrane transport organelles, and transcription factors in the nucleus (for review, see Wong and Ghosh, 2002; Konur and Ghosh, 2005; Jan and Jan, 2010). On the other hand, negative regulation is achieved by suppressing branch formation as well as retracting and eliminating existing branches. However, in contrast to positive regulation, the mechanisms of negative regulation are poorly understood.
Mitochondria are a multifunctional and dynamic organelle that can potentially impact the development of dendritic arbors. Mitochondria fuel the cellular processes associated with dendritic development, such as cytoskeletal assembly and intracellular transport, by supplying ATP, control Ca2+ signaling by buffering cytosolic Ca2+ (for review, see Rizzuto et al., 2012; Sheng and Cai, 2012), and regulate caspase activity (for review, see Youle and Strasser, 2008), whose activation promotes the removal of dendrites (Kuo et al., 2006; Williams et al., 2006). Neuronal mitochondria are transported by kinesin and dynein motors to subcellular locations where ATP supply and Ca2+ buffering are in high demand. Such transport can potentially affect the spatial control of dendritic branching. Furthermore, mitochondria undergo continuous fusion and fission, the disruption of which has been implicated in the pathology of several neurological disorders (for review, see Chan, 2006).
Emerging evidence suggests that mitochondria affect certain aspects of neuronal morphogenesis. Mitochondria in developing neurons are preferentially targeted to subcellular locations such as the vicinities of axon terminals and dendritic spines (Morris and Hollenbeck, 1993; Li et al., 2004). At the same time, depletion of mitochondria from these locations causes abnormal organization of presynaptic boutons and a defect in spine formation (Li et al., 2004; Guo et al., 2005). These studies have prompted us to hypothesize whether mitochondria targeted to developing dendrites may also affect the development of dendritic arbors.
In the present study, we examined this hypothesis by depleting mitochondria from developing dendrites in mouse neocortical neurons using in utero electroporation. We found that this manipulation led to an increase in dendritic branching without producing cell death and altered mitochondrial function. We also found evidence that the observed dendritic abnormality could not be explained by the distribution of membrane trafficking organelles. The present results suggest that dendritic mitochondria negatively affect dendritic branching.
Materials and Methods
DNA constructs.
The coding sequences for the following proteins were inserted into the multiple cloning site (subcloned by K. Nishida) of the pCAGGS plasmid vector (Niwa et al., 1991): EGFP, EBFP2 (Ai et al., 2007), tandem dimer Tomato (tdTomato), mitochondria-targeted monomeric Cherry (mito-mCherry; tdTomato and mCherry; Shaner et al., 2004), mito-DsRed2, GalT-EGFP (Addgene plasmid 11929; Cole et al., 1996), mRFP-Rab5 (Addgene plasmid 14437; Vonderheit and Helenius, 2005), endoplasmic reticulum (ER)-targeted DsRed1 (ER-DsRed1), Mitochondrial Rho GTPase 1 (Miro1)-binding domain of trafficking kinesin protein 2 (TRAK2; TRAK2-MBD; MacAskill et al., 2009), mitofusin 1 (Mfn1), and ERT2CreERT2 (Addgene plasmid 13777; Matsuda and Cepko, 2007). The pCALNL5 plasmid vector, which allows for inducible expression of a construct in response to Cre-mediated recombination (Kanegae et al., 1995), was used for the expression of the following proteins: EGFP, tdTomato, mito-DsRed2, mRFP-Rab5, ER-DsRed1, and TRAK2-MBD. The coding sequences for one of mito-mCherry, mRFP-Rab5, and ER-DsRed1 was inserted after the EGFP coding sequence in pCAG-EGFP or pCALNL5-EGFP, and the internal ribosomal entry site (IRES) sequence, which was excised from pIRES2-EGFP (Takara Bio), was inserted between the two coding sequences. Mito-mCherry and mito-DsRed2 were constructed by fusing the mitochondrial targeting sequence derived from human cytochrome c oxidase (Rizzuto et al., 1995) to the N termini of mCherry and DsRed2. Fluorescent proteins tagged with this sequence have been reported to specifically label mitochondria without disrupting mitochondrial function (Chandrasekaran et al., 2006; Misgeld et al., 2007). ER-DsRed1 was constructed by fusing the ER targeting sequence of calreticulin (Fliegel et al., 1989) and the ER retention sequence (KDEL; Munro and Pelham, 1987) to the N and C termini of DsRed1, respectively. The specificity of organelle-targeted fluorescent constructs was confirmed in COS7 cells using the immunofluorescence of a specific marker for each organelle. The coding sequences for mouse Mfn1 (GenBank accession number NM_024200) and Miro1-binding domain (amino acid residue 476–913) of mouse TRAK2 (NM_172406) were amplified from cDNA prepared from mouse postnatal day 0 (P0) cerebellum, and a hemagglutinin (HA) epitope was fused to the C terminus of Mfn1 and N terminus of TRAK2-MBD. The coding sequences of the fusion proteins were verified by DNA sequencing (Beckman Coulter), and the protein expressions were confirmed by immunofluorescence detection using an anti-HA antibody (Roche).
In utero electroporation.
Pregnant ICR mice (Nihon-SLC) were used for in utero electroporation. Noon of the day at which the vaginal plug was detected was designated as embryonic day 0.5 (E0.5) and E19.5 was defined as P0.5. In utero electroporation was conducted on E13.5–13.75 embryos as described previously (Hatanaka et al., 2004) with minor modifications. Briefly, a 1–1.5 μl plasmid solution was injected into the lateral ventricle and 30 V or 40 V electric pulses of 50 ms duration were delivered at 200 ms intervals. Plasmids were prepared with the NucleoBond Midi Kit (Macherey-Nagel), suspended in PBS (0.1 m, pH 7.4) and electroporated at the following final concentrations: 1.0 μg/μl pCAG-EGFP-IRES-mito-mCherry for analysis of the mitochondrial distribution during the development of dendritic arbors; 3.0 μg/μl pCAG-Mfn1 and 1.0 μg/μl pCAG-EGFP-IRES-mito-mCherry for analysis of the mitochondrial distribution and dendritic morphology in Mfn1-overexpressing neurons; 3.0 μg/μl pCAG-Mfn1 and 1.0 μg/μl pCAG-EGFP-IRES-ER-DsRed1 for analysis of the ER distribution in Mfn1-overexpressing neurons; 3.0 μg/μl pCAG-Mfn1, 1.0 μg/μl pCAG-tdTomato, and 1.0 μg/μl pCAG-GalT-EGFP for analysis of the Golgi distribution in Mfn1-overexpressing neurons; 3.0 μg/μl pCAG-Mfn1 and 1.0 μg/μl pCAG-EGFP-IRES-mRFP-Rab5 for analysis of the endosomal distribution in Mfn1-overexpressing neurons; 3.0 μg/μl pCALNL5-TRAK2-MBD, 10 ng/μl pCAG-ERT2CreERT2, 1.5 μg/μl pCALNL5-EGFP, and either 100 ng/μl pCAG-mito-DsRed2 or 150 ng/μl pCALNL5-mito-DsRed2 for analysis of the mitochondrial distribution and dendritic morphology in TRAK2-MBD-expressing neurons; 3.0 μg/μl pCALNL5-TRAK2-MBD, 10 ng/μl pCAG-ERT2CreERT2, and 1.5 μg/μl pCALNL5-EGFP-IRES-ER-DsRed1 for analysis of the ER distribution in TRAK2-MBD-expressing neurons; 3.0 μg/μl pCALNL5-TRAK2-MBD, 10 ng/μl pCAG-ERT2CreERT2, 1.5 μg/μl pCALNL5-tdTomato, and 1.0 μg/μl pCAG-GalT-EGFP for analysis of the Golgi distribution in TRAK2-MBD-expressing neurons; 3.0 μg/μl pCALNL5-TRAK2-MBD, 10 ng/μl pCAG-ERT2CreERT2, and 1.5 μg/μl pCALNL5-EGFP-IRES-mRFP-Rab5 for analysis of the endosomal distribution in TRAK2-MBD-expressing neurons; 1.5 μg/μl pCAG-EBFP2 and either 3.0 μg/μl pCAG-Mfn1 or 3.0 μg/μl pCAG-TRAK2-MBD for analysis of the mitochondrial membrane potential; and a combination of 3.0 μg/μl pCAG-Mfn1, 1.5 μg/μl pCAG-EGFP, and 1.5 μg/μl pCAG-mito-mCherry, or combination of 3.0 μg/μl pCAG-TRAK2-MBD, 1.5 μg/μl pCAG-EGFP, and 150 ng/μl pCAG-mito-DsRed2 for analysis of the dendritic morphology in dissociated neuronal cultures. The same concentration of pCAG mock vector was used as a negative control for pCAG-Mfn1 and pCAG-TRAK2-MBD, and that of pCALNL5 mock vector for pCALNL5-TRAK2-MBD. All animal experiments were performed in accordance with the Osaka University Guidelines for the Welfare and Use of Laboratory Animals.
Tamoxifen administration.
Tamoxifen (Sigma) was dissolved in corn oil (Sigma) at 10 mg/ml and administered by oral gavage to pregnant mice (5 mg per animal) at E18.5–18.75.
Fixation, sectioning, and imaging of electroporated brains.
E18.5 embryos were dissected and perfused with 4% PFA in PBS. Pups (P3.5 and P7.5) and young adult mice (P14.5 and P21.5) were anesthetized with sodium pentobarbital (100–200 mg/kg body weight; Nembutal; Abbott) followed by intracardial perfusion with 4% PFA in PBS. Then the brains were removed, postfixed overnight in the same fixative at 4°C, and cryoprotected by immersion in 30% sucrose in PBS at 4°C overnight. Brains of either sex were pooled from multiple litters and sectioned coronally at 100 μm using a cryostat (Microm HM500). Pyramidal neurons that were located in the primary somatosensory cortex exhibited strong fluorescence and whose somata were located more than ∼20 μm away from the cut surfaces of the section were imaged using a confocal laser scanning microscope (TCS SP5; Leica Microsystems) with a 40× (NA 0.85) objective lens. Neurons in the upper layers (the upper CP at E18.5 and layers 2/3 at later stages) were focused, because the dendrites of layers 5/6 neurons extended into layer 4, making it difficult to distinguish mito-RFP signals in these neurons from those in layer 4 neurons. Axons, which were defined as processes that extended from the soma with a small and uniform diameter along their course, were not fully captured. Projection images were created from stacks of images taken along the z-axis at 1.2 μm intervals and minimally processed for brightness and contrast using LAS AF (Leica Microsystems) or Photoshop CS5 (version 12.1; Adobe Systems).
Analysis of dendritic morphology.
Dendrites were reconstructed in 3D from stacks of confocal images using Neurolucida (version 8.27; MicroBrightField) and analyzed using Neurolucida Explorer (version 4.71; MicroBrightField). Measurements were made of the dendrite length, the number of primary dendrites, and the number and the distribution of branch points. Apical and basal dendrites were separately analyzed and reported. The apical dendrite was defined as the largest diameter process that extended from the apical side of the soma to the pial surface (the main trunk), and all branches emanating from this process were regarded as parts of the apical dendrite. The rest of the dendritic arbor was regarded as basal dendrites. The border between the soma and dendrites was defined at the sites where dendrites emerged by drawing a smooth arc between the free edges of the soma on each side of the emergent process (Miller, 1981). In cases in which the border was unclear due to gradual tapering of the soma, the border was defined at the position where the dendritic diameter fell below 5 μm. Processes shorter than 5 μm were ignored. Neurons that had dendritic processes indistinguishable from those of other labeled neurons were excluded from the analysis.
Analysis of mitochondrial distribution.
Projection images of mito-RFP-labeled mitochondria were thresholded to eliminate background fluorescence using MetaMorph (version 7.5; Molecular Devices), and the number of pixels above threshold was counted. The proportion of mito-RFP signals in the dendrites was calculated by dividing the number of mito-RFP pixels in the dendrites by the total number of the pixels in the soma-dendrite compartment. To analyze the distribution of mito-RFP signals within the dendrites, dendrites were divided into consecutive segments by drawing soma-centered concentric circles at 10 μm intervals, and the number of mito-RFP pixels in each segment was divided by the total number of pixels in the soma-dendrite compartment. To normalize the dendritic size, the value obtained by the above calculation was further divided for each segment by the proportion of the area of the segment to the total area of the soma-dendrite compartment. The areas of segments and the soma-dendrite compartment were measured after thresholding the projection images of EGFP-labeled dendrites. Neurons that had mito-RFP signals indistinguishable from those of other labeled neurons were excluded from the analysis.
Analysis of Golgi distribution.
Projection images of GalT-EGFP-labeled Golgi were thresholded using MetaMorph and the distance from the border between the soma and the apical dendrite to the most distal tip of GalT-EGFP signals in the apical dendrite was measured.
Immunofluorescence.
Sections of E18.5, P3.5, and P7.5 cortices were cut coronally at 50 μm using a cryostat and subjected to immunofluorescence staining of single-stranded DNA. Sections were blocked in PBS with 0.3% Triton X-100 (PBST) containing 10% normal goat serum (NGS) for 1 h at room temperature (RT) followed by incubation with rabbit anti-single-stranded DNA antibody (diluted 1:50 in PBST with 5% NGS; IBL) overnight at 4°C. Afterward, sections were incubated sequentially with goat biotinylated anti-rabbit antibody (1:200 in PBST with 5% NGS; Jackson ImmunoResearch) for 2 h and Alexa 633-conjugated streptavidin (1:200 in PBST with 1% NGS; Life Technologies) for 1 h at RT. Images were captured using TCS SP5, and nuclei doubly labeled with EGFP and single-stranded DNA were counted.
Dissociated cells after 3 d of culture were fixed with 4% PFA in PBS for 15 min and blocked in PBST containing 5% NGS for 1 h at RT followed by incubation with mouse monoclonal SMI-312 antibody (diluted 1:1000 in PBST with 5% NGS; Covance) overnight at 4°C. Cells were then incubated with Alexa 633-conjugated goat anti-mouse antibody (1:200 in PBST with 5% NGS; Life Technologies) for 2 h at RT. Images were captured using TCS SP5.
The dissociated neuronal culture.
The dissociated neuronal culture was prepared from cortices that had been electroporated in utero at E13.5–13.75, dissociated using papain (Nacalai Tesque) at E18.5, plated onto 12 mm poly-l-lysine (Sigma)-coated coverslips at a density of 5 × 10⁴ cells/coverslip and cultured in Neurobasal medium (Life Technologies) supplemented with 2% B27 (Life Technologies), 0.5 mm l-glutamine (Sigma), and 1% penicillin/streptomycin (Nacalai Tesque) at 37°C with 5% CO2. In some experiments, 10 μm minocycline (Sigma; Zhu et al., 2002; Wang et al., 2003) or 20 μm N-benzyloxycarbonyl-Val-Ala-Asp-fluoromethyl ketone (Z-VAD-FMK; BD) was added to the medium at the onset of culturing.
Analysis of mitochondrial membrane potential.
Mitochondrial membrane potential was analyzed using either 0.2 μg/ml 5,5′,6,6′-tetrachloro-1,1′,3,3′-tetraethylbenzimidazolylcarbocyanine iodide (JC-1; Life Technologies; Reers et al., 1991) or 10 nm MitoTracker Green (Life Technologies) and 20 nm tetramethylrhodamine methyl ester (TMRM; Life Technologies). JC-1 was applied to dissociated cells after 3 d of culture for 20 min at 37°C with 5% CO2. Coverslips were then washed with prewarmed medium and transferred into a glass-bottom dish (FluoroDish; World Precision Instruments) filled with Neurobasal medium to image the dye fluorescence from EBFP2-labeled neurons using a confocal laser microscope (FV1000; Olympus) with a 40× (NA 0.60) objective lens on an inverted microscope (IX81; Olympus). For double staining of MitoTracker Green and TMRM, cells on coverslips were initially incubated with MitoTracker Green for 60 min at 37°C with 5% CO2, transferred into a glass-bottom dish filled with Neurobasal medium containing TMRM, and further incubated for 20 min under the same condition. Without washing, the dye signals from EBFP2-positive cells were captured using the confocal laser microscope (FV1000). All images were acquired within 60 min after coverslips were placed under the microscope, during which the dye signals showed no discernible change. For negative controls, cells were incubated with JC-1 and 5 μm carbonyl cyanide 3-chlorophenylhydrazone (CCCP; Sigma), an uncoupler of oxidative phosphorylation that dissipates mitochondrial potential, or first treated with 20 μm CCCP alone for 20 min, and subsequently with a mixture of TMRM and 20 μm CCCP. Quantification was performed using MetaMorph, and the ratio of red to green fluorescence intensity of JC-1, or that of TMRM to MitoTracker Green signals in the somatodendritic region, was calculated. Cells that had >10% of their dye signals indistinguishable from the signals of other cells were excluded from the analysis.
Statistics.
All data are represented as the mean ± SEM. Statistical significance was determined by the Mann–Whitney U test. For multiple pairwise comparisons, Bonferroni correction was applied to p values.
Results
Preferential targeting of mitochondria to the proximal portion of dendrites during the development of dendritic arbors
We first examined if mitochondria are preferentially targeted to a specific location of the dendrites during the development of dendritic arbors. For this purpose, we examined mitochondrial distribution in pyramidal neurons in the mouse neocortex at various stages during the development of dendritic arbors. To visualize neurons and their mitochondria, we transfected ventricular zone cells of the neocortex with plasmids encoding EGFP and mito-RFP (see Materials and Methods) by in utero electroporation (Hatanaka et al., 2004) at E13.5–13.75. Most labeled neurons were located in the cortical plate (CP), where they begin to elaborate dendrites, only after E18.5 (data not shown). We therefore, targeted our analysis to E18.5 and later. At P7.5, labeled neurons were found in layers 2–6 of the CP (Fig. 1A).
Figure 1.

Mitochondrial distribution in cortical neurons during the development of dendritic arbors. A, A P7.5 cortical section showing the distribution of EGFP-labeled neurons. The dotted line indicates the boundary between layers 1 and 2. The numbers show cortical layers. B–I, Pyramidal neurons expressing EGFP and mito-RFP in E18.5 (B, C), P7.5 (D, E), P14.5 (F, G), and P21.5 (H, I) cortices. Plasmids encoding fluorescent proteins were electroporated in utero into ventricular zone cells at E13.5–13.75 to visualize the neuronal morphology and mitochondria. Dendritic mito-RFP signals are located mostly in the proximal portion at E18.5 and P7.5, but almost evenly distributed throughout the dendritic arbors at P14.5 and P21.5. The red dotted lines indicate the boundary between the marginal zone and the upper cortical plate (B, C) or between layers 1 and 2 (D–I). The regions indicated by the red brackets in D, E, H, and I are enlarged in D′–E″ and H′–I″. D′–E″, H′–I″, Enlarged images of the distal and proximal portions of the apical dendrite at P7.5 and P21.5. Mito-RFP signals (red) are more densely distributed in the proximal portion than in the distal portion of the apical dendrite at P7.5 (D′–E″), while they are approximately evenly distributed in both portions at P21.5 (H′–I″). Arrowheads point to branch points. J, K, Analysis of the developmental changes in the dendritic morphology: (J) number of branch points, (K) length of dendrites including all branches. Dendrites grow extensively from E18.5 to P14.5, but not between P14.5 and P21.5; n = 39 cells, two brains for E18.5; 21 cells, three brains for P3.5; 20 cells, three brains for P7.5; 9 cells, two brains for P14.5; and 15 cells, three brains for P21.5. L, Analysis of the dendritic distribution of the mito-RFP signals. Dendrites were divided into consecutive 10 μm segments based on the distance from the soma, and the percentage of mito-RFP pixels in each segment to the total number of pixels in the soma-dendrite compartment was calculated. Clear peaks from the mito-RFP signal are seen in the proximal portion of dendrites in E18.5 and P7.5 neurons, but not in P14.5 and P21.5 neurons. M, Normalized distribution of mito-RFP signals to dendritic size. The values obtained in L were further divided by the proportion of the area of each segment to the total area of the soma-dendrite compartment. Normalized signals are concentrated in the proximal portion of the dendrites at E18.5 and P7.5; n = 35 cells, two brains for E18.5; 21 cells, three brains for P3.5; 15 cells, three brains for P7.5; 4 cells, two brains for P14.5; and 7 cells, three brains for P21.5. A.U., arbitrary units. Scale bars: A, 250 μm; B, C, 10 μm; D, E, 20 μm; D′–E″, H′–I″, 10 μm; F–I, 40 μm. Error bars indicate SEM; **p < 0.01, ***p < 0.001, Mann–Whitney U test with Bonferroni correction (3 tests).
At E18.5, labeled neurons displayed a simple morphology with a single apical dendrite carrying only a few branches but no basal dendrites (Fig. 1B). During the period between E18.5 and P14.5, extensive changes of the dendritic morphology took place: basal dendrites formed, the number of branches increased, and dendritic processes elongated (Fig. 1D,F,J,K). Dendritic morphology, however, did not undergo extensive changes at stages later than P14.5 (Fig. 1F,H,J,K). Dendritic mito-RFP signals were found mostly in the proximal (approximately <50 μm from the soma) portion of dendrites at E18.5 and P7.5 (Fig. 1B–E,D′–E″,L) whereas at P14.5 and later, the signals tended to be evenly distributed in the entire arbor (Fig. 1F–I,H′–I″,L). These differences in mitochondrial distribution were not ascribable to changes in dendritic size because even after mito-RFP signals were normalized to dendritic size, the signals were still concentrated in the proximal portion of the dendrites at E18.5 and P7.5 (Fig. 1M). Close inspection of the mito-RFP signals in P7.5 neurons revealed that a large fraction of the mito-RFP signals were distributed in the main trunk of the apical dendrite (Fig. 1D,E,D′–E″), where the signals were not specifically localized at dendritic branch points (Fig. 1D′–E″). These findings raise the possibility that dendritic mitochondria might affect the morphogenesis of dendritic arbors, particularly that of the proximal portion of dendrites.
Promoting mitochondrial fusion in the soma depletes mitochondria from dendrites and increases dendritic branching and length
If dendritic mitochondria affect the development of dendritic arbors, we should be able to observe changes in the dendritic morphology by depleting mitochondria from developing dendrites. To test this possibility, we first used Mfn1, which is a GTPase that mediates mitochondrial fusion (Santel and Fuller, 2001), and it was previously shown that promoting mitochondrial fusion in the soma depletes mitochondria from dendrites in cultured hippocampal neurons (Li et al., 2004). We first coelectroporated Mfn1 with EGFP and mito-RFP at E13.5–13.75, and then examined mito-RFP signals and dendritic morphology at P7.5 when mitochondria were preferentially targeted to the proximal portion of the dendrites. Mfn1 overexpression caused no obvious alteration in morphology or cortical layering of labeled neurons at E18.5 (data not shown).
Overexpression of Mfn1 induced large mitochondrial aggregates in the soma at P7.5 (Fig. 2A–D, arrow). Concomitantly, mito-RFP signals in dendrites were markedly reduced in Mfn1-overexpressing neurons (Mfn1 neurons hereafter; Fig. 2A–D,A′–D′; percentage of mito-RFP signals in dendrites to the total signals in the soma-dendrite compartment of control neurons, 56.5 ± 2.2%; of Mfn1 neurons, 23.2 ± 2.0%; p < 0.001). Interestingly, the dendritic morphology of these neurons was markedly altered. The number of branch points and the dendritic length were increased in the apical dendrite, but not in basal dendrites (Fig. 2E–H). Close inspection of dendritic morphology revealed that the number of branch points was increased both in the proximal portion of the main trunk of the apical dendrite and in the dendritic processes emanating from this portion (Fig. 2A,C,A′,C′,I; data not shown). The number of primary dendrites was not different from that of control neurons (control neurons, 4.32 ± 0.36; Mfn1 neurons, 5.81 ± 0.64; p = 0.13). Thus, overexpression of Mfn1 depleted mitochondria from the dendrites, an effect accompanied by increases in the dendritic branching and length.
Figure 2.
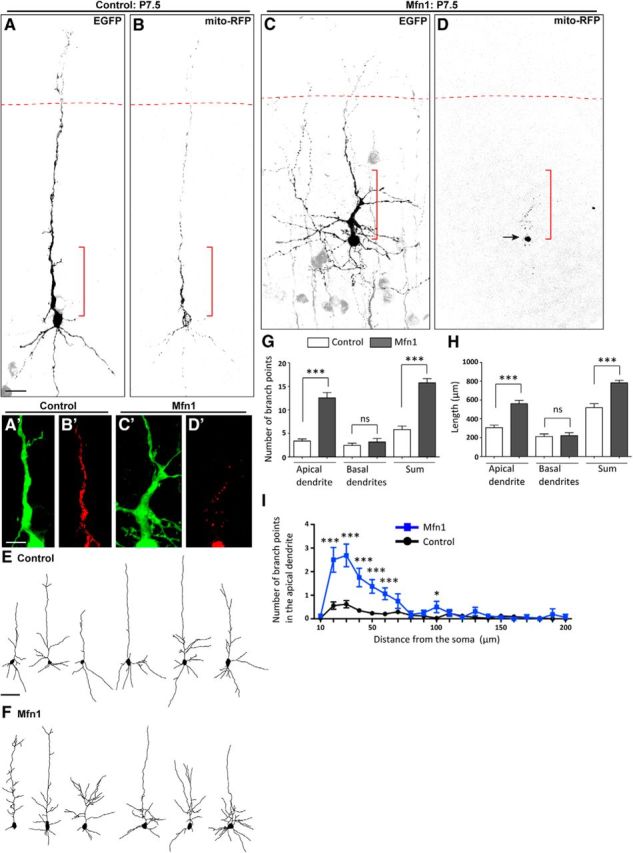
Overexpression of Mfn1 alters mitochondrial distribution and dendritic morphology. A–D, Pyramidal neurons expressing EGFP and mito-RFP in P7.5 cortices electroporated in utero with a control mock vector (A, B) or Mfn1-expression vector (C, D) at E13.5–13.75. The arrow in D points to the mitochondrial aggregate. The red dotted lines indicate the boundary between layers 1 and 2. The regions indicated by the red brackets are enlarged in A′–D′. A′–D′, Enlarged images of the proximal portion of the apical dendrite in control (A′, B′) and Mfn1 neurons (C′, D′). In the Mfn1 neuron, mito-RFP (red) signals are markedly reduced in dendrites and noticeably more branches emanate from the proximal portion of dendrites. E, F, Neurolucida drawings of control (E) and Mfn1 neurons (F). Note the increase in dendritic branching in the Mfn1 neurons. G–I, Analysis of the dendritic morphology: (G) the respective number of dendritic branch points in apical and basal dendrites and their sum, (H) the lengths of apical and basal dendrites and their sum, and (I) the number of branch points in the apical dendrite relative to the distance from the soma; n = 34 cells, three brains for control; 16 cells, five brains for Mfn1. Scale bars: A–D, 20 μm; A′–D′, 10 μm; E, F, 50 μm. Error bars indicate SEM; *p < 0.05, ***p < 0.001, Mann–Whitney U test.
We examined the dendritic morphology of Mfn1 neurons at P21.5 to test if the dendritic abnormalities are transient. We found that most mito-RFP signals were still confined to the soma in Mfn1 neurons (Fig. 3A–D,A′–D′; percentage of mito-RFP signals in dendrites to the total signals in the soma-dendrite compartment of control neurons, 61.3 ± 1.3%; of Mfn1 neurons, 27.2 ± 3.8%; p < 0.01). The number of branch points and the length of dendrites were markedly increased in both the apical and basal dendrites (Fig. 3E–I). In addition, we noticed that dendritic arbor size was consistently smaller in Mfn1 neurons than in control neurons (Fig. 3A,C,E,F). Thus, the dendritic abnormalities were not only maintained after the first postnatal week, they were enhanced.
Figure 3.

Overexpression of Mfn1 alters the mature morphology of pyramidal neurons. A–D, Pyramidal neurons expressing EGFP and mito-RFP in P21.5 cortices electroporated in utero with a control mock vector (A, B) or Mfn1-expression vector (C, D) at E13.5–13.75. The red dotted lines indicate the boundary between layers 1 and 2. The regions indicated by the brackets are enlarged in A′–D′. A′–D′, Enlarged images of the proximal portion of the apical dendrite in control (A′, B′) and Mfn1 neurons (C′, D′). In the Mfn1 neuron, mito-RFP signals (red) are markedly reduced in dendrites and noticeably more branches emanate from the main trunk of the apical dendrite and from its side branches. E, F, Neurolucida drawings of control (E) and Mfn1 neurons (F). Note the more complex and smaller sized dendritic arbors in the Mfn1 neurons. G–I, Analysis of the dendritic morphology: (G) the respective number of dendritic branch points in apical and basal dendrites and their sum, (H) the lengths of apical and basal dendrites and their sum, and (I) the number of branch points in dendrites relative to the distance from the soma; n = 18 cells, three brains for control; 14 cells, four brains for Mfn1. Scale bars: A–D, 40 μm; A′–D′, 10 μm; E, F, 50 μm. Error bars indicate SEM; *p < 0.05, **p < 0.01, ***p < 0.001, Mann–Whitney U test.
Interfering with the mitochondrial adaptor-motor interaction causes similar effects to those of Mfn1 on mitochondrial distribution and dendritic morphology
Promoting mitochondrial fusion in the soma is an indirect approach to impair mitochondrial transport. To more directly impair their transport, we used TRAK2-MBD. TRAK2 is an adaptor protein that tethers mitochondria to motor proteins via the mitochondria-anchored protein, Miro (Brickley et al., 2005; Brickley and Stephenson, 2011; MacAskill et al., 2009; van Spronsen et al., 2013). TRAK2-MBD interferes with the intrinsic TRAK2-Miro1 interaction and thereby disrupts mitochondrial transport (MacAskill et al., 2009).
We found that mito-RFP signals in dendrites were significantly reduced in TRAK2-MBD-expressing neurons (TRAK2-MBD neurons hereafter; Fig. 4A–D,A′–D′; percentage of mito-RFP signals in dendrites to the total signals in the soma-dendrite compartment of control neurons, 59.2 ± 3.0%; of TRAK2-MBD neurons, 34.3 ± 4.9%; p < 0.01). It is unlikely that TRAK2-MBD indirectly impaired mitochondrial transport by enhancing mitochondrial fusion via Miro (Fransson et al., 2006; Saotome et al., 2008), because we found no overfused mitochondria in the somata of TRAK2-MBD neurons (Fig. 4B″,D″). The dendritic morphology of TRAK2-MBD neurons was markedly altered in a manner similar to that seen in Mfn1 neurons. The number of branch points was increased in the apical dendrite, but not in basal dendrites (Fig. 4E–G), although the length of the arbor was not significantly different from that of control neurons (Fig. 4H). The number of branch points appeared greater in both the proximal portion of the main trunk of the apical dendrite and the dendritic processes emanating from this portion (Fig. 2A,C,A′,C′,I; data not shown). The number of primary dendrites was not different from that in control neurons (control neurons, 6.50 ± 0.69; TRAK2-MBD neurons, 7.44 ± 0.72; p = 0.42). Thus, TRAK2-MBD caused similar effects to those of Mfn1 on mitochondrial distribution and dendritic morphology, supporting the involvement of dendritic mitochondria in the regulation of dendritic branching.
Figure 4.

Overexpression of TRAK2-MBD alters mitochondrial distribution and dendritic morphology. A–D, Pyramidal neurons expressing EGFP and mito-RFP in P7.5 cortices electroporated in utero with a control mock vector (A, B) or TRAK2-MBD-expression vector (C, D) at E13.5–13.75. Expressions of TRAK2-MBD and EGFP were induced at E18.5 by tamoxifen administration. The red dotted lines indicate the boundary between layers 1 and 2. The regions indicated by the red brackets are enlarged in A′–D′. A′-D′, Enlarged images of the proximal portion of the apical dendrite in control (A′, B′) and TRAK2-MBD neurons (C′, D′). In the TRAK2-MBD neuron, mito-RFP signals (red) are reduced in dendrites and noticeably more branches emanate from the proximal portion of the dendrites. B″, D″, Enlarged images of the mito-RFP signals in the somata of control (B″) and TRAK2-MBD neurons (D″) show no overfused mitochondria. E, F, Neurolucida drawings of the control (E) and TRAK2-MBD neurons (F). Note the increase in dendritic branching in TRAK2-MBD neurons. G–I, Analysis of the dendritic morphology: (G) the respective number of dendritic branch points of apical and basal dendrites and their sum, (H) the lengths of apical and basal dendrites and their sum, and (I) the number of branch points in the apical dendrite relative to the distance from the soma; n = 10 cells, five brains for control; 18 cells, six brains for TRAK2-MBD. J–M, Pyramidal neurons expressing EGFP and mito-RFP in P21.5 cortices. No obvious alterations are seen in the dendritic morphology or mitochondrial distribution in the TRAK2-MBD neuron. Scale bars: A–D, 20 μm; A′–D′, 10 μm; B″, D″, 5 μm; E, F, 50 μm; J–M, 40 μm. Error bars indicate SEM; **p < 0.01, Mann–Whitney U test.
We noticed that control neurons for TRAK2-MBD had more dendritic branches than those for Mfn1 (compare Figs. 4G, 2G). This difference might be ascribable to experimental factors associated with Cre-mediated recombination system, such as expressions of Cre recombinase and neomycin, and administration of tamoxifen, all of which were used for the expression of TRAK2-MBD but not of Mfn1 (see Materials and Methods).
We also examined the dendritic morphology of TRAK2-MBD neurons at P21.5. However, unlike the case of Mfn1 neurons, we found no obvious increase in dendritic branching in TRAK2-MBD neurons (Fig. 4J,L). In addition, many mito-RFP signals were present in dendrites of TRAK2-MBD neurons, results different from those at P7.5 (Fig. 4J–M). Thus, the increased branching of dendrites found at the first postnatal week disappeared in mature TRAK2-MBD neurons concomitantly with the redistribution of mitochondria in dendrites.
Distributions of the ER, Golgi, and endosomes in Mfn1 and TRAK2-MBD neurons
Membrane trafficking organelles such as the ER, Golgi, and endosomes are located in dendrites and promote dendritic branching in Drosophila sensory neurons (Ye et al., 2007; Satoh et al., 2008; Zheng et al., 2008) and rat hippocampal neurons (Horton et al., 2005). These reports suggest that the effects of Mfn1 and TRAK2-MBD on dendritic morphology might be mediated by a change in distribution of these organelles rather than a change in the distribution of mitochondria. We therefore introduced ER-DsRed1, GalT-EGFP, and mRFP-Rab5 to examine the distributions of the ER, Golgi, and endosomes, respectively, at P7.5 to address this possibility.
In TRAK2-MBD neurons, GalT-EGFP and mRFP-Rab5 signals, but not ER-DsRed1 signals, were more distally distributed in the apical dendrite (Fig. 5A–D,I–L,Q–T; the distance from the soma to the most distal tip of GalT-EGFP signals in the apical dendrite of control neurons, 26.7 ± 3.6 μm; of TRAK2-MBD neurons, 43.6 ± 5.4 μm; p < 0.05). However, in Mfn1 neurons, none of the ER-DsRed1, GalT-EGFP, or mRFP-Rab5 signals showed a noticeable alteration in distribution (Fig. 5E–H,M–P,U–X; the distance from the soma to the most distal tip of GalT-EGFP signals in the apical dendrite of control neurons, 31.3 ± 3.7 μm; of Mfn1 neurons, 32.6 ± 3.4 μm; p = 0.73). Thus, the only common cause that can explain the alteration in dendritic branching in Mfn1 and TRAK2-MBD neurons is the change in mitochondrial distribution.
Figure 5.

Distributions of the ER, Golgi, and endosomes in TRAK2-MBD and Mfn1 neurons. A–H, Pyramidal neurons expressing EGFP and ER-DsRed1 in P7.5 cortices electroporated in utero with a control mock vector for TRAK2-MBD (A, B), TRAK2-MBD-expression vector (C, D), control mock vector for Mfn1 (E, F), or Mfn1-expression vector (G, H) at E13.5–13.75. No obvious alterations are seen in the dendritic distribution of ER-DsRed1 signals in the TRAK2-MBD or Mfn1 neurons. I–P, Similar to A–H except that tdTomato and GalT-EGFP were electroporated instead of EGFP and ER-DsRed1, respectively. TdTomato and GalT-EGFP signals were color converted to green and red, respectively. GalT-EGFP signals in the TRAK2-MBD neuron (L) are more distally distributed than those in the control neuron (J). On the other hand, the distribution of GalT-EGFP signals is similar between the control (N) and Mfn1 neurons (P). Q–X, Similar to A–H except that EGFP and mRFP-Rab5 were electroporated instead of EGFP and ER-DsRed1, respectively. In the TRAK2-MBD neuron (T), noticeably more mRFP-Rab5 puncta are distributed distally in the apical dendrite and are present in basal dendrites. In the Mfn1 neuron (X), no obvious alterations are seen in the dendritic distribution of the mRFP-Rab5 signal. The arrow in X points to an aggregate-like structure in the soma. Aggregates are assumed not to be the result of endosomal fusion because (1) the number of mRFP-Rab5 puncta was relatively unchanged and (2) the fluorescent signal of the aggregates was always weaker than that of the puncta. It is more likely that these signals represent a fraction of mRFP-Rab5 proteins that localized to an unidentified structure, possibly the mitochondrial aggregate. At least 20 pyramidal neurons from more than two brains were analyzed for each condition. Scale bar, 10 μm.
Overexpression of Mfn1 or TRAK2-MBD did not disrupt cell viability and mitochondrial membrane potential
Alterations in mitochondrial distribution have been implicated in neurodegeneration (for review, see Sheng and Cai, 2012), which could confound the interpretation of our observations. To examine whether neurodegeneration occurs in our Mfn1 and TRAK2-MBD neurons, we immunostained the cells using an antibody against single-stranded DNA, an apoptotic marker. We found that virtually no nucleus was doubly labeled with EGFP and single-stranded DNA in the CP of E18.5, P3.5, and P7.5 cortices electroporated with Mfn1, of P3.5 and P7.5 cortices electroporated with TRAK2-MBD, or in any of the respective control cortices (>700 EGFP-positive cells from three or four brains at each age for each condition examined; data not shown). These results indicate that no neurodegeneration occurs in Mfn1 or TRAK2-MBD neurons during the first postnatal week.
Although no neurodegeneration occurred, mitochondrial function might still be disrupted. We therefore examined mitochondrial membrane potential, a critical parameter of mitochondrial function, using JC-1, a ratiometric dye whose emission shifts from green to red depending on the mitochondrial membrane potential (Reers et al., 1991). JC-1 was applied to dissociated culture that had been electroporated in utero with EBFP2 and either Mfn1 or TRAK2-MBD at E13.5–13.75. JC-1 signals were largely confined to the soma in both Mfn1 and TRAK2-MBD neurons (Fig. 6A–L), suggesting that both Mfn1 and TRAK2-MBD function in culture similarly to as they do in vivo. We found no significant difference in the membrane potential of mitochondria between control and Mfn1 neurons (Fig. 6A–F; the ratio of red to green fluorescence of JC-1 in control neurons, 1.00 ± 0.04; in Mfn1 neurons, 0.97 ± 0.05; p = 0.78), consistent with previous reports investigating the intact membrane potential of overfused mitochondria (Verstreken et al., 2005; Ishihara et al., 2009). Likewise, no significant difference was found in mitochondrial membrane potential between control and TRAK2-MBD neurons (Fig. 6G–L; the ratio in control neurons, 1.00 ± 0.06; in TRAK2-MBD neurons, 0.89 ± 0.03; p = 0.21). Similar results were obtained using other dyes, TMRM, and MitoTracker Green (the ratio of TMRM to MitoTracker Green signals in control neurons for Mfn1, 1.00 ± 0.09; in Mfn1 neurons, 1.12 ± 0.08; p = 0.21; in control neurons for TRAK2-MBD, 1.00 ± 0.07; in TRAK2-MBD neurons, 0.99 ± 0.07; p = 0.75). These results argue that overexpression of Mfn1 or TRAK2-MBD does not cause severe alterations in mitochondrial function.
Figure 6.

Overexpression of Mfn1 and TRAK2-MBD does not disrupt mitochondrial membrane potential. A–L, Cultured cortical neurons expressing EBFP2 (cyan) and stained with JC-1 (green and red). Neurons were dissociated at E18.5 from cortices electroporated in utero with a control mock vector for Mfn1 (A–C), Mfn1-expression vectors (D–F), control mock vector for TRAK2-MBD (G–I), or TRAK2-MBD-expression vector (J–L) at E13.5–E13.75 and cultured for 3 d followed by JC-1 application. Dotted lines represent the contour of EBFP2-labeled cells. Treatment with CCCP, an uncoupler of oxidative phosphorylation that dissipates mitochondrial potential, caused a significant reduction in the ratio of red to green fluorescence of JC-1 (untreated cells: 1.00 ± 0.04; CCCP-treated cells: 0.61 ± 0.01; p < 0.001), confirming that the ratio is a measure of the mitochondrial membrane potential. Scale bar, 20 μm.
The increase in dendritic branching by Mfn1 or TRAK2-MBD in dissociated culture
To gain insight into the mechanism underlying the increase in dendritic branching by Mfn1 or TRAK2-MBD, we first assessed the effects of the cortical environment on dendritic abnormalities. For this purpose, we examined the dendritic morphology of Mfn1 and TRAK2-MBD neurons in dissociated culture. The culture was prepared as described above, and dendrites were discriminated by the absence of SMI-312 immunoreactivity. Control neurons had multiple primary dendrites with a few branches, and mito-RFP signals were distributed within the dendrites (Fig. 7A–C). In both Mfn1 and TRAK2-MBD neurons, the number of branch points and the length of dendrites were markedly increased, while mito-RFP signals were largely confined to the soma (Fig. 7D–K). These results suggest that Mfn1 or TRAK2-MBD recapitulates the dendritic abnormalities found in vivo in dissociated culture, suggesting it is unlikely that dendritic abnormalities are caused by an altered cell-response to the cortical environment.
Figure 7.

Increase in dendritic branching by Mfn1 and TRAK2-MBD in dissociated culture. A–I, Cultured cortical neurons expressing EGFP and mito-RFP and stained with the SMI-312 antibody. The culture was maintained for 3 d, fixed, and followed by SMI-312 immunofluorescence. Arrowheads point to SMI-312-positive axons. J, K, Analysis of the dendritic morphology: (J) the number of dendritic branch points, (K) the length of dendrites; n = 26 cells for control; 21 cells for Mfn1; 27 cells for TRAK2-MBD. Scale bar, 20 μm. Error bars indicate SEM; **p < 0.01, ***p < 0.001, Mann–Whitney U test with Bonferroni correction (2 tests).
Using this culture system, we next explored the intracellular mechanisms that would link mitochondria to dendritic branching. For this, we focused on caspase signaling, since mitochondria activate caspases during programmed cell death by releasing pro-apoptotic factors (for review, see Youle and Strasser, 2008), and local caspase activation within dendritic processes promotes the removal of dendrites during pruning in Drosophila sensory neurons (Kuo et al., 2006; Williams et al., 2006). To examine whether pro-apoptotic factor release from mitochondria and caspase activation regulate dendritic branching during normal development, we applied an inhibitor of pro-apoptotic factor release, minocycline (Zhu et al., 2002; Wang et al., 2003), or a general caspase inhibitor, Z-VAD-FMK, to unmanipulated neurons. We found that treatment of minocycline or Z-VAD-FMK did not cause a significant change in the number of dendritic branch points (the number of branch points in vehicle-treated neurons, 3.95 ± 0.84; in minocycline-treated neurons, 2.75 ± 0.37; p = 0.67; in Z-VAD-FMK-treated neurons, 3.25 ± 0.63; p = 0.82). Thus, it is unlikely that caspases are the major mechanism that links mitochondria to dendritic branching.
Discussion
The negative influence of dendritic mitochondria on dendritic branching
Mitochondria have functions that potentially impact dendritic branching (for review, see Sheng and Cai, 2012), however, the involvement of dendritic mitochondria in this process has remained unexplored. In the present study, we found that mitochondria were preferentially targeted to the proximal portion of dendrites only during development. Depleting mitochondria from developing dendrites by overexpression of Mfn1 or TRAK2-MBD was accompanied by increased dendritic branching that was most evident in the proximal portion of the dendritic arbors. This dendritic abnormality is unlikely to be explained by alterations in the distribution of membrane trafficking organelles, because the distributions of the ER, Golgi, and endosomes were unchanged with Mfn1 overexpression. That neither cell viability nor mitochondrial potential was affected by overexpression of Mfn1 or TRAK2-MBD suggests it unlikely that the observed increased branching of dendrites was caused by neurodegeneration or altered mitochondrial function. Collectively, the most straightforward interpretation of our findings is that dendritic mitochondria negatively affect dendritic branching.
The negative influence of dendritic mitochondria on dendritic branching is supported by the finding that the mitochondrial redistribution in dendrites associates with a dissipation of the increased branching in mature TRAK2-MBD neurons. Furthermore, we found that mitochondria were not specifically localized at dendritic branch points during development, which contrasts the branch-point localization of Golgi outposts (Horton et al., 2005). A negative influence of mitochondria on neuronal morphogenesis has been seen before, as the depletion of mitochondria from the axon was accompanied by increased formation of presynaptic boutons (Guo et al., 2005).
The local action of dendritic mitochondria on dendritic branching
The negative influence of dendritic mitochondria on dendritic branching assumes a local action by the dendritic mitochondria within developing dendrites. This assumption is supported by the observed increased branching of dendrites caused by Mfn1 and TRAK2-MBD being most evident in the proximal portion of dendrites where mitochondria were concentrated during development. Moreover, enhancing mitochondrial transport into the distal portion of dendrites by overexpression of Drp1, which mediates mitochondrial fission (Smirnova et al., 2001), caused no obvious alteration in the morphology of the proximal portion of dendrites (T. Kimura and F. Murakami, unpublished data). Furthermore, it has been suggested that mitochondria locally regulate cellular processes such as synaptic vesicle mobilization and Ca2+ homeostasis (for review, see Rizzuto et al., 2012; Sheng and Cai, 2012), and that mitochondria locally affect the morphogenesis of axon terminals and dendritic spines (Guo et al., 2005; Li et al., 2004).
Possible mechanisms of the negative regulation of dendritic branching by dendritic mitochondria
The finding that Mfn1 or TRAK2-MBD caused a marked increase in dendritic branching in dissociated culture similar to the in vivo observations suggests that dendritic mitochondria negatively affect dendritic branching independently of the cortical environment, which further suggests the negative influence is not mediated by signaling pathways elicited by extrinsic molecules. Instead, it is more likely that the negative influence is mediated by signaling elicited by cell-intrinsic mechanisms of the dendritic development.
What specific function of mitochondria can explain this negative effect on dendritic branching? Three possible mechanisms can be speculated: ATP generation, Ca2+ buffering, and caspase activation. Among them, the most likely explanations involve Ca2+ buffering, which could lower the cytosolic Ca2+ level in dendrites and thereby could negatively regulate the Ca2+ signaling that promotes dendritic branching (for review, see Konur and Ghosh, 2005; Rizzuto et al., 2012). In contrast, other functions seem less likely because (1) ATP supply fuels cellular processes associated with dendritic branching such as cytoskeletal assembly (for review, see Sheng and Cai, 2012); (2) membrane trafficking organelles, which are transported by ATP-dependent motor proteins, were normally distributed in the dendrites of Mfn1 neurons; and (3) caspase inhibitors, Z-VAD-FMK and minocycline, did not cause significant changes in dendritic branch number in vitro. One might argue that reactive oxygen species (ROS), which are produced by mitochondria, might be involved in the regulation of dendritic branching, since ROS stimulate neuronal differentiation of PC12 cells (for review, see Kennedy et al., 2012). However, this seems less likely than Ca2+ buffering because the culture medium contained several ROS scavengers (see Materials and Methods; Brewer et al., 1993), which did not dissipate the increased dendritic branching caused by Mfn1 and TRAK2-MBD. Together, local Ca2+ buffering may be the most probable mechanism by which mitochondria affect dendritic branching.
Involvement of dendritic mitochondria in the regulation of dendritic arbor size
In addition to dendritic branching, mitochondria also appeared to affect another aspect of dendritic arbor development, the growth of dendritic arbor size. This conclusion is based on the finding that dendritic arbor size was consistently smaller in mature Mfn1 neurons than control neurons. Consistent with this phenotype, the average length of individual dendritic processes was significantly less upon the overexpression of Mfn1 or TRAK2-MBD (T. Kimura and F. Murakami, unpublished data). The dendritic mitochondria may support the expansion of the dendritic arbor size by promoting extension of individual dendritic processes.
Relevance to other studies
Previous reports have shown that a depletion of mitochondria from neurites is accompanied by a reduction in the neurite number of Mfn2-null cerebellar Purkinje cells (Chen et al., 2007) and of Drp1-null cultured forebrain neurons (Ishihara et al., 2009), suggesting a positive regulation of neurite branching by mitochondria. This discrepancy might be explained by neurodegeneration. Massive neurodegeneration occurred in both the Mfn2-null cerebellum (Chen et al., 2007) and Drp1-null forebrain (Ishihara et al., 2009) in the previous studies, whereas no appreciable cell death was detected in the present study. Thus, the lower neurite number reported previously could have been caused by a neurodegenerative process and not an altered distribution of mitochondria. The absence of neurodegeneration in the present study might be because our manipulations did not inhibit mitochondrial fusion and fission processes, both of which may be essential for neuronal survival.
A previous study has shown that depletion of mitochondria from dendrites is accompanied by no noticeable alterations in the dendritic branching pattern in cultured hippocampal neurons (Li et al., 2004). The reason for this discrepancy with our results might be attributed to a difference in the developmental stage when the mitochondrial distribution was manipulated. In the present study, the mitochondrial distribution was altered from the onset of dendritic development whereas previously it was altered at the stage when dendritic arbors were already elaborated (Li et al., 2004). It is known that the morphology of the dendritic arbors is highly dynamic during the early stages of development, but gradually stabilizes as development proceeds (for review, see Cline, 2001). Thus, an altered mitochondrial distribution could have a significant effect on the dendritic arbor morphology during early stages of development, but far less so at later stages when dendritic arbors stabilize.
In conclusion, the present study demonstrates that the loss of mitochondria in developing dendrites leads to a severe alteration of the dendritic arbor morphology. In contrast to an established role of mitochondria as a promoter of cell growth, our findings suggest that dendritic mitochondria play a negative role in dendritic branching. Therefore, the control of the mitochondrial distribution in developing neurons may be essential for the establishment of the precise branching pattern of dendritic arbors and resulting functional neural circuits.
Footnotes
This work was supported by a Grant-in-Aid for Scientific Research (KAKENHI, 22220004 and 23123511) from the Ministry of Education, Culture, Sports, Science, and Technology (Japan). We thank Dr. Jun-Ichi Miyazaki for the pCAGGS plasmid vector, Dr. Robert E. Campbell for EBFP2, Dr. Roger Y. Tsien for mCherry and tdTomato, Dr. Jennifer Lippincott-Schwartz for GalT-EGFP, Dr. Ari Helenius for mRFP-Rab5, Dr. Constance L. Cepko for ERT2CreERT2, Dr. Izumi Saito for the pCALNL5 plasmid vector, Dr. Yan Zhu for pCAG-tdTomato, and Mr. Yoshihisa Furukawa for pCAG-GalT-EGFP. We also thank Dr. Tadashi Uemura for critical comments on an early version of this manuscript and Drs. Yasuto Tanabe, Hiroaki Kobayashi, Yan Zhu, Kenta Yamauchi, and Peter Karagiannis for critical reading of this manuscript.
The authors declare no competing financial interests.
References
- Ai HW, Shaner NC, Cheng Z, Tsien RY, Campbell RE. Exploration of new chromophore structures leads to the identification of improved blue fluorescent proteins. Biochemistry. 2007;46:5904–5910. doi: 10.1021/bi700199g. [DOI] [PubMed] [Google Scholar]
- Brewer GJ, Torricelli JR, Evege EK, Price PJ. Optimized survival of hippocampal neurons in B27-supplemented Neurobasal, a new serum-free medium combination. J Neurosci Res. 1993;35:567–576. doi: 10.1002/jnr.490350513. [DOI] [PubMed] [Google Scholar]
- Brickley K, Stephenson FA. Trafficking kinesin protein (TRAK)-mediated transport of mitochondria in axons of hippocampal neurons. J Biol Chem. 2011;286:18079–18092. doi: 10.1074/jbc.M111.236018. [DOI] [PMC free article] [PubMed] [Google Scholar]
- Brickley K, Smith MJ, Beck M, Stephenson FA. GRIF-1 and OIP106, members of a novel gene family of coiled-coil domain proteins: association in vivo and in vitro with kinesin. J Biol Chem. 2005;280:14723–14732. doi: 10.1074/jbc.M409095200. [DOI] [PubMed] [Google Scholar]
- Chan DC. Mitochondria: dynamic organelles in disease, aging and development. Cell. 2006;125:1241–1252. doi: 10.1016/j.cell.2006.06.010. [DOI] [PubMed] [Google Scholar]
- Chandrasekaran K, Hazelton JL, Wang Y, Fiskum G, Kristian T. Neuron-specific conditional expression of a mitochondrially targeted fluorescent protein in mice. J Neurosci. 2006;26:13123–13127. doi: 10.1523/JNEUROSCI.4191-06.2006. [DOI] [PMC free article] [PubMed] [Google Scholar]
- Chen H, McCaffery JM, Chan DC. Mitochondrial fusion protects against neurodegeneration in the cerebellum. Cell. 2007;130:548–562. doi: 10.1016/j.cell.2007.06.026. [DOI] [PubMed] [Google Scholar]
- Cline HT. Dendritic arbor development and synaptogenesis. Curr Opin Neurobiol. 2001;11:118–126. doi: 10.1016/S0959-4388(00)00182-3. [DOI] [PubMed] [Google Scholar]
- Cole NB, Smith CL, Sciaky N, Terasaki M, Edidin M, Lippincott-Schwartz J. Diffusional mobility of Golgi proteins in membranes of living cells. Science. 1996;273:797–801. doi: 10.1126/science.273.5276.797. [DOI] [PubMed] [Google Scholar]
- Fliegel L, Burns K, MacLennan DH, Reithmeier RA, Michalak M. Molecular cloning of the high affinity calcium-binding protein (calreticulin) of skeletal muscle sarcoplasmic reticulum. J Biol Chem. 1989;264:21522–21528. [PubMed] [Google Scholar]
- Fransson S, Ruusala A, Aspenström P. The atypical Rho GTPases Miro-1 and Miro-2 have essential roles in mitochondrial trafficking. Biochem Biophys Res Commun. 2006;344:500–510. doi: 10.1016/j.bbrc.2006.03.163. [DOI] [PubMed] [Google Scholar]
- Gulledge AT, Kampa BM, Stuart GJ. Synaptic integration in dendritic trees. J Neurobiol. 2005;64:75–90. doi: 10.1002/neu.20144. [DOI] [PubMed] [Google Scholar]
- Guo X, Macleod GT, Wellington A, Hu F, Panchumarthi S, Schoenfield M, Marin L, Charlton MP, Atwood HL, Zinsmaier KE. The GTPase dMiro is required for axonal transport of mitochondria to Drosophila synapses. Neuron. 2005;47:379–393. doi: 10.1016/j.neuron.2005.06.027. [DOI] [PubMed] [Google Scholar]
- Hatanaka Y, Hisanaga S, Heizmann CW, Murakami F. Distinct migratory behavior of early- and late-born neurons derived from the cortical ventricular zone. J Comp Neurol. 2004;479:1–14. doi: 10.1002/cne.20256. [DOI] [PubMed] [Google Scholar]
- Horton AC, Rácz B, Monson EE, Lin AL, Weinberg RJ, Ehlers MD. Polarized secretory trafficking directs cargo for asymmetric dendrite growth and morphogenesis. Neuron. 2005;48:757–771. doi: 10.1016/j.neuron.2005.11.005. [DOI] [PubMed] [Google Scholar]
- Ishihara N, Nomura M, Jofuku A, Kato H, Suzuki SO, Masuda K, Otera H, Nakanishi Y, Nonaka I, Goto Y, Taguchi N, Morinaga H, Maeda M, Takayanagi R, Yokota S, Mihara K. Mitochondrial fission factor Drp1 is essential for embryonic development and synapse formation in mice. Nat Cell Biol. 2009;11:958–966. doi: 10.1038/ncb1907. [DOI] [PubMed] [Google Scholar]
- Jan YN, Jan LY. Branching out: mechanisms of dendritic arborization. Nat Rev Neurosci. 2010;11:316–328. doi: 10.1038/nrn2836. [DOI] [PMC free article] [PubMed] [Google Scholar]
- Kanegae Y, Lee G, Sato Y, Tanaka M, Nakai M, Sakaki T, Sugano S, Saito I. Efficient gene activation in mammalian cells by using recombinant adenovirus expressing site-specific Cre recombinase. Nucleic Acids Res. 1995;23:3816–3821. doi: 10.1093/nar/23.19.3816. [DOI] [PMC free article] [PubMed] [Google Scholar]
- Kennedy KA, Sandiford SD, Skerjanc IS, Li SS. Reactive oxygen species and the neuronal fate. Cell Mol Life Sci. 2012;69:215–221. doi: 10.1007/s00018-011-0807-2. [DOI] [PMC free article] [PubMed] [Google Scholar]
- Konur S, Ghosh A. Calcium signaling and the control of dendritic development. Neuron. 2005;46:401–405. doi: 10.1016/j.neuron.2005.04.022. [DOI] [PubMed] [Google Scholar]
- Kulkarni VA, Firestein BL. The dendritic tree and brain disorders. Mol Cell Neurosci. 2012;50:10–20. doi: 10.1016/j.mcn.2012.03.005. [DOI] [PubMed] [Google Scholar]
- Kuo CT, Zhu S, Younger S, Jan LY, Jan YN. Identification of E2/E3 ubiquitinating enzymes and caspase activity regulating Drosophila sensory neuron dendrite pruning. Neuron. 2006;51:283–290. doi: 10.1016/j.neuron.2006.07.014. [DOI] [PubMed] [Google Scholar]
- Li Z, Okamoto K, Hayashi Y, Sheng M. The importance of dendritic mitochondria in the morphogenesis and plasticity of spines and synapses. Cell. 2004;119:873–887. doi: 10.1016/j.cell.2004.11.003. [DOI] [PubMed] [Google Scholar]
- MacAskill AF, Brickley K, Stephenson FA, Kittler JT. GTPase dependent recruitment of Grif-1 by Miro1 regulates mitochondrial trafficking in hippocampal neurons. Mol Cell Neurosci. 2009;40:301–312. doi: 10.1016/j.mcn.2008.10.016. [DOI] [PubMed] [Google Scholar]
- Matsuda T, Cepko CL. Controlled expression of transgenes introduced by in vivo electroporation. Proc Natl Acad Sci U S A. 2007;104:1027–1032. doi: 10.1073/pnas.0610155104. [DOI] [PMC free article] [PubMed] [Google Scholar]
- Miller M. Maturation of rat visual cortex. I. A quantitative study of Golgi-impregnated pyramidal neurons. J Neurocytol. 1981;10:859–878. doi: 10.1007/BF01262658. [DOI] [PubMed] [Google Scholar]
- Misgeld T, Kerschensteiner M, Bareyre FM, Burgess RW, Lichtman JW. Imaging axonal transport of mitochondria in vivo. Nat Methods. 2007;4:559–561. doi: 10.1038/nmeth1055. [DOI] [PubMed] [Google Scholar]
- Morris RL, Hollenbeck PJ. The regulation of bidirectional mitochondrial transport is coordinated with axonal outgrowth. J Cell Sci. 1993;104:917–927. doi: 10.1242/jcs.104.3.917. [DOI] [PubMed] [Google Scholar]
- Munro S, Pelham HR. A C-terminal signal prevents secretion of luminal ER proteins. Cell. 1987;48:899–907. doi: 10.1016/0092-8674(87)90086-9. [DOI] [PubMed] [Google Scholar]
- Niwa H, Yamamura K, Miyazaki J. Efficient selection for high-expression transfectants with a novel eukaryotic vector. Gene. 1991;108:193–199. doi: 10.1016/0378-1119(91)90434-D. [DOI] [PubMed] [Google Scholar]
- Reers M, Smith TW, Chen LB. J-aggregate formation of a carbocyanine as a quantitative fluorescent indicator of membrane potential. Biochemistry. 1991;30:4480–4486. doi: 10.1021/bi00232a015. [DOI] [PubMed] [Google Scholar]
- Rizzuto R, Brini M, Pizzo P, Murgia M, Pozzan T. Chimeric green fluorescent protein as a tool for visualizing subcellular organelles in living cells. Curr Biol. 1995;5:635–642. doi: 10.1016/S0960-9822(95)00128-X. [DOI] [PubMed] [Google Scholar]
- Rizzuto R, De Stefani D, Raffaello A, Mammucari C. Mitochondria as sensors and regulators of calcium signalling. Nat Rev Mol Cell Biol. 2012;13:566–578. doi: 10.1038/nrm3412. [DOI] [PubMed] [Google Scholar]
- Santel A, Fuller MT. Control of mitochondrial morphology by a human mitofusin. J Cell Sci. 2001;114:867–874. doi: 10.1242/jcs.114.5.867. [DOI] [PubMed] [Google Scholar]
- Saotome M, Safiulina D, Szabadkai G, Das S, Fransson A, Aspenstrom P, Rizzuto R, Hajnóczky G. Bidirectional Ca2+-dependent control of mitochondrial dynamics by the Miro GTPase. Proc Natl Acad Sci U S A. 2008;105:20728–20733. doi: 10.1073/pnas.0808953105. [DOI] [PMC free article] [PubMed] [Google Scholar]
- Satoh D, Sato D, Tsuyama T, Saito M, Ohkura H, Rolls MM, Ishikawa F, Uemura T. Spatial control of branching within dendritic arbors by dynein-dependent transport of Rab5-endosomes. Nat Cell Biol. 2008;10:1164–1171. doi: 10.1038/ncb1776. [DOI] [PubMed] [Google Scholar]
- Shaner NC, Campbell RE, Steinbach PA, Giepmans BN, Palmer AE, Tsien RY. Improved monomeric red, orange and yellow fluorescent proteins derived from Discosoma sp. red fluorescent protein. Nat Biotechnol. 2004;22:1567–1572. doi: 10.1038/nbt1037. [DOI] [PubMed] [Google Scholar]
- Sheng ZH, Cai Q. Mitochondrial transport in neurons: impact on synaptic homeostasis and neurodegeneration. Nat Rev Neurosci. 2012;13:77–93. doi: 10.1038/nrg3141. [DOI] [PMC free article] [PubMed] [Google Scholar]
- Smirnova E, Griparic L, Shurland DL, van der Bliek AM. Dynamin-related protein Drp1 is required for mitochondrial division in mammalian cells. Mol Biol Cell. 2001;12:2245–2256. doi: 10.1091/mbc.12.8.2245. [DOI] [PMC free article] [PubMed] [Google Scholar]
- Spruston N. Pyramidal neurons: dendritic structure and synaptic integration. Nat Rev Neurosci. 2008;9:206–221. doi: 10.1038/nrn2286. [DOI] [PubMed] [Google Scholar]
- van Spronsen M, Mikhaylova M, Lipka J, Schlager MA, van den Heuvel DJ, Kuijpers M, Wulf PS, Keijzer N, Demmers J, Kapitein LC, Jaarsma D, Gerritsen HC, Akhmanova A, Hoogenraad CC. TRAK/Milton motor-adaptor proteins steer mitochondrial trafficking to axons and dendrites. Neuron. 2013;77:485–502. doi: 10.1016/j.neuron.2012.11.027. [DOI] [PubMed] [Google Scholar]
- Verstreken P, Ly CV, Venken KJ, Koh TW, Zhou Y, Bellen HJ. Synaptic mitochondria are critical for mobilization of reserve pool vesicles at Drosophila neuromuscular junctions. Neuron. 2005;47:365–378. doi: 10.1016/j.neuron.2005.06.018. [DOI] [PubMed] [Google Scholar]
- Vonderheit A, Helenius A. Rab7 associates with early endosomes to mediate sorting and transport of Semliki forest virus to late endosomes. PLoS Biol. 2005;3:e233. doi: 10.1371/journal.pbio.0030233. [DOI] [PMC free article] [PubMed] [Google Scholar]
- Wang X, Zhu S, Drozda M, Zhang W, Stavrovskaya IG, Cattaneo E, Ferrante RJ, Kristal BS, Friedlander RM. Minocycline inhibits caspase-independent and -dependent mitochondrial cell death pathways in models of Huntington's disease. Proc Natl Acad Sci U S A. 2003;100:10483–10487. doi: 10.1073/pnas.1832501100. [DOI] [PMC free article] [PubMed] [Google Scholar]
- Williams DW, Kondo S, Krzyzanowska A, Hiromi Y, Truman JW. Local caspase activity directs engulfment of dendrites during pruning. Nat Neurosci. 2006;9:1234–1236. doi: 10.1038/nn1774. [DOI] [PubMed] [Google Scholar]
- Wong RO, Ghosh A. Activity-dependent regulation of dendritic growth and patterning. Nat Rev Neurosci. 2002;3:803–812. doi: 10.1038/nrn941. [DOI] [PubMed] [Google Scholar]
- Ye B, Zhang Y, Song W, Younger SH, Jan LY, Jan YN. Growing dendrites and axons differ in their reliance on the secretory pathway. Cell. 2007;130:717–729. doi: 10.1016/j.cell.2007.06.032. [DOI] [PMC free article] [PubMed] [Google Scholar]
- Youle RJ, Strasser A. The BCL-2 protein family: opposing activities that mediate cell death. Nat Rev Mol Cell Biol. 2008;9:47–59. doi: 10.1038/nrm2308. [DOI] [PubMed] [Google Scholar]
- Zheng Y, Wildonger J, Ye B, Zhang Y, Kita A, Younger SH, Zimmerman S, Jan LY, Jan YN. Dynein is required for polarized dendritic transport and uniform microtubule orientation in axons. Nat Cell Biol. 2008;10:1172–1180. doi: 10.1038/ncb1777. [DOI] [PMC free article] [PubMed] [Google Scholar]
- Zhu S, Stavrovskaya IG, Drozda M, Kim BY, Ona V, Li M, Sarang S, Liu AS, Hartley DM, Wu DC, Gullans S, Ferrante RJ, Przedborski S, Kristal BS, Friedlander RM. Minocycline inhibits cytochrome c release and delays progression of amyotrophic lateral sclerosis in mice. Nature. 2002;417:74–78. doi: 10.1038/417074a. [DOI] [PubMed] [Google Scholar]