Abstract
Copy number variants (CNVs) of the chromosomal locus 16p11.2, consisting of either deletions or duplications, have been implicated in autism, schizophrenia, epilepsy, and other neuropsychiatric disorders. Since abnormal white matter microstructure can be seen in these more broadly defined clinical disorders, we used diffusion magnetic resonance imaging and tract-based spatial statistics to investigate white matter microstructural integrity in human children with 16p11.2 deletions. We show that deletion carriers, compared with typically developing matched controls, have increased axial diffusivity (AD) in many major central white matter tracts, including the anterior corpus callosum as well as bilateral internal and external capsules. Higher AD correlated with lower nonverbal IQ in the deletion carriers, but not controls. Increases in fractional anisotropy and mean diffusivity were also found in some of the same tracts with elevated AD. Closer examination with neurite orientation dispersion and density imaging revealed that fiber orientation dispersion was decreased in some central white matter tracts. Notably, these alterations of white matter are unlike microstructural differences reported for any other neurodevelopmental disorders, including autism spectrum disorders that have phenotypic overlap with the deletion carriers. These findings suggest that deletion of the 16p11.2 locus is associated with a unique widespread pattern of aberrant white matter microstructure that may underlie the impaired cognition characteristic of this CNV.
Keywords: autism, copy number variants, diffusion tensor imaging, genetics, magnetic resonance imaging, neurodevelopmental disorders
Introduction
Investigating the interplay between genes, brain, and behavior is a rapidly expanding area as recent developments in noninvasive brain imaging and human genetics afford the necessary tools to pursue such scientific inquiry. This field is only at its nascent stage and there are myriad specific genetic variants with associated common behavioral alterations that have yet to be studied. However, early findings suggest that genetics may be more proximally linked to brain structural imaging findings than to the downstream cognitive/behavioral phenotype that may be influenced by multiple factors. One common genetic variant, the reciprocal 600 kb deletion/duplication of 16p11.2, is strongly associated with autism, schizophrenia, epilepsy, and other neurodevelopmental disorders (Christian et al., 2008; Weiss et al., 2008; McCarthy et al., 2009; Jacquemont et al., 2011; Zufferey et al., 2012). Children with 16p11.2 deletions tend to have relative macrocephaly, increased adiposity, and lower than average IQ. Eighty percent exhibit neurodevelopmental or psychiatric diseases, including 15% diagnosed with autistic spectrum disorders (ASDs; Zufferey et al., 2012).
Little is known about the effect of the 16p11.2 deletion on the structure of the brain. Initial reports of macrocephaly in mice and zebrafish with deletions of the orthologous regions to 16p11.2 attribute the increased brain volume to increased proliferation and to decreased apoptosis (Horev et al., 2011; Golzio et al., 2012). The effect on white matter microstructure in these animal models is not yet known, but there is evidence from diffusion magnetic resonance (MR) imaging studies in neurodevelopmental disorders for changes to white matter microstructure. A specific deletion at chromosome 7q11.23, known as Williams syndrome, is known to affect white matter microstructure and results in a stereotypical behavioral phenotype (Hoeft et al., 2007; Haas et al., 2013). In addition, multiple diffusion MR imaging studies in children with ASD report alterations to white matter compared with typically developing children (Ben Bashat et al., 2007; Cheng et al., 2010; Weinstein et al., 2011; Travers et al., 2012; Wolff et al., 2012). Decreased white matter microstructural integrity has been reported in velocardiofacial syndrome, which is caused by a deletion on chromosome 22q11.2 (Barnea-Goraly et al., 2003).
Given the evidence from the literature, we hypothesize that the white matter microstructure will be affected in children with recurrent ∼600 kb (BP4–BP5) 16p11.2 deletions. We postulate that there will be a diffuse, nonspecific alteration to the white matter microstructure based on the finding that 16p11.2 deletion carriers are profoundly and pervasively affected across multiple cognitive domains, including verbal IQ, nonverbal IQ (NVIQ), executive function, and spatial working memory, as well as more general assessments of function (Stefansson et al., 2014). Here, we use diffusion MR imaging in a cohort of children enrolled as part of the multicenter Simons Foundation Variation in Individuals Project (Simons VIP Consortium, 2012; approved researchers can obtain the Simons VIP population dataset described in this study by contacting the Simons Foundation Autism Research Initiative) to detect changes in white matter integrity using conventional and exploratory data analysis tools; specifically, diffusion tensor imaging (DTI) and neurite orientation dispersion and density imaging (NODDI), respectively.
Materials and Methods
Study subjects
Twenty-three children (12 males and 11 females) ages 8–16 years were recruited into the study as part of a multicenter study of 16p11.2 deletion carriers, along with 23 age-matched, gender-matched, and handedness-matched typically developing control subjects. Twelve deletion carriers and 18 healthy controls were recruited, tested, and imaged at the University of California (UC) and the remainder at the Children's Hospital of Philadelphia (CHOP). The cognitive testing was performed at UC San Francisco, but the MR imaging was performed at UC Berkeley to match scanner manufacturer and model with CHOP. All children were administered the Differential Ability Scales—Early Years & School Age (DAS-II) Intelligence Test for Children (WISC), from which full-scale IQ (FSIQ) and NVIQ subscores were used for further analysis. All study procedures were approved by the institutional review boards at our medical centers and are in accordance with the ethical standards of the Helsinki Declaration of 1975, as revised in 2008.
Image acquisition
All MR imaging was performed on 3 T Tim Trio MR scanners (Siemens), one at each of the two sites, using 32-channel phased-array radio-frequency head coils. High-resolution structural MR imaging of the brain was performed with an axial 3D magnetization-prepared rapid acquisition gradient-echo (MPRAGE) T1-weighted sequence (TE, 1.64 ms; TR, 2530 ms; TI, 1200 ms; flip angle, 7°) with a 256 mm FOV, and 160 1.0 mm contiguous partitions at a 256 × 256 matrix.
Whole-brain diffusion-weighted images were collected at b = 1000 s/mm2 with 30 directions and b = 3000 s/mm2 with 64 directions. Both diffusion weightings were acquired with multislice 2D single-shot spin-echo echo-planar imaging, with monopolar gradients using a work-in-progress (WIP) diffusion pulse sequence. The WIP pulse sequence used has advanced capabilities provided for research by the MR vendor that is not yet released for commercial use. The integrated parallel acquisition technique for parallel imaging was used (reduction factor, 2; number of excitations, 1; interleaved 2 mm axial sections with no gap; in-plane resolution, 2 × 2 mm with a 128 × 128 matrix; field of view, 256 mm. The TE and TR were slightly different for the two diffusion weightings: for b = 1000 s/mm2, TE/TR = 80/10,000 ms; for b = 3000 s/mm2, TE/TR = 119/13,900 ms. Additional brain volumes were acquired with no diffusion weighting (b = 0 s/mm2) at both TE/TR values. The total acquisition time for diffusion imaging was ∼20 min. The b = 1000 s/mm2 data were used for the DTI analysis and both the b = 1000 s/mm2 and b = 3000 s/mm2 data were used for the NODDI analysis described below.
Structural MR imaging analysis
FreeSurfer 5.1.0 was used to obtain the supratentorial volume (STV) for each subject's brain from the 3D T1-weighted MPRAGE images (Fischl 2012). The MPRAGE images were also interpreted for structural abnormalities by an attending pediatric neuroradiologist certified by the American Board of Radiology.
DTI analysis
Preprocessing.
The diffusion-weighted images were corrected for motion and eddy currents using Functional Magnetic Resonance Imaging of the Brain's (FMRIB's) Linear Image Registration Tool (www.fmrib.ox.ac.uk/fsl/flirt) with 12-parameter linear image registration (Jenkinson et al., 2002). All diffusion-weighted volumes were registered to the reference b = 0 s/mm2 volume. To evaluate subject movement, we calculated a scalar parameter quantifying the transformation of each diffusion volume to the reference. A heteroscedastic two-tailed Student's t test verified that there were no significant differences between child deletions and control groups in the average movement during the DTI scan (p = 0.79). The nonbrain tissue was removed using the Brain Extraction Tool (http://www.fmrib.ox.ac.uk/analysis/research/bet). Fractional anisotropy (FA), mean diffusivity (MD), axial diffusivity (AD), and radial diffusivity (RD) were calculated using FMRIB's Software Library's (FSL's) DTIFit.
Tract-based spatial statistics analysis of DTI.
Using tract-based spatial statistics (TBSS) in FSL (Smith et al., 2006), FA maps from all subjects were aligned to the FA map of the most representative subject. This procedure is recommended for children because the standard FA template is derived from adults. Once all subjects were registered, the FA maps were thinned using FA > 0.2 to create a skeleton of the white matter. Then, skeletonized MD, AD, and RD maps were created and registered to the most representative subject found with the FA maps. Two contrasts, controls > deletions and deletions > controls, were used to assess for group differences for each DTI parameter. For statistical inferences on white matter microstructural parameters, we used the “randomize” function from FSL, which is based on nonparametric permutation testing and allows for cluster-level inference when the threshold-free cluster enhancement (TFCE) approach is used (Smith and Nichols, 2009). We added NVIQ and scan site (the latter as a dichotomous variable: UC vs CHOP) as nuisance regressors to the statistical model, since the deletions and controls were not matched for these two features. The resulting maps for each comparison were corrected for multiple voxelwise comparisons with TFCE using a significance threshold of p < 0.05 (p < 0.025 for each tail of the two-tailed test). Due to the known head size increase in the 16p11.2 deletion group compared with the healthy controls, we added STV as a nuisance regressor along with NVIQ and scan site (UC vs CHOP) to the model to form a secondary analysis. The anatomic locations of white matter regions corresponding to statistically significant voxels were determined from the Johns Hopkins University (JHU) ICBM-DTI-81 White-Matter Labeled Atlas and the JHU White-Matter Tractography Atlas, both available for MNI152 space in FSL (Mori et al., 2008). All white matter region identifications were verified by Dr. Pratik Mukherjee, a board-certified pediatric neuroradiologist with >15 years of experience in clinical and research applications of DTI.
Multicompartment biophysical modeling of diffusion MR imaging
While an insightful and widely used technique, DTI (i.e., fitting a single tensor to the diffusion profile of every voxel) has some clear limitations. First, it is only a justifiable model when there is only one fiber population in a voxel, an assumption that does not hold true for the entirety of the white matter. Second, the parameters of the tensor (e.g., FA, RD, AD, and MD) give us only an indirect assessment of white matter microstructure and it is difficult to relate changes in these parameters to changes in the configuration and properties of the underlying neurons. Third, there is a large degree of colinearity in the DTI parameters, making it somewhat redundant to use all four parameters derived from the tensor. There are more complex, biophysical models of white matter microstructure available; with two different b values, each with large numbers of diffusion-weighted directions, it is possible to fit such a model to the diffusion MR imaging data. We chose to employ the NODDI method (Zhang et al., 2012). This model describes three microstructural environments: intracellular, extracellular, and CSF. Diffusion in the intracellular compartment is restricted, diffusion in the extracellular compartment is hindered, and diffusion in CSF is free and isotropic. As such, diffusion in the various compartments can be modeled separately. Three parameters can be obtained from the NODDI fitting procedure: orientation dispersion index (ODI), intracellular volume fraction (FICV), and the isotropic volume fraction (FISO). ODI, first described by Zhang et al. (2011), is a measure of the orientation dispersion or the degree to which the neurites, specifically axonal fibers in white matter, have an incoherent orientation distribution in a particular voxel. FICV is the fraction of the tissue compartment that is intracellular, as opposed to extracellular, and is thought to be proportional to the neurite density. FISO is the fraction of the voxel that has isotropic diffusion and therefore is believed to represent CSF. Increased CSF volume fraction in tissue could be related to inflammation, edema, and/or atrophy, among other pathological processes. These parameters are more biologically interpretable since they correspond to specific axonal characteristics, as opposed to the directional diffusivities (FA, AD, RD, and MD) derived from the DTI model. Given that there is no isotropic diffusion in white matter, we do not anticipate finding statistical differences with the FISO parameter, but include it to confirm this assumption.
The NODDI code was modified per the developers' recommendation to account for the differing TE/TR times between the b = 1000 s/mm2 and b = 3000 s/mm2 acquisitions. This modification entailed fitting the model to the normalized diffusion-weighted images instead of the raw diffusion-weighted images. The diffusion-weighted images at each high b value were normalized by the b = 0 s/mm2 images acquired with the same TE/TR scan parameters. As done with the MD, AD, and RD maps, the ODI, FICV, and FISO parameter maps were aligned to the most representative subject using the registrations computed for the FA maps. Then, two contrasts, controls > deletions and deletions > controls, were used to assess for group differences with the FSL randomize function for each NODDI parameter, and with NVIQ and study site as nuisance regressors. The resulting maps for each comparison were corrected for multiple voxelwise comparisons with TFCE, using a significance threshold of p < 0.025 for each tail of the two-tailed test. Two deletion carriers did not have high-quality data at b = 3000 s/mm2 and were excluded from the NODDI analysis, resulting in a comparison of 21 deletion carriers to 21 matched controls. As with the DTI metrics, we performed a secondary analysis with STV in addition to NVIQ and site as nuisance regressors.
Post hoc tractography analysis
To confirm our TBSS results for the DTI parameters, we targeted four regions with significantly elevated FA and AD within the white matter skeleton. We qualitatively identified the white matter tracts with the largest clusters of significant voxels as the bilateral internal and external capsules. To generate regions of interest (ROIs) for these white matter regions, we used manual fiber tractography performed in each subject's native space. Seed masks were generated on coronal sections through the tracts of interest and coronal planes delineating the superior and inferior extent of the internal/external capsules were used as termination masks. Bedpostx and probtrackx from FSL (Behrens et al., 2007) were used to perform the tractography. With this methodology, we generated ROIs extending through multiple planes of the FA/AD map. The tractography results were binarized and used as a mask to calculate mean FA/AD in each ROI. We then assessed for group differences in mean FA and mean AD for each ROI using a nonparametric permutation test with (1) NVIQ and site and (2) NVIQ, site, and STV as nuisance regressors, as performed in the TBSS analyses. We denote differences at three statistical thresholds: p < 0.05, p < 0.01, and p < 0.001. For quality control of the manual tractography, we visually inspected each binarized mask and we used a two-tailed Student's t test (p < 0.05) to confirm that the tract volumes were the same between groups.
Correlation with cognition
To assess for global effects of white matter microstructure on general cognition, we tested for an association between whole-brain white matter AD and NVIQ in the deletion carriers and also in the controls. We chose NVIQ because the deletion carriers were closer to the normal range than for verbal IQ or FSIQ. We selected AD because, of all the DTI metrics, it showed the most extensive group differences between deletion carriers and controls. Global values of AD for each subject were obtained by averaging over each skeletonized whole-brain AD map. Global AD was then correlated with NVIQ in the deletion carriers and in the control subjects.
Results
Demographic, clinical, and MR imaging results
Demographic, IQ, and STV data for the case and control cohorts are provided in Table 1, with p values from two-tailed heteroscedastic Student's t tests. As expected, FSIQ and NVIQ were both significantly lower and STV was significantly higher in the deletion carriers than the controls.
Table 1.
Subject characteristics
| Controls (n = 23) | Deletions (n = 23) | p value | |
|---|---|---|---|
| Age | 12.5 ± 2.2 years | 11.6 ± 2.1 years | 0.17 |
| Gender | 12 male; 11 female | 12 male; 11 female | 1 |
| Handedness | 18 right; 5 left | 16 right; 6 left; 1 ambidextrous | 0.50 |
| FSIQ | 109 ± 12 | 88 ± 13 | <0.000001 |
| NVIQ | 104 ± 11 | 93 ± 13 | <0.002 |
| STV from FreeSurfer | 1090 ± 103 cm3 | 1210 ± 125 cm3 | <0.001 |
Neuropsychological diagnoses based on clinical assessment of the 23 16p11.2 deletion carriers are given in Table 2. These disorders were fairly well distributed among the carriers: 1 had no diagnoses, 18 had 1–3 diagnoses, and 4 had 4–5 diagnoses. The extensive neuropsychological testing was not performed on the 23 healthy controls recruited for this study. However, based on self-report, one control had an attention deficit hyperactivity disorder diagnosis previous to enrolling in the study. Based on clinician interaction and cognitive testing during this study, one control was suspected to have a learning disorder, but this was not confirmed with an official diagnosis.
Table 2.
Diagnoses in the deletion carriersa
| Disorder | Number of deletion carriers |
|---|---|
| Attention deficit hyperactivity disorder | 4 |
| Anxiety/obsessive-compulsive disorder/phobia | 2 |
| Articulation disorder | 11 |
| Behavioral disorder | 3 |
| ASD | 3 |
| Coordination disorder | 7 |
| Enuresis | 6 |
| Language disorder | 6 |
| Learning disorder | 2 |
| Mood disorder | 1 |
| Intellectual disability | 4 |
| Stereotyped motor disorder | 1 |
| Tic/tourette's | 1 |
aEach carrier could have more than one diagnosis.
Evaluation of the 3D T1-weighted MPRAGE images by a board-certified pediatric neuroradiologist showed no supratentorial structural abnormalities in any of the deletion carriers or control subjects. Eight of the 23 deletion carriers, but none of the controls, exhibited descent of the cerebellar tonsils below the foramen magnum. This is known to be a common anatomic variant in 16p11.2 deletion syndrome (Zufferey et al., 2012). One of the controls had an incidental small arachnoid cyst of the posterior fossa without significant mass effect. These minor structural variants of the hindbrain were not felt to affect the results of the DTI analyses reported below, since the group differences seen between deletion carriers and controls were located almost exclusively in the supratentorial compartment.
TBSS analysis of FA, MD, and AD
We found extensive regions of elevated FA, MD, and AD throughout the supratentorial white matter of deletion carriers compared with controls (Fig. 1), with NVIQ and scan location as nuisance regressors in the TBSS analysis. In the top row, regions with significantly increased FA of deletion carriers versus controls include the body of the corpus callosum (BCC), bilateral superior corona radiata (SCR), and bilateral posterior limb of the internal capsule (PLIC). In the middle row, widespread increases in AD are observed throughout much of the supratentorial white matter and some brainstem tracts (corticospinal tract and pontine crossing fibers). For AD, the posterior BCC, the posterior splenium of the corpus callosum (SCC), and the optic radiations are largely spared. White matter regions with significantly elevated AD also exhibited significantly elevated MD (bottom row), with the major exceptions of the corpus callosum and the brainstem.
Figure 1.
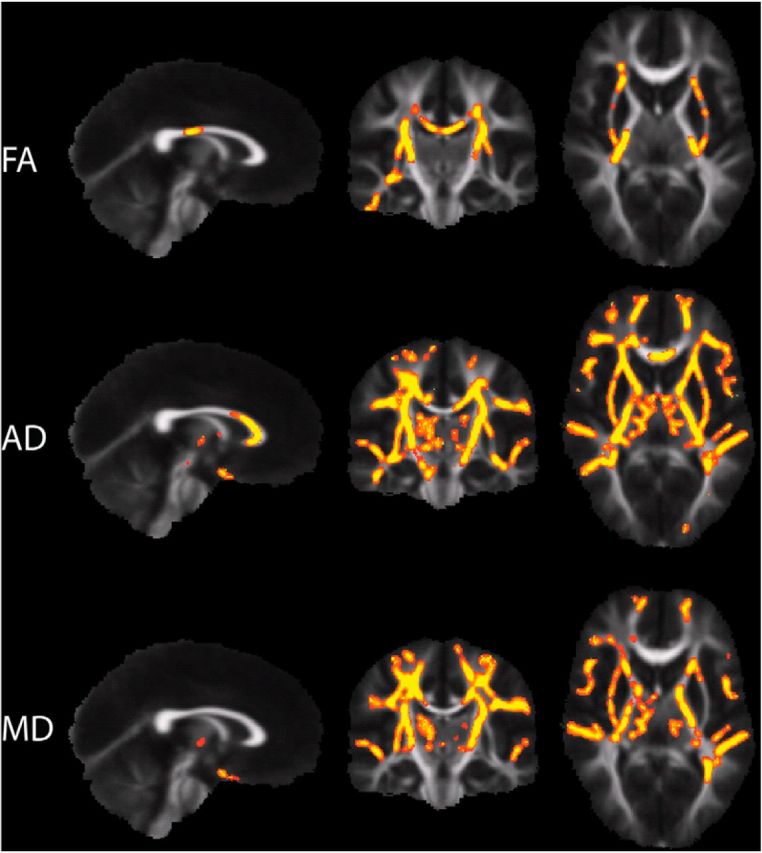
White matter regions with significantly increased FA (top), AD (middle), and MD (bottom) in 16p11.2 deletions carriers (n = 23), compared with the healthy controls (n = 23), are displayed in red in a red-to-yellow color scale (p < 0.025). The results reflect using NVIQ and site as nuisance regressors in the TBSS analysis.
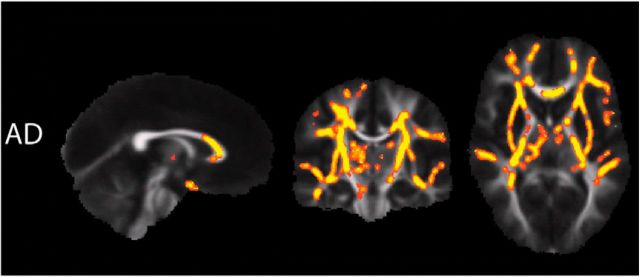
When STV is added as a nuisance regressor to the TBSS analysis, only the increases in AD continue to survive multiple-comparisons correction with TFCE, as depicted in Figure 2. Many of the voxel clusters in the supratentorial white matter with increased AD without the STV regression are still significantly elevated with the STV regression. The brainstem clusters, however, do not survive this additional regression. We did not detect statistically significant changes of RD, nor did we find decreases in any of the DTI parameters that survived multiple-comparison correction with TFCE.
Figure 2.
White matter regions with increased AD in 16p11.2 deletion carriers (n = 23), compared with the healthy controls (n = 23), are displayed in red-to-yellow color scale (p < 0.025). The results reflect using NVIQ, site, and STV as nuisance regressors in the TBSS analysis.
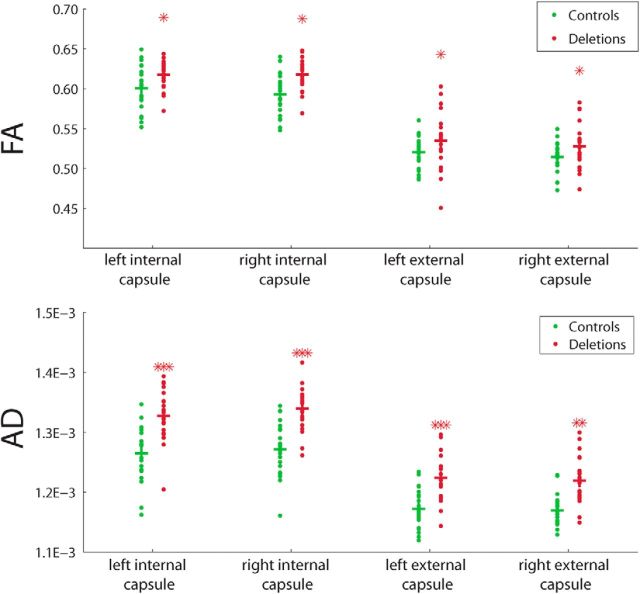
In the confirmatory tractography-based analysis, we find elevated FA and AD in four major white matter tracts implicated in the TBSS analysis (Fig. 3). The p values provided in Figure 3 are from using NVIQ and site as regressors. FA and AD are significantly elevated (at least p < 0.05) in both the internal and external capsules. The group differences in AD and in FA of the internal capsules retain significance after regression of STV, while FA of the external capsules is no longer significant following STV regression.
Figure 3.
Post hoc tractographic measurements of FA and AD in four ROIs: the bilateral internal/external capsules. Top, Results for FA. Bottom, Results for AD. For all ROIs, deletions were significantly higher than the controls; one star denotes p < 0.05, two stars denote p < 0.01, and three stars denote p < 0.001.
In another post hoc analysis, we extracted the mean FA and AD from the significant voxels in the eight most affected tracts of the TBSS results. The masks used to calculate the mean in each tract were determined separately for FA and AD using the group statistics with NVIQ, site, and STV nuisance regressors. The mean of the voxels with significantly increased FA were plotted against age in the BCC, SCC, bilateral anterior corona radiata (ACR), bilateral SCR, and bilateral posterior corona radiata (PCR) in Figure 4. The linear trend lines for the deletion carriers and controls are plotted as well. An ANCOVA analysis did not detect any statistically significant difference in slope between the two groups. In general, all tracts show a positive trend between FA and age, as expected in the developing brain (Mukherjee et al., 2001; Yoshida et al., 2013). The mean of the voxels with significantly increased AD were plotted against age in the BCC, genu of the corpus callosum (GCC), bilateral ACR, bilateral SCR, and bilateral PCR in Figure 5. As with FA, the linear trend lines are displayed for both groups and there were no statistically significant differences in slope. The variation of AD with age is much weaker than for FA in major white matter tracts, consistent with the DTI literature from children and adolescents (Mukherjee et al., 2002; Yoshida et al., 2013). These plots demonstrate that there is not a different trajectory of development in the deletion carriers compared with controls; rather, there is an offset in the FA and AD seen across all ages.
Figure 4.
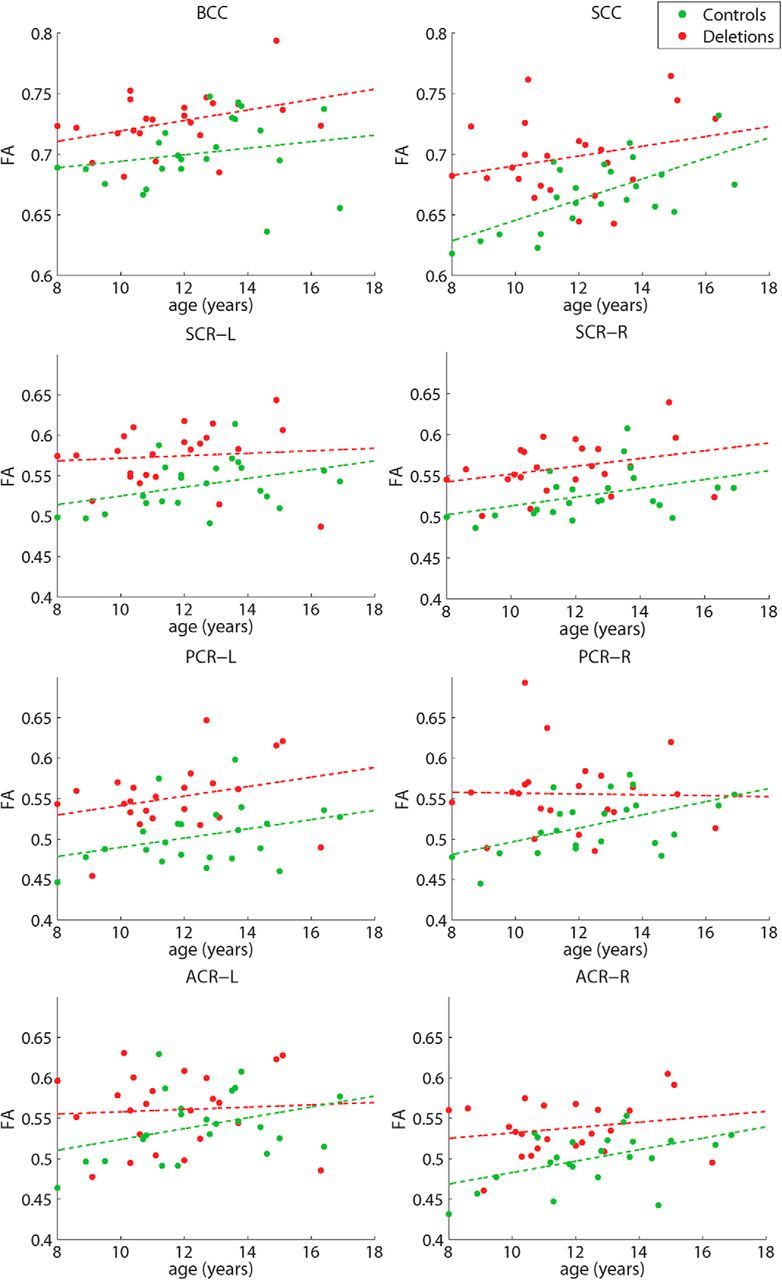
Plots of mean FA in the eight most-affected tracts versus age for the deletion carriers (red) and controls (green) with linear trend lines.
Figure 5.
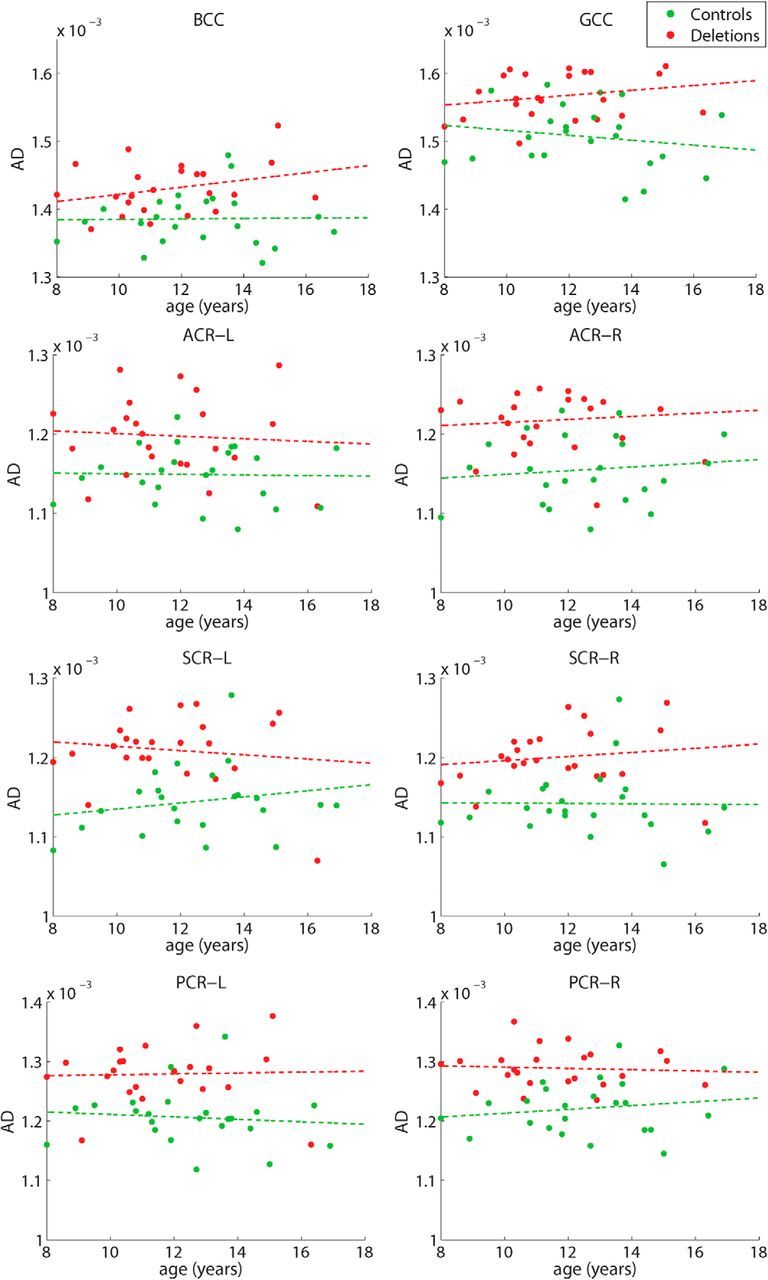
Plots of mean AD in the eight most-affected tracts versus age for the deletion carriers (red) and controls (green) with linear trend lines.
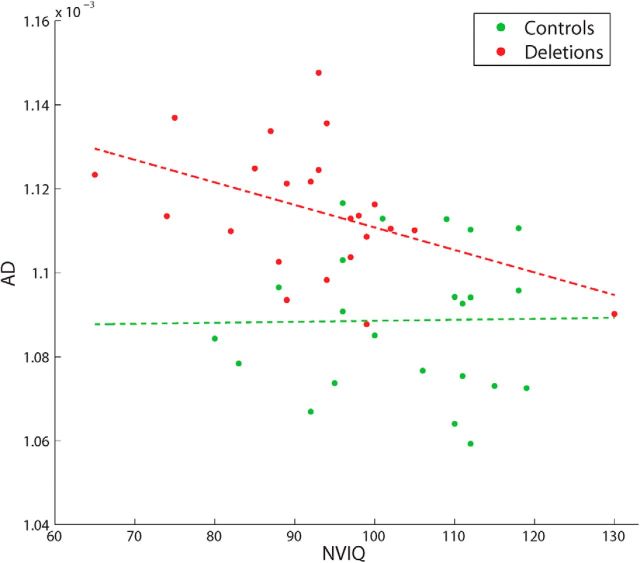
Associating white matter microstructure with general cognition, we find that the deletion carriers demonstrate a significant negative correlation (r = −0.44, p < 0.05) between global AD and NVIQ, while the controls do not (Fig. 6).
Figure 6.
Correlation between global AD and NVIQ for deletion carriers and for controls. The Pearson's correlation coefficient between global AD and NVIQ for the deletion carriers is −0.44 with p < 0.05. There is no significant correlation between global AD and NVIQ for the controls.
TBSS analysis of NODDI: analysis of orientation dispersion in white matter tracts
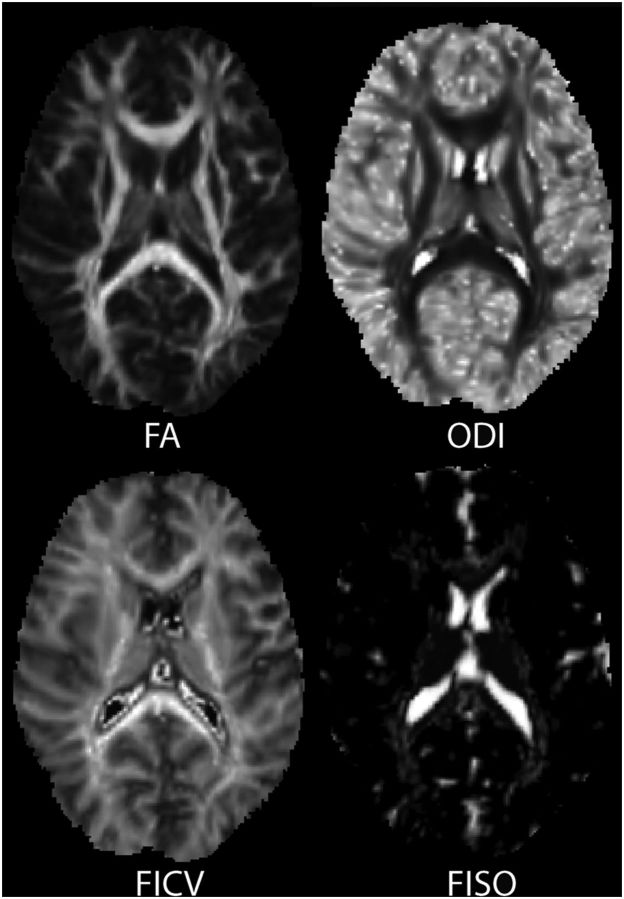
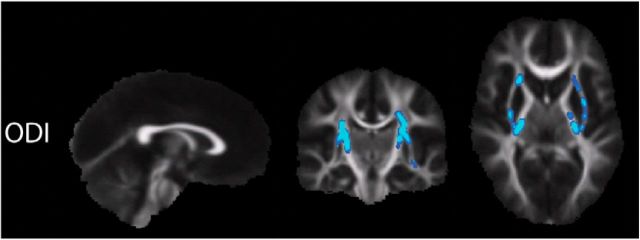
Using NODDI, we extract ODI, FICV, and FISO for each white matter tract. Example parameter maps of ODI, FICV, and FISO from NODDI are displayed in Figure 7, with comparison to an FA map from DTI. Statistically significant results from TBSS analysis of the NODDI parameters are shown in Figure 8. Comparing the deletion carriers to controls, we found significantly reduced ODI, with NVIQ and site regressed out, in bilateral PCR, bilateral PLIC, bilateral SCR, bilateral external capsules, and left inferior fronto-occipital fasciculus. When STV was added as a regressor, these changes no longer withstood multiple-comparisons corrections with TFCE. We did not find any statistically significant group differences in FICV or FISO, the latter as hypothesized due to the largely anisotropic diffusion in white matter.
Figure 7.
Example axial slices of the parameter maps: FA, ODI, FICV, and FISO. The images are scaled from 0 to 1 with bright voxels being closest to 1.
Figure 8.
White matter tracts with significantly decreased ODI in the 16p11.2 deletion carriers (n = 21), compared with the healthy controls (n = 21), are shown in blue color scale (p < 0.025).
Discussion
White matter microstructure in 16p11.2 deletion syndrome
This is the first study to report widespread alterations of white matter microstructure in children with 16p11.2 microdeletions, compared with typically developing children. One of the 29 genes at the 16p11.2 locus, KCTD13, has been reported to cause microcephaly when overexpressed and macrocephaly when suppressed in zebrafish (Golzio et al., 2012). KCTD13 encodes the potassium channel tetramerization domain 13, which interacts with the proliferating cell nuclear antigen 27, suggesting a role in the cell cycle during neurogenesis. Another gene in the locus, TAOK2, is important for elaboration of axons and formation of basal dendrites in cortical pyramidal neurons and may also contribute to the observed brain changes (de Anda et al., 2012). Interestingly, the white matter abnormalities found in these children with 16p11.2 deletion syndrome were characterized by elevated FA and AD, rather than the decreased FA and increased RD that are typical of the vast majority of neurological and psychiatric disorders that have been investigated with DTI, such as dyslexia, schizophrenia, and Alzheimer's disease (Chanraud et al., 2010). The increases in AD were seen throughout much of the supratentorial white matter and correlated with lower NVIQ in the deletion carriers. Most of these AD changes were robust to correction for differing brain sizes across the two groups, as measured by STV. We confirmed the TBSS findings with a tractography-based analysis in each subject's native space. This independent analysis demonstrates that the results were not driven by intersubject registration errors or other potential confounds introduced by the TBSS processing pipeline. Furthermore, the absence of significant group differences in FA, and the more limited extent of group differences in MD, after STV regression, show that AD is the most sensitive DTI biomarker for altered white matter microstructure in children with 16p11.2 deletions.
Multicompartmental biophysical modeling revealed significantly reduced ODI in some of the same white matter tracts that had elevated FA in deletion carriers (Figs. 1, 8). No significant group differences were found in FICV and FISO, indicating that axonal density and CSF volume fraction are not major contributors to the increased FA, AD, and MD found in the carriers. One possible cause of the altered white matter microstructure in 16p11.2 deletions is reduced axonal fanning (i.e., convergence/divergence) and crossing, which would decrease ODI and increase AD and FA. Elevated AD without concomitant reduction in RD would lead to elevated MD. Other potential factors include reduced extracellular compartment tortuosity (Beaulieu 2002), which would increase MD and, if axonal density and permeability are unaffected, also increase AD and FA. These biophysical alterations are quite different than in most neuropathological processes, which cause elevated RD and reduced FA. Low FA and high RD are generally attributed to myelin sheath degradation, such as from demyelination or dysmyelination, and/or to loss of axonal fibers or reduced axonal fiber integrity (Beaulieu 2002). We find, however, that the developmental trajectories of FA and AD are similar across deletion carriers and controls (Figs. 4, 5).
Increased white matter FA in other clinical populations
Comparing our results in 16p11.2 deletions to those found in ASD and Williams syndrome, an increase in FA relative to typically developing children is a shared feature with Williams syndrome (Hoeft et al., 2007; Haas et al., 2013) and some ASD studies of children <4 years old (Ben Bashat et al., 2007; Weinstein et al., 2011; Wolff et al., 2012) and adolescents (Cheng et al., 2010), but the regional specificity of the changes in diffusivity causing the increased FA differ between populations. We compare our results to those found in ASD and Williams syndrome, acknowledging that the DTI findings in ASD are quite diverse and that our study differs in subject demographics, such as age, and sample size from some of the studies we discuss below. Although the corpus callosum is implicated in both 16p11.2 deletions and autism, some white matter regions with increased FA found in autism were not found in our study. Many of the white matter regions found to have increased FA in Williams syndrome were also determined to have increased FA in the 16p11.2 deletions, although decreased FA was detected in Williams syndrome in portions of the internal capsule. The unique feature of our findings, not observed in other neurodevelopmental disorders, is the joint elevation of FA, AD, and MD compared with matched controls. The only other study to find increased FA and AD in the experimental cohort, specifically Williams syndrome, instead found decreased RD and MD (Haas et al., 2013). We are not aware of any published data using NODDI or other diffusion-based biophysical modeling approaches to study ASD, Williams syndrome, or other neurodevelopmental disorders to compare with our results from 16p11.2 copy number variants (CNVs).
We therefore posit that the increased FA of 16p11.2 deletion syndrome has a different biophysical basis than an etiologically heterogeneous ASD population or a similarly genetically defined disorder like Williams syndrome, implying that the underlying white matter microstructural changes are also divergent. This needs to be conclusively proven by neuroimaging in replication cohorts and by histologic techniques in animal models.
Region-specific effects on white matter of 16p11.2 deletions
Anterior white matter tracts of the frontal and temporal lobes were more affected in the deletion carriers than were posterior white matter tracts of the parietal and occipital lobes (Figs. 1, 2). This observation is concordant with DTI studies of ASD (Travers et al., 2012). Although abnormal white matter microstructure in ASD can be widespread, there is a predilection for the frontal lobes and anterior parts of the corpus callosum, as shown in the first DTI study of autism (Barnea-Goraly et al., 2004) and in a recent TBSS study of ASD (Cheng et al., 2010). These concordant findings across several DTI studies support a frontal dysconnectivity mechanism for autism and for 16p11.2. This frontal susceptibility may explain the range of social cognition and executive function deficits seen in these populations.
Study limitations
Identifying controls with IQs that matched our deletion carriers presented a challenge. We excluded subjects with neuropsychiatric diagnoses, thereby leaving few controls with below-average IQs. We have addressed this confound by adding NVIQ as a nuisance regressor. In addition, if IQ was skewing the results, one would expect lower IQ to be correlated with lower FA and AD, as has been reported in prior DTI studies; however, we find the opposite effect on AD and FA in deletion carriers. These white matter changes of 16p11.2 deletions may differ by region and by age. Our primary findings are in central white matter tracts, such as the corpus callosum, internal capsules, and external capsules. Results may vary in more peripheral white matter, which are not easily investigated using group-averaged voxelwise approaches, such as TBSS. Furthermore, alterations of white matter in younger children and/or in adults might be different as well. Prior DTI studies in other neurodevelopmental disorders have often shown age–group interactions. Last, partial volume effect (PVE) may confound results from groups with different brain volumes, causing FA underestimation in heterogeneous voxels containing mixtures of white and gray matter or of white matter tracts with different fiber orientations (Vos et al., 2011). However, TBSS mitigates PVE since only parameter values from the tract cross section where FA is maximal are used (Smith et al., 2006). Carriers of the 16p11.2 deletion show increases in AD, FA, and MD in large white matter tracts that are many voxels wide and the pattern of group differences in DTI is not indicative of a bias toward smaller white matter regions, which are more susceptible to PVE. To further address the issue of PVE, we added STV as a nuisance regressor. Although we treat brain volume as a potential confound, adding STV to the statistical model could obscure a causal connection between increased brain size and increased AD. This postulated causal relationship could be mediated by, for example, more collimated fiber bundles with increased axon diameters in larger brains, thus providing a biological interpretation for the increase in FA and AD, and decrease in ODI.
Conclusions and future directions
We have linked 16p11.2 deletions with widespread microstructural changes in the developing white matter of children that have a distinct signature, with increased FA, AD, and MD that has not previously been reported for any other neurodevelopmental disorder, including other microdeletion disorders, such as Williams syndrome. These significant findings with a modest sample size support the view that specific genetic etiology can be more closely associated with changes in brain structure than relying on a shared cognitive or behavioral phenotype, which may have a multifactorial pathology. We have focused on white matter microstructure in this paper. Investigating changes in the gray matter using volumetrics and biophysical modeling of diffusion MR imaging, such as NODDI, will be investigated in the future to complement this work. Ultimately, however, the long-term objective is to further connect the genetic and anatomical variants with behavior, which may be facilitated by functional imaging methods, such as fMRI and magnetoencephalography, to investigate changes of brain activation and connectivity in 16p11.2 deletion carriers.
Footnotes
This work was supported by a grant from the Simons Foundation [Simons Foundation Autism Research Initiative (SFARI) Award #220843 to E.H.S.]. We are grateful to all of the families at the participating Simons Variation in Individuals Project (Simons VIP) sites, as well as the Simons VIP working group (Simons VIP Consortium, 2012). We appreciate obtaining access to phenotypic data on SFARI Base.
The authors declare no competing financial interests.
References
- Barnea-Goraly N, Menon V, Krasnow B, Ko A, Reiss A, Eliez S. Investigation of white matter structure in velocardiofacial syndrome: a diffusion tensor imaging study. Am J Psychiatry. 2003;160:1863–1869. doi: 10.1176/appi.ajp.160.10.1863. [DOI] [PubMed] [Google Scholar]
- Barnea-Goraly N, Kwon H, Menon V, Eliez S, Lotspeich L, Reiss AL. White matter structure in autism: preliminary evidence from diffusion tensor imaging. Biol Psychiatry. 2004;55:323–326. doi: 10.1016/j.biopsych.2003.10.022. [DOI] [PubMed] [Google Scholar]
- Beaulieu C. The basis of anisotropic water diffusion in the nervous system—a technical review. NMR Biomed. 2002;15:435–455. doi: 10.1002/nbm.782. [DOI] [PubMed] [Google Scholar]
- Behrens TE, Berg HJ, Jbabdi S, Rushworth MF, Woolrich MW. Probabilistic diffusion tractography with multiple fibre orientations: what can we gain? Neuroimage. 2007;34:144–155. doi: 10.1016/j.neuroimage.2006.09.018. [DOI] [PMC free article] [PubMed] [Google Scholar]
- Ben Bashat D, Kronfeld-Duenias V, Zachor DA, Ekstein PM, Hendler T, Tarrasch R, Even A, Levy Y, Ben Sira L. Accelerated maturation of white matter in young children with autism: a high b value DWI study. Neuroimage. 2007;37:40–47. doi: 10.1016/j.neuroimage.2007.04.060. [DOI] [PubMed] [Google Scholar]
- Chanraud S, Zahr N, Sullivan EV, Pfefferbaum A. MR diffusion tensor imaging: a window into white matter integrity of the working brain. Neuropsychol Rev. 2010;20:209–225. doi: 10.1007/s11065-010-9129-7. [DOI] [PMC free article] [PubMed] [Google Scholar]
- Cheng Y, Chou KH, Chen IY, Fan YT, Decety J, Lin CP. Atypical development of white matter microstructure in adolescents with autism spectrum disorders. Neuroimage. 2010;50:873–882. doi: 10.1016/j.neuroimage.2010.01.011. [DOI] [PubMed] [Google Scholar]
- Christian SL, Brune CW, Sudi J, Kumar RA, Liu S, Karamohamed S, Badner JA, Matsui S, Conroy J, McQuaid D, Gergel J, Hatchwell E, Gilliam TC, Gershon ES, Nowak NJ, Dobyns WB, Cook EH., Jr Novel submicroscopic chromosomal abnormalities detected in autism spectrum disorder. Biol Psychiatry. 2008;63:1111–1117. doi: 10.1016/j.biopsych.2008.01.009. [DOI] [PMC free article] [PubMed] [Google Scholar]
- de Anda FC, Rosario AL, Durak O, Tran T, Gräff J, Meletis K, Rei D, Soda T, Madabhushi R, Ginty DD, Kolodkin AL, Tsai LH. Autism spectrum disorder susceptibility gene TAOK2 affects basal dendrite formation in the neocortex. Nat Neurosci. 2012;15:1022–1031. doi: 10.1038/nn.3141. [DOI] [PMC free article] [PubMed] [Google Scholar]
- Fischl B. FreeSurfer. Neuroimage. 2012;62:774–781. doi: 10.1016/j.neuroimage.2012.01.021. [DOI] [PMC free article] [PubMed] [Google Scholar]
- Golzio C, Willer J, Talkowski ME, Oh EC, Taniguchi Y, Jacquemont S, Reymond A, Sun M, Sawa A, Gusella JF, Kamiya A, Beckmann JS, Katsanis N. KCTD13 is a major driver of mirrored neuroanatomical phenotypes of the 16p11.2 copy number variant. Nature. 2012;485:363–367. doi: 10.1038/nature11091. [DOI] [PMC free article] [PubMed] [Google Scholar]
- Haas BW, Barnea-Goraly N, Sheau KE, Yamagata B, Ullas S, Reiss AL. Altered microstructure within social-cognitive brain networks during childhood in Williams syndrome. Cereb Cortex. 2013 doi: 10.1093/cercor/bht135. Advance online publication. Retrieved March 14, 2014. [DOI] [PMC free article] [PubMed] [Google Scholar]
- Hoeft F, Barnea-Goraly N, Haas BW, Golarai G, Ng D, Mills D, Korenberg J, Bellugi U, Galaburda A, Reiss AL. More is not always better: increased fractional anisotropy of superior longitudinal fasciculus associated with poor visuospatial abilities in Williams syndrome. J Neurosci. 2007;27:11960–11965. doi: 10.1523/JNEUROSCI.3591-07.2007. [DOI] [PMC free article] [PubMed] [Google Scholar]
- Horev G, Ellegood J, Lerch JP, Son YE, Muthuswamy L, Vogel H, Krieger AM, Buja A, Henkelman RM, Wigler M, Mills AA. Dosage-dependent phenotypes in models of 16p11.2 lesions found in autism. Proc Natl Acad Sci U S A. 2011;108:17076–17081. doi: 10.1073/pnas.1114042108. [DOI] [PMC free article] [PubMed] [Google Scholar]
- Jacquemont S, Reymond A, Zufferey F, Harewood L, Walters RG, Kutalik Z, Martinet D, Shen Y, Valsesia A, Beckmann ND, Thorleifsson G, Belfiore M, Bouquillon S, Campion D, de Leeuw N, de Vries BB, Esko T, Fernandez BA, Fernández-Aranda F, Fernández-Real JM, et al. Mirror extreme BMI phenotypes associated with gene dosage at the chromosome 16p11.2 locus. Nature. 2011;478:97–102. doi: 10.1038/nature10406. [DOI] [PMC free article] [PubMed] [Google Scholar]
- Jenkinson M, Bannister P, Brady M, Smith S. Improved optimization for the robust and accurate linear registration and motion correction of brain images. Neuroimage. 2002;17:825–841. doi: 10.1006/nimg.2002.1132. [DOI] [PubMed] [Google Scholar]
- McCarthy SE, Makarov V, Kirov G, Addington AM, McClellan J, Yoon S, Perkins DO, Dickel DE, Kusenda M, Krastoshevsky O, Krause V, Kumar RA, Grozeva D, Malhotra D, Walsh T, Zackai EH, Kaplan P, Ganesh J, Krantz ID, Spinner NB, et al. Microduplications of 16p11.2 are associated with schizophrenia. Nat Genet. 2009;41:1223–1227. doi: 10.1038/ng.474. [DOI] [PMC free article] [PubMed] [Google Scholar]
- Mori S, Oishi K, Jiang H, Jiang L, Li X, Akhter K, Hua K, Faria AV, Mahmood A, Woods R, Toga AW, Pike GB, Neto PR, Evans A, Zhang J, Huang H, Miller MI, van Zijl P, Mazziotta J. Stereotaxic white matter atlas based on diffusion tensor imaging in an ICBM template. Neuroimage. 2008;40:570–582. doi: 10.1016/j.neuroimage.2007.12.035. [DOI] [PMC free article] [PubMed] [Google Scholar]
- Mukherjee P, Miller JH, Shimony JS, Conturo TE, Lee BC, Almli CR, McKinstry RC. Normal brain maturation during childhood: developmental trends characterized with diffusion-tensor MR imaging. Radiology. 2001;221:349–358. doi: 10.1148/radiol.2212001702. [DOI] [PubMed] [Google Scholar]
- Mukherjee P, Miller JH, Shimony JS, Philip JV, Nehra D, Snyder AZ, Conturo TE, Neil JJ, McKinstry RC. Diffusion-tensor MR imaging of gray and white matter development during normal human brain maturation. AJNR Am J Neuroradiol. 2002;23:1445–1456. [PMC free article] [PubMed] [Google Scholar]
- Simons VIP Consortium. Simons Variation in Individuals Project (Simons VIP): a genetics-first approach to studying autism spectrum and related neurodevelopmental disorders. Neuron. 2012;73:1063–1067. doi: 10.1016/j.neuron.2012.02.014. [DOI] [PubMed] [Google Scholar]
- Smith SM, Nichols TE. Threshold-free cluster enhancement: addressing problems of smoothing, threshold dependence and localisation in cluster inference. Neuroimage. 2009;44:83–98. doi: 10.1016/j.neuroimage.2008.03.061. [DOI] [PubMed] [Google Scholar]
- Smith S, Jenkinson M, Johansen-Berg H, Rueckert D, Nichols TE, Mackay CE, Watkins KE, Ciccarelli O, Cader MZ, Matthews PM, Behrens TE. Tract-based spatial statistics: voxelwise analysis of multi-subject diffusion data. Neuroimage. 2006;31:1487–1505. doi: 10.1016/j.neuroimage.2006.02.024. [DOI] [PubMed] [Google Scholar]
- Stefansson H, Meyer-Lindenberg A, Steinberg S, Magnusdottir B, Morgen K, Arnarsdottir S, Bjornsdottir G, Walters GB, Jonsdottir GA, Doyle OM, Tost H, Grimm O, Kristjansdottir S, Snorrason H, Davidsdottir SR, Gudmundsson LJ, Jonsson GF, Stefansdottir B, Helgadottir I, Haraldsson M, et al. CNVs conferring risk for autism and schizophrenia affect cognition in controls. Nature. 2014;505:361–366. doi: 10.1038/nature12818. [DOI] [PubMed] [Google Scholar]
- Travers BG, Adluru N, Ennis C, Tromp do PM, Destiche D, Doran S, Bigler ED, Lange N, Lainhart JE, Alexander AL, et al. Diffusion tensor imaging in autism spectrum disorder: a review. Autism Res. 2012;5:289–313. doi: 10.1002/aur.1243. [DOI] [PMC free article] [PubMed] [Google Scholar]
- Vos SB, Jones DK, Viergever MA, Leemans A. Partial volume effect as a hidden covariate in DTI analyses. Neuroimage. 2011;55:1566–1576. doi: 10.1016/j.neuroimage.2011.01.048. [DOI] [PubMed] [Google Scholar]
- Weinstein M, Ben-Sira L, Levy Y, Zachor DA, Ben Itzhak E, Artzi M, Tarrasch R, Eksteine PM, Hendler T, Ben Bashat D. Abnormal white matter integrity in young children with autism. Hum Brain Mapp. 2011;32:534–543. doi: 10.1002/hbm.21042. [DOI] [PMC free article] [PubMed] [Google Scholar]
- Weiss LA, Shen Y, Korn JM, Arking DE, Miller DT, Fossdal R, Saemundsen E, Stefansson H, Ferreira MA, Green T, Platt OS, Ruderfer DM, Walsh CA, Altshuler D, Chakravarti A, Tanzi RE, Stefansson K, Santangelo SL, Gusella JF, Sklar P, et al. Association between microdeletion and microduplication at 16p11.2 and autism. NEJM. 2008;358:667–675. doi: 10.1056/NEJMoa075974. [DOI] [PubMed] [Google Scholar]
- Wolff JJ, Gu H, Gerig G, Elison JT, Styner M, Gouttard S, Botteron KN, Dager SR, Dawson G, Estes AM, Evans AC, Hazlett HC, Kostopoulos P, McKinstry RC, Paterson SJ, Schultz RT, Zwaigenbaum L, Piven J, Piven J. Differences in white matter fiber tract development present from 6 to 24 months in infants with autism. Am J Psychiatry. 2012;169:589–600. doi: 10.1176/appi.ajp.2011.11091447. [DOI] [PMC free article] [PubMed] [Google Scholar]
- Yoshida S, Oishi K, Faria AV, Mori S. Diffusion tensor imaging of normal brain development. Pediatr Radiol. 2013;43:15–27. doi: 10.1007/s00247-012-2496-x. [DOI] [PMC free article] [PubMed] [Google Scholar]
- Zhang H, Hubbard PL, Parker GJ, Alexander DC. Axon diameter mapping in the presence of orientation dispersion with diffusion MRI. Neuroimage. 2011;56:1301–1315. doi: 10.1016/j.neuroimage.2011.01.084. [DOI] [PubMed] [Google Scholar]
- Zhang H, Schneider T, Wheeler-Kingshott CA, Alexander DC. NODDI: practical in vivo neurite dispersion and density imaging of the human brain. Neuroimage. 2012;61:1000–1016. doi: 10.1016/j.neuroimage.2012.03.072. [DOI] [PubMed] [Google Scholar]
- Zufferey F, Sherr EH, Beckmann ND, Hanson E, Maillard AM, Hippolyte L, Macé A, Ferrari C, Kutalik Z, Andrieux J, Aylward E, Barker M, Bernier R, Bouquillon S, Conus P, Delobel B, Faucett WA, Goin-Kochel RP, Grant E, Harewood L, et al. A 600 kb deletion syndrome at 16p11.2 leads to energy imbalance and neuropsychiatric disorders. J Med Genet. 2012;49:660–668. doi: 10.1136/jmedgenet-2012-101203. [DOI] [PMC free article] [PubMed] [Google Scholar]


