

Abstract
Many human studies have demonstrated that rapid motor responses (i.e., muscle-stretch reflexes) to mechanical perturbations can be modified by a participant's intended response. Here, we used a novel experimental paradigm to investigate the neural mechanisms that underlie such goal-dependent modulation. Two monkeys positioned their hand in a central area against a constant load and responded to mechanical perturbations by quickly placing their hand into visually defined spatial targets. The perturbation was chosen to excite a particular proximal arm muscle or isolated neuron in primary motor cortex and two targets were placed so that the hand was pushed away from one target (OUT target) and toward the other (IN target). We chose these targets because they produced behavioral responses analogous to the classical verbal instructions used in human studies. A third centrally located target was used to examine responses with a constant goal. Arm muscles and neurons robustly responded to the perturbation and showed clear goal-dependent responses ∼35 and 70 ms after perturbation onset, respectively. Most M1 neurons and all muscles displayed larger perturbation-related responses for the OUT target than the IN target. However, a substantial number of M1 neurons showed more complex patterns of target-dependent modulation not seen in muscles, including greater activity for the IN target than the OUT target, and changes in target preference over time. Together, our results reveal complex goal-dependent modulation of fast feedback responses in M1 that are present early enough to account for goal-dependent stretch responses in arm muscles.
Keywords: feedback, instruction, primary motor cortex, reflex, single-unit recording, task-goal
Introduction
Many studies have established that rapid motor responses (i.e., stretch reflexes) to mechanical perturbations are goal-dependent (Shemmell et al., 2010; Pruszynski and Scott, 2012). These studies typically issue verbal instructions, such as “resist” and “let go,” that indicate how the participant should respond to a mechanical perturbation (Hammond, 1956). The most common finding is that the short-latency response is the same for both instructions, whereas the long-latency response is greater when the subject is instructed to resist versus let go. This pattern is strikingly robust and has been reported for muscles at the elbow, wrist, finger, and ankle (Pruszynski and Scott, 2012).
Primary motor cortex (M1) is a logical candidate to mediate goal-dependent modulation of the long-latency stretch response (Scott, 2004, 2012). M1 is an important component of the transcortical feedback pathway (Shemmell et al., 2010; Hatsopoulos and Suminski, 2011; Pruszynski and Scott, 2012) and a key node for generating voluntary motor commands (Porter and Lemon, 1993). Indeed, M1 neurons causally contribute to long-latency activity (Cheney and Fetz, 1984) and exhibit sophisticated feedback responses under various conditions (Fromm and Evarts, 1977; Picard and Smith, 1992; Pruszynski et al., 2011a).
Empirical studies provide mixed support for this hypothesis. Scalp potentials following mechanical perturbations are modulated by verbal instructions under some experimental conditions (Abbruzzese et al., 1985; Spieser et al., 2010) but not others (MacKinnon et al., 2000). Those studies reporting modulation reveal a temporal pattern different from limb muscles. Results based on transcranial magnetic stimulation (TMS) also yield conflicting results. TMS-evoked muscle potentials can be modulated by verbal instructions (Spieser et al., 2010) but TMS-induced inhibition does not reduce goal-dependent sensitivity of the long-latency response (Shemmell et al., 2009).
Of particular note is the work of Tanji and Evarts (1976) who recorded M1 neurons while monkeys responded to mechanical perturbations by moving the perturbing handle to its limits. Their results indicate that M1 neurons signal the instructed action before the perturbation (Tanji and Evarts, 1976), and that perturbation-evoked responses are quickly modulated by the instructed action (Evarts and Tanji, 1976). However, these seminal studies are limited in several respects. The authors provide a qualitative account of M1 responses and focus on a small subset of neurons they sampled: 18 pyramidal tract neurons reciprocally modulated for movements and perturbations. Moreover, their task was substantially different to most human studies. Their monkeys responded to perturbations by categorically activating either the stretched or shortened muscle rather than variably activating the stretched muscle. And they did not include a load to preactivate muscles before perturbation, permitting subthreshold changes in muscle activity known to influence stretch responses via spinal circuits (Capaday and Stein, 1987).
Here we address these limitations by examining goal-dependent modulation of fast feedback responses in M1 under experimental conditions analogous to the dominant human approach. Although some neurons responded as previously reported, a substantial number showed more complex patterns, which may explain the conflicting results observed in human studies.
Materials and Methods
Animals and apparatus.
The Queen's University Animal Care Committee approved all the procedures described below. Two male rhesus monkeys (Monkeys P and X, Macaca mulatta, ∼10 kg) were trained to perform a range of tasks while seated in a robotic exoskeleton (KINARM, BKIN Technologies). The robotic device permits combined flexion and extension movements of the shoulder and elbow in the horizontal plane and can independently apply mechanical loads to the shoulder and/or elbow joints (Scott, 1999). All target lights and simulated hand feedback were presented in the horizontal plane of the task and direct vision of the hand was limited either by a physical barrier or by removing ambient light in the room.
Posture perturbation task.
This task was designed to identify the preferred loading direction of isolated neurons in M1. Each monkey was trained to maintain their hand at a small central area (0.8 mm radius) in the presence of random step-torque perturbations (Fig. 1A). The central area was located so that the hand was near the center of the arm's workspace (shoulder: 30°, elbow: 90°) where viscoelastic forces of the limb are relatively small (Graham et al., 2003). After a random hold period (1000–1500 ms), the monkey was exposed to one of eight step-torque perturbations [shoulder torque, elbow torque; applied flexion/extension = positive/negative (in Nm): (1) 0.28, 0; (2) 0.24, 0.24; (3) 0, 0.24; (4) −0.2, 0.2; (5) −0.28, 0; (6) −0.24, −0.24; (7) 0, −0.24; (8) 0.2, −0.2] or a catch trial where no perturbation occurred (Fig. 1B). The monkey received a water reward if it returned its hand to the central area within 750 ms and remained within it for an additional 3 s. The long trial length allowed us to analyze both fast-feedback responses to the perturbation (perturbation epoch, 20–100 ms postperturbation) and steady-state motor outputs during postural maintenance (posture/steady-state epoch, last 1 s of stabilization) within the same trial. Five to 20 repeats were collected per experimental condition.
Figure 1.
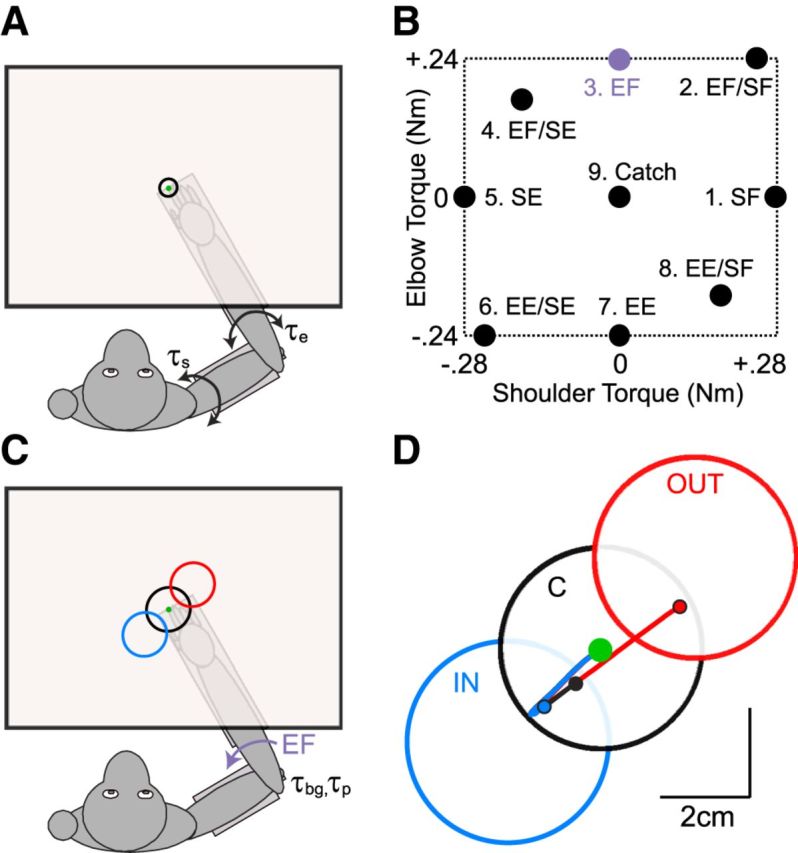
Apparatus and experimental paradigm. A, B, In the posture perturbation task, the monkey was presented with a small target (0.8 cm radius) placed at their fingertip when shoulder (θs) and elbow (θe) angles were 30° and 90°, respectively. Unpredictable flexion and extension step-torques at the shoulder and/or elbow pushed the monkey's hand from the central target. To receive water reward, the monkey needed to return to the target within 750 ms of perturbation onset and remain within it for an additional 3 s. C, In the spatial-target perturbation task, the monkey was trained to maintain their hand at the same small central target while countering a background load and then respond to the mechanical perturbation by placing their hand into the visually defined goal target. The goal target could be located in one of three positions such that the perturbation would displace the hand toward (IN Target, blue) or away (OUT Target, red) from the target. A third target (CENTER, black) was placed between the IN and OUT targets, aligned with the small central target. D, Exemplar hand kinematics for the same mechanical perturbation (applied elbow flexion, see purple symbols in B, C) for the three possible target positions. Lines depict average hand kinematics for the three targets. Filled symbols represent final hand position.
There are two key differences between the design of the present task and our previous work, which compared M1 responses under transient and steady-state conditions (Herter et al., 2009). First, we combined the separate perturbation and posture tasks described in that paper into a single task by applying joint torques that perturbed the hand from the central target and remained on until the monkey re-established postural control. Second, we modified the distribution and magnitude of applied joint torques by reducing the magnitude of the multijoint flexion and extension loads. This change resulted in hand motions that were more similar in their overall magnitude across perturbation conditions.
Spatial-target perturbation task.
Each monkey was trained to maintain their hand in the same small central area while countering a background load and then respond to a mechanical perturbation by placing its hand into a goal target (2.5 cm radius) presented on the screen (Fig. 1C,D). The precise details of the task (background load, perturbation load, and goal target position) varied based on the known mechanical action of a muscle or the responses of a neuron in the perturbation epoch of the posture perturbation Task. For muscles, the background load and mechanical perturbation were chosen to preactivate the muscle before the perturbation and to elicit an excitatory perturbation response, respectively. For neurons, mechanical perturbations were chosen to elicit an excitatory perturbation response according to the neurons preferred loading direction in the perturbation epoch of the posture perturbation task; the same joint-load (magnitude and direction) was used as a background load before perturbation onset. Goal target locations were chosen so that the chosen mechanical perturbation would displace the hand either into (IN target) or away from (OUT target) the center of the displayed target. We also included a target located at the central area, between the IN and OUT targets (CENTER target). Goal targets were presented in a random sequence and the timing of the mechanical perturbation was unpredictable (1000–1500 ms after reaching central area) but the direction that the hand was pushed by the mechanical perturbation was the same throughout a block. As such, the monkey could predict how the perturbation would push the hand relative to the presented target, and in principle, fully prepare a response in advance. The monkey received water reward if it returned its hand to the central area within 750 ms and remained within it for an additional 1 s. Twenty to 40 repeats were collected per experimental condition.
Neural, muscle, and kinematic recordings.
Neural data were collected from the arm region of M1 using standard extracellular recording techniques and equipment (Herter et al., 2007, 2009; Pruszynski et al., 2011a). Single tungsten microelectrodes (FHC) were advanced until population activity was detected. We recorded individual action potentials from those neurons (Np = 95; Nx = 32) that had a clear response to either passive or active movements of the shoulder and/or elbow but not the wrist or fingers. Recordings were performed in the rostral bank of the central sulcus and more rostral superficial sites where initial experiments indicated that electrical stimulation (11 pulses, 333 Hz, 0.2 ms pulse-width, <50 uA) could elicit shoulder and/or elbow movement. Postmortem histology confirmed that recording sites from Monkey P were located in M1. Postmortem histology is not yet available for Monkey X.
In separate experimental sessions, fine-wire electrodes were used to acquire electromyographic (EMG) activity from proximal arm muscles that predominantly contributed to flexion and extension movements at the shoulder and elbow (short/long biceps, brachioradialis, dorsoepitrochliaris, long/lateral/middle triceps, anterior deltoid, middle deltoid, posterior deltoid, pectoralis major; Kurtzer et al., 2006). The electrodes consisted of two single-strand wires that were individually inserted into the muscle belly spaced 5–10 mm apart. Insertion was guided by anatomical landmarks and was confirmed by electrical stimulation. Muscle activity was recorded at 4 KHz, bandpass filtered (25–350 Hz, sixth order Butterworth) and full-wave rectified before analysis (Pruszynski et al., 2008). EMG signals were normalized by their mean activity when countering the background load across all three targets. Only those muscle recordings that yielded clear phasic responses to the mechanical perturbation and no motion artifact were analyzed (N = 26). Kinematic data and applied torques were acquired directly from the KINARM device and were sampled at the same rate as the muscle activity.
Data analysis.
Our principle interest was comparing kinematic, muscle and neural responses in the spatial-target perturbation task where we imposed the same mechanical perturbation and the monkey responded by rapidly moving their hand into one of three goal targets. In all cases, we defined a statistical threshold at p < 0.05.
We analyzed the temporal changes in kinematics by comparing distance from the central area and hand speed as a function of spatial target location. Muscle activity was compared across predefined epochs (baseline: 500 ms before perturbation onset; short-latency/R1: 20–50 ms postperturbation; long-latency/R2/3: 50–100 ms postperturbation; voluntary: 120–180 ms postperturbation). t Tests were used to evaluate whether the binned muscle activity was significantly modulated as a function of target location. For each muscle sample, we determined the onset time of goal-dependent modulation by performing a running t test (one-sided, two-sample) and noting when there was a significant (p < 0.05) increase for the OUT target relative to the IN target for five consecutive samples (Shapiro et al., 2002; Omrani et al., 2013). Note that, before analysis, muscle activity and kinematic data were resampled at 1 KHz.
All neural activity was smoothed using an asymmetric spike filter (Thompson et al., 1996) which convolves each action potential with a double exponential that mimics a postspike potential (1 ms rise, 20 ms fall) and resampled at 1 KHz. The posture perturbation task was used to characterize the neuron's directional sensitivity to mechanical perturbations (20–100 ms postperturbation) and steady-state loads (last 1 s of stabilization at the central area). Each neuron's directional preference for applied loads was quantified using planar regression, which relates changes in neural activity to the applied joint torques. A Rayleigh test was used to determine whether the distributions of preferred directions (in joint torque space) were significantly unimodal or bimodal (Batschelet, 1981).
In the spatial-target perturbation task, the neural activity related to spatial target position was compared across predefined epochs (baseline: 500 ms before perturbation onset; early perturbation responses: 20–50 ms postperturbation; late perturbation responses: 50–100 ms; voluntary responses: 120–180 ms) using a two-way ANOVA (3 targets × 4 epochs) and post hoc t tests. For each neuron, we determined the onset time of goal-dependent modulation by performing a running t test (two-sided, two-sample) and noting when there was a significant (p < 0.05) difference between the IN and OUT responses for five consecutive samples (Shapiro et al., 2002; Omrani et al., 2013).
We calculated two population responses to assess the presence of a goal-dependent signal. The first was the simple signed difference based on actual target locations (i.e., OUT-IN). The second was an unsigned difference where we computed OUT-IN or IN-OUT for those neurons showing significantly greater OUT or IN responses in the late perturbation epoch, respectively. Note that the unsigned response guarantees that one set of responses will be larger than the other set of responses in the late perturbation epoch. Therefore, a bootstrap procedure was used to estimate what the unsigned population signal would produce by chance due to noise in our empirical data. For each neuron, we randomly assigned the observed IN and OUT responses into two new groups of the same size and then calculated the resulting goal-dependent response. The procedure was repeated 1000 times for each neuron and the average response across neurons was then used to estimate how much of the unsigned population signal could be attributed to noise.
We evaluated whether there was a significant relationship between goal-dependent activity in the baseline and postperturbation epochs using a bootstrap procedure. Specifically, we estimated the expected proportion of randomly drawn two-dimensional samples appearing in one quadrant of two-dimensional space. In the limit, the result is clearly 25% but the number of samples determines the confidence interval. That is, when the number of samples is small, the variability is large because the few samples could all end up in the same quadrant or could all end up in different quadrants. Variability decreases as the sample size increases because such clustering becomes less likely. In our case, with N = 104 as set by the number of neurons being analyzed, we estimated the 95% confidence interval to be 17–34%.
Results
Posture perturbation task
Both monkeys quickly brought their hand back to the central target and were highly successful at reestablishing postural control within the imposed timing constraints (success rate > 90%). Figure 2A depicts a typical neural response in both the perturbation (20–100 ms following perturbation onset) and posture (last 1 s of stabilization) epochs for the nine joint torque combinations that we applied. The exemplar neuron showed a significant perturbation response relative to baseline (ANOVA, p < 0.05) and responded most robustly when the applied torque included both elbow flexion and shoulder extension (SE/EF;Fig. 2A, top left). The exemplar neuron showed significant directional tuning in joint-torque space (preferred direction = 121°, plane fit, p < 0.05) in the perturbation epoch as it was excited by several conditions flanking combined elbow flexion and shoulder extension, and showed little change in activity for applied torques in the opposite direction (e.g., EE/SF). A similar pattern was evident in the posture epoch where the exemplar neuron showed significant directional tuning roughly in the same direction (preferred direction = 119°). Across the population of neurons (N = 127) that were significantly tuned in either the perturbation (Fig. 2B; N = 103) or posture (Fig. 2C; N = 103) epochs, we found a significant bias (bimodal Rayleigh, p < 0.05) toward multijoint torques causing whole arm flexion or extension (perturbation axis = 123–303°, r = 0.57; posture axis = 135–315°, r = 0.51). Moreover, those neurons significantly tuned in both perturbation and posture epochs (N = 88) showed nearly identical preferred directions in both epochs (mean paired difference in preferred directions between perturbation and posture epochs = 3.5°, r = 0.78; Fig. 2D). These results are consistent with our previous studies on load responses of M1 neurons (Herter et al., 2007, 2009).
Figure 2.

Neural responses in the posture perturbation task. A, The neural discharge of an exemplar neuron is shown in both the perturbation (20–100 ms postperturbation) and posture epochs (last 1 s) for each of the nine load conditions (Fig. 1B). Tick marks represent individual action potentials and the black trace depicts the mean response across repetitions. Data are aligned on perturbation onset. Labels indicate the applied loads in joint torque space (e.g., EF/SE). B, Polar histogram illustrating the distribution of preferred directions in joint torque space for the population of M1 neurons in the perturbation epoch. Each dot represents a single neuron that showed significant tuning during the perturbation epoch. White dot represents the neuron shown in A. Gray arrow represents the major axis of the distribution. C, Same layout as B but for the posture epoch. D, Polar histogram illustrating the difference in preferred directions (in joint torque space) for the perturbation and posture epochs. Dots represent those neurons that were significantly tuned in both perturbation and posture epochs.
Spatial-target perturbation task
It is important to reemphasize that the spatial-target perturbation task focused on specific background loads and mechanical perturbations that excited a particular muscle or neuron (see Materials and Methods; Fig. 1). For muscles, the loads were selected based on the known anatomical action of the muscle. For neurons, the loads were selected based on the preferred loading direction in the perturbation epoch of the posture perturbation task. Having selected the loads, goal target locations were chosen so that the mechanical perturbation displaced the hand either into (IN target) or away from (OUT target) the center of the displayed target. A third target was located at the central area, between the IN and OUT targets (CENTER target). Given that the perturbation was chosen to activate the muscles and neurons, and that the OUT target was placed so that it required overcoming the applied load more so than the IN target, we expected to observe the largest responses for the OUT target, intermediate responses for the CENTER target and smallest responses than the IN target.
Spatial-target perturbation task: kinematics and behavior
Figure 3A presents the spatial hand kinematics associated with the IN and OUT target conditions. Each thin line represents the mean hand trajectory associated with a single recording session and the thick lines depict average trajectories for the two monkeys. Task performance was very consistent both across sessions and across monkeys. The applied perturbations caused similar hand movements and both monkeys overcame the perturbation and readily placed their hand in the presented target within the required time constraints (success rate>90%). This similarity is further illustrated in Figure 3B,C, which shows the temporal change in elbow angle for a single recording session of the EF perturbation condition for each monkey. As expected, the perturbation initially displaced the elbow joint and both monkeys quickly countered the applied load and moved their hand toward the goal target. We quantified how quickly the monkeys integrated the spatial goal information into their movement behavior across the various perturbation conditions by calculating hand distance (Fig. 3D) and speed (Fig. 3E) for both the IN and OUT targets. Inspection of temporal receiver-operating characteristic analysis revealed that substantial deviations in kinematic behavior began ∼120 ms following perturbation onset, in line with previous reports in humans (Pruszynski et al., 2008).
Figure 3.
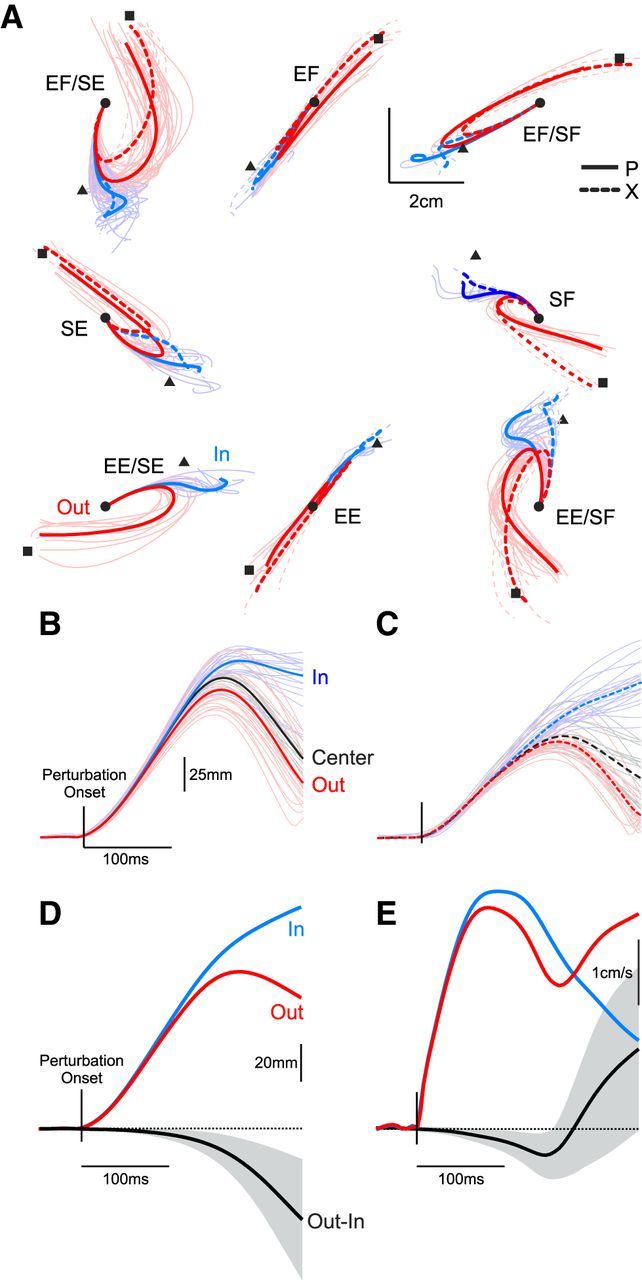
Kinematics in the spatial-target perturbation task. A, Hand kinematics in the horizontal plane for the spatial-target perturbation task. The eight panels represent the eight possible mechanical perturbations chosen based on a given neuron's preferred direction in the perturbation epoch of the posture perturbation task. The thin lines represent average behavior from each recording session. The thick lines represent average behavior across the entire recording series. Solid and dashed lines depict data from Monkeys P and X, respectively. For visualization purposes, data for Monkey P has been reflected around the vertical axis as he performed the task with this left hand. Red and blue lines depict responses for the OUT and IN target, respectively. CENTER target responses are not shown. The small square and triangle symbols represent the center of the OUT and IN targets, respectively. The small circle represents the center of the start target as well as the CENTER target. Note that there are no dashed traces for the EE/SE conditions because we did not record any neurons in that condition for Monkey X. B, Temporal hand kinematics for a single session of applied elbow flexion perturbations from Monkey P. The figure depicts the distance from the start target as a function of time and is aligned on perturbation onset. Thin lines represent single trials and thick lines represent average responses. Red, black, and blue lines represent responses for the OUT, CENTER, and IN targets, respectively. C, Same as B but for Monkey X. D, Temporal hand kinematics represented as the distance from the start target averaged for all experimental sessions. The red and blue lines represent the OUT and IN targets. The black line represents the difference in hand positions as a function of target position. The error boundary represents ±1 SD. E, Same layout as D but for hand speed.
Spatial-target perturbation task: muscle activity
Figure 4 illustrates the pattern of normalized muscle activity observed in the spatial-target perturbation task. When stretched by the mechanical perturbation, nearly all of the collected muscle samples (26 of 31) exhibited an increase in muscle activity relative to baseline within 100 ms of perturbation onset (Fig. 4A,B). Plotting the mean evoked response revealed a multiphasic sequence of muscle activity (Fig. 4C), akin to the classical segmented response described in human upper-limb muscles (Hammond, 1955). Examining the average muscle response revealed that target-dependent differences became evident ∼70 ms after perturbation onset (Fig. 4D). Consistent with this timing, examining the binned responses indicated that muscle activity in the short-latency (R1, 20–50 ms) epoch (Fig. 4E) was not affected by the spatial target position but that muscle activity in the long-latency (R2/3, 50–100 ms) epoch (Fig. 4F) and voluntary (120–180 ms) epoch was greater for the OUT target than the IN target. Despite the fact that the monkeys had prior knowledge about the required response, the increased activity for the OUT target did not appear to simply reflect changes in baseline muscle activity (Fig. 4G). Statistical analyses confirmed these qualitative observations (Fig. 4H). First, we found no significant difference in baseline muscle activity as a function of target position (t(25) = −0.9, p = 0.8). Second, we found significant increases in evoked muscle activity (t test, p < 0.05) for all target locations in each of the R1, R2/3, and voluntary epochs. And third, significant differences in evoked activity between the IN and OUT targets were absent in the R1 epoch (t(25) = −0.3, p = 0.6) but present in both the R2/3 (t(25) = 2.8, p < 0.05) and voluntary epochs (t(25) = 2.3, p < 0.05).
Figure 4.
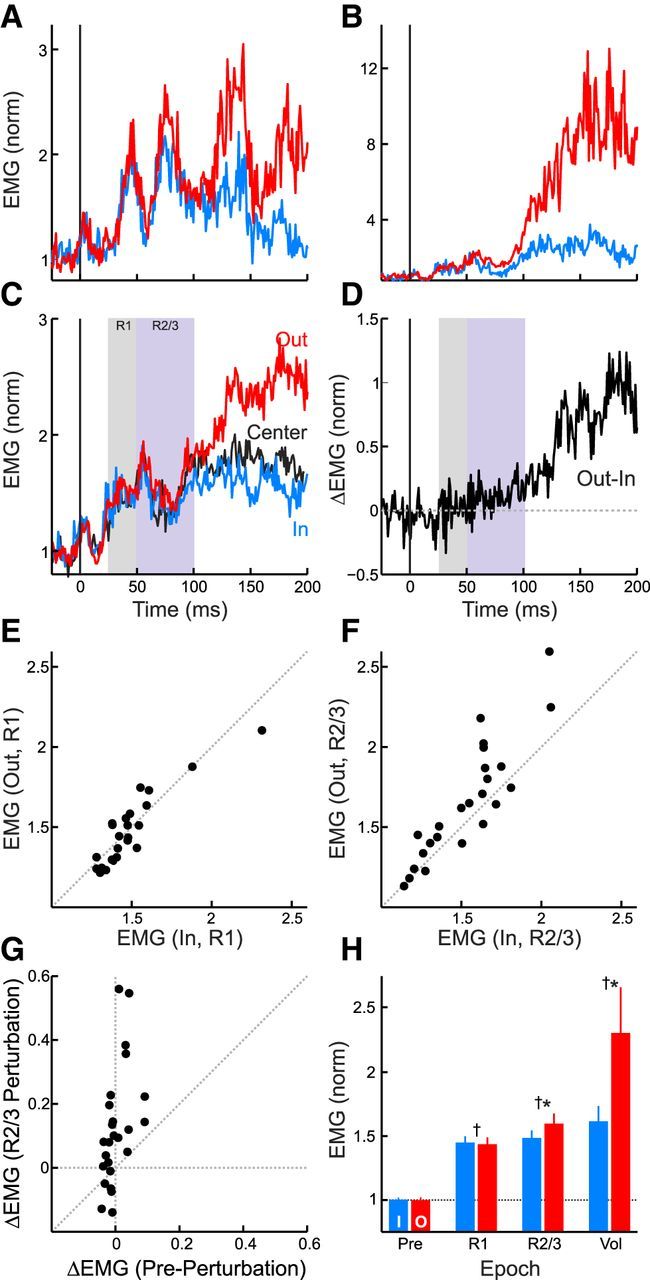
Muscle responses in the spatial-target perturbation task. A, Traces represent mean normalized muscle activity for the IN (blue) and OUT (red) targets for an exemplar muscle (Monkey P, posterior deltoid). Data aligned on perturbation onset. B, Same format as A for another exemplar muscle (Monkey X, middle deltoid). C, Same format as A for the mean response across the population of collected muscle samples. The black trace depicts responses for the CENTER target condition. The two boxes highlight the short-latency (R1) and long-latency (R2/3) muscle response epochs. D, Same format as C but showing the mean difference in muscle activity between the IN and OUT target. E, Scatter plot showing mean muscle activity in the R1 epoch for the IN and OUT targets. Each symbol represents a single muscle sample. F, Same format as E for the R2/3 epoch. G, Scatter plot comparing the changes in target-dependent activity (OUT-IN) in the baseline and R2/3 epochs. Note that target-dependent changes in the R2/3 epoch were not closely related to changes in baseline muscle activity. H, Bar graph depicting target-dependent responses across the epochs. All response epochs exhibited significant (†one-sample, one-sided, t test, p < 0.05) increases from the preperturbation epoch (i.e., 1 in the au on the plot, dashed line) but only the R2/3 and voluntary epochs exhibited significant target-dependent responses (*one-sample, one-sided, t test, p < 0.05). Error bars represent 1 SEM.
Spatial-target perturbation task: neural activity
Figure 5 presents data from two typical neurons in the spatial-target perturbation task. The first unit exhibited a prolonged response that lasted throughout the duration of the task (Fig. 5A), whereas the second unit showed responses largely confined to the early and late perturbation epochs (Fig. 5B). Consistent with proximal limb muscles, the first unit responded more robustly for the OUT target relative to the IN target within 100 ms of perturbation onset. In contrast, the second unit responded more robustly for the IN target relative to the OUT target in the same time frame. Both neurons showed an intermediate response for the CENTER target.
Figure 5.

Exemplar neurons in the spatial-target perturbation task. A, Responses from an exemplar neuron for the three target conditions. Data aligned on perturbation onset. Each dot represents a single action potential and the black trace below depicts the average response. The gray bar indicates the first 100 ms following perturbation onset, which includes both the early and late perturbation epoch. Note that the neuron shows largest evoked responses for the OUT target, intermediate responses for the CENTER target and smallest responses for the IN target. B, Same format as A for another exemplar neuron. Note that this neuron does not show substantial tonic activity compared with A and exhibits the largest evoked responses for the IN target, intermediate responses for the CENTER target, and smallest responses for the OUT target.
We analyzed the population of neurons with significant excitatory responses (t test, p < 0.05) in the perturbation epoch (20–100 ms) relative to baseline for at least one target condition in the spatial-target perturbation task (N = 104). In this population of neurons, we found that the mechanical perturbation typically evoked a large phasic response beginning as early as 20 ms after perturbation onset followed by a prolonged plateau of activity over the remainder of the trial. Very early responses were typical. Most neurons (73%) showed a significant increase in activity within 50 ms of perturbation onset and neurons typically reached their peak response in the late perturbation epoch (median peak times across all target conditions = 63 ms; interquartile range = 50–97 ms; Fig. 6A). We found no significant difference in peak times as a function of target position (Kruskal–Wallis: H(2,309) = 4.8, p = 0.09) though there was a trend toward later peak times for the OUT target, intermediate peak times for the CENTER target, and earliest peak times for the IN target (Fig. 6A, bars). Consistent with the time course described above, we found that peak firing rate in the late perturbation epoch was significantly greater than peak activity in the early perturbation epoch (t(103) = 8.8, p < 0.05; Fig. 6B).
Figure 6.

Timing and magnitude of neural responses in M1. A, Histogram showing the time following perturbation onset when a neuron reached its peak activity. Note that this response could have occurred for any target location (median = 63 ms). Lines above indicate the median (dot) and quartile ranges (extent of lines) for each target location. B, Scatter plot comparing the peak firing rate in the early and late perturbation epochs. Neurons typically showed greater activity in the late epoch than the early epoch. Inset, Bar graph shows that this increase was significant across the population (paired t test, p < 0.05). Error bars represent 1 SEM.
At the population level, M1 responses to the same mechanical perturbation were, on average, largest for the OUT target, intermediate for the CENTER target, and the smallest for the IN target (Fig. 7A). A two-way ANOVA comparing evoked activity as a function of the four epochs (baseline, early perturbation, late perturbation, voluntary) and three target locations (IN, OUT, CENTER) revealed a main effect of epoch (F(3,930) = 24.3, p < 0.05) and a significant interaction between epoch and target position (F(3,930) = 3.0, p < 0.05). Post hoc analysis showed that M1 activity was significantly larger for the OUT target than the IN target even during the baseline epoch (t(103) = 3.1, p < 0.05). Having subtracted the baseline difference, we found that increases in evoked activity for the OUT target relative to the IN target were statistically absent in the early perturbation epoch (one-sample, one-sided, t test, t(103) = −0.9, p = 0.98), weakly but significantly present in the late perturbation (50–100 ms, t(103) = 1.8, p < 0.05) and clearly evident in the voluntary epoch (120–180 ms, t(103) = 4.5, p < 0.05). Inspection of the difference between IN and OUT responses showed that target-dependent responses over and above baseline began ∼50 ms after perturbation onset (Fig. 7B).
Figure 7.

M1 population averages in the spatial-target perturbation task. A, Mean response across the population of M1 neurons (N = 104) for the three target conditions (red, OUT; black, CENTER; blue, IN). Data aligned on perturbation onset (vertical black line). Error boundary represents ±1 SEM. The three lines indicate the analysis epochs (E, early perturbation; L, late perturbation; V, voluntary). B, Same format as A but showing the mean differential response (OUT-IN).
At the single-neuron level, we found that 4, 8, 35, and 56 of 104 sampled M1 neurons individually demonstrated significant differences in their evoked responses between the IN and OUT targets during the baseline, early perturbation, late perturbation, and voluntary epochs, respectively (two-sample, two-tailed, t test, p < 0.05; baseline subtracted for evoked responses; Fig. 8A, filled dots). Epoch-free analysis revealed a skewed distribution of goal-dependent onset times (median = 82 ms; 25/75th percentile = 48/124 ms) with the highest concentration of onsets between 40 and 60 ms postperturbation. Importantly, we found that many M1 neurons showed significant goal-dependent modulation before related changes in the muscles (Fig. 8B).
Figure 8.
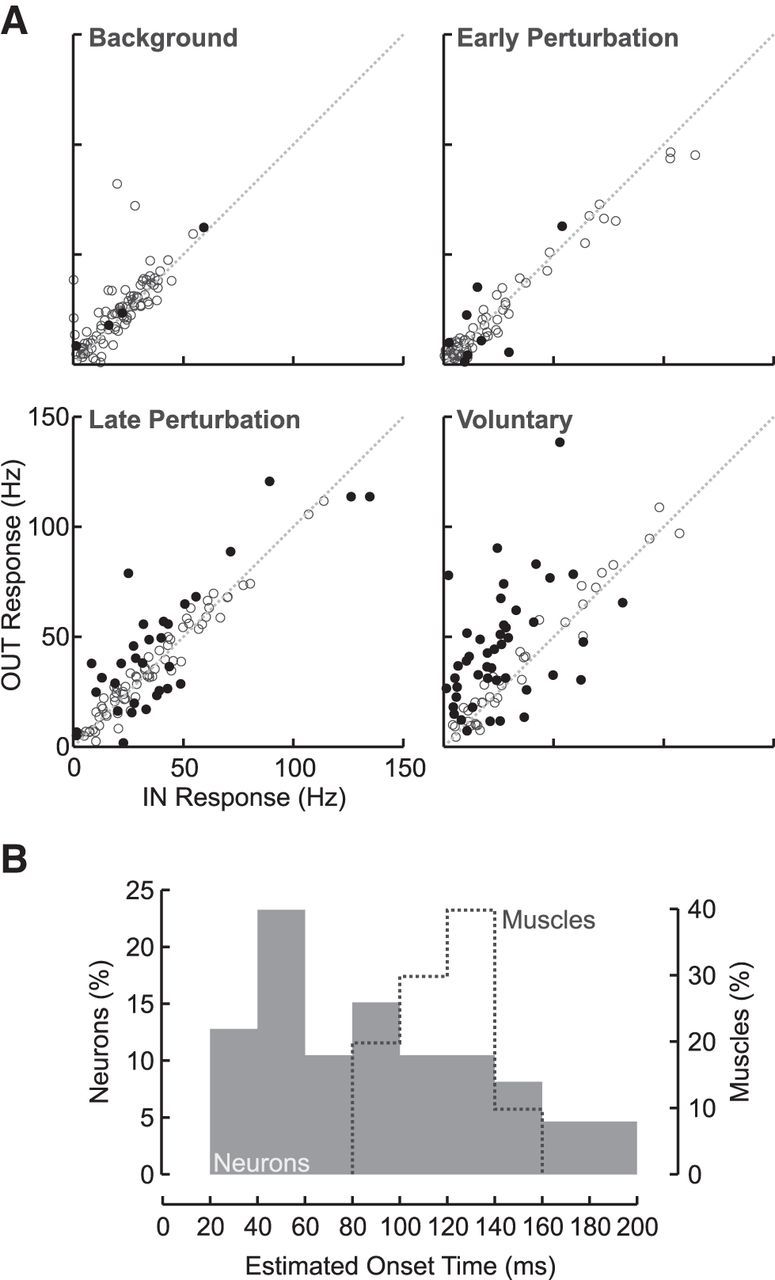
M1 responses in the spatial-target perturbation task at the level of single neurons. A, Scatter plot showing the mean response for the IN and OUT targets during the four response epochs. Each dot represents a single M1 neuron. For the baseline epoch, filled dots represent those neurons showing significant target-dependent changes (Baseline OUT − Baseline IN; two-sample, two-tailed, t test, p < 0.05). For the early perturbation, late perturbation, and voluntary epochs, responses are plotted relative to their own baseline (i.e., evoked OUT − baseline OUT vs evoked IN − baseline IN). Filled dots represent those neurons showing significant target-dependent changes over and above their baseline changes (two-sample, two-tailed, t test, p < 0.05). B, Histograms showing the onset time of significant goal-dependent activity (running t test; p < 0.05 for 5 consecutive samples, 5 ms; see Materials and Methods) for neurons (filled) and muscles (dashed). Note that only those neurons and muscles with onset times <200 ms are shown.
Like muscles, we found that CENTER target responses were either intermediate to the IN and OUT targets or not significantly different from either the IN or the OUT target. Unlike muscles, however, many neurons showed significantly larger evoked responses for the IN target than the OUT target (50, 40, and 27% of the significant neurons in the early perturbation, late perturbation, and voluntary epochs, respectively). A neuron's target preference (in all the various epochs) could not be readily predicted from its sensitivity to mechanical perturbations or from its preference for particular steady-state loads, as estimated from the posture perturbation task. We did, however, find a categorical relationship between a neuron's spatial target preference during the baseline epoch and following perturbation onset whereby neurons showed perturbation-evoked changes that accentuated changes already present during the baseline at levels greater than expected by chance (95% CI of chance given N = 104, 18–35%; early perturbation epoch results = 45%; late perturbation epoch = 52%; voluntary epoch = 59%). However, a simple link between baseline and postperturbation target-sensitivity could not explain the responses of the many neurons that switched their target preference following perturbation onset (Fig. 9A). In fact, 28 of 67 neurons that showed a significant target preference in either the late perturbation or voluntary epoch changed their preference between the two epochs (Fig. 9B), mostly from an anti-muscle like pattern (IN > OUT) in the late perturbation epoch to a muscle-like pattern (OUT > IN) in the voluntary epoch.
Figure 9.

Relating target preference during the late perturbation and voluntary epochs. A, Responses from an exemplar neuron in the spatial-target perturbation task. The blue and red traces represent mean responses for the IN and OUT targets, respectively. This neuron is of particular interest because it shows smaller responses for the OUT target in the late perturbation epoch but greater responses for the OUT target in the voluntary epoch. B, Scatter plot depicting target-dependent responses in the late perturbation and voluntary epochs. Each dot represents a single neuron. Filled dots represent neurons that show significant target-dependent activity in either the late perturbation or voluntary epochs. Neurons in the upper-right and lower-left quadrants show consistent target-dependent responses whereas those neurons in the other two quadrants switch preferences between epochs. C, Mean goal-dependent response across the population of M1 neurons that individually show a significant effect of spatial target position in the late perturbation epoch (N = 35). Data aligned on perturbation onset (vertical black line). Horizontal bars indicate response epochs (E, early perturbation; L, late perturbation; V, voluntary). The black line and gray error boundary (±1 SEM) represents the signed difference as a function of target position (i.e., OUT-IN). The black line and green error boundary represents the unsigned difference in activity between target positions (i.e., OUT-IN or IN-OUT depending on neuron preference in the late perturbation epoch). The dashed line indicates how much of the unsigned goal-dependent response could occur by chance given noise in the empirical data (see Materials and Methods).
This complex pattern of spatial target sensitivity likely explains why the population signal based simply on target position (i.e., OUT-IN; Fig. 7B) indicated that goal-dependent modulation started in the late perturbation epoch whereas analyzing single neurons revealed goal-dependent responses starting in the early perturbation epoch (Fig. 8B). That is, the presence and relative balance of muscle-like and anti-muscle-like responses in the early perturbation epoch may have yielded no net response when the two opposing signals were simply averaged together. We confirmed this notion by calculating signed (i.e., OUT-IN) and unsigned (i.e., OUT-IN if OUT > IN in the late perturbation epoch; IN-OUT if IN > OUT in the late perturbation epoch; see Materials and Methods) population responses for those neurons that individually showed significant goal-dependent responses in the late perturbation epoch (N = 35). As in Figure 7B, the signed population response (Fig. 9C, gray) showed goal-dependent activity that started in the late perturbation epoch, ∼50 ms after perturbation onset, and peaked ∼200 ms after perturbation onset. In contrast, the unsigned population response (Fig. 9C, green) showed goal-dependent activity that started in the early perturbation epoch, and was clearly evident ∼35 ms after perturbation onset. Interestingly, the unsigned population response, which was sorted based on responses in the late-perturbation epoch (see Materials and Methods), rapidly decayed ∼100 ms after perturbation onset and actually became smaller than the signed population response in the voluntary epoch, consistent with the fact that many of these neurons switched their target preference between the late perturbation and voluntary epochs (Fig. 9B). Both of these effects were evident even when accounting for potential biases associated with calculating the unsigned population signal (see Materials and Methods; Fig. 9C, dashed).
Discussion
We tested whether goal-dependent modulation of fast feedback responses in M1 is present under experimental conditions matching the dominant human approach (Shemmell et al., 2010; Pruszynski and Scott, 2012). Critical to this effort was replacing verbal instructions with target locations and temporal constraints that yielded similar behavior (Pruszynski et al., 2008). There were several notable findings. First, monkey muscles, like human muscles, showed a multiphasic response (Hammond, 1955; Lee and Tatton, 1982) with little or no goal-dependent modulation until the long-latency epoch, ∼70 ms after perturbation onset (Hammond, 1956; Crago et al., 1976; Colebatch et al., 1979; Rothwell et al., 1980; Lewis et al., 2006; Pruszynski et al., 2008; Dimitriou et al., 2012). Second, goal-dependent modulation in M1 neurons became clearly evident ∼35 ms after perturbation onset, early enough to account for goal-dependent modulation in the muscles. Third, most M1 neurons showed goal-dependent modulation similar to limb muscles with greater activity when the hand was pushed away from the goal target (OUT target) than toward the goal target (IN target). Fourth, a substantial number of M1 neurons displayed patterns not seen in muscles, including greater activity for the IN target, and changes in target preference over time.
Advantages of our experimental approach
We designed our experiment to permit direct comparison with the many human studies exploring goal-dependent modulation of rapid motor responses. The spatial and temporal constraints we used yielded kinematic behavior similar to humans in the same task (Pruszynski et al., 2008, 2011b) and when using verbal instructions (Hammond, 1956; Crago et al., 1976; Colebatch et al., 1979; Shemmell et al., 2009). Although Evarts and Tanji (1976) did not provide detailed behavioral results, their monkeys responded by moving the perturbing handle toward the limits of whole-arm flexion or extension. As such, their perturbation required the monkey to categorically activate different muscles. In contrast, our approach, like most human studies, required the monkey to variably activate the same muscle as a function of target position.
Our paradigm included a background load that preactivated the muscles stretched by the perturbation. Preactivating muscles is critical because silent muscles permit subthreshold changes in muscle activity (Capaday and Stein, 1987), which affect the sensitivity of stretch responses (Marsden et al., 1976; Bedingham and Tatton, 1984; Matthews, 1986; Pruszynski et al., 2009). Consistent with such a mechanism, previous monkey work reported substantial goal-dependent activity in M1 before perturbation onset (Tanji and Evarts, 1976) and of the short-latency stretch response (Evarts and Tanji, 1976). In contrast, we found much weaker goal-dependent changes in M1 activity before perturbation and, like most human studies, no significant changes in the short-latency stretch response (Hammond, 1956; Crago et al., 1976; Rothwell et al., 1980; Pruszynski et al., 2008).
The relative paucity of baseline modulation we observed is striking given previous reports of preparatory activity in M1 (Cohen et al., 2010). For example, Tanji and Evarts (1976) reported that ∼75% of M1 neurons showed significant preparatory activity and that 50% changed their preparatory firing rate by >10 Hz. In contrast, we found that only 4% of neurons showed significant preparatory changes and that 11% changed their preparatory firing rate by >10 Hz. This difference is unlikely due to our shorter preparatory period as most of their neurons showed preparatory changes within 500 ms and our preparatory period lasted at least 1 s. One plausible explanation is that our task required more similar motor responses and thus more similar preparatory activity. That is, our monkeys had to generate varying responses with the same muscle rather than categorically different responses with different muscle groups. Another likely explanation is that some of the preparatory activity reported by Tanji and Evarts (1976) actually reflected subthreshold changes in muscle activity. This is not to say that preparatory activity cannot exist with preactivated muscles (Kaufman et al., 2014), but rather that the amount of preparatory activity cannot be certain unless muscle activity is measured from preactivated and task-relevant muscles.
Neural basis of goal-dependent modulation
The presence of goal-dependent activity in M1 before goal-dependent changes in muscle activity does not establish a causal link between the two. Goal-dependent activity in M1 may reflect contributions from other neural structures rather than its own intrinsic processing. One candidate is the dentate nucleus of the cerebellum, which has been shown to demonstrate goal-dependent modulation (Strick, 1983). In fact, deactivating the cerebellum leads to selective removal of the entire late perturbation response in M1 (Vilis et al., 1976). Another possibility is that goal-dependent modulation reflects a preplanned voluntary movement (Crago et al., 1976) stored in brainstem networks and triggered by the perturbation (Shemmell et al., 2009, 2010). Although brainstem may contribute, the robust presence of very fast goal-dependent modulation in M1, even when motor output can be preplanned, indicates that brainstem mechanisms do not act in isolation.
Motivated by the notion that goal-dependent activity reflects brainstem outputs, one recent study suggested that M1 does not contribute to goal-dependent modulation of the long-latency stretch response (Shemmell et al., 2009). The authors found that TMS-evoked silence reduced the modulation of long-latency muscle responses associated with environmental properties but not modulation associated with verbal instructions. The second finding conflicts with our results and other studies in humans (Kimura et al., 2006; Spieser et al., 2010) and monkeys (Evarts and Tanji, 1976). The authors suggested that this discrepancy reflects differences in experimental approach, especially the behavior and the state of the muscle before perturbation. As these factors do not apply in the context of our study, we favor an alternative explanation based on the notion that TMS primarily influences nonpyramidal neurons (Werhahn et al., 1999; Terao and Ugawa, 2002). Specifically, that goal-dependent modulation in M1 is preferentially signaled by pyramidal neurons. Direct evidence for this hypothesis is lacking because we did not identify our neurons, but it is consistent with the fact that our unselective approach apparently yielded a smaller proportion of goal-dependent neurons than work focusing on pyramidal tract neurons (Evarts and Tanji, 1976).
Difference between neurons and muscles
We found that most M1 neurons and all muscles displayed greater responses for the OUT target than the IN target. This finding is consistent with previous reports that most M1 neurons are excited by mechanical perturbations that oppose their preferred movement direction (Evarts and Granit, 1976). Strikingly, we also found that many neurons showed the opposite pattern, greater responses for the IN target than the OUT target, and that some neurons switched their preference over time from one target to the other.
These responses are counter-intuitive because they cannot be directly related to motor behavior in terms of a particular movement parameter. However, this diversity is consistent with a growing number of studies emphasizing the heterogeneity of M1 neurons and their complex relationship with the peripheral apparatus when initiating and executing a voluntary motor action (Shenoy et al., 2013). For example, a neuron's directional tuning during the preparatory period can differ from its tuning during movement (Kurtzer et al., 2005; Churchland et al., 2010) and directional tuning often changes over the course of a movement (Sergio et al., 2005; Churchland and Shenoy, 2007; Hatsopoulos et al., 2007; Churchland et al., 2012). Here we demonstrate that similar diversity exists when M1 neurons are producing fast feedback responses to mechanical perturbations, as some neurons change their preference over the course of the motor response (i.e., from the late perturbation to voluntary epochs). We are actively investigating whether this transition reflects a network-wide shift in control processes, as the monkey switches between task goals (Pruszynski et al., 2008; Nashed et al., 2014), in this case from maintaining posture at the start target to moving toward the goal target.
It is important to emphasize that, though such complexity beguiles classical notions that M1 neurons statically encode particular movement parameters, it can be readily understood in the context of a highly redundant neural network whose causal function is to control movement (Shenoy et al., 2013). For such a network, there is no need for any individual neuron to maintain a simple relationship to particular movement parameters because it is the net action of the population of neurons that drives motor behavior (Fetz, 1992; Robinson, 1992; Todorov, 2000; Churchland and Shenoy, 2007; Lillicrap and Scott, 2013).
Interpreting average neural activity
The notable fraction of neurons that responded more robustly for the IN target than the OUT target has profound implications on studies using EEG or fMRI in search of goal-dependent signals in M1 (Abbruzzese et al., 1985; MacKinnon et al., 2000; de Graaf et al., 2009; Spieser et al., 2010). Because these techniques measure average activity, observing no goal-dependent changes (MacKinnon et al., 2000) may reflect a relative balance between excitatory and inhibitory changes across M1 neurons rather than an absence of target-dependent modulation per se, just as we show in the early perturbation epoch. Even if the goal-dependent signal is not abolished, as shown here in the late perturbation and voluntary epochs as well as in several EEG studies (Abbruzzese et al., 1985; Spieser et al., 2010), the balance will lead to underestimating the size of goal-dependent responses. Moreover, it is very difficult to attribute a population level result to single neurons. For example, we found that 42% of neurons with significant target preference switched their preference between the late perturbation and voluntary epochs mostly from greater IN responses to greater OUT responses. Based on EEG, this switching had been previously attributed to differential engagement of separate M1 neurons (Spieser et al., 2010). Together, these findings reemphasize the difficulty of generalizing from average measures of neural activity to the underlying responses of individual neurons.
Footnotes
This work was supported by the Canadian Institutes of Health Research (CIHR). J.A.P. received salary awards from CIHR and the Human Frontier Science Program, M.O. received a Vanier Doctoral Award from CIHR, and S.H.S. is supported by a GSK-CIHR Chair in Neuroscience. We thank Kim Moore and Justin Peterson for their technical support.
S.H.S. is associated with BKIN Technologies, which commercializes the KINARM device used in this study.
References
- Abbruzzese G, Berardelli A, Rothwell JC, Day BL, Marsden CD. Cerebral potentials and electromyographic responses evoked by stretch of wrist muscles in man. Exp Brain Res. 1985;58:544–551. doi: 10.1007/BF00235870. [DOI] [PubMed] [Google Scholar]
- Batschelet E. Circular statistics in biology. New York: Academic; 1981. [Google Scholar]
- Bedingham W, Tatton WG. Dependence of EMG responses evoked by imposed wrist displacements on pre-existing activity in the stretched muscles. Can J Neurol Sci. 1984;11:272–280. doi: 10.1017/s0317167100045534. [DOI] [PubMed] [Google Scholar]
- Capaday C, Stein RB. A method for simulating the reflex output of a motoneuron pool. J Neurosci Methods. 1987;21:91–104. doi: 10.1016/0165-0270(87)90107-5. [DOI] [PubMed] [Google Scholar]
- Cheney PD, Fetz EE. Corticomotoneuronal cells contribute to long-latency stretch reflexes in the rhesus monkey. J Physiol. 1984;349:249–272. doi: 10.1113/jphysiol.1984.sp015155. [DOI] [PMC free article] [PubMed] [Google Scholar]
- Churchland MM, Shenoy KV. Temporal complexity and heterogeneity of single-neuron activity in premotor and motor cortex. J Neurophysiol. 2007;97:4235–4257. doi: 10.1152/jn.00095.2007. [DOI] [PubMed] [Google Scholar]
- Churchland MM, Cunningham JP, Kaufman MT, Ryu SI, Shenoy KV. Cortical preparatory activity: representation of movement or first cog in a dynamical machine? Neuron. 2010;68:387–400. doi: 10.1016/j.neuron.2010.09.015. [DOI] [PMC free article] [PubMed] [Google Scholar]
- Churchland MM, Cunningham JP, Kaufman MT, Foster JD, Nuyujukian P, Ryu SI, Shenoy KV. Neural population dynamics during reaching. Nature. 2012;487:51–56. doi: 10.1038/nature11129. [DOI] [PMC free article] [PubMed] [Google Scholar]
- Cohen O, Sherman E, Zinger N, Perlmutter S, Prut Y. Getting ready to move: transmitted information in the corticospinal pathway during preparation for movement. Curr Opin Neurobiol. 2010;20:696–703. doi: 10.1016/j.conb.2010.09.001. [DOI] [PMC free article] [PubMed] [Google Scholar]
- Colebatch JG, Gandevia SC, McCloskey DI, Potter EK. Subject instruction and long latency reflex responses to muscle stretch. J Physiol. 1979;292:527–534. doi: 10.1113/jphysiol.1979.sp012869. [DOI] [PMC free article] [PubMed] [Google Scholar]
- Crago PE, Houk JC, Hasan Z. Regulatory actions of human stretch reflex. J Neurophysiol. 1976;39:925–935. doi: 10.1152/jn.1976.39.5.925. [DOI] [PubMed] [Google Scholar]
- de Graaf JB, Frolov A, Fiocchi M, Nazarian B, Anton JL, Pailhous J, Bonnard M. Preparing for a motor perturbation: early implication of primary motor and somatosensory cortices. Hum Brain Mapp. 2009;30:575–587. doi: 10.1002/hbm.20526. [DOI] [PMC free article] [PubMed] [Google Scholar]
- Dimitriou M, Franklin DW, Wolpert DM. Task-dependent coordination of rapid bimanual motor responses. J Neurophysiol. 2012;107:890–901. doi: 10.1152/jn.00787.2011. [DOI] [PMC free article] [PubMed] [Google Scholar]
- Evarts EV, Granit R. Relations of reflexes and intended movements. Prog Brain Res. 1976;44:1–14. doi: 10.1016/S0079-6123(08)60719-0. [DOI] [PubMed] [Google Scholar]
- Evarts EV, Tanji J. Reflex and intended responses in motor cortex pyramidal tract neurons of monkey. J Neurophysiol. 1976;39:1069–1080. doi: 10.1152/jn.1976.39.5.1069. [DOI] [PubMed] [Google Scholar]
- Fetz EE. Are movement parameters recognizably coded in the activity of single neurons. Behav Brain Sci. 1992;15:679–690. [Google Scholar]
- Fromm C, Evarts EV. Relation of motor cortex neurons to precisely controlled and ballistic movements. Neurosci Lett. 1977;5:259–265. doi: 10.1016/0304-3940(77)90076-3. [DOI] [PubMed] [Google Scholar]
- Graham KM, Moore KD, Cabel DW, Gribble PL, Cisek P, Scott SH. Kinematics and kinetics of multijoint reaching in nonhuman primates. J Neurophysiol. 2003;89:2667–2677. doi: 10.1152/jn.00742.2002. [DOI] [PubMed] [Google Scholar]
- Hammond PH. Involuntary activity in biceps following the sudden application of velocity to the abducted forearm. J Physiol. 1955;127:23–25P. [PMC free article] [PubMed] [Google Scholar]
- Hammond PH. The influence of prior instruction to the subject on an apparently involuntary neuro-muscular response. J Physiol. 1956;132:17–18P. [PubMed] [Google Scholar]
- Hatsopoulos NG, Suminski AJ. Sensing with the motor cortex. Neuron. 2011;72:477–487. doi: 10.1016/j.neuron.2011.10.020. [DOI] [PMC free article] [PubMed] [Google Scholar]
- Hatsopoulos NG, Xu Q, Amit Y. Encoding of movement fragments in the motor cortex. J Neurosci. 2007;27:5105–5114. doi: 10.1523/JNEUROSCI.3570-06.2007. [DOI] [PMC free article] [PubMed] [Google Scholar]
- Herter TM, Kurtzer I, Cabel DW, Haunts KA, Scott SH. Characterization of torque-related activity in primary motor cortex during a multijoint postural task. J Neurophysiol. 2007;97:2887–2899. doi: 10.1152/jn.00757.2006. [DOI] [PubMed] [Google Scholar]
- Herter TM, Korbel T, Scott SH. Comparison of neural responses in primary motor cortex to transient and continuous loads during posture. J Neurophysiol. 2009;101:150–163. doi: 10.1152/jn.90230.2008. [DOI] [PubMed] [Google Scholar]
- Kaufman MT, Churchland MM, Ryu SI, Shenoy KV. Cortical activity in the null space: permitting preparation without movement. Nat Neurosci. 2014;17:440–448. doi: 10.1038/nn.3643. [DOI] [PMC free article] [PubMed] [Google Scholar]
- Kimura T, Haggard P, Gomi H. Transcranial magnetic stimulation over sensorimotor cortex disrupts anticipatory reflex gain modulation for skilled action. J Neurosci. 2006;26:9272–9281. doi: 10.1523/JNEUROSCI.3886-05.2006. [DOI] [PMC free article] [PubMed] [Google Scholar]
- Kurtzer I, Herter TM, Scott SH. Random change in cortical load representation suggests distinct control of posture and movement. Nat Neurosci. 2005;8:498–504. doi: 10.1038/nn1420. [DOI] [PubMed] [Google Scholar]
- Kurtzer I, Pruszynski JA, Herter TM, Scott SH. Primate upper limb muscles exhibit activity patterns that differ from their anatomical action during a postural task. J Neurophysiol. 2006;95:493–504. doi: 10.1152/jn.00706.2005. [DOI] [PubMed] [Google Scholar]
- Lee RG, Tatton WG. Long latency reflexes to imposed displacements of the human wrist- dependence on duration of movement. Exp Brain Res. 1982;45:207–216. doi: 10.1007/BF00235780. [DOI] [PubMed] [Google Scholar]
- Lewis GN, MacKinnon CD, Perreault EJ. The effect of task instruction on the excitability of spinal and supraspinal reflex pathways projecting to the biceps muscle. Exp Brain Res. 2006;174:413–425. doi: 10.1007/s00221-006-0475-x. [DOI] [PMC free article] [PubMed] [Google Scholar]
- Lillicrap TP, Scott SH. Preference distributions of primary motor cortex neurons reflect control solutions optimized for limb biomechanics. Neuron. 2013;77:168–179. doi: 10.1016/j.neuron.2012.10.041. [DOI] [PubMed] [Google Scholar]
- MacKinnon CD, Verrier MC, Tatton WG. Motor cortical potentials precede long-latency EMG activity evoked by imposed displacements of the human wrist. Exp Brain Res. 2000;131:477–490. doi: 10.1007/s002219900317. [DOI] [PubMed] [Google Scholar]
- Marsden CD, Merton PA, Morton HB. Stretch reflex and servo action in a variety of human muscles. J Physiol. 1976;259:531–560. doi: 10.1113/jphysiol.1976.sp011481. [DOI] [PMC free article] [PubMed] [Google Scholar]
- Matthews PB. Observations on the automatic compensation of reflex gain on varying the pre-existing level of motor discharge in man. J Physiol. 1986;374:73–90. doi: 10.1113/jphysiol.1986.sp016066. [DOI] [PMC free article] [PubMed] [Google Scholar]
- Nashed JY, Crevecoeur F, Scott SH. Rapid online selection between multiple motor plans. J Neurosci. 2014;34:1769–1780. doi: 10.1523/JNEUROSCI.3063-13.2014. [DOI] [PMC free article] [PubMed] [Google Scholar]
- Omrani M, Diedrichsen J, Scott SH. Rapid feedback corrections during a bimanual postural task. J Neurophysiol. 2013;109:147–161. doi: 10.1152/jn.00669.2011. [DOI] [PMC free article] [PubMed] [Google Scholar]
- Picard N, Smith AM. Primary motor cortical responses to perturbations of prehension in the monkey. J Neurophysiol. 1992;68:1882–1894. doi: 10.1152/jn.1992.68.5.1882. [DOI] [PubMed] [Google Scholar]
- Porter R, Lemon RN. Corticospinal function and voluntary movement. New York: Oxford UP; 1993. [Google Scholar]
- Pruszynski JA, Scott SH. Optimal feedback control and the long-latency stretch response. Exp Brain Res. 2012;218:341–359. doi: 10.1007/s00221-012-3041-8. [DOI] [PubMed] [Google Scholar]
- Pruszynski JA, Kurtzer I, Scott SH. Rapid motor responses are appropriately tuned to the metrics of a visuospatial task. J Neurophysiol. 2008;100:224–238. doi: 10.1152/jn.90262.2008. [DOI] [PubMed] [Google Scholar]
- Pruszynski JA, Kurtzer I, Lillicrap TP, Scott SH. Temporal evolution of “automatic gain-scaling.”. J Neurophysiol. 2009;102:992–1003. doi: 10.1152/jn.00085.2009. [DOI] [PMC free article] [PubMed] [Google Scholar]
- Pruszynski JA, Kurtzer I, Nashed JY, Omrani M, Brouwer B, Scott SH. Primary motor cortex underlies multi-joint integration for fast feedback control. Nature. 2011a;478:387–390. doi: 10.1038/nature10436. [DOI] [PMC free article] [PubMed] [Google Scholar]
- Pruszynski JA, Kurtzer I, Scott SH. The long-latency reflex is composed of at least two functionally independent processes. J Neurophysiol. 2011b;106:449–459. doi: 10.1152/jn.01052.2010. [DOI] [PubMed] [Google Scholar]
- Robinson DA. Implications of neural networks for how we think about brain function. Behav Brain Sci. 1992;15:644–655. [Google Scholar]
- Rothwell JC, Traub MM, Marsden CD. Influence of voluntary intent on the human long-latency stretch reflex. Nature. 1980;286:496–498. doi: 10.1038/286496a0. [DOI] [PubMed] [Google Scholar]
- Scott SH. Apparatus for measuring and perturbing shoulder and elbow joint positions and torques during reaching. J Neurosci Methods. 1999;89:119–127. doi: 10.1016/S0165-0270(99)00053-9. [DOI] [PubMed] [Google Scholar]
- Scott SH. Optimal feedback control and the neural basis of volitional motor control. Nat Rev Neurosci. 2004;5:532–546. doi: 10.1038/nrn1427. [DOI] [PubMed] [Google Scholar]
- Scott SH. The computational and neural basis of voluntary motor control and planning. Trends Cogn Sci. 2012;16:541–549. doi: 10.1016/j.tics.2012.09.008. [DOI] [PubMed] [Google Scholar]
- Sergio LE, Hamel-Pâquet C, Kalaska JF. Motor cortex neural correlates of output kinematics and kinetics during isometric-force and arm-reaching tasks. J Neurophysiol. 2005;94:2353–2378. doi: 10.1152/jn.00989.2004. [DOI] [PubMed] [Google Scholar]
- Shapiro MB, Gottlieb GL, Moore CG, Corcos DM. Electromyographic responses to an unexpected load in fast voluntary movements: descending regulation of segmental reflexes. J Neurophysiol. 2002;88:1059–1063. doi: 10.1152/jn.2002.88.2.1059. [DOI] [PubMed] [Google Scholar]
- Shemmell J, An JH, Perreault EJ. The differential role of motor cortex in stretch reflex modulation induced by changes in environmental mechanics and verbal instruction. J Neurosci. 2009;29:13255–13263. doi: 10.1523/JNEUROSCI.0892-09.2009. [DOI] [PMC free article] [PubMed] [Google Scholar]
- Shemmell J, Krutky MA, Perreault EJ. Stretch sensitive reflexes as an adaptive mechanism for maintaining limb stability. Clin Neurophysiol. 2010;121:1680–1689. doi: 10.1016/j.clinph.2010.02.166. [DOI] [PMC free article] [PubMed] [Google Scholar]
- Shenoy KV, Sahani M, Churchland MM. Cortical control of arm movements: a dynamical systems perspective. Annu Rev Neurosci. 2013;36:337–359. doi: 10.1146/annurev-neuro-062111-150509. [DOI] [PubMed] [Google Scholar]
- Spieser L, Meziane HB, Bonnard M. Cortical mechanisms underlying stretch reflex adaptation to intention: a combined EEG-TMS study. Neuroimage. 2010;52:316–325. doi: 10.1016/j.neuroimage.2010.04.020. [DOI] [PubMed] [Google Scholar]
- Strick PL. The influence of motor preparation on the response of cerebellar neurons to limb displacements. J Neurosci. 1983;3:2007–2020. doi: 10.1523/JNEUROSCI.03-10-02007.1983. [DOI] [PMC free article] [PubMed] [Google Scholar]
- Tanji J, Evarts EV. Anticipatory activity of motor cortex neurons in relation to direction of an intended movement. J Neurophysiol. 1976;39:1062–1068. doi: 10.1152/jn.1976.39.5.1062. [DOI] [PubMed] [Google Scholar]
- Terao Y, Ugawa Y. Basic mechanisms of TMS. J Clin Neurophysiol. 2002;19:322–343. doi: 10.1097/00004691-200208000-00006. [DOI] [PubMed] [Google Scholar]
- Thompson KG, Hanes DP, Bichot NP, Schall JD. Perceptual and motor processing stages identified in the activity of macaque frontal eye field neurons during visual search. J Neurophysiol. 1996;76:4040–4055. doi: 10.1152/jn.1996.76.6.4040. [DOI] [PubMed] [Google Scholar]
- Todorov E. Direct cortical control of muscle activation in voluntary arm movements: a model. Nat Neurosci. 2000;3:391–398. doi: 10.1038/73964. [DOI] [PubMed] [Google Scholar]
- Vilis T, Hore J, Meyer-Lohmann J, Brooks VB. Dual nature of the precentral responses to limb perturbations revealed by cerebellar cooling. Brain Res. 1976;117:336–340. doi: 10.1016/0006-8993(76)90743-5. [DOI] [PubMed] [Google Scholar]
- Werhahn KJ, Kunesch E, Noachtar S, Benecke R, Classen J. Differential effects on motorcortical inhibition induced by blockade of GABA uptake in humans. J Physiol. 1999;517:591–597. doi: 10.1111/j.1469-7793.1999.0591t.x. [DOI] [PMC free article] [PubMed] [Google Scholar]