

Abstract
Selective attention to relevant sound properties is essential for everyday listening situations. It enables the formation of different perceptual representations of the same acoustic input and is at the basis of flexible and goal-dependent behavior. Here, we investigated the role of the human auditory cortex in forming behavior-dependent representations of sounds. We used single-trial fMRI and analyzed cortical responses collected while subjects listened to the same speech sounds (vowels /a/, /i/, and /u/) spoken by different speakers (boy, girl, male) and performed a delayed-match-to-sample task on either speech sound or speaker identity. Univariate analyses showed a task-specific activation increase in the right superior temporal gyrus/sulcus (STG/STS) during speaker categorization and in the right posterior temporal cortex during vowel categorization. Beyond regional differences in activation levels, multivariate classification of single trial responses demonstrated that the success with which single speakers and vowels can be decoded from auditory cortical activation patterns depends on task demands and subject's behavioral performance. Speaker/vowel classification relied on distinct but overlapping regions across the (right) mid-anterior STG/STS (speakers) and bilateral mid-posterior STG/STS (vowels), as well as the superior temporal plane including Heschl's gyrus/sulcus. The task dependency of speaker/vowel classification demonstrates that the informative fMRI response patterns reflect the top-down enhancement of behaviorally relevant sound representations. Furthermore, our findings suggest that successful selection, processing, and retention of task-relevant sound properties relies on the joint encoding of information across early and higher-order regions of the auditory cortex.
Keywords: auditory cortex, fMRI decoding, speech, voice, vowels
Introduction
In natural listening situations, we are surprisingly efficient in selecting, grouping and processing relevant acoustic elements of a sound while ignoring other elements of the same sound and the possible interference of background noise. This processing enables deriving distinct perceptual representations from the same acoustic input and is at the basis of adaptive and goal-oriented behavior. Whether and how the auditory cortex contributes to the formation of these representations remains largely unknown. In ferrets, neurons in the primary auditory cortex (PAC) have been shown to selectively tune their receptive field properties to behaviorally relevant auditory features (Fritz et al., 2003; Atiani et al., 2009), which suggests that goal-dependent sound representations may emerge already in PAC. In humans, fMRI responses in posterior auditory cortical regions were shown to become right lateralized during a pitch categorization task and left lateralized during a duration categorization task using the same frequency-modulated tones (Brechmann and Scheich, 2005), which suggests that modulatory and task-dependent effects are strongest in nonprimary subregions within the auditory cortex.
Selective grouping and processing of specific acoustic elements is also pertinent to the extraction of different types of information from complex and socially relevant signals such as speech. For example, extracting phonemic categories requires a grouping of auditory features along the relevant dimension (e.g., formants of a vowel) independently of variations in other dimensions (e.g., fundamental frequency [F0] of a speaker's voice). Similarly, recognizing a voice requires extracting speaker specific acoustic characteristics (e.g., F0, timbre), independently of phonemic content. Task-dependent perceptual representations of multidimensional speech stimuli may emerge in specialized higher-order modules; for example, in the posterior superior temporal cortex for speech content (von Kriegstein et al., 2010; Mesgarani and Chang, 2012) and in the right anterior superior temporal sulcus for speaker identity (Belin and Zatorre, 2003; von Kriegstein et al., 2003). Behavioral requirements may additionally modulate spatially distributed auditory/perceptual mechanisms involving early auditory cortical areas (Formisano et al., 2008; Kilian-Hütten et al., 2011a). For example, the specific task requirement may trigger the temporal binding of multiple (and spatially distant) neuronal populations, each encoding for relevant acoustic or perceptual features, thereby forming distributed representations of speech or speaker categories (Bonte et al., 2009).
The present fMRI study investigates the role of early and higher-order auditory cortex in forming goal-dependent representations of speech. Previous fMRI studies have investigated task-dependent speech processing by analyzing regional changes in averaged activity across different experimental conditions. Here, we apply multivariate pattern recognition techniques to single-trial fMRI responses and examine how task demands influence the spatial pattern of neural responses to individual sounds. We asked our subjects to perform delayed-match-to-sample tasks on either speaker or vowel identity and decode the neural representation of individual vowels or speakers in these two task contexts. Furthermore, we study the specific contribution to speaker identification of higher-order voice-selective areas by performing region-of-interest (ROI)-based analyses using independently acquired voice localizer data (Belin et al., 2000).
Materials and Methods
Participants
Ten healthy native Dutch adults (mean (SD) age 24.1 ± 2.4 years, 6 females, 9 right-handed) gave their written informed consent and participated in the study. Handedness was assessed by a handedness questionnaire adapted from Annett (1979). None of the participants had a history of neurological abnormalities and all had normal hearing as assessed with a pure tone audiogram (detection thresholds of frequencies from 250 to 8000 Hz at 0–20 decibels). Participants received a monetary reward for participation. Approval for the study was granted by the Ethical Committee of the Faculty of Psychology and Neuroscience at Maastricht University.
Stimuli
Stimuli were speech sounds consisting of three natural Dutch vowels (/a/, /i/, and /u/) spoken by three native Dutch speakers (sp1: 9-year-old boy, sp2: 9-year-old girl, and sp3: adult male). To introduce acoustic variability typical of natural speech perception, for each vowel and for each speaker, we included two different tokens. For example, condition “a-sp1” included two different utterances of the vowel /a/ spoken by speaker 1 (Fig. 1B). We used children voices in addition to an adult voice because a shorter version of the experiment was used in a subsequent developmental fMRI study. Furthermore, this allowed investigating the recognition of children's voices that, unlike adult voices, are not readily distinguished based on F0 and the identification of which additionally relies on formant frequencies (Bennet and Weinberg, 1979; Perry et al., 2001). Stimuli were digitized at a sampling rate of 44.1 kHz, D/A converted with 16 bit resolution, band-pass filtered (80=10.5 kHz), down-sampled to 22.05 kHz, and edited with PRAAT software (Boersma and Weenink, 2002). Stimulus length was equalized to 350 ms (original range 258–364 ms) using PSOLA (100–400 Hz as extrema for the F0 contour). We carefully checked our stimuli for possible alterations in F0 after length equalization and did not find any detectable changes. Sound intensity level was numerically equalized across stimuli by matching peak amplitudes. To avoid acoustic transients (clicks) that would be created by a sharp cutoff, stimuli were faded with 100 ms exponential onset and offset ramps.
Figure 1.

Stimuli and design. A, Spectrograms of one exemplar of each of the 9 speech conditions. Stimuli consisted of three vowels (/a/, /i/, /u/) pronounced by three speakers (sp1:boy, sp2:girl, sp3:male). B, F1/F2 formant values for all stimuli (2 utterances per vowel for each speaker) and mean ± SD fundamental frequency (F0) values for each of the three speakers. C, Schematic overview of an experimental trial and the fMRI stimulation protocol including a black-and-white version of the ‘boy’ decision picture. Decision pictures consisted of cartoons of a boy, a girl or a man (speaker task), or the letter combinations ‘aa’, ‘ie’ and ‘oe’, corresponding to the pronunciation of the 3 Dutch vowels (vowel task).
Experimental design and procedure
We investigated task-dependent processing of speaker and vowel identity by comparing the processing of the 9 speech conditions (a-sp1, a-sp2, a-sp3, i-sp1, i-sp2, i-sp3, u-sp1, u-sp2, u-sp3) during the performance of delayed-match-to-sample tasks on either speaker or vowel identity (Fig. 1C). Both tasks consisted of the following: (1) the presentation of one of the speech stimuli (350 ms), followed by (2) a decision picture presented at the center of the screen 5.1 s after speech stimulus offset, followed by (3) a match/mismatch response of the participant indicated by pressing a response button with the right index or middle finger respectively. During the speaker task, decision pictures consisted of cartoons of a boy (see Fig. 1C for a black-and-white version), a girl, or a man. During the vowel task, decision pictures consisted of the letter combinations “aa,” “ie,” and “oe,” corresponding to the pronunciation of the three Dutch vowels. Decision pictures remained on screen until the button press or for a maximum time of 5 s. The sequence of speech stimuli was pseudorandomized to avoid immediate repetitions of the same speech condition (e.g., a-sp1). Half of the trials included matching and the other half mismatching pictures presented in a pseudorandomized order balanced per task across experimental runs and for each of the nine speech conditions.
All subjects participated in 2 fMRI sessions with a between-session break of 1 to maximally 10 d. At the start of the first session, participants were familiarized with the three voices and performed practice trials to make sure both speaker and vowel tasks were understood and the three speakers and vowels were recognized correctly. The practice trials were repeated at the start of the second session. Both fMRI sessions consisted of 3 experimental runs, each run consisting of 4 alternations of the speaker and vowel tasks (runs 1, 3, and 5: speaker task - vowel task - vowel task - speaker task; runs 2, 4, and 6: vowel task - speaker task - speaker task - vowel task). We used 12 different sequences of speech stimuli, each of them occurring once in the speaker and once in the vowel task, across different fMRI sessions or (in two cases) in the first and third run of a session. In total, each run included 21 trials per task and 2 or 3 presentations of each of the 9 speech conditions. Across both fMRI sessions, each of the 9 speech conditions was presented 14 times per task.
fMRI measurement
Brain imaging was performed with a Siemens Allegra 3 tesla scanner (head setup) at the Maastricht Brain Imaging Center. During both fMRI sessions, 3 12 min functional runs were collected (3 mm × 3 mm × 3 mm) using a standard echoplanar imaging (EPI) sequence (TR = 2500 ms, TA = 2000 ms, FOV = 192 mm × 192 mm, matrix size = 64 × 64, TE = 32 ms). Each volume consisted of 33 slices (distance factor 10%) covering the whole brain except the most superior part of the posterior parietal cortex in some participants. Speech stimuli were presented binaurally at a comfortable listening level via MR-compatible headphones in the 500 ms silent gap between two volume acquisitions (Fig. 1C). According to a slow event-related design, the average intertrial interval between two speech stimuli was 15 s (range 12.5–17.5 s). Decision pictures were presented 5.1 s after the offset of the speech stimuli to allow a clear estimation of the auditory activation before the onset of visual and response-related activity. During both experimental sessions, a high-resolution structural scan (1 mm × 1 mm × 1 mm) was collected using a T1-weighted 3D ADNI sequence (TR = 2050 ms, TE = 2.6 ms, 192 sagittal slices).
In the second session, an additional 12.5 min voice localizer run was collected using the same EPI sequence and slice positioning of the main experiment, but with a TR of 3.0 s, leaving 1 s of silence for sound presentation. The voice localizer run consisted of 24 stimulation blocks (18 s/six volumes per block, one sound per volume) alternated with 12 s rest (four volumes). During the stimulation blocks, participants listened to vocal sounds (including seven nonspeech sounds and five meaningless speech sounds), other natural categories of sound (musical instruments, environmental and animal sounds both adapted from Belin et al., 2000)), or amplitude-modulated (8 Hz) tones ranging from 0.3–3 kHz.
fMRI preprocessing
Functional and anatomical data were first analyzed using BrainVoyager QX 2.6 (Brain Innovation). Preprocessing of functional data included slice scan-time correction (using sinc interpolation), high-pass temporal filtering to remove nonlinear drifts of five or less cycles per time course, 3D motion correction, coregistration to individual structural images, and normalization of anatomical and functional data to Talairach space (Goebel et al., 2006). All participants minimized head movements to maximally 2 mm in any direction. For univariate analysis, functional data were spatially smoothed with a Gaussian kernel of 4 mm × 4 mm × 4 mm FWHM. Multivariate analysis was performed on unsmoothed functional data. Based on the high-resolution anatomical scans, individual cortical surfaces were reconstructed from gray–white matter segmentations. An anatomically aligned group average cortical surface representation was obtained by aligning the individual cortical surfaces using a moving target group average approach based on curvature information (cortex-based alignment; Goebel et al., 2006).
Univariate fMRI analysis
To map fMRI signal time courses from volume space to surface space, values located between the gray/white matter boundary and up to 4 mm into gray matter toward the pial surface were sampled with trilinear interpolation and averaged, resulting in a single value for each vertex of a cortex mesh. Random effects general linear model (GLM) analysis was performed on time course data sampled on individual cortical surface meshes aligned to the cortical group surface mesh using cortex-based alignment. The GLM model included one predictor per condition (convolved with a double gamma hemodynamic response function) and confound predictors including each participant's motion correction parameters. Functional contrast maps (t-statistics) were calculated to assess sound-evoked fMRI responses during the speaker and vowel tasks (all sounds speaker task > baseline; all sounds vowel task > baseline). Direct task contrasts were analyzed for speaker task specific activity [(speaker task > vowel task) and (speaker task + vowel task > baseline)] and vowel task specific activity [(vowel task > speaker task) and (speaker task + vowel task > baseline)]. Univariate stimulus effects were analyzed for each of the three speakers independently of which vowel they pronounced [e.g., a-sp1 + i-sp1 + u-sp1 > (a-sp2 + i-sp2 + u-sp2 + a-sp3 + i-sp3 + u-sp3)/2] and for each of the three vowels independently of who pronounced the vowel [e.g., a-sp1 + a-sp2 + a-sp3 > (i-sp1 + i-sp2 + i-sp3 + u-sp1 + u-sp2 + u-sp3)/2]. Stimulus effects were analyzed in both the speaker and in the vowel task blocks. All functional contrast maps were corrected for multiple comparisons by applying a cluster-size threshold with an initial voxel-level threshold of p = 0.01 (overall activity) or p = 0.05 (task and stimulus contrasts) and submitting the maps to a whole-brain correction criterion based on the estimate of the map's spatial smoothness (Forman et al., 1995; Goebel et al., 2006).
Multivariate fMRI analysis
Multivoxel patterns of sound-evoked fMRI responses were analyzed by applying a machine learning algorithm (support vector machine, SVM; Vapnik, 1995) in three functional ROIs based on each single subject's voice-localizer data (Fig. 2). The first ROI included all auditory responsive voxels in the superior temporal cortex (STC ROI), the second ROI included all voice selective STC voxels (Voice ROI), and the third ROI was created by subtracting, in each individual subject, the voxels of the Voice ROI from those of the STC ROI. The STC ROI was defined from the independent localizer data by calculating for each subject a functional contrast map (voices + other + tones > silent baseline), applying a false discovery rate correction for multiple comparisons (at p < 0.05), and taking the intersection of this functional contrast map with an anatomical STC mask. The same anatomical STC mask was applied across subjects and, in all subjects, included the superior temporal plane, superior temporal gyrus (STG), and superior temporal sulcus (STS), as well as all superior temporal activity to voices, other natural categories, and tones. The Voice ROI was defined on each individual subject's cortical surface mesh and included regions showing significantly stronger activity to voices compared with both other sound categories and tones [voices > (other + tones)/2]. To prevent large between-subjects differences in the size of the voice ROIs, the exact statistical threshold was set on an individual basis (Frost et al., 2012; Bonte et al., 2013). The mean (SD) normalized (Talairach space) area of the Voice ROI corresponded to 496 (280) mm2 in the left hemisphere and 719 (303) mm2 in the right hemisphere. The average individual statistical threshold was set at p < 0.015, ranging from p < 0.05 in the participant with the smallest Voice ROI (left: 352 mm2, right: 468 mm2) to p < 0.000001 for the participant with the largest Voice ROI (left: 1087 mm2, right: 1145 mm2). As can be seen from the regions of high intersubject consistency (Fig. 2B, probabilistic group map), in each participant, the Voice ROI included bilateral clusters on the posterior STG/STS and on the middle STG/STS (at the lateral extremity of Heschl's sulcus (HS). Furthermore, in 7 of 10 participants, it also included bilateral clusters on the anterior STG/STS (at the lateral adjacency of Heschl's gyrus [HG]/First Transverse Sulcus), whereas in three participants, this anterior activity was only present in the right hemisphere (for similar results, see Moerel et al., 2012; Bonte et al., 2013).
Figure 2.
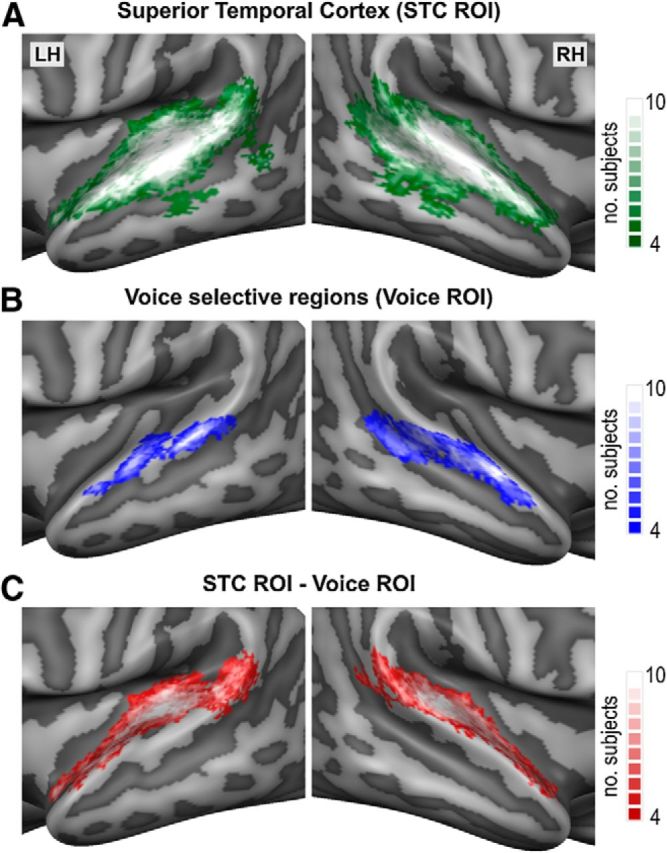
Regions of interest used for multivariate analysis. Probabilistic maps illustrating the spatial overlap of the individually determined Superior Temporal Cortex (STC; A), Voice selective (B), and STC - Voice selective (C) ROIs. The ROIs were determined and applied on an individual subject basis and served as masks in the individual 3D volume space. For illustrative purposes only, the ROIs are visualized as probabilistic maps ranging from 40–100% (n = 4 to n = 10) subject overlap and projected on inflated and cortex-based aligned group-averaged representations of the temporal cortex. LH= left hemisphere, RH= right hemisphere.
Classification procedure.
Preprocessed functional time series were first divided into “trials” (one trial per sound presentation). For both the speaker and vowel task, testing and validation sets were created using a 14-fold cross-validation procedure in which one trial of 14 was left out for every speech sound condition. As input to the classifiers (features), we used β estimates of the fitted double-gamma hemodynamic response, which were computed for single trials and voxels. For trial estimations, we considered one TR before sound onset and the first two TRs after sound onset. The β values were normalized across trials for each voxel using interquartile range normalization (the median, first, and third quartiles were estimated using training trials) as follows:
 |
where xi is the β value of the ith trial and Q2, Q1, and Q3 are the median, first, and third quartile, respectively. For each fold, normalization parameters were estimated on training trials across all nine speech sound conditions such that relative response differences between the stimuli were preserved. The interquartile range procedure is less sensitive to outliers than z-scores and, due to the scaling factor, provides comparable results when data are normally distributed. The voxels that were used to discriminate different speakers or vowels were specified by the three functional ROIs (Fig. 2). For classification, we used the SVM algorithm (soft margin parameter C = 1) as implemented in the spider toolbox (http://people.kyb.tuebingen.mpg.de/spider/). The three-class problem (classification of three speakers/vowels) was transformed into binary classifications using a one-versus-one scheme (i.e., sp1 vs sp2, sp1 vs sp3, and sp2 vs sp3 for speakers and /a/ vs /i/, /a/ vs /u/, and /i/ vs /u/ for vowels). In this approach, multiclass classification is based on classifying pairs of conditions and the prediction for a test trial is determined by the condition that the binary classifiers predict most often. When one trial was equally often assigned to two classes, the class with the highest score of the classifier was chosen as the predicted one. Speaker classification was performed by grouping the trials of the three speakers regardless of vowels (e.g., sp1 = a-sp1 + i-sp1 + u-sp1). Vowel classification was performed by grouping the trials of the three vowels regardless of speakers (e.g., /a/ = a-sp1 + a-sp2 + a-sp3). For each of the three binary classifications per task, model weights were used to indicate the importance of single voxels (see “Mapping of informative regions” section below). Classification performance was reported in terms of overall accuracy; that is, the number of correct predictions across speakers/vowels divided by the total number of speaker/vowel test trials. In the ROIs showing significant three-way classification, we additionally performed binary speaker/vowel classifications to determine the contribution of the individual speaker/vowel pairs.
Statistical testing.
To test whether classification values were significantly above chance, we performed the same multivoxel pattern analysis with randomly shuffled condition labels per subject (number of permutations = 99). On a group level, we performed a random-effects analysis using an exact permutation test (number of permutations = 1022; Good, 2000) and comparing the single-subject accuracy of speaker/vowel classification with the average permutation accuracy of the respective subject. Single-subject and group significance levels were estimated by counting the number of permutations in which the accuracy was larger than the actual classification accuracy and then dividing by the number of permutations (one count was added to both numerator and denominator for a more robust estimate of the significance value). To investigate the task dependence of speaker/vowel classification we performed repeated-measures ANOVAs on the ranked single-subject accuracies and assessed interaction effects between task and speaker/vowel classification accuracy.
Mapping of informative regions.
Discriminative maps of locations that contributed most to the classification of the speakers/vowels were determined within the STC ROI. For each binary comparison, weights were linearized by ranking the absolute values. In a next step, we averaged the maps of binary comparisons to create a rank map for the multiclass classification. Single-subject maps were created by averaging the maps across cross-validations. These maps were projected onto the cortical surfaces of the individual subjects and subsequently projected on the group-averaged and cortex-based aligned cortex mesh. Interindividual consistency maps were created by indicating for each vertex the number of subjects for which this vertex was within the fourth quartile of the SVM ranking (i.e., among the highest ranked 25%).
Self-organizing maps.
For visualization of informative activation patterns, we used self-organizing maps (SOMs; Kohonen, 2001; Formisano et al., 2008). For the speaker and vowel task, we selected the 15 most informative voxels for single trial classification of speakers and vowels, respectively. We concatenated the normalized vectors for all subjects and trained a rectangular SOM with 4 × 5 units with hexagonal connections using the MATLAB-based SOM toolbox (http://www.cis.hut.fi/somtoolbox/). We visualized the SOMs by showing the first two principal components of the high-dimensional model of SOM units. For both the speaker and the vowel task, the SOMs were trained using the average response patterns of the nine stimulus conditions (a-sp1, i-sp1, …, u-sp3). After training, the “best-matching units” (BMUs) for single trials were computed using Euclidean distance and then we labeled each SOM unit with the stimulus condition label for which this unit was most often the best matching one. The selectivity for each unit was determined by dividing the number of trials of the winning class by the total number of trials for which this unit was the BMU.
Regression analysis.
We used a GLM with a logit link function (McCulloch and Searle, 2001) to test whether behavioral accuracy of speaker/vowel identification could be predicted from speaker/vowel classification accuracy within the STC and Voice ROIs. In this regression analysis, the log-odds ratio of the behavioral performances (modeled with a binomial distribution) was fitted using a design matrix consisting of a constant (intercept) and a predictor based on the fMRI classification accuracy. To assess whether a predictor (β coefficient) was significantly different from 0, z-scores were computed for each predictor by dividing the corresponding β coefficient by its SE. The overall fit of the regression model was assessed using a χ2 test of residual deviances (with low χ2 and pfit > 0.05 indicating a good model fit).
Results
Behavioral results
All participants correctly identified each of the three speakers and vowels during a practice session outside of the scanner. During the fMRI experiment, all participants performed well above chance level (50%) during the delayed match-to-sample speaker and vowel identity tasks, although they had more difficulty identifying the children compared with the adult speaker. That is, during the speaker task, the percentage correct answers was, as mean (SD): boy 88.8 (7.6)%, girl 83.3 (9.3)%, and man 98.3 (3.0)%. These differences led to a significant main effect of speaker (F(2,18) = 13.0; p = 0.000) and pairwise differences between identification accuracies for the boy and the man (t(9) = 3.9; p = 0.004), the girl and the man (t(9) = 4.4; p = 0.002), but not for the boy and the girl (t(9)= −1.8, n.s.). During the vowel task, percentage correct answers corresponded to: vowel /a/ 99.8 (0.8)%, vowel /i/ 99.8 (0.8)%, and vowel /u/ 98.8 (2.0)%, without significant differences between vowels.
Univariate responses during the speaker and vowel task
During both the speaker and the vowel task, sounds evoked significant blood-oxygen-level-dependent (BOLD) responses in a wide expanse of the superior temporal cortex, including early auditory areas (HG/HS), the planum temporale, and extending along the STG, STS, and middle temporal gyrus (MTG; Fig. 3). Outside of the temporal lobe, the medial prefrontal cortex was activated during both tasks, whereas the bilateral posterior STS/MTG and the right superior frontal gyrus were significantly activated only during the vowel task. Because the GLM focused on modeling of sound-evoked BOLD responses before both the presentation of the decision picture and the subsequent motor response, our maps did not show significant activation in visual or motor areas.
Figure 3.

Speech sound processing during the Speaker and Vowel tasks. Functional contrast maps (t-statistics) illustrating the overall pattern of sound-evoked cortical responses during performance of the speaker task (speaker task > baseline) and vowel task (vowel task > baseline). Maps are visualized on inflated representations of the left (LH) and right (RH) hemispheres (light gray: gyri and dark gray: sulci), resulting from the realignment of the cortices of the 10 subjects. The maps are corrected for multiple comparisons by applying a cluster-size correction at p < 0.01.
Results further suggested task-specific activations for the speaker (Fig. 4, blue, Table 1) and the vowel (Fig. 4, red, Table 1) task. Although most of these activations was symmetrical across hemispheres, only two right hemispheric clusters survived cluster-size multiple comparisons correction. A cluster in the right middle STG/STS showed enhanced activity during the speaker compared with the vowel task, whereas a cluster in the right posterior STS/MTG was more active during the vowel compared with the speaker task (Fig. 4, highlighted clusters and BOLD time courses). Exclusion of the fMRI responses to sounds that were followed (after 3–5 TR) by an incorrect response did not change these task effects.
Figure 4.

Univariate Speaker and Vowel task effects. Functional contrast maps (t-statistics) illustrating task modulations of the sound-evoked cortical responses for the speaker (blue colors) and vowel (red colors) tasks. Maps are visualized on inflated and aligned group-averaged representations of the left (LH) and right (RH) hemispheres. The maps show uncorrected activation clusters (>9mm2). Two right hemispheric clusters survived multiple comparisons correction (cluster-size threshold at p < 0.05): a mid STG/STS cluster that showed larger activity during the speaker task and a posterior STS/MTG cluster that showed larger activity during the vowel task. The time course of task-related activity in both clusters is illustrated by plotting BOLD percentage signal change with respect to volume acquisitions (TR resolution). The markers indicate the onset of the speech sound and of the response pictures, with examples from the vowel (left) and speaker (right) tasks. Note that the baseline and response periods in these event-related average plots are chosen for illustrative purposes only; fMRI activity was modeled using a GLM predictor at speech sound onset (convolved with a double gamma hemodynamic response function).
Table 1.
Brain regions showing univariate task effects (random effects GLM)
| Task modulation | Brain region | Side | Talairach (center of gravity) |
Normalized area (mm2) | ||
|---|---|---|---|---|---|---|
| x | y | z | ||||
| Vowel > speaker | Posterior STS/MTG | Left | −40 | −59 | 21 | 64 |
| Posterior STS/MTG | Right | 40 | −58 | 24 | 276* | |
| Anterior MTG | Right | 50 | −16 | −14 | 77 | |
| Superior frontal gyrus | Right | 20 | 25 | 49 | 63 | |
| Speaker > vowel | Posterior STG | Left | −59 | −28 | 8 | 88 |
| Middle STG/STS | Right | 47 | −22 | 1 | 261* | |
| Lateral HS/STG | Left | −51 | −15 | 6 | 50 | |
| Lateral HS/STG | Right | 54 | −16 | 9 | 55 | |
| Anterior STG | Right | 57 | −4 | 0 | 70 | |
| Anterior PP | Left | −39 | −4 | −10 | 79 | |
Each region is presented along with its Talairach coordinates and normalized (Talairach) area size. Only regions with a minimal area of 50 mm2 are shown. Two regions (*) survived cluster-size multiple comparisons correction (p < 0.05). PP, Planum polare.
Analysis of stimulus effects did not show systematic univariate stimulus differences. Speaker and vowel stimuli did not show any significant activation differences along the task-relevant dimension (boy, girl, or man during the speaker task; /a/, /i/, or /u/ during the vowel task). Along the task-irrelevant dimension, two stimulus contrasts did reach significance. During the speaker task, the vowel /u/ elicited significantly stronger activity compared with both other vowels in a region on the left middle to anterior STG. During the vowel task, the adult voice elicited significantly stronger activity compared with both children's voices in bilateral clusters on the temporal plane. No significant stimulus effects were found for the other two speakers or vowels.
Task-dependent decoding of speaker and vowel identity
Beyond regional differences in overall activation levels, we investigated the task-dependent representations of individual speaker and vowel stimuli with a machine learning classification algorithm (SVM). In a first analysis, classification was performed within individually determined regions of auditory-responsive superior temporal cortex (STC ROI; Fig. 2A). The algorithm's success in speaker/vowel discrimination was modulated by task demands. That is, in the STC region (Fig. 5A, middle), speaker stimuli were successfully discriminated based on fMRI responses obtained during the speaker but not during the vowel task, whereas vowel stimuli were successfully discriminated based on fMRI responses obtained during the vowel but not during the speaker task. This task-dependent decoding success was confirmed by a significant stimulus-by-task interaction for ranked single-subject accuracies (F(1,9) = 5.67; p = 0.041).
Figure 5.

Task-dependent classification of Speakers and Vowels. A, Group averaged (Mean (SE)) classification accuracies for speakers and vowels in the superior temporal cortex (STC ROI), during the speaker and vowel task. LH= left hemisphere, RH= right hemisphere. Statistical significance was determined with respect to empirical (permutation-based) chance level (dotted lines, range: 0.331–0.336, mean: 0.333, i.e., corresponding to theoretical chance level). B, Discriminative maps are illustrated for speaker classification during the speaker task and for vowel classification during the vowel task. These binary maps show for how many subjects a voxel was among the 25% most discriminative voxels and are visualized on inflated and aligned group-averaged representations of the temporal cortex. C, Self-organizing map (SOM) displays illustrating brain-based representation of speakers during the speaker task and of vowels during the vowel task. The maps are based on the 15 most discriminative speaker/vowel STC voxels across the 10 participants. The colors (speakers) and symbols (vowels) show which stimulus condition was assigned to a unit. The size of the unit indicates how often the stimulus condition was assigned to that unit (unit selectivity, see Materials and Methods).
To assess the spatial layout and consistency across subjects of discriminative voxels underlying this task-dependent speaker and vowel classification, we constructed binary discriminative maps (Fig. 5B). These maps illustrate for how many subjects a voxel was among the 25% most discriminative voxels. Speaker-discriminative voxels (blue colors) clustered on the temporal plane, along HG/HS, and especially in the right hemisphere, along the middle to anterior STG/STS. Vowel-discriminative voxels (red colors) were distributed more bilaterally than those of speakers and were clustered on the temporal plane, along HG/HS, and on the middle to posterior STG/STS.
We visualized the spatial proximity and grouping of discriminative voxels contributing most to speaker and vowel classification using SOMs (Fig. 5C). As expected from the significant classification accuracies in these conditions, the SOM-based 2D displays showed vowel-invariant speaker grouping during the speaker task and speaker-invariant vowel grouping during the vowel task. Visual inspection of the spatial proximity of the individual speakers and vowels further indicates that speaker representations are ordered according to the average F0 of the speaker's voices [i.e., from left to right: male (135 Hz), girl (277 Hz), and boy (299 Hz)], whereas vowels are ordered according to their combined F1 and F2 values (i.e., from left to right: /u/, /i/, and /a/, following the diagonal of their representation in F1/F2 space; Fig. 1B).
Hemispheric lateralization
Possible differences in lateralization were assessed by inspecting classification accuracies separately for the left and right STC (Fig. 5A, left and right, respectively). Results showed accurate speaker discrimination during the speaker task in both the left and right STC and also during the vowel task in the right STC. Instead, accurate vowel discrimination only occurred during the vowel task and only in the left STC. The decoding accuracies in the separate left and right hemisphere STC ROIs did not show significant interaction effects.
Contribution of voice-selective regions
In a further analysis, classification was performed within individually determined regions of voice selectivity (Voice ROI; Fig. 2B) and within the STC ROI after subtracting the Voice ROI (Fig. 2C). When restricting speaker/vowel classification to voxels in the bilateral Voice ROI (Fig. 6A), speakers could be discriminated above chance during the speaker task and vowels could be discriminated above chance during the vowel task, but there was no significant stimulus-by-task interaction (F(1,9) = 1.5, n.s.). The same pattern of results was obtained when classifying speakers/vowels within the larger STC ROI after subtracting the Voice ROI (Fig. 6B), this time accompanied by a significant stimulus-by-task interaction (F(1,9) = 13.0; p = 0.006). Possible differences in lateralization were assessed by inspecting classification accuracies separately for the left and right hemisphere Voice and STC Voice ROIs (Fig. 6, left and right, respectively). Within each of the four hemisphere-specific ROIs, classification accuracies showed above chance classification of speakers during the speaker task. Only voxels in the left STC-Voice ROI also discriminated vowels during the vowel task, leading to a significant stimulus-by-task interaction (F(1,9) = 4.9; p = 0.054). Together, these results confirm an important role of the temporal voice areas (Belin et al., 2000) in the neural representation of speaker identity. However, they also show that parts of the STC that do not belong to these category-selective regions are informative of speaker (and vowel) identity.
Figure 6.

Contribution of Voice selective regions. A, Group averaged (Mean (SE)) classification accuracies for speakers and vowels during the speaker and vowel task in the individually determined Voice selective regions. Statistical significance was determined with respect to empirical (permutation-based) chance level (dotted lines, range: 0.330–0.334, mean = 0.333). B, Classification accuracies within the superior temporal cortex (STC ROI) after subtracting the Voice selective regions (Voice ROI).
Relation with behavioral performance
We used regression analysis to investigate whether individual differences in the accuracy of speaker classification predicts individual differences in behavior (accuracy of speaker identification). We concentrated on the speaker task because behavioral performance was close-to-ceiling on the vowel task. Regression analysis showed that classification performance in the left STC could significantly predict participants' behavioral accuracy (model fit: χ2(8) = 14.80, pfit = 0.063; predictor: z = 3.71, p = 0.0002; Fig. 7). In none of the other ROIs did the relation between classification and behavioral accuracy reach significance.
Figure 7.

Relation between Behavioral and Classification accuracy. Regression plot illustrating the relation between participant's behavioral accuracy of speaker identification and corresponding speaker classification accuracy in the left superior temporal cortex (left STC ROI). The vertical dotted line reflects the group averaged empirical chance level for classification accuracy.
Pairwise classification of speakers/vowels
To assess the contribution of individual speaker/vowel pairs, we additionally performed binary speaker/vowel classifications in those ROIs showing significant three-way classification. Binary speaker classifications during the speaker task demonstrated a clear distinction between the children's versus adult voices, with significant classifications in each of the nine ROIs (Table 2). Classification of the two children's voices only reached significance (p < 0.05) in the left STC Voice ROI, with a similar trend in the left STC ROI (p = 0.07). Only in the right STC did three-way speaker classification also reach significance during the vowel task (Fig. 5A). Binary speaker classifications in this case showed a significant distinction of the boy–girl [accuracy = 0.57 (0.03), p = 0.03] and the boy–man [accuracy = 0.57 (0.03), p = 0.02] voices, but not of the girl–man [accuracy = 0.50 (0.02), n.s.] voices. Finally, following their distance in the SOM display (Fig. 5C), vowels /a/ and /u/ were well discriminated during the vowel task, with significantly above chance classification in four of five ROIs (Table 2). The other two vowel pairs showed lower and comparable classification accuracies that only reached significance for the /i/–/u/ pair in the left STC and left STC Voice ROIs.
Table 2.
Group averaged binary classification accuracy along the task-relevant dimension
| Left hemisphere |
Bilateral |
Right hemisphere |
|||||||
|---|---|---|---|---|---|---|---|---|---|
| STC | Voice | STC − Voice | STC | Voice | STC − Voice | STC | Voice | STC − Voice | |
| Speaker task | |||||||||
| Boy–girl | 0.53 (0.02) | 0.51 (0.01) | 0.54* (0.02) | 0.52 (0.01) | 0.50 (0.02) | 0.51 (0.01) | 0.50 (0.02) | 0.48 (0.01) | 0.49 (0.02) |
| Boy–male | 0.58*** (0.03) | 0.56* (0.03) | 0.55 (0.03) | 0.61*** (0.02) | 0.57* (0.03) | 0.57* (0.03) | 0.60** (0.03) | 0.59*** (0.02) | 0.58*** (0.02) |
| Girl–male | 0.62*** (0.02) | 0.58*** (0.02) | 0.59** (0.03) | 0.64*** (0.04) | 0.63*** (0.03) | 0.59* (0.03) | 0.62** (0.04) | 0.61*** (0.03) | 0.57* (0.03) |
| Vowel task | |||||||||
| /a/–/i/ | 0.52 (0.02) | 0.50 (0.02) | 0.53 (0.03) | 0.53 (0.02) | 0.50 (0.02) | ||||
| /a/–/u/ | 0.56* (0.03) | 0.52 (0.03) | 0.59*** (0.02) | 0.57* (0.03) | 0.57* (0.02) | ||||
| /i/–/u/ | 0.56** (0.02) | 0.54** (0.01) | 0.52 (0.02) | 0.50 (0.02) | 0.53 (0.02) | ||||
Mean (SE) classification accuracy for binary speaker/vowel comparisons in the speaker/vowel task. Accuracy is shown for each of the ROIs showing significant three-way classification (Figs. 5A, 6). STC: sound responsive superior temporal cortex, Voice: voice localizer.
*p < 0.05,
**p < 0.01,
***p < 0.005.
Discussion
We investigated single-trial fMRI responses measured while participants categorized the same natural speech sounds according to speaker or vowel identity. The task dependency of the speaker and vowel decoding accuracy demonstrates that the fMRI response patterns in auditory cortex (and, possibly, the underlying neural representations) reflect the top-down enhancement of behaviorally relevant sound representations. Furthermore, our findings highlight the role of early, together with higher-order, auditory regions in the formation and maintenance of these representations.
To investigate the task-dependent categorization of sounds, we used delayed match-to-sample tasks that require the active extraction and maintenance of either speaker or vowel information—and suppression of the task-irrelevant dimension—for several seconds until the presentation of a decision picture. Univariate analysis of sound-evoked responses showed extensive and largely overlapping activation bilaterally in superior temporal cortex in both task contexts, reflecting sensory/perceptual analysis (Belin et al., 2000; Binder et al., 2000; Scott et al., 2000) and/or short-term retention (Linke et al., 2011) of the speech sounds. Both tasks also activated medial prefrontal regions, probably reflecting cognitive aspects of the tasks related to maintenance of speaker/vowel identity in short-term memory and/or activation of task-relevant stimulus-response mappings (Duncan and Owen, 2000; Euston et al., 2012). Our analysis did not show other regions often implicated in speech perception, such as the left inferior frontal cortex (Hickok and Poeppel, 2007; Rauschecker and Scott, 2009). This may relate to specific stimulus and/or task demands. In particular, left inferior frontal activity is often observed during effortful lexical-semantic analysis of, for example, vocoded or spectrally rotated speech (Davis and Johnsrude, 2003; Eisner et al., 2010; Obleser and Kotz, 2010) and may contribute to decoding of ambiguous consonant-vowel stimuli (Lee et al., 2012).
In addition to this network of largely overlapping brain activations, task-specific effects were observed in two regions. First, the right middle STG/STS, as well as smaller subthreshold bilateral STG/STS and temporal plane clusters, showed stronger activation during the speaker task. This speaker task modulation confirms and extends previous reports of the involvement of these superior temporal regions in the passive and/or active processing of human voices (Belin et al., 2000; von Kriegstein et al., 2003; Andics et al., 2010; Moerel et al., 2012; Bonte et al., 2013; Latinus et al., 2013). Second, the right posterior STS/MTG showed stronger activation during the vowel task. Although this region is not typically involved in speech sound processing, it overlaps with an extended region in the inferior parietal lobe that has been related to the processing of learned audio-visual relations (Naumer et al., 2009; Kilian-Hütten et al., 2011b). It can be speculated that the observed activation of the posterior STS/MTG during the vowel task relates to the nature of our delayed match-to-sample task, which required matching of vowel sounds to their well known visual counterparts (letters).
Beyond regional differences in task-specific activation levels, our multivariate decoding results demonstrate that distinct but overlapping response patterns across early and higher-order auditory cortex entail abstract, goal-dependent representations of individual speech stimuli; that is, the task dependency of speaker/vowel decoding accuracies shows enhanced distinction of response patterns for individual speakers/vowels along the task-relevant dimension. Speaker discrimination most consistently relied on voxels clustering in early auditory regions (HG/HS) and the temporal plane, as well as in regions along the middle to anterior (right) STG/STS, that overlap with the superior temporal voice areas (Belin et al., 2000; Moerel et al., 2012; Bonte et al., 2013; Latinus et al., 2013; Fig. 2B) and with right STG/STS regions recruited during voice recognition tasks (von Kriegstein et al., 2003; Lattner et al., 2005; Andics et al., 2010). Vowels could be significantly decoded from voxels clustering in early auditory regions (HG/HS), the temporal plane, and in bilateral regions along the middle to posterior STG/STS that have been related to the processing of isolated phonemes (Jäncke et al., 2002; van Atteveldt et al., 2004; Obleser and Eisner, 2009; Kilian-Hütten et al., 2011a) and to the processing of speech spoken by different speakers (von Kriegstein et al., 2010; Mesgarani and Chang, 2012).
Not only did the speaker/vowel classifications show a strong task dependency, speaker decoding accuracy in the left STC also significantly predicted participant's identification accuracy, emphasizing the behavioral relevance of the observed auditory cortical response patterns. In a previous study (Andics et al., 2010), voice identification performances correlated significantly with activation changes in clusters of the left and right STG/STS. The left focus in the present study may be due to two factors. First, our multivariate analysis allowed relating behavioral performances to direct measures of identity information in fMRI response patterns. This may reflect more closely the neural encoding of speaker identity compared with activation level differences. Second, the behavioral variability in our study was mainly driven by the children's voices, which, unlike adult voices, are not readily distinguished based on F0 (Murry and Singh, 1980; Baumann and Belin, 2010). Their identification may require the use of more subtle differences in, for example, formant frequencies (Bennett and Weinberg, 1979; Perry et al., 2001), that may be processed in the left STC. Consistent with this suggestion, the left STC was the only region to show significantly above chance distinction of the two children's voices during the speaker task, although they were also distinguished in the right STC during the vowel task. Instead, the (F0-based) classification of the children versus adult voices was possible across all ROIs. Whether the extraction of formant frequencies indeed contributes to the distinction of children's voices in the left (and/or right) STC would need to be confirmed in further studies using, for example, multiple exemplars of children voices.
Although our findings confirm the involvement of voice/speech-selective superior temporal regions, they show that auditory cortical maps of speaker and vowel identity are not limited to these higher-order regions. Instead, these categorical speech maps extend “backwards” to regions that are assumed to restrict themselves to sensory processing of individual acoustic-phonetic speech features (Hickok and Poeppel, 2007; Rauschecker and Scott, 2009). The role of early, in addition to higher-order, auditory cortex in the task-dependent encoding of sound is consistent with evidence from animal electrophysiology (Fritz et al., 2003; Atiani et al., 2009). Furthermore, recent human fMRI-decoding studies suggest that similarly distributed superior temporal cortical patterns encode the abstract categorical representation of natural sounds (Formisano et al., 2008; Staeren et al., 2009), the subjective perceptual interpretation of ambiguous speech syllables (Kilian-Hütten et al., 2011a), and sound category learning (Ley et al., 2012). Within such a distributed system, task-dependent grouping of relevant speech features may emerge via a transient phase alignment of neuronal responses in multiple, nonadjacent cortical patches, each encoding for one or more of these speech features. Indeed, using EEG, we previously observed a task-dependent temporal alignment of oscillatory responses to individual speakers/vowels starting ∼200 ms after stimulus onset and following an initial analysis of acoustic-phonetic stimulus differences (Bonte et al., 2009). Furthermore, single-trial decoding of the same EEG data demonstrated task-independent classification of both speaker and vowel identity in early time windows, followed by sustained and task-dependent classification of speakers during the speaker task and of vowels during the vowel task (Hausfeld et al., 2012). Similarly, during the present speaker/vowel tasks, initial auditory cortical responses most likely encoded sensory representations of the speech stimuli. Because the BOLD signal integrates neural processing over longer time scales, these short-lived and earlier stimulus-driven representations are more difficult to detect than the stronger and longer-lasting task-dependent modulations. In fact, although the fMRI-decoding accuracies mainly reached significance along the task-relevant dimension, those along the task-irrelevant dimension did show above-chance (nonsignificant) trends. It is likely that with a higher spatial resolution (Formisano et al., 2008) and/or functional contrast to noise ratio (e.g., using higher magnetic fields), these weaker signals along the task-irrelevant dimension may also become significantly decodable. Furthermore, in our multivariate analysis, we chose to employ an ROI-based approach for feature reduction because we aimed at investigating the contribution of auditory cortical regions in general and voice selective regions in particular to the task-dependent representation of vowels/speakers. It is important to note, however, that the choice of feature reduction method (e.g., ROI-based, recursive feature elimination, searchlight) can influence the type of conclusions one can draw. Therefore, a thorough methodological comparison of these methods with both simulated and real data would benefit our interpretation of results from the distinct multivariate analysis schemes used in the literature.
The present study measured top-down modulation of fMRI responses in healthy adults to three vowels and three speakers that were presented in isolation to obtain distinct neural activation patterns. Extension of these results to attention-dependent processing of words or concatenation of words in streams of longer speech segments and in varying acoustic conditions (e.g., noisy environments) provides a compelling challenge and will contribute to a general brain-based decoder of sounds in the context of real-life situations. Furthermore, extension to different age groups and subject populations may reveal relevant aspects of learning and plasticity in auditory cortical representations during normal and anomalous development.
Footnotes
This work was supported by the Netherlands Organization for Scientific Research (VENI-Grant 451-07-002 to M.B. and VICI-Grant 453-12-002 to E.F.). We thank Annemarie Graus for assistance in data acquisition.
References
- Andics A, McQueen JM, Petersson KM, Gál V, Rudas G, Vidnyánszky Z. Neural mechanisms for voice recognition. Neuroimage. 2010;52:1528–1540. doi: 10.1016/j.neuroimage.2010.05.048. [DOI] [PubMed] [Google Scholar]
- Annett M. Family handedness in three generations predicted by the right shift theory. Ann Hum Genet. 1979;42:479–491. doi: 10.1111/j.1469-1809.1979.tb00681.x. [DOI] [PubMed] [Google Scholar]
- Atiani S, Elhilali M, David SV, Fritz JB, Shamma SA. Task difficulty and performance induce diverse adaptive patterns in gain and shape of primary auditory cortical receptive fields. Neuron. 2009;61:467–480. doi: 10.1016/j.neuron.2008.12.027. [DOI] [PMC free article] [PubMed] [Google Scholar]
- Baumann O, Belin P. Perceptual scaling of voice identity: common dimensions for different vowels and speakers. Psychol Res. 2010;74:110–120. doi: 10.1007/s00426-008-0185-z. [DOI] [PubMed] [Google Scholar]
- Belin P, Zatorre RJ. Adaptation to speaker's voice in right anterior temporal lobe. Neuroreport. 2003;14:2105–2109. doi: 10.1097/00001756-200311140-00019. [DOI] [PubMed] [Google Scholar]
- Belin P, Zatorre RJ, Lafaille P, Ahad P, Pike B. Voice-selective areas in human auditory cortex. Nature. 2000;403:309–312. doi: 10.1038/35002078. [DOI] [PubMed] [Google Scholar]
- Bennett S, Weinberg B. Acoustic correlates of perceived sexual identity in preadolescent children's voices. J Acoust Soc Am. 1979;66:989–1000. doi: 10.1121/1.383376. [DOI] [PubMed] [Google Scholar]
- Binder JR, Frost JA, Hammeke TA, Bellgowan PS, Springer JA, Kaufman JN, Possing ET. Human temporal lobe activation by speech and nonspeech sounds. Cereb Cortex. 2000;10:512–528. doi: 10.1093/cercor/10.5.512. [DOI] [PubMed] [Google Scholar]
- Boersma P, Weenink D. Praat 4.0: a system for doing phonetics with the computer [Computer software] Amsterdam: Universiteit van Amsterdam; 2002. [Google Scholar]
- Bonte M, Valente G, Formisano E. Dynamic and task-dependent encoding of speech and voice by phase reorganization of cortical oscillations. J Neurosci. 2009;29:1699–1706. doi: 10.1523/JNEUROSCI.3694-08.2009. [DOI] [PMC free article] [PubMed] [Google Scholar]
- Bonte M, Frost MA, Rutten S, Ley A, Formisano E, Goebel R. Development from childhood to adulthood increases morphological and functional inter-individual variability in the right superior temporal cortex. Neuroimage. 2013;83:739–750. doi: 10.1016/j.neuroimage.2013.07.017. [DOI] [PubMed] [Google Scholar]
- Brechmann A, Scheich H. Hemispheric shifts of sound representation in auditory cortex with conceptual listening. Cereb Cortex. 2005;15:578–587. doi: 10.1093/cercor/bhh159. [DOI] [PubMed] [Google Scholar]
- Davis MH, Johnsrude IS. Hierarchical processing in spoken language comprehension. J Neurosci. 2003;23:3423–3431. doi: 10.1523/JNEUROSCI.23-08-03423.2003. [DOI] [PMC free article] [PubMed] [Google Scholar]
- Duncan J, Owen AM. Common regions of the human frontal lobe recruited by diverse cognitive demands. Trends Neurosci. 2000;23:475–483. doi: 10.1016/S0166-2236(00)01633-7. [DOI] [PubMed] [Google Scholar]
- Eisner F, McGettigan C, Faulkner A, Rosen S, Scott SK. Inferior frontal gyrus activation predicts individual differences in perceptual learning of cochlear-implant simulations. J Neurosci. 2010;30:7179–7186. doi: 10.1523/JNEUROSCI.4040-09.2010. [DOI] [PMC free article] [PubMed] [Google Scholar]
- Euston DR, Gruber AJ, McNaughton BL. The role of medial prefrontal cortex in memory and decision making. Neuron. 2012;76:1057–1070. doi: 10.1016/j.neuron.2012.12.002. [DOI] [PMC free article] [PubMed] [Google Scholar]
- Forman SD, Cohen JD, Fitzgerald M, Eddy WF, Mintun MA, Noll DC. Improved assessment of significant activation in functional magnetic resonance imaging (fMRI): use of a cluster-size threshold. Magn Reson Med. 1995;33:636–647. doi: 10.1002/mrm.1910330508. [DOI] [PubMed] [Google Scholar]
- Formisano E, De Martino F, Bonte M, Goebel R. “Who” is saying “what”? Brain-based decoding of human voice and speech. Science. 2008;322:970–973. doi: 10.1126/science.1164318. [DOI] [PubMed] [Google Scholar]
- Fritz J, Shamma S, Elhilali M, Klein D. Rapid task-related plasticity of spectrotemporal receptive fields in primary auditory cortex. Nat Neurosci. 2003;6:1216–1223. doi: 10.1038/nn1141. [DOI] [PubMed] [Google Scholar]
- Frost MA, Goebel R. Measuring structural-functional correspondence: spatial variability of specialised brain regions after macro-anatomical alignment. Neuroimage. 2012;59:1369–1381. doi: 10.1016/j.neuroimage.2011.08.035. [DOI] [PubMed] [Google Scholar]
- Goebel R, Esposito F, Formisano E. Analysis of functional image analysis contest (FIAC) data with brainvoyager QX: From single-subject to cortically aligned group general linear model analysis and self-organizing group independent component analysis. Hum Brain Mapp. 2006;27:392–401. doi: 10.1002/hbm.20249. [DOI] [PMC free article] [PubMed] [Google Scholar]
- Good P. Permutation tests: a practical guide to resampling methods for testing hypotheses. New York: Springer; 2000. [Google Scholar]
- Hausfeld L, De Martino F, Bonte M, Formisano E. Pattern analysis of EEG responses to speech and voice: influence of feature grouping. Neuroimage. 2012;59:3641–3651. doi: 10.1016/j.neuroimage.2011.11.056. [DOI] [PubMed] [Google Scholar]
- Hickok G, Poeppel D. The cortical organization of speech processing. Nat Rev Neurosci. 2007;8:393–402. doi: 10.1038/nrn2113. [DOI] [PubMed] [Google Scholar]
- Jäncke L, Wüstenberg T, Scheich H, Heinze HJ. Phonetic perception and the temporal cortex. Neuroimage. 2002;15:733–746. doi: 10.1006/nimg.2001.1027. [DOI] [PubMed] [Google Scholar]
- Kilian-Hütten N, Valente G, Vroomen J, Formisano E. Auditory cortex encodes the perceptual interpretation of ambiguous sound. J Neurosci. 2011a;31:1715–1720. doi: 10.1523/JNEUROSCI.4572-10.2011. [DOI] [PMC free article] [PubMed] [Google Scholar]
- Kilian-Hütten N, Vroomen J, Formisano E. Brain activation during audiovisual exposure anticipates future perception of ambiguous speech. Neuroimage. 2011b;57:1601–1607. doi: 10.1016/j.neuroimage.2011.05.043. [DOI] [PubMed] [Google Scholar]
- Kohonen T. Self-organizing maps. Berlin: Springer; 2001. [Google Scholar]
- Latinus M, McAleer P, Bestelmeyer PE, Belin P. Norm-based coding of voice identity in human auditory cortex. Curr Biol. 2013;23:1075–1080. doi: 10.1016/j.cub.2013.04.055. [DOI] [PMC free article] [PubMed] [Google Scholar]
- Lattner S, Meyer ME, Friederici AD. Voice perception: Sex, pitch, and the right hemisphere. Hum Brain Mapp. 2005;24:11–20. doi: 10.1002/hbm.20065. [DOI] [PMC free article] [PubMed] [Google Scholar]
- Lee YS, Turkeltaub P, Granger R, Raizada RD. Categorical speech processing in Broca's area: an fMRI study using multivariate pattern-based analysis. J Neurosci. 2012;32:3942–3948. doi: 10.1523/JNEUROSCI.3814-11.2012. [DOI] [PMC free article] [PubMed] [Google Scholar]
- Ley A, Vroomen J, Hausfeld L, Valente G, De Weerd P, Formisano E. Learning of new sound categories shapes neural response patterns in human auditory cortex. J Neurosci. 2012;32:13273–13280. doi: 10.1523/JNEUROSCI.0584-12.2012. [DOI] [PMC free article] [PubMed] [Google Scholar]
- Linke AC, Vicente-Grabovetsky A, Cusack R. Stimulus-specific suppression preserves information in auditory short-term memory. Proc Natl Acad Sci U S A. 2011;108:12961–12966. doi: 10.1073/pnas.1102118108. [DOI] [PMC free article] [PubMed] [Google Scholar]
- McCulloch CE, Searle SR. Generalized, linear, and mixed models. New York: Wiley; 2001. [Google Scholar]
- Mesgarani N, Chang EF. Selective cortical representation of attended speaker in multi-talker speech perception. Nature. 2012;485:233–236. doi: 10.1038/nature11020. [DOI] [PMC free article] [PubMed] [Google Scholar]
- Moerel M, De Martino F, Formisano E. Processing of natural sounds in human auditory cortex: tonotopy, spectral tuning, and relation to voice sensitivity. J Neurosci. 2012;32:14205–14216. doi: 10.1523/JNEUROSCI.1388-12.2012. [DOI] [PMC free article] [PubMed] [Google Scholar]
- Murry T, Singh S. Multidimensional analysis of male and female voices. J Acoust Soc Am. 1980;68:1294–1300. doi: 10.1121/1.385122. [DOI] [PubMed] [Google Scholar]
- Naumer MJ, Doehrmann O, Müller NG, Muckli L, Kaiser J, Hein G. Cortical plasticity of audio-visual object representations. Cereb Cortex. 2009;19:1641–1653. doi: 10.1093/cercor/bhn200. [DOI] [PMC free article] [PubMed] [Google Scholar]
- Obleser J, Eisner F. Pre-lexical abstraction of speech in the auditory cortex. Trends Cogn Sci. 2009;13:14–19. doi: 10.1016/j.tics.2008.09.005. [DOI] [PubMed] [Google Scholar]
- Obleser J, Kotz SA. Expectancy constraints in degraded speech modulate the language comprehension network. Cereb Cortex. 2010;20:633–640. doi: 10.1093/cercor/bhp128. [DOI] [PubMed] [Google Scholar]
- Perry TL, Ohde RN, Ashmead DH. The acoustic bases for gender identification from children's voices. J Acoust Soc Am. 2001;109:2988–2998. doi: 10.1121/1.1370525. [DOI] [PubMed] [Google Scholar]
- Rauschecker JP, Scott SK. Maps and streams in the auditory cortex: nonhuman primates illuminate human speech processing. Nat Neurosci. 2009;12:718–724. doi: 10.1038/nn.2331. [DOI] [PMC free article] [PubMed] [Google Scholar]
- Scott SK, Blank CC, Rosen S, Wise RJ. Identification of a pathway for intelligible speech in the left temporal lobe. Brain. 2000;123:2400–2406. doi: 10.1093/brain/123.12.2400. [DOI] [PMC free article] [PubMed] [Google Scholar]
- Staeren N, Renvall H, De Martino F, Goebel R, Formisano E. Sound categories are represented as distributed patterns in the human auditory cortex. Curr Biol. 2009;19:498–502. doi: 10.1016/j.cub.2009.01.066. [DOI] [PubMed] [Google Scholar]
- van Atteveldt N, Formisano E, Goebel R, Blomert L. Integration of letters and speech sounds in the human brain. Neuron. 2004;43:271–282. doi: 10.1016/j.neuron.2004.06.025. [DOI] [PubMed] [Google Scholar]
- Vapnik VN. The nature of statistical learning theory. New York: Springer; 1995. [Google Scholar]
- von Kriegstein K, Eger E, Kleinschmidt A, Giraud AL. Modulation of neural responses to speech by directing attention to voices or verbal content. Brain Res Cogn Brain Res. 2003;17:48–55. doi: 10.1016/S0926-6410(03)00079-X. [DOI] [PubMed] [Google Scholar]
- von Kriegstein K, Smith DR, Patterson RD, Kiebel SJ, Griffiths TD. How the human brain recognizes speech in the context of changing speakers. J Neurosci. 2010;30:629–638. doi: 10.1523/JNEUROSCI.2742-09.2010. [DOI] [PMC free article] [PubMed] [Google Scholar]