

Abstract
It is widely accepted that action and perception in humans functionally interact on multiple levels. Moreover, areas originally suggested to be predominantly motor-related, as the cerebellum, are also involved in action observation. However, as yet, few studies provided unequivocal evidence that the cerebellum is involved in the action perception coupling (APC), specifically in the integration of motor and multisensory information for perception. We addressed this question studying patients with focal cerebellar lesions in a virtual-reality paradigm measuring the effect of action execution on action perception presenting self-generated movements as point lights. We measured the visual sensitivity to the point light stimuli based on signal detection theory. Compared with healthy controls cerebellar patients showed no beneficial influence of action execution on perception indicating deficits in APC. Applying lesion symptom mapping, we identified distinct areas in the dentate nucleus and the lateral cerebellum of both hemispheres that are causally involved in APC. Lesions of the right ventral dentate, the ipsilateral motor representations (lobules V/VI), and most interestingly the contralateral posterior cerebellum (lobule VII) impede the benefits of motor execution on perception. We conclude that the cerebellum establishes time-dependent multisensory representations on different levels, relevant for motor control as well as supporting action perception. Ipsilateral cerebellar motor representations are thought to support the somatosensory state estimate of ongoing movements, whereas the ventral dentate and the contralateral posterior cerebellum likely support sensorimotor integration in the cerebellar-parietal loops. Both the correct somatosensory as well as the multisensory state representations are vital for an intact APC.
Keywords: action perception coupling, biological motion, cerebellum, lesion symptom mapping
Introduction
As humans, we interact with our world by moving ourselves and perceiving others move. It is widely accepted that action and perception are not two isolated domains but interact on multiple levels. In consequence, it has been argued that similar mechanisms are involved in the control of our own movements and in understanding and anticipation actions of others (Gallese et al., 1996; Prinz, 1997; Wolpert et al., 2003). Behavioral studies provide evidence for a bidirectional relationship of action execution and action perception showing motor resonance effects while observing movements (Fadiga et al., 1995) and effects of perceptual resonance, the influence of motor behavior on perception, when executing actions (Casile and Giese, 2006; Schütz-Bosbach and Prinz, 2007). We recently showed that perceptual resonance depends on temporal matching: Action detection is facilitated by concurrent motor behavior of same actions if visual stimuli and executed movements are synchronous. If the visual stimulus is delayed with respect to the movement, biological motion detection is inhibited (Christensen et al., 2011).
Functional imaging studies additionally support the coupling of action and perception, showing that several cortical motor areas are also activated during action observation. The inferior frontal gyrus, premotor cortex, supplemental motor area, area PF in the supramarginal gyrus, as well as the cerebellum are considered to be part of this human action-observation network (Decety et al., 1997; Gazzola and Keysers, 2009; Kilner et al., 2009).
The cerebellum is well known to be involved in the coordination and fine-tuning of movements. As key mechanism for this purpose, internal forward models have been proposed, predicting sensory consequences of actions (Wolpert and Flanagan, 2001; Miall, 2003; Bastian, 2006; Ebner and Pasalar, 2008). Combining such predictions with current sensory information, the cerebellum is suggested to establish a state estimate, essential for the control of movements (Miall et al., 2007) and motor adaptation (Bastian, 2011; Izawa et al., 2012).
In addition to its key role in motor control, other studies have shown an involvement of the cerebellum in sensory processing (Gao et al., 1996) and perception (Händel et al., 2009; Bastian, 2011), especially in tasks requiring precise timing (Ivry and Spencer, 2004; O'Reilly et al., 2008).
First support for an involvement of the cerebellum in the integration of action and perception is given by a study reporting deficits of cerebellar patients in active force perception during self-generated movements but preserved passive proprioception (Bhanpuri et al., 2012).
These findings raise the question to which degree the cerebellum is involved in a more general integration of motor information and higher-order multimodal perception, including visual action perception.
We directly addressed both the causal role and the specific areas of the cerebellum for intact action-perception coupling. We showed a critical influence of cerebellar lesions on the perceptual resonance investigating patients with focal cerebellar lesions compared with healthy controls. This was accomplished by examining the influence of movements on visual sensitivity (i.e., noise tolerance based on d′ values/signal detection theory) in a virtual-reality paradigm, which enabled us to display biological motion stimuli synchronously or asynchronously to self-executed movements.
Materials and Methods
Participants.
Seventeen patients (mean age, 28 years 4 months; 10 female, 7 male) with chronic focal lesions of the cerebellum after benign tumor resection participated in the experiment: pilocystic astrocytoma WHO Grade I (n = 10), astrocytoma WHO Grade II (n = 1), hemangioblastoma (n = 5) or angioma (n = 1). None of the patients received adjuvant radiotherapy or chemotherapy. Patients showed mild to moderate ataxia symptoms as examined by an experienced neurologist (D.T). Severity of ataxia was rated using the International Cooperative Ataxia Rating Scale (ICARS; for an overview of individual ataxia symptoms, see Table 1) (Trouillas et al., 1997). In addition, we tested 17 control subjects, matched in age, gender, and handedness (mean age, 27 years 9 months; 10 female, 7 male; 15 right handed). All healthy participants had normal or corrected vision and no motor impairment influencing their arm movements. They were naive with regard to the purpose of the study and received payment for their participation. All patients and control subjects gave informed consent before participation. The study had been approved by the local institutional ethical review boards in Tübingen and Essen.
Table 1.
Patient informationa
| Patient no. | Age (yr) | Time (yr) since surgery | ICARS |
||||
|---|---|---|---|---|---|---|---|
| P (maximum 34) | K (maximum 52) | S (maximum 6) | O (maximum 8) | Total (maximum 100) | |||
| CP 1 | 28 | 3 | 0 | 0 | 0 | 0 | 0 |
| CP 2 | 22 | 5 | 1 | 0 | 0 | 1 | 2 |
| CP 3 | 32 | 6 | 0 | 0 | 0 | 0 | 0 |
| CP 4 | 21 | 1 | 7 | 14 | 2 | 6 | 29 |
| CP 5 | 26 | 10 | 3 | 1 | 0 | 0 | 4 |
| CP 6 | 21 | 12 | 3 | 2 | 0 | 1 | 6 |
| CP 7 | 61 | 11 | 1 | 0 | 0 | 0 | 1 |
| CP 8 | 18 | 13 | 3 | 4 | 0 | 0 | 7 |
| CP 9 | 44 | 6 | 3 | 5 | 1 | 0 | 8 |
| CP 10 | 36 | 5 | 0 | 0 | 0 | 0 | 0 |
| CP 11 | 20 | 4 | 4 | 5 | 0 | 3 | 12 |
| CP 12 | 23 | 14 | 4 | 5 | 0 | 0 | 9 |
| CP 13 | 39 | 3 | 0 | 1 | 0 | 0 | 1 |
| CP 14 | 23 | 8 | 0 | 0 | 0 | 0 | 0 |
| CP 15 | 24 | 14 | 3 | 7 | 0 | 4 | 14 |
| CP 16 | 19 | 16 | 3 | 5 | 0 | 6 | 14 |
| CP 17 | 25 | 16 | 2 | 2 | 0 | 0 | 4 |
aClinical scores were rated using the ICARS score (Trouillas et al., 1997). The table lists the total ICARS scores and the subscores for gait and posture (P), limb kinetics (K), speech (S), and oculomotor functions (O). Higher scores indicate more severe ataxia. Maximum scores are given in parentheses. Clinical ataxia symptoms, as scored by the ICARS, were not correlated with either the APCIdx or the baseline NTV. More detailed analyses of the relevant subscores of the ICARS for kinetic disturbances also revealed no significant correlation (all Kendall's tau < 0.3, all p > 0.2 for the ICARS score and subscores).
Virtual-reality setup.
We recorded observers' movements using a Vicon MX motion capture system with six cameras at a sampling frequency of 120 Hz. Six passively reflecting markers were attached to the participant's right arm and left shoulder with double-sided adhesive tape. These markers corresponded to the major joints and the centers of the adjacent limbs (upper and lower arm). Commercial software was used to reconstruct and label these markers with spatial 3D reconstruction errors <1.5 mm. We developed custom software to access the marker positions in real time and to generate the visual stimulus with a closed-loop delay of ∼32 ms (for an illustration of the setup, see Fig. 1A). Thus, the visual stimuli the participants observed were actually generated by their own arm movements.
Figure 1.

Behavioral setup and results. A, Experimental setup. The participant sat on a chair observing a point light stimulus projected on a screen 1.5 m ahead of them while waving their right arm. Arm movements were recorded using an infrared-based optical motion capture system with 6 cameras (3 are shown in the figure) for (1) online generation of the point light stimulus, (2) replay of the same arm movements in the baseline blocks, and (3) post hoc kinematic analysis. The target stimulus is highlighted for illustration in green. Trajectories are indicated as lighter green traces. Noise dots were generated using spatiotemporal scrambling and moved along arm and hand trajectories (indicated as arrows) as well. Gaze movements were recorded using a Tobii × 120 Hz eyetracker to ensure that performance deficits on the action-observation task were not the result of oculomotor deficits. B, Behavioral results of the action-perception coupling experiment. Bars represent the mean interaction indexes for healthy controls (green) and patients (yellow). Controls benefited from their self-generated movements if the visual stimulus was displayed in synchrony (∼40 ms) with their executed motion (green shaded area). Introduction of an artificial delay (∼700 ms) led to negative interaction indices, indicating an inhibitory effect of self-motion on biological motion perception (pink shaded area). The patients showed no such pattern of intact action-perception coupling. Error bars indicate SE. *p < 0.05 (pairwise differences, t test).
Visual stimuli.
We presented waving arms as point light stimuli (Johansson, 1973) consisting of five black signal dots on a gray background. These stimuli were embedded in a camouflaging noise mask. The noise dots were created by “scrambling” (Cutting et al., 1988). The trajectory of each noise dot was derived from a subset of previous waving movements, presented at a randomized average position and start phase within the movement cycle. Hence, the scrambling destroys the global structure of the point light movements but preserves average local motion energy. Two-thirds of the trials were signal trials that contained the point light arm and the noise mask; in one-third of the trials, the target signal represented the actual movement of the observer, and one-third of the trials presented a temporal modification of the movement. In the remaining trials, only the noise mask was presented, in which the number of noise dots was increased by five to match the number of dots in trials with and without a target signal.
We determined the number of noise dots and thus the difficulty level on an individual basis in a training session before the first test block started. On average, the number of dots varied between 15 and 130 in equidistant steps. The noise mask subtended 25.4 × 19.2° in visual angle. The target arm was presented at random positions within the mask with a size of 7.2 × 5.7°.
Experimental procedure.
Subjects sat in front of a projection screen that was placed 1.5 m ahead of them (Fig. 1A). Each experiment started with a short training period during which the subjects familiarized themselves with point light stimuli by watching a waving arm, which was based on recorded movements from previous trials. Further, the maximum number of noise dots for the final experiment was assessed individually for each participant using a staircase-like procedure. Subsequently, participants practiced to wave their arms with a frequency of ∼30 full waving cycles per minute using waving point light arms in the desired frequency as visual feedback. A single waving movement lasted for ∼2 s, approximately matching the presentation time of the visual stimuli. The desired pacing throughout the experiment was later confirmed by kinematic analysis.
To investigate the influence of action execution on visual-perception performance, participants were asked to perform the same biological motion detection task under two conditions: (1) without concurrent motor activity (baseline condition) and (2) with concurrent motor activity (test condition). Using real-time motion capture, we were able to replay the participants' own movements online as point light stimulus. The visual stimulus in the test condition corresponded either to the actual executed waving arm movement of the participant (synchronous) or was a temporally altered version of it (asynchronous). In the asynchronous condition, the visual stimulus was delayed by 700 ms with respect to the executed movement.
The experiment comprised a sequence of 10 alternating test and baseline blocks. Each block contained 42 stimuli and lasted for ∼7 min. In the test blocks, subjects simultaneously waved their right arm with the trained frequency while observing the visual stimuli. Each stimulus lasted for 2 s while the participants continuously moved their arms. Arm movements of the target trials were recorded for kinematic analysis and for the generation of the stimuli in the baseline blocks.
In the baseline blocks, subjects observed the same stimuli, this time without executing any concurrent motor behavior.
The instruction for the detection task was the same during all blocks. Participants had to detect any waving point light arm, regardless of whether they thought the displayed limb to be associated with their own motion or not. The participants verbally reported whether they had observed any target arm movement in the stimulus or not, and the consecutive trial started immediately after the experimenter had entered the response.
Eye movements were recorded using a Tobii × 120 Hz eyetracker to ensure that no oculomotor deficits impaired participants in the action observation.
Assessment of detection performance.
Detection performance was assessed applying signal detection theory individually for each subject, every test, and corresponding baseline conditions. Each test and baseline condition was assigned one noise tolerance value (NTV), indicating the maximum number of noise dots in the camouflaging mask that would lead to 75% of the optimal detection sensitivity. To calculate the NTV, in a first step, we analyzed the hit and false alarm rates for the seven tested noise levels individually to determine one corresponding d′ value for each noise level. For every condition (test or baseline × synchronous or asynchronous) the 7 d′ values were fitted with a logistic function f. The NTV was then defined as the number of noise dots that fulfilled the equation: f(NTV) = 0.75 * max_d_prime, with max_d_prime = 4.65 (Macmillan and Creelman, 2004).
To quantify the direction and strength of the influence of motor execution on biological motion (BM) perception, we introduced as Interaction index (IntIdx, see Table 2), the logarithm of the ratio of the NTVs for the testing and the baseline condition. This index reflects the relationship between noise tolerances in both conditions in a symmetric way. If the NTV is bigger in the test condition than in the baseline condition, the IntIdx is positive, indicating a facilitation of perception by concurrent motor behavior. The IntIdx is zero in cases where both performances are equal, and it is negative in cases of an inhibition of perception due to the motor execution. More importantly, if the NTV for the test condition is twice as big as in the baseline condition, the resulting index has the same absolute value as if the performance in the baseline condition is twice as good as in the test condition.
Table 2.
Overview of different behavioral indices used to describe perception performance and to quantify APC
| Abbreviation | Formula | Description | Properties | |
|---|---|---|---|---|
| NTV | NTV = arg(f = 0.75 * max_d_prime) | Number of noise dots in the mask with preserved biological motion detection. | Higher NTV reflects better performance. | |
| No relation between test and baseline condition (4 values per participant). | ||||
| IntIdx | Quantifies the relationship between test and baseline condition. | No influence of motor execution on perception: IntIdx = 0 | ||
| Susceptible to dual task effects (two values per participant and patient). | Facilitatory influence of motor execution on perception: IntIdx > 0 Inhibitory influence of motor execution on perception: IntIdx < 0 |
|||
| APCIdx | APCIdx = IntIdxsynchronous − IntIdxasynchronous | Unifies the IntIdx for both delay conditions resulting in one value to quantify the APC that is needed for the lesion symptom mapping. | Unaffected APC: APCIdx ≥ 0 | |
| Unaffected by dual task effects (one value per participant and patient). | Affected APC: APCIdx < 0 |
Reflecting the influence of motor execution on perception the IntIdx is susceptible to dual task effects that might play a role when investigating the behavior of cerebellar patients. However, this dual task influence would cause lower IntIdxs in both the synchronous and the asynchronous test condition.
To quantify the overall action perception coupling (APC) pattern in one single value that (1) cancels dual task effects and (2) can be used for the lesion symptom mapping, we combined the single IntIdxs for the synchronous and the asynchronous condition to one APC index (APCIdx; Table 2). The APCIdx directly reveals normal (positive) compared with disturbed (negative) APC.
Kinematic analysis.
Movement analysis was based on the trajectories of the displayed markers of the target arm. For each participant, the kinematic data of 60 randomly chosen individual trials were evaluated. We investigated movement amplitude, velocity, and jerk. The variability of each parameter was computed as SD from the mean of those 60 trials. Movement amplitude within one waving cycle was defined as the maximum traveling distance of the hand as projected on the 2D plane in the visual stimulus in degrees. Velocity was determined based on the trajectories of the hand marker and the kinematic analysis confirmed the desired pacing of the participant's hand movements (average velocity of 145.19 ± 36.93 degrees per second). The third temporal derivative of the hand-marker displacement served as a measure of jerk (Goldvasser et al., 2001).
Lesion symptom mapping.
Anatomical magnetic resonance (MR) images of all patients were acquired with a 1.5 Tesla Siemens scanner using a 12-channel head coil (Siemens). A 3D sagittal volume of the entire brain was obtained using a T1-weighted, MPRAGE sequence with a repetition time of 2400 ms, 3.63 ms echo time, 160 slices, a field of view of 256 mm, and 1.0 × 1.0 × 1.0 mm3 voxel size. All images were examined by an experienced neuroradiologist, and extracerebellar pathology was excluded. We manually traced cerebellar lesions on axial, sagittal, and coronal slices of the non-normalized 3D MRI dataset and saved them as regions of interest using the free MRIcro software (http://www.mccauslandcenter.sc.edu/mricro/). All patients had chronic surgical lesions. Surgical lesions are clearly visible as dark (i.e., intensity of CSF) areas on T1-weighted MR images. “Grayscale” default thresholds were used in MRIcro. To investigate functional differences of both cerebellar hemispheres, all regions of interest were defined as hemisphere-specific and not flipped to only one hemisphere. Images were normalized using a spatially unbiased infratentorial template of the cerebellum (SUIT; www.icn.ucl.ac.uk/motorcontrol/imaging/suit.htm (Diedrichsen (2006)) with the SUIT toolbox in SPM5 (http://www.fil.ion.ucl.ac.uk/spm/software/spm5). Manual corrections, in case parts of the occipital cortex were included in the masks resulting from the automatic segmentation, were done with the help of CARET software (http://brainvis.wustl.edu/wiki/index.php/Caret:About). We used the probabilistic atlas of the human cerebellum (http://www.icn.ucl.ac.uk/motorcontrol/imaging/propatlas.htm) (Diedrichsen et al., 2009) in MRIcron (http://www.mccauslandcenter.sc.edu/mricro/mricron/) to define the affected lobules. Nomenclature of cerebellar lobules was used, which has been introduced by Schmahmann et al. (1999) and is closely related to Larsell's nomenclature (Larsell, 1958). Affected cerebellar nuclei were defined with a newly developed probabilistic atlas of cerebellar nuclei (Diedrichsen et al., 2009, 2011). Figure 2 illustrates superposition of individual lesions for all patients.
Figure 2.
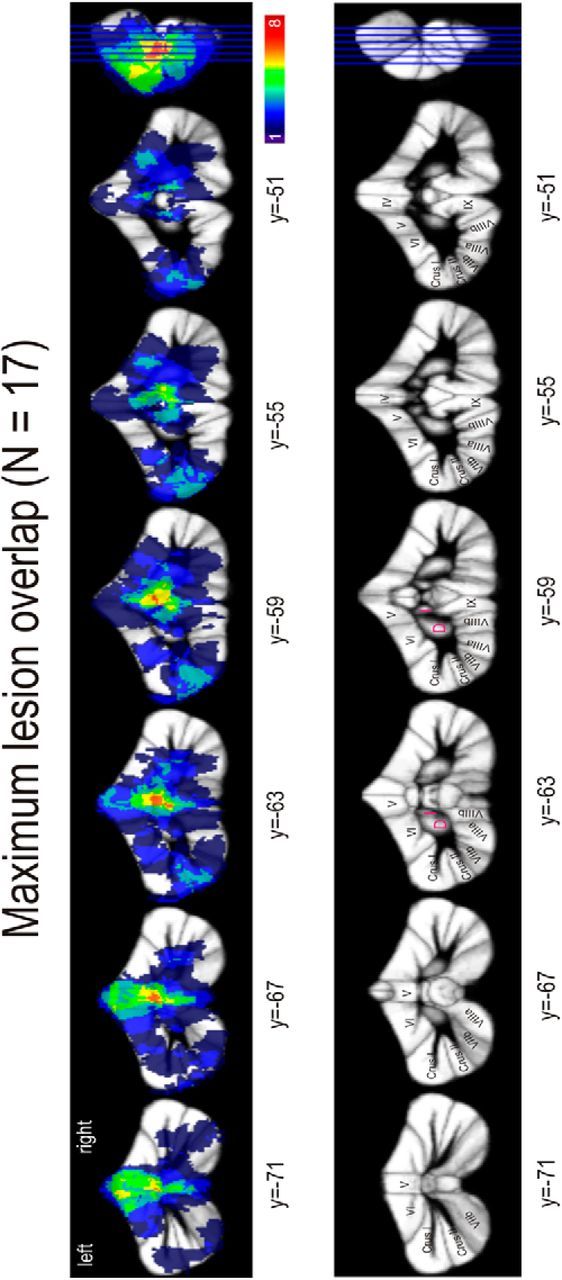
Regions of cerebellar lesions in all patients overlapped in a single image. The number of patients presenting lesions in the specific areas is color-coded. D, Dentate; I, interposed.
To identify lesion areas associated with performance deficits, we used voxel-based lesion symptom mapping with the Liebermeister test to test for statistical significance at a threshold of p < 0.05 using nonparametric mapping software as part of MRICron (http://www.mccauslandcenter.sc.edu/mricro/npm/) (Rorden et al., 2007). Only voxels damaged in at least 10% of individuals (n = 2) were considered. Strength of the association is color-coded within each figure showing the lesion sides (see Figs. 5 and 7). Brighter colors indicate higher z-values and thus stronger associations of lesion sites and the behavioral measure.
Figure 5.
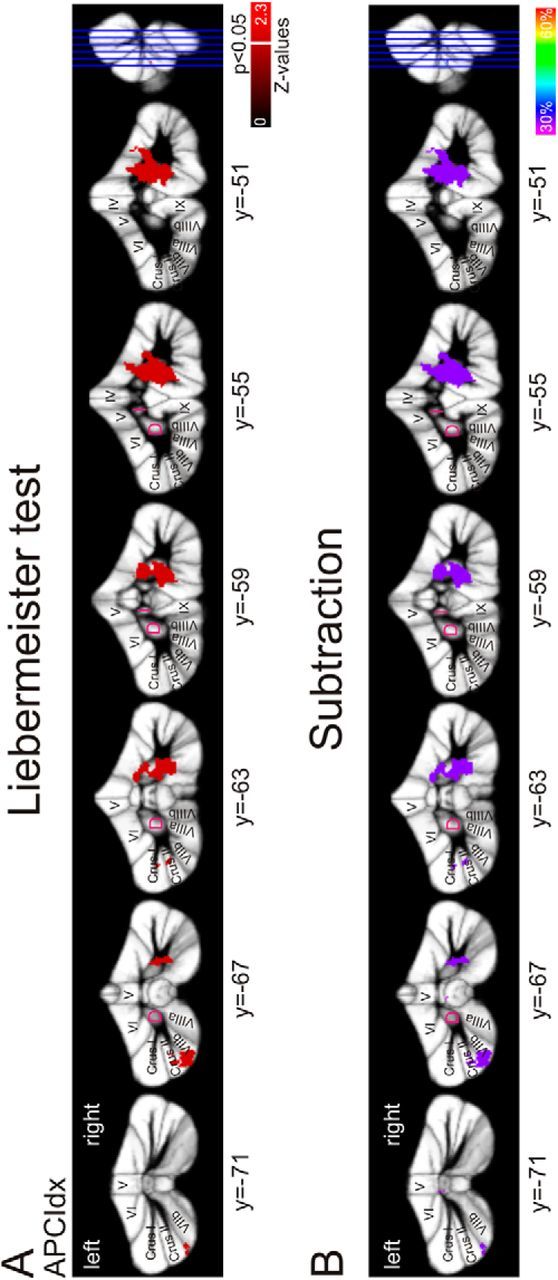
Lesion symptom mapping in patients after benign tumor resection. Arabic numbers indicate y coordinates. Latin numbers indicate cerebellar lobules. A, Colored regions represent lesions that are significantly correlated with a disturbed action-perception coupling (p < 0.05) according to the Liebermeister test of significance. Strength of the association is color-coded. Brighter colors represent higher z-values. White line indicates a z-value of 1.65 (p < 0.05). Lesions associated with a disturbed APC were identified in the ipsilateral motor representations (lobules V and VI), the ventral dentate (z = 1.79, x = 18, y = −60, z = −43) with extensions into the dorsal part of the dentate nucleus (z = 1.79, x = 18, y = −56, z = −32), and in the left Crus II and lobule VIIb. B, Subtraction analysis identified the same regions. The right dentate, the ipsilateral motor representation, and the left Crus II are 33% more likely lesioned in affected compared with unaffected patients. D, Dentate; I, interposed.
Figure 7.

Lesion symptom mapping of motor behavior. A, Voxel-based lesion symptom mapping analysis shows regions with a significant correlation with increased velocity variability (p < 0.05) according to the Liebermeister test of significance (strength of association color-coded). Brighter colors represent higher z-values. The white line indicates a z-value of 1.65 (p < 0.05). Arabic numbers indicate y coordinates. Latin numbers indicate cerebellar lobules. B, Subtraction analysis. The right dentate and interposed nucleus as well as the lobules V and VI are 38% more likely, and the right lobule IX is 50% more likely lesioned in patients with increased velocity variability. C, Lesion symptom map overlay plot of lesions/regions specifically associated with APC deficits (in red) and lesion sites that are strongly correlated with increased velocity variability (blue).
In addition, subtraction analysis was performed in MRIcron. For each lesioned voxel, the percentage of unaffected patients with a lesion in that voxel was subtracted from the percentage of affected patients with a lesion in that voxel (Karnath et al., 2002; Thieme et al., 2013). Affected and unaffected patients were defined as outlined below. Voxels that were at least 25% more likely to be lesioned in impaired patients were considered.
Statistical analysis.
Statistical testing was performed using SPSS (http://www-01.ibm.com/software/de/stats20/). Statistical significance is reported with respect to the α = 5% significance level. Behavioral differences between conditions were analyzed using a repeated-measures ANOVA with the within-subject factor temporal modification for control subjects and patients individually. To separate unaffected and affected patients, we conducted a cluster analysis based on the k-means algorithm with initial cluster centers c1 = 0.15 and c2 = −0.15 on the APC indices. To validate our subject classification, we ran an additional repeated-measures ANOVA on the d′ value with the within-subject factors noise level, temporal modification, experimental condition, and the between-subject factor classified group.
We tested for the effect of subject group on the NTV, the eye movement parameters, and the kinematic parameters applying the nonparametric Kruskal–Wallis test. Paired comparisons between groups were accomplished using the nonparametric Mann–Whitney U test.
We further tested for associations between the APCIdx and various other measures as the baseline perception performance, the ICARS score and its subscores, the lesion volume, and the kinematic parameters calculating the Kendall rank correlation coefficient.
Results
Behavioral performance
All participants were well capable of performing the BM detection task in the baseline condition. The detection sensitivity in the baseline condition, as measured by mean d′ values, did not differ between healthy controls and patients (controls: 3.20 ± 0.6; patients: 3.28 ± 0.4; p = 0.708, Mann–Whitney U test).
The interaction indices reflecting the influence of action execution on visual perception performance for both subject groups are depicted in Figure 1B. Concurrent motor execution significantly altered the visual perception performance of the controls depending on the temporal matching of executed and observed action: Controls benefitted from their self-generated motion if the visual stimulus was displayed in synchrony; but if the shown arm movement was delayed with respect to their own movements, performance in the perceptual task dropped (Fig. 1B; repeated-measures ANOVA: main effect temporal modification, F(1,16) = 5.842, p = 0.028).
This pattern of the action perception coupling, described by a substantial benefit from self-generated motion in the synchronous condition and an inhibition of perception through motor activity in the asynchronous condition, is reflected in a positive APCIdx (Table 2).
Cerebellar patients as whole group showed no clear APC pattern: neither a benefit nor an inhibition (i.e., the interaction indices did not differ significantly from zero) (Fig. 1B; F(1,16) = 0.093, p = 0.765).
Using k-means cluster analysis on the APCIdx, we defined two clusters within the whole patient group. Eleven patients belonging to the first cluster showed an APC pattern comparable with the healthy controls, with a positive APCIdx. This group was defined as the unaffected patients. The second cluster includes 6 patients with an abnormal APC (APCIdx < 0); this group was defined the affected patients (Fig. 3).
Figure 3.

Classification results. Ellipses represent clusters resulting from cluster-center analysis based on the APCIdx. Red ellipse represents the cluster of affected patients; blue ellipse represents the cluster of unaffected patients. Filled symbols represent individual APCIdxs; open symbols represent cluster centers (final cluster centers c1 = 0.13, c2 = −0.2). Noteworthy, a separation of affected and unaffected patients based on the performance of the healthy control subjects led to the same classification. Range of healthy controls from 25 lower to 75 upper percentile outlined as green box.
We verified the validity of this categorization by analyses on the basic measurement of detection sensitivity, the d′ value. Whereas healthy controls and unaffected patients show a significant increase in sensitivity for the synchronous test condition compared with the asynchronous test condition, affected patients do not show such a difference (Fig. 4). Further, a repeated-measure ANOVA revealed an interaction effect of the factors temporal modification, experimental condition, and classified group with an estimated effect size of ŋ2 = 0.107 (F(1,32) = 3.84, p = 0.059).
Figure 4.

Mean d′ values for the test conditions showing the biological motion stimuli synchronous or asynchronous to the executed arm movements. Controls as well as unaffected patients show an increased sensitivity for synchronous stimuli compared with asynchronous stimuli (within-subject comparison). Affected patients do not show such sensitivity difference between conditions. *p < 0.05 (pairwise differences, t test). ***p < 0.01 (pairwise differences, t test). Error bars indicate SE.
As basis for the lesion symptom mapping, we used the APCIdx as one compact description of the behavioral effect.
To ensure that the APC results were not confounded by a general detection deficit in the affected patients, we tested for group differences in the baseline performance. Nonparametric significance testing failed to detect a group difference in the baseline NTV between the affected patients, unaffected patients, and controls (Kruskal–Wallis test, p = 0.112; all paired comparisons using the Mann–Whitney U test revealed no significant differences). However, given the small group size of only 6 affected patients, a difference between patients and controls cannot be completely ruled out with a significance test yielding a p value of 0.112. Nevertheless, the absence of a significant correlation between baseline performance and the APCIdx for patients (Kendall's tau = 0.224, p = 0.215) makes it rather unlikely that a low APC is predominantly the result of a general detection deficit.
In summary, the behavioral results for the controls confirm our previous results (Christensen et al., 2011), revealing in healthy individuals a modulation of BM perception by concurrent motor behavior: compared with baseline, visual detection was facilitated by synchronous motor behavior and inhibited by asynchronous motor behavior. In cerebellar patients, two subgroups were defined. One group of patients was unaffected, showing an APC pattern comparable with the controls, whereas the group of the affected patients showed an inverse pattern of results.
Notably, the patients defined as affected with a diminished APC showed a normal BM detection in the baseline condition. We further ruled out possible confounds because of the severity of clinical ataxia symptoms.
Controlling for the specificity of the APC deficit
To confirm the specificity of the identified APC deficit, we conducted several control experiments and analyses. Because all visual stimuli were created online based on the individual arm movements of the participants, the individual stimuli could have differed in their appearance and detection complexity. To rule out that these differences might have confounded the results concerning the APC performance, we tested post hoc in a separate experiment for differences in the detectability of arm movements of control subjects and patients. Therefore, we conducted an additional purely visual perception experiment to control for differences in the detectability of stimuli created from arm movements of affected patients compared with stimuli generated from movements of control subjects. The task followed the same procedure as the baseline condition in the main experiment. Twenty new naive subjects took part in this experiment. Comparing the detection performance in terms of percentage correct detection of these new participants, we found no differences for stimuli from controls and stimuli from affected patients (Wilcoxon rank sum test, p = 0.372).
Further, it could be possible that a disturbed eye movement pattern might cause deficits in the visual detection performance. We failed to observe any correlation between the oculomotor subscore of the ICARS and a disturbed APC (Kendall's tau < 0.3, all p > 0.2 for the oculomotor ICARS subscore). This lack of a correlation between clinical scores for eye movements and the APCIdx was further supported by investigations of the fixation behavior of the participants. We analyzed the following: (1) the number of saccades per nontarget baseline trials, (2) the mean saccadic amplitude, and (3) the mean saccade duration as a measure of the eye movement behavior (Lackner and Mather, 1981). Group comparisons revealed no differences in these parameters and in the variability as measured by the SD of these parameters between controls, affected, and unaffected patients (Kruskal–Wallis test, all p > 0.4). Moreover, the only 2 patients that showed clinical oculomotor disturbances (deficits in smooth pursuit movements and nystagmus, respectively) belonged to the unaffected patient group. Thus, a disturbed eye movement pattern could not explain the deficit in the APC.
These results underline the specificity of the APC deficit.
Lesion symptom mapping of the behavioral results
Lesion symptom mapping (LSM) revealed significant associations of specific cerebellar areas with a deficit in the APC. Areas were the same based on descriptive subtraction analysis and statistical Liebermeister test. Lesions associated with an impaired APC are shown in Figure 5A, B. The affected patients show lesions in the right dentate nucleus (ipsilateral to the moved arm). The maximum z-values for dentate lesions associated with the APCIdx are located ventrally, but lesions extended into the dorsal part of the dentate nucleus. In addition, the motor representations in lobule V and VI are correlated with a deficit in the APC. Further, lesions in the right posterior lobules VIIIa, VIIIb, and IX are significantly more likely in patients with a low APCIdx.
Notably, there was also a relationship between lesions of the left posterior cerebellum and the APCIdx. Specifically, lesions of the left Crus II and the left lobule VIIb were significantly related to the group of affected patients compared with the unaffected patients. Comparisons of the lesion volume showed no differences between affected and unaffected patients (p = 0.43). Further, there is no significant correlation between the lesion volume and the APCIdx (Kendall's tau: −0.206, p = 0.249).
Statistical testing for lesions associated with a general visual detection performance as reflected by a baseline NTV below the 25th percentile of the control subjects revealed no cerebellar areas that are significantly correlated with a perceptual deficit at a threshold level of p < 0.05.
Motor behavior
To investigate the potential influence of movement disturbances on the APC, we analyzed various kinematic parameters (e.g., movement amplitude, velocity, and jerk) as well as the variability of those.
Because all participants were trained to wave their arms in the same velocity, we did not find any differences in movement velocity between participants. We found nonsignificant group differences for the variability of the movement amplitude and velocity (Kruskal–Wallis test, p = 0.062 and p = 0.06, respectively; Fig. 6). In contrast, group comparisons between controls and affected patients revealed significant differences in the variability of movement amplitude and velocity (Mann–Whitney U test, p = 0.044 and p = 0.044, respectively), and comparisons between affected and unaffected patients revealed a significant difference in the variability of movement amplitudes (Mann–Whitney U test, p = 0.037). This increased movement variability indicates a deficit in performing rhythmic waving movements with constant velocity and amplitude.
Figure 6.

Variability of kinematic parameters for the different subject groups. *Significant pairwise differences (p < 0.05, Mann–Whitney U test). A, Variability of movement amplitude. B, Variability of movement velocity.
Disturbances of motor representations that cause such motor deficits potentially also cancel beneficial influences on the APC. However, we did not observe a clear correlation between the variability in velocity and the APCIdx (Kendall's tau = −0.162, p = 0.365). The correlation between the variability of the movement amplitude and the APCIdx reached a Kendall's tau coefficient of −0.294 but failed to reach significance (p = 0.099). These results indicate that these motor representations are potentially involved in the APC but cannot completely explain the observed effects.
Lesion symptom mapping of motor behavior
Subtraction analysis and Liebermeister test revealed the same areas associated with an increase of the variability in arm velocity during execution of cyclic waving movements (Fig. 7A,B). Lesions of the right dentate nucleus, especially the dorsal part, with extensions into the right interposed nucleus, and with some extensions to the right ventral dentate as well as lesions within the motor representations of the hand and arm in lobules V and VI were significantly more likely in patients with increased velocity variability. Further, small parts of the vermal lobules VIIIA, VIIIB, and IX, extending into right lobule IX, showed also a significant relationship with the increased velocity variability.
Notably, both a perturbed motor behavior and a disturbed APC are associated with lesions in cerebellar motor representations (e.g., the interposed nucleus, dorsal dentate nucleus, and lobules V/VI) (Fig. 7C). In addition, an intact APC depends on the integrity of the more ventral part of the dentate nucleus and the posterior cerebellum, most prominently the left Crus II, and left lobule VIIb (Fig. 7C).
Discussion
Using a novel experimental framework that allowed us to quantify the effect of concurrent motor execution on BM perception, we found specific deficits in the APC in patients with focal cerebellar lesions.
We identified circumscribed areas within the cerebellum that are causally involved in the APC on two different levels:
On the level of a somatosensory state representation (ipsilateral lobules V/VI) presumably within the cerebrocerebellar motor circuits. Our results support the hypothesis that an intact somatosensory state estimate of own movements is not only essential for control but also facilitates the detection of synchronous BM stimuli as we observed in controls.
On the level of multisensory integration (lobule VII, ventral dentate), including higher-order visual perception. Hence, the posterior regions of the cerebellum are likely crucial parts within the cerebellar–parietal loop for the integration of sensory information from different modalities, potentially establishing a corresponding multisensory state estimate.
Cerebellar involvement in an intact APC
Cerebellar cortex
On the level of the cerebellar cortex, an APC deficit was strongly associated with lesions of the motor representation of the arm in the right anterior and posterior cerebellar cortex (lobules V/VI, and VIII). An increased variability in the motor behavior was associated with lesions in lobule V/VI. Although both deficits, the reduced APC as well as the increased motor variability, were associated with lesions in lobules V/VI, the specific regions are distinct from each another (Fig. 7C). Lesions of patients with an APC deficit extended more into the posterior part of lobule VI. These results are in line with the hypothesis that lobule VI encodes sensory prediction (Schlerf et al., 2012) that potentially are used to calculate and update a somatomotor state estimate (Miall et al., 2007).
Remarkably, lesions of the left posterior cerebellum (Crus II, lobule VIIb), contralateral to the arm movement, were associated with a perturbed APC. Whereas the skeletomotor divisions of the cerebellum in the anterior lobe and the intermediate zone of the posterior lobe are related to ipsilateral movements (Glickstein et al., 2011), data from electrophysiology studies revealed, especially in the more lateral posterior cerebellum (Crus II), effector-side independent neural activations (Greger et al., 2004).
Dentate nucleus
The observed deficits in the APC as well as the motor disturbances were both most prominently associated with lesions in the right dentate nucleus. A disturbed APC was correlated with lesions of the ventral dentate nucleus, whereas a perturbed motor behavior was strongly associated with the dorsal dentate nucleus with extensions into the ventral part and into the right interposed nucleus.
Our results provide evidence for a dorsal-to-ventral transition from simple motor to higher-order motor and integrative functions within the human dentate as proposed by high-resolution imaging studies (Küper et al., 2011; Bernard et al., 2013). These findings contribute to the ongoing debate of the functional division of the dentate into a motor (dorsal) and a nonmotor (ventral) part (Strick et al., 2009). They support recent hypotheses that such a strict subdivision is an oversimplification and that complex motor function involves the ventral dentate.
Corticocerebellar networks
Figure 8 illustrates the corticocerebellar connections as an overlay of the cerebellar lesions from our study and the network parceling from Buckner et al. (2011), identified by resting-state analysis. Our identified lesions in the cerebellar lobules and the deep cerebellar nuclei that caused an increased motor variability are connected to primary motor networks in the cerebral cortex (M1).
Figure 8.

Functional connectivity map. A, Overlay of lesion sides on the map of the human cerebellum based on the functional connectivity of the cerebral cortex. Colors encode the 7 major networks as identified by Yeo et al. (2011). White stars represent major lesions associated with a disturbed action-perception pattern plotted on the illustration of the 7 network parceling from Buckner et al. (2011). White circles represent lesion sides correlated with perturbed motor behavior. B, Cortical networks as defined by Yeo et al. (2011). [Reproduced and adapted with permission from the American Physiological Society.] C, Our proposed corticocerebellar loop involved in intact action-perception coupling. Pathways between the cerebral cortex and the cerebellum are routed via the pontine nuclei. These include pathways from the motor cortex, somatosensory cortex, BA5, PPC, and pathways from the visual cortical areas (Glickstein et al., 1985). Motor and somatosensory information reaches lobules V and VI (Kelly and Strick, 2003). Visual information reaches lobules IXA and VIIIB (dorsal paraflocculus) but also targets Crus I and II via the dorsolateral parts of the pontine nuclei (Glickstein et al., 1994). A similar route also exists for cortical information from the PPC (Leichnetz, 2001). The cerebellar output from the anterior interposed and dorsal dentate reaches motor cortex (Kelly and Strick, 2003), whereas the output from the posterior interposed and ventral dentate reaches the PPC (Prevosto et al., 2010). Commissural fibers connect the PPC of both hemispheres (Van Essen et al., 1982). Corticocortical pathways also connect motor /somatosensory cortex and PPC within the same hemisphere (Gharbawie et al., 2011).
Cerebellar areas associated with a disturbed APC are functionally connected to networks in frontal (inferior frontal gyrus, premotor cortex), temporal (superior temporal sulcus), and parietal areas (supramarginal gyrus, posterior parietal cortex [PPC]) in the cerebral cortex (O'Reilly et al., 2010; Buckner et al., 2011; Sokolov et al., 2012). These networks have been suggested to be associated with sensorimotor integration (Yeo et al., 2011), action observation (Gazzola and Keysers, 2009), updating one's own body image (Blakemore and Sirigu, 2003), and timed sensory predictions (Bastian, 2006). Especially the PPC is known as a key structure to integrate sensory cues, such as proprioceptive and visuospatial information (Buneo and Andersen, 2006; Stein and Stanford, 2008). A previous fMRI study argued in favor of coactivations of the left posterior cerebellum and the right PPC during the integration of visual and kinesthetic information (Hagura et al., 2009). With the present lesion study, we were able to show even a causal involvement of the left Crus II in these integrative processes.
Summarizing our findings support the theory that the network, including the cerebellum and the PPC, establishes internal forward models to compute state estimates (Wolpert et al., 1998; Miall, 2003; Bastian, 2006; Buneo and Andersen, 2006). We show that disruptions of such state estimates lead to (1) larger variability in motor behavior (Miall et al., 2007) and (2) disturbances of the benefit from interactions of self-executed movements in BM perception, as has been observed for healthy subjects (Miall et al., 2006; Christensen et al., 2011).
Figure 8C shows a hypothetical corticocerebellar loop for an intact APC. The motor representation in lobule V/VI of the ipsilateral cerebellum receives an efference copy of the motor command, sent out from cortical motor areas (Ebner and Pasalar, 2008). This efference copy, together with the proprioceptive feedback from the ongoing movements (Fuchs and Kornhuber, 1969; Bloedel and Courville, 1981), and the somatosensory information from the cortex are used to calculate a current somatosensory state estimate and to predict the sensory consequences of the motor behavior. The lobules V and VI transmit the information to the ipsilateral dorsal dentate nucleus, which itself also receives cerebral input via the pontine nuclei (Shinoda et al., 1992). The contralateral ventral dentate receives input from the right parietal cortex via lobule VII (May and Andersen, 1986; Glickstein et al., 1994, 2011) and projects back to the PPC (Strick et al., 2009). In addition to the well-known contralateral cerebrocerebellar connections, recent electrophysiological experiments give evidence for bilateral connections, especially of higher-order cortical areas with the interposed nucleus and fastigial nucleus (Sultan et al., 2012). These connections probably arise from the common bilateral mossy fiber inputs to deep cerebellar nuclei via precerebellar nuclei, such as the nucleus reticularis tegmentis pontis (Serapide et al., 2002) and the lateral reticular nucleus (Wu et al., 1999). Thus, one might speculate also that the cerebellar–parietal connections involving brainstem nuclei are partly bilateral (Prevosto et al., 2010). However, the dentate nucleus appears to have smaller portions of bilateral mossy fiber inputs (Shinoda et al., 1992; Serapide et al., 2002). Therefore, the more likely site of integration would be via callosal fibers connecting the right and left PPC (Van Essen et al., 1982). This would also explain the additional involvement of the left PPC in temporally critical tasks similar to the APC (Wiener et al., 2010; Vicario et al., 2013).
According to this network model, the integrity of the right lobules V, VI, the left and right dentate nucleus, and the left Crus I and II is of vital importance for an intact APC. Lesion symptom mapping results revealed significant associations with a disturbed APC for all of these areas but the left dentate nucleus. As a first hint for its involvement, one affected patient presented lesions in the left dentate while the right dentate and the left Crus II remained unlesioned. Still, no final conclusion can be drawn on the level of the left dentate nucleus because of the limitation of the LSM approach that we can only make valuable statements about areas with sufficient amount of lesions. Therefore, we cannot exclude the importance of areas for which no patient presented lesions. However, despite our small number of affected patients and the multifocal and bilateral approach of our analysis, we find robust and clear positive effects: For all of our identified regions associated with the APC, at least 2 of the 6 affected patients and more importantly, none of the unaffected patients presents a lesion. Further, as a negative control, multiple areas are lesioned in several patients but are not associated with the APC (e.g., left lobules IV/V, right interposed, right lobule IV).
In conclusion, we showed a causal involvement of the cerebellum in an intact APC on two different levels. First, lesions of the right motor representation in lobules V/VI (together with the dorsal dentate and adjacent interposed nucleus) likely cause a disrupted somatosensory state estimate of ongoing movements. Thus, patients with lesions in these areas show not only greater movement variability but also a disturbed APC. Second, lesions in the ventral dentate and in the left posterior cerebellum (Crus II) are further disrupting the important connections between the posterior cerebellum and the PPC. This hinders the sensorimotor integration of higher-order visual motion perception and motor information and thus causes a deficit in the APC. The present results broaden the perspective that the cerebellum is merely involved in perceptual processes concerning somatosensory aspects toward a more general view that the cerebellum integrates predictions about different kinds of perceptual consequences of actions, including predictions about vision and thus contribute to higher-order cognition.
Footnotes
This work was supported by the EC FP7 Projects TANGO Grant FP7-249858-TP3 and AMARSi Grant FP7-ICT-248311, the Deutsche Forschungsgemeinschaft Grant GI 305/4-1, the German Federal Ministry of Education and Research FKZ 01GQ1002A, and EU Training Network (ITN) ABC PITN-GA-011-290011. We thank Beate Brol for help with the data analysis; Martin Löffler for the setup illustration; Peter Thier, Thomas Haarmeier, and Claire Roether for helpful discussions; two anonymous reviewers for their helpful feedback on an earlier version of this manuscript; and all participants of our study.
The authors declare no competing financial interests.
References
- Bastian AJ. Learning to predict the future: the cerebellum adapts feedforward movement control. Curr Opin Neurobiol. 2006;16:645–649. doi: 10.1016/j.conb.2006.08.016. [DOI] [PubMed] [Google Scholar]
- Bastian AJ. Moving, sensing and learning with cerebellar damage. Curr Opin Neurobiol. 2011;21:596–601. doi: 10.1016/j.conb.2011.06.007. [DOI] [PMC free article] [PubMed] [Google Scholar]
- Bernard JA, Peltier SJ, Benson BL, Wiggins JL, Jaeggi SM, Buschkuehl M, Jonides J, Monk CS, Seidler RD. Dissociable functional networks of the human dentate nucleus. Cereb Cortex. 2013 doi: 10.1093/cercor/bht065. doi: 10.1093/cercor/bht065. Advance online publication. Retrieved March 19, 2013. [DOI] [PMC free article] [PubMed] [Google Scholar]
- Bhanpuri NH, Okamura AM, Bastian AJ. Active force perception depends on cerebellar function. J Neurophysiol. 2012;107:1612–1620. doi: 10.1152/jn.00983.2011. [DOI] [PMC free article] [PubMed] [Google Scholar]
- Blakemore SJ, Sirigu A. Action prediction in the cerebellum and in the parietal lobe. Exp Brain Res. 2003;153:239–245. doi: 10.1007/s00221-003-1597-z. [DOI] [PubMed] [Google Scholar]
- Bloedel JR, Courville J. A review of cerebellar afferent systems. In: Brooks VB, editor. Handbook of physiology, vol. II. Motor control. Baltimore: Williams & Wilkins; 1981. pp. 735–830. [Google Scholar]
- Buckner RL, Krienen FM, Castellanos A, Diaz JC, Yeo BT. The organization of the human cerebellum estimated by intrinsic functional connectivity. J Neurophysiol. 2011;106:2322–2345. doi: 10.1152/jn.00339.2011. [DOI] [PMC free article] [PubMed] [Google Scholar]
- Buneo CA, Andersen RA. The posterior parietal cortex: sensorimotor interface for the planning and online control of visually guided movements. Neuropsychologia. 2006;44:2594–2606. doi: 10.1016/j.neuropsychologia.2005.10.011. [DOI] [PubMed] [Google Scholar]
- Casile A, Giese MA. Nonvisual motor training influences biological motion perception. Curr Biol. 2006;16:69–74. doi: 10.1016/j.cub.2005.10.071. [DOI] [PubMed] [Google Scholar]
- Christensen A, Ilg W, Giese MA. Spatiotemporal tuning of the facilitation of biological motion perception by concurrent motor execution. J Neurosci. 2011;31:3493–3499. doi: 10.1523/JNEUROSCI.4277-10.2011. [DOI] [PMC free article] [PubMed] [Google Scholar]
- Cutting JE, Moore C, Morrison R. Masking the motions of human gait. Percept Psychophys. 1988;44:339–347. doi: 10.3758/BF03210415. [DOI] [PubMed] [Google Scholar]
- Decety J, Grèzes J, Costes N, Perani D, Jeannerod M, Procyk E, Grassi F, Fazio F. Brain activity during observation of actions. Influence of action content and subject's strategy. Brain. 1997;120:1763–1777. doi: 10.1093/brain/120.10.1763. [DOI] [PubMed] [Google Scholar]
- Diedrichsen J. A spatially unbiased atlas template of the human cerebellum. Neuroimage. 2006;33:127–138. doi: 10.1016/j.neuroimage.2006.05.056. [DOI] [PubMed] [Google Scholar]
- Diedrichsen J, Balsters JH, Flavell J, Cussans E, Ramnani N. A probabilistic MR atlas of the human cerebellum. Neuroimage. 2009;46:39–46. doi: 10.1016/j.neuroimage.2009.01.045. [DOI] [PubMed] [Google Scholar]
- Diedrichsen J, Maderwald S, Küper M, Thürling M, Rabe K, Gizewski ER, Ladd ME, Timmann D. Imaging the deep cerebellar nuclei: a probabilistic atlas and normalization procedure. Neuroimage. 2011;54:1786–1794. doi: 10.1016/j.neuroimage.2010.10.035. [DOI] [PubMed] [Google Scholar]
- Ebner TJ, Pasalar S. Cerebellum predicts the future motor state. Cerebellum. 2008;7:583–588. doi: 10.1007/s12311-008-0059-3. [DOI] [PMC free article] [PubMed] [Google Scholar]
- Fadiga L, Fogassi L, Pavesi G, Rizzolatti G. Motor facilitation during action observation: a magnetic stimulation study. J Neurophysiol. 1995;73:2608–2611. doi: 10.1152/jn.1995.73.6.2608. [DOI] [PubMed] [Google Scholar]
- Fuchs AF, Kornhuber HH. Extraocular muscle afferents to the cerebellum of the cat. J Physiol. 1969;200:713–722. doi: 10.1113/jphysiol.1969.sp008718. [DOI] [PMC free article] [PubMed] [Google Scholar]
- Gallese V, Fadiga L, Fogassi L, Rizzolatti G. Action recognition in the premotor cortex. Brain. 1996;119:593–609. doi: 10.1093/brain/119.2.593. [DOI] [PubMed] [Google Scholar]
- Gao JH, Parsons LM, Bower JM, Xiong J, Li J, Fox PT. Cerebellum implicated in sensory acquisition and discrimination rather than motor control. Science. 1996;272:545–547. doi: 10.1126/science.272.5261.545. [DOI] [PubMed] [Google Scholar]
- Gazzola V, Keysers C. The observation and execution of actions share motor and somatosensory voxels in all tested subjects: single-subject analyses of unsmoothed fMRI data. Cereb Cortex. 2009;19:1239–1255. doi: 10.1093/cercor/bhn181. [DOI] [PMC free article] [PubMed] [Google Scholar]
- Gharbawie OA, Stepniewska I, Kaas JH. Cortical connections of functional zones in posterior parietal cortex and frontal cortex motor regions in New World monkeys. Cereb Cortex. 2011;21:1981–2002. doi: 10.1093/cercor/bhq260. [DOI] [PMC free article] [PubMed] [Google Scholar]
- Glickstein M, May JG, 3rd, Mercier BE. Corticopontine projection in the macaque: the distribution of labelled cortical cells after large injections of horseradish peroxidase in the pontine nuclei. J Comp Neurol. 1985;235:343–359. doi: 10.1002/cne.902350306. [DOI] [PubMed] [Google Scholar]
- Glickstein M, Gerrits N, Kralj-Hans I, Mercier B, Stein J, Voogd J. Visual pontocerebellar projections in the macaque. J Comp Neurol. 1994;349:51–72. doi: 10.1002/cne.903490105. [DOI] [PubMed] [Google Scholar]
- Glickstein M, Sultan F, Voogd J. Functional localization in the cerebellum. Cortex. 2011;47:59–80. doi: 10.1016/j.cortex.2009.09.001. [DOI] [PubMed] [Google Scholar]
- Goldvasser D, McGibbon CA, Krebs DE. High curvature and jerk analyses of arm ataxia. Biol Cybern. 2001;84:85–90. doi: 10.1007/s004220000201. [DOI] [PubMed] [Google Scholar]
- Greger B, Norris SA, Thach WT. Spike firing in the lateral cerebellar cortex correlated with movement and motor parameters irrespective of the effector limb. J Neurophysiol. 2004;91:576–582. doi: 10.1152/jn.00535.2003. [DOI] [PubMed] [Google Scholar]
- Hagura N, Oouchida Y, Aramaki Y, Okada T, Matsumura M, Sadato N, Naito E. Visuokinesthetic perception of hand movement is mediated by cerebro-cerebellar interaction between the left cerebellum and right parietal cortex. Cereb Cortex. 2009;19:176–186. doi: 10.1093/cercor/bhn068. [DOI] [PMC free article] [PubMed] [Google Scholar]
- Händel B, Thier P, Haarmeier T. Visual motion perception deficits due to cerebellar lesions are paralleled by specific changes in cerebro-cortical activity. J Neurosci. 2009;29:15126–15133. doi: 10.1523/JNEUROSCI.3972-09.2009. [DOI] [PMC free article] [PubMed] [Google Scholar]
- Ivry RB, Spencer RM. The neural representation of time. Curr Opin Neurobiol. 2004;14:225–232. doi: 10.1016/j.conb.2004.03.013. [DOI] [PubMed] [Google Scholar]
- Izawa J, Criscimagna-Hemminger SE, Shadmehr R. Cerebellar contributions to reach adaptation and learning sensory consequences of action. J Neurosci. 2012;32:4230–4239. doi: 10.1523/JNEUROSCI.6353-11.2012. [DOI] [PMC free article] [PubMed] [Google Scholar]
- Johansson G. Visual perception of biological motion and a model for its analysis. Percept Psychophys. 1973;14:201–211. doi: 10.3758/BF03212378. [DOI] [Google Scholar]
- Karnath HO, Himmelbach M, Rorden C. The subcortical anatomy of human spatial neglect: putamen, caudate nucleus and pulvinar. Brain. 2002;125:350–360. doi: 10.1093/brain/awf032. [DOI] [PubMed] [Google Scholar]
- Kelly RM, Strick PL. Cerebellar loops with motor cortex and prefrontal cortex of a nonhuman primate. J Neurosci. 2003;23:8432–8444. doi: 10.1523/JNEUROSCI.23-23-08432.2003. [DOI] [PMC free article] [PubMed] [Google Scholar]
- Kilner JM, Neal A, Weiskopf N, Friston KJ, Frith CD. Evidence of mirror neurons in human inferior frontal gyrus. J Neurosci. 2009;29:10153–10159. doi: 10.1523/JNEUROSCI.2668-09.2009. [DOI] [PMC free article] [PubMed] [Google Scholar]
- Küper M, Dimitrova A, Thürling M, Maderwald S, Roths J, Elles HG, Gizewski ER, Ladd ME, Diedrichsen J, Timmann D. Evidence for a motor and a non-motor domain in the human dentate nucleus: an fMRI study. Neuroimage. 2011;54:2612–2622. doi: 10.1016/j.neuroimage.2010.11.028. [DOI] [PubMed] [Google Scholar]
- Lackner JR, Mather JA. Eye-hand tracking using afterimages: evidence that sense of effort is dependent on spatial constancy mechanisms. Exp Brain Res. 1981;44:138–142. doi: 10.1007/BF00237334. [DOI] [PubMed] [Google Scholar]
- Larsell O. Lobules of the mammalian and human cerebellum. Anat Rec. 1958;130:329–330. [Google Scholar]
- Leichnetz GR. Connections of the medial posterior parietal cortex (area 7 m) in the monkey. Anat Rec. 2001;263:215–236. doi: 10.1002/ar.1082. [DOI] [PubMed] [Google Scholar]
- Macmillan NA, Creelman CD. Detection theory: a user's guide. Mahwah, NJ: Lawrence Erlbaum; 2004. [Google Scholar]
- May JG, Andersen RA. Different patterns of corticopontine projections from separate cortical fields within the inferior parietal lobule and dorsal prelunate gyrus of the macaque. Exp Brain Res. 1986;63:265–278. doi: 10.1007/BF00236844. [DOI] [PubMed] [Google Scholar]
- Miall RC. Connecting mirror neurons and forward models. Neuroreport. 2003;14:2135–2137. doi: 10.1097/00001756-200312020-00001. [DOI] [PubMed] [Google Scholar]
- Miall RC, Stanley J, Todhunter S, Levick C, Lindo S, Miall JD. Performing hand actions assists the visual discrimination of similar hand postures. Neuropsychologia. 2006;44:966–976. doi: 10.1016/j.neuropsychologia.2005.09.006. [DOI] [PubMed] [Google Scholar]
- Miall RC, Christensen LO, Cain O, Stanley J. Disruption of state estimation in the human lateral cerebellum. PLoS Biol. 2007;5:e316. doi: 10.1371/journal.pbio.0050316. [DOI] [PMC free article] [PubMed] [Google Scholar]
- O'Reilly JX, Mesulam MM, Nobre AC. The cerebellum predicts the timing of perceptual events. J Neurosci. 2008;28:2252–2260. doi: 10.1523/JNEUROSCI.2742-07.2008. [DOI] [PMC free article] [PubMed] [Google Scholar]
- O'Reilly JX, Beckmann CF, Tomassini V, Ramnani N, Johansen-Berg H. Distinct and overlapping functional zones in the cerebellum defined by resting state functional connectivity. Cereb Cortex. 2010;20:953–965. doi: 10.1093/cercor/bhp157. [DOI] [PMC free article] [PubMed] [Google Scholar]
- Prevosto V, Graf W, Ugolini G. Cerebellar inputs to intraparietal cortex areas LIP and MIP: functional frameworks for adaptive control of eye movements, reaching, and arm/eye/head movement coordination. Cereb Cortex. 2010;20:214–228. doi: 10.1093/cercor/bhp091. [DOI] [PMC free article] [PubMed] [Google Scholar]
- Prinz W. Perception and action planning. Eur J Cogn Psychol. 1997;9:129–154. doi: 10.1080/713752551. [DOI] [Google Scholar]
- Rorden C, Karnath HO, Bonilha L. Improving lesion-symptom mapping. J Cogn Neurosci. 2007;19:1081–1088. doi: 10.1162/jocn.2007.19.7.1081. [DOI] [PubMed] [Google Scholar]
- Schlerf J, Ivry RB, Diedrichsen J. Encoding of sensory prediction errors in the human cerebellum. J Neurosci. 2012;32:4913–4922. doi: 10.1523/JNEUROSCI.4504-11.2012. [DOI] [PMC free article] [PubMed] [Google Scholar]
- Schmahmann JD, Doyon J, McDonald D, Holmes C, Lavoie K, Hurwitz AS, Kabani N, Toga A, Evans A, Petrides M. Three-dimensional MRI atlas of the human cerebellum in proportional stereotaxic space. Neuroimage. 1999;10:233–260. doi: 10.1006/nimg.1999.0459. [DOI] [PubMed] [Google Scholar]
- Schütz-Bosbach S, Prinz W. Perceptual resonance: action-induced modulation of perception. Trends Cogn Sci. 2007;11:349–355. doi: 10.1016/j.tics.2007.06.005. [DOI] [PubMed] [Google Scholar]
- Serapide MF, Zappalà A, Parenti R, Pantò MR, Cicirata F. Laterality of the pontocerebellar projections in the rat. Eur J Neurosci. 2002;15:1551–1556. doi: 10.1046/j.1460-9568.2002.01993.x. [DOI] [PubMed] [Google Scholar]
- Shinoda Y, Sugiuchi Y, Futami T, Izawa R. Axon collaterals of mossy fibers from the pontine nucleus in the cerebellar dentate nucleus. J Neurophysiol. 1992;67:547–560. doi: 10.1152/jn.1992.67.3.547. [DOI] [PubMed] [Google Scholar]
- Sokolov AA, Erb M, Gharabaghi A, Grodd W, Tatagiba MS, Pavlova MA. Biological motion processing: the left cerebellum communicates with the right superior temporal sulcus. Neuroimage. 2012;59:2824–2830. doi: 10.1016/j.neuroimage.2011.08.039. [DOI] [PubMed] [Google Scholar]
- Stein BE, Stanford TR. Multisensory integration: current issues from the perspective of the single neuron. Nat Rev Neurosci. 2008;9:255–266. doi: 10.1038/nrn2331. [DOI] [PubMed] [Google Scholar]
- Strick PL, Dum RP, Fiez JA. Cerebellum and nonmotor function. Annu Rev Neurosci. 2009;32:413–434. doi: 10.1146/annurev.neuro.31.060407.125606. [DOI] [PubMed] [Google Scholar]
- Sultan F, Augath M, Hamodeh S, Murayama Y, Oeltermann A, Rauch A, Thier P. Unravelling cerebellar pathways with high temporal precision targeting motor and extensive sensory and parietal networks. Nat Commun. 2012;3:924. doi: 10.1038/ncomms1912. [DOI] [PubMed] [Google Scholar]
- Thieme A, Thürling M, Galuba J, Burciu RG, Göricke S, Beck A, Aurich V, Wondzinski E, Siebler M, Gerwig M, Bracha V, Timmann D. Storage of a naturally acquired conditioned response is impaired in patients with cerebellar degeneration. Brain. 2013;136:2063–2076. doi: 10.1093/brain/awt107. [DOI] [PMC free article] [PubMed] [Google Scholar]
- Trouillas P, Takayanagi T, Hallett M, Currier RD, Subramony SH, Wessel K, Bryer A, Diener HC, Massaquoi S, Gomez CM, Coutinho P, Ben Hamida M, Campanella G, Filla A, Schut L, Timann D, Honnorat J, Nighoghossian N, Manyam B. International Cooperative Ataxia Rating Scale for pharmacological assessment of the cerebellar syndrome: the Ataxia Neuropharmacology Committee of the World Federation of Neurology. J Neurol Sci. 1997;145:205–211. doi: 10.1016/S0022-510X(96)00231-6. [DOI] [PubMed] [Google Scholar]
- Van Essen DC, Newsome WT, Bixby JL. The pattern of interhemispheric connections and its relationship to extrastriate visual areas in the macaque monkey. J Neurosci. 1982;2:265–283. doi: 10.1523/JNEUROSCI.02-03-00265.1982. [DOI] [PMC free article] [PubMed] [Google Scholar]
- Vicario CM, Martino D, Koch G. Temporal accuracy and variability in the left and right posterior parietal cortex. Neuroscience. 2013;245:121–128. doi: 10.1016/j.neuroscience.2013.04.041. [DOI] [PubMed] [Google Scholar]
- Wiener M, Turkeltaub P, Coslett HB. The image of time: a voxelwise meta-analysis. Neuroimage. 2010;49:1728–1740. doi: 10.1016/j.neuroimage.2009.09.064. [DOI] [PubMed] [Google Scholar]
- Wolpert DM, Flanagan JR. Motor prediction. Curr Biol. 2001;11:R729–R732. doi: 10.1016/S0960-9822(01)00432-8. [DOI] [PubMed] [Google Scholar]
- Wolpert DM, Miall RC, Kawato M. Internal models in the cerebellum. Trends Cogn Sci. 1998;2:338–347. doi: 10.1016/S1364-6613(98)01221-2. [DOI] [PubMed] [Google Scholar]
- Wolpert DM, Doya K, Kawato M. A unifying computational framework for motor control and social interaction. Philos Trans R Soc Lond B Biol Sci. 2003;358:593–602. doi: 10.1098/rstb.2002.1238. [DOI] [PMC free article] [PubMed] [Google Scholar]
- Wu HS, Sugihara I, Shinoda Y. Projection patterns of single mossy fibers originating from the lateral reticular nucleus in the rat cerebellar cortex and nuclei. J Comp Neurol. 1999;411:97–118. doi: 10.1002/(SICI)1096-9861(19990816)411:1<97::AID-CNE8>3.0.CO;2-O. [DOI] [PubMed] [Google Scholar]
- Yeo BT, Krienen FM, Sepulcre J, Sabuncu MR, Lashkari D, Hollinshead M, Roffman JL, Smoller JW, Zöllei L, Polimeni JR, Fischl B, Liu H, Buckner RL. The organization of the human cerebral cortex estimated by intrinsic functional connectivity. J Neurophysiol. 2011;106:1125–1165. doi: 10.1152/jn.00338.2011. [DOI] [PMC free article] [PubMed] [Google Scholar]