

Abstract
Mechanisms of cerebellar motor learning are still poorly understood. The standard Marr–Albus–Ito theory posits that learning involves plasticity at the parallel fiber to Purkinje cell synapses under control of the climbing fiber input, which provides an error signal as in classical supervised learning paradigms. However, a growing body of evidence challenges this theory, in that additional sites of plasticity appear to contribute to motor adaptation. Here, we consider phase-reversal training of the vestibulo-ocular reflex (VOR), a simple form of motor learning for which a large body of experimental data is available in wild-type and mutant mice, in which the excitability of granule cells or inhibition of Purkinje cells was affected in a cell-specific fashion. We present novel electrophysiological recordings of Purkinje cell activity measured in naive wild-type mice subjected to this VOR adaptation task. We then introduce a minimal model that consists of learning at the parallel fibers to Purkinje cells with the help of the climbing fibers. Although the minimal model reproduces the behavior of the wild-type animals and is analytically tractable, it fails at reproducing the behavior of mutant mice and the electrophysiology data. Therefore, we build a detailed model involving plasticity at the parallel fibers to Purkinje cells' synapse guided by climbing fibers, feedforward inhibition of Purkinje cells, and plasticity at the mossy fiber to vestibular nuclei neuron synapse. The detailed model reproduces both the behavioral and electrophysiological data of both the wild-type and mutant mice and allows for experimentally testable predictions.
Introduction
The cerebellum is crucial for different types of motor learning. Established theories of cerebellar learning (Marr, 1969; Albus, 1971; Ito, 1989; Dean et al., 2002) posit that the cerebellum learns by adjusting weights of granule cells (GCs) to Purkinje cell (PC) synapses, thanks to teaching signals provided by climbing fibers (CFs; Soetedjo et al., 2008). While these theories are consistent with experimental data on synaptic plasticity in GC to PC synapses (Ito, 1989; Jörntell and Hansel, 2006; Jaeger, 2011), they cannot easily explain a growing body of experimental work that indicates a significant role for other sites of plasticity (Boyden et al., 2004; Jörntell and Hansel, 2006; Medina, 2011; Gao et al., 2012). Recent advances in the development of cell-specific mutant animals as well as behavioral and electrophysiological recording technologies (Wulff et al., 2009; Seja et al., 2012) have opened up an unprecedented opportunity to study the mechanisms underlying cerebellar learning. Several conditional mouse models are selectively impaired in variants of the vestibulo-ocular reflex (VOR) adaptation task, one of the most studied cerebellar-dependent motor learning tasks (Ito, 1989). In particular, VOR phase-reversal learning is sensitive to manipulations in the cerebellar circuit (Gao et al., 2012). In fact, behavioral impairment in this form of VOR learning can occur despite the fact that the classical plasticity mechanism, GC to PC long-term plasticity, is not disrupted (Wulff et al., 2009; Seja et al., 2012). These data pose significant new challenges for classical models of cerebellar learning.
The goal of this paper is to better understand the mechanisms of cerebellar learning through construction of a model that can reproduce the data available on VOR adaptation, in both wild-type and mutant mice. For this purpose, we investigate the results of VOR adaptation experiments in two cell-specific mutant mouse models (Wulff et al., 2009; Seja et al., 2012) and we perform novel in vivo electrophysiology recordings measuring PC simple spike (SS) and complex spike (CS) activity before and after VOR phase-reversal learning. We then propose two models of cerebellar VOR adaptation learning: a minimal model that involves only cerebellar cortex as a site of plasticity (specifically the GC to PC synapse under the control of the CF) and a detailed model that incorporates some of the additional main cell types involved in the learning task. This latter model includes the following: the GCs, which in the flocculus receive vestibular information from the mossy fibers (MFs), the input of the cerebellar cortex; the PCs and molecular layer interneurons (INs), which both receive input from the GCs and the CFs; and an excitatory and an inhibitory cell population in the medial vestibular nuclei (MVN), receiving inputs from MFs and PCs, and controlling eye movements. In addition, the detailed model includes two sites of plasticity: the classical GC to PC contacts (GC–PC synapses) and the MF to MVN synapses. We provide a mechanistic understanding as to how the system learns VOR adaptation under normal conditions, and how the system is impaired in cell-specific mutant mice, in which the inhibition onto PCs is selectively suppressed (Wulff et al., 2009), or the excitability of GCs is increased (Seja et al., 2012; see Materials and Methods for extended description of mouse lines used in those studies). Finally, we show that our model is consistent with our in vivo electrophysiological recordings from PCs before and after the training.
Materials and Methods
In this section, we first present the methodology for the PCs electrophysiological recordings as well as the eye movement measurements of wild-type and mutant mice undergoing phase-reversal training. We then present a minimal model that only considers learning at the GC–PC synapses and neglects INs. This minimal model is faithful at reproducing the behavior of the wild-type and has the advantage of being simple enough to treat it analytically. It, however, fails to describe the electrophysiological data and the behavior of the mutant mice. We therefore present a detailed model that includes INs and learning at the MF to MVN synapses. This detailed model qualitatively captures all experimental data shown in this paper, allowing a mechanistic understanding, and making experimentally testable predictions.
Mouse lines
All experiments involving transgenic and wild-type mice were approved in advance by the local animal welfare committee (Erasmus MC, Rotterdam, The Netherlands) in accordance with Dutch and European legislation and guidelines (2010/63/EU).
C57BL/6 mice (wild-type).
The C57BL/6 adult, male mice were used for in vivo electrophysiology and eye movement experiments. Naive mice (n = 8) were directly used for in vivo electrophysiology experiments aimed at measuring PC activity during the VOR in untrained animals. Another group of C57BL/6 male mice (n = 6) were first subjected to eye movement measurements, in particular the reversal training (described below), and subsequently used for the in vivo measurements to assess the learning-induced changes in the patterns of PC activity.
PC-Δγ2 mice.
The γ2I77lox mice were generated by flanking exon 4 of the GABAA receptor γ2-subunit gene with loxP sites. Homozygous γ2I77lox mice were crossed with mice heterozygous for γ2I77lox and hemizygous for an L7Cre transgene. Littermates of the following genotypes were used: γ2I77lox/γ2I77lox/L7Cre (PC-Δγ2; n = 9) and γI77lox/γI77lox (controls; n = 10). Only adult males were used for the eye movement recordings (Wulff et al., 2009). The γ2-subunit is required to target the receptors to the postsynaptic membrane (Schweizer et al., 2003). Thus, the PC-specific ablation of the γ2-subunit of the GABAA receptor results in a loss of synaptic GABAA receptors, effectively removing the inhibition of molecular layer INs on PCs, which is normally mediated by that pathway.
GC-ΔKCC2.
The GC-specific deletion of the potassium chloride cotransporter was achieved by crossing the Kcc2lox/lox mice [created by using a partial genomic clone of murine Kcc2 gene (Slc12a5), which was isolated from a 129/Sv mouse genomic library in λFixII (Stratagene) and an insertion of a loxP site into intron 5, and a neomycin resistance (NEO) cassette flanked by loxP sites into intron 1; after electroporation into R1 ES cells, the NEO cassette was removed from correctly targeted clones by transfection with a plasmid-expressing Cre recombinase] with Δα6::Cre mice. Animals were kept on a mixed genetic background and littermates were used as controls. Only adult males were used for the eye movement recordings (Seja et al., 2012). The deletion of the KCC2 cotransporter from the GCs surprisingly did not abolish a slight depolarization of those cells in response to GABA. Thorough studies showed that the GCs respond to the loss of the KCC2 with an increase in excitability. The constitutive depolarization upon KCC2 disruption makes GCs more excitable by lowering the spiking threshold, and possibly additionally by partially releasing the Mg2+ block of their NMDA receptors, which leads to the potentiation of intrinsic excitability of GCs. Conversely, the NMDA receptors are implicated in the induction of presynaptic long-term potentiation at the MF to GC synapse (D'Angelo et al., 1999). Thus, multiple sites of plasticity at the GC level are probably affected in GC-ΔKCC2 mice and, as a consequence, their GCs are more excitable and produce additional spikes causing motor learning deficits (Seja et al., 2012).
In vivo electrophysiology
Fourteen Male C57BL/6 (wild-type) mice (8–24 weeks old) were surgically prepared under general anesthesia with isoflurane/O2. A pedestal with two nuts was attached to the frontal and parietal bones using Optibond (Kerr) and Charisma (Heraeus Kulzer). After that procedure the occipital bones were exposed and a craniotomy was made in the left occipital bone. An acrylic cement chamber was built around the craniotomy and the chamber was sealed with bone wax. The temperature of the animal and the depth of the anesthesia were constantly monitored, and if necessary, the mice received analgesic treatment after the surgery (temgesic/buprenophine 0.015 mg/kg, s.c.). After 2 d of recovery mice were head fixed in a restrainer fixed onto a turntable (diameter 60 cm) surrounded by a random-dotted cylindrical screen (diameter 63 cm). Borosilicate glass electrodes (2 m tip) filled with 2 m NaCl solution were lowered into the flocculus of the cerebellum. PC extracellular signals were identified by their complex-spike responses. Single-unit activity was confirmed by a pause in simple-spike firing following each CS (CF pause; De Zeeuw et al., 1995). Cells were isolated according to their optimal responses to stimulation around the vertical axis (VA). A short optokinetic stimulus (<60 s) was used to confirm the classification of the selected PCs. Only cells that responded optimally to stimulation around the VA were used in this study. Afterward cells were recorded during vestibular stimulation at 0.6 Hz and amplitude of 5 degrees. Signals were filtered, amplified (CyberAmp 380, Molecular Devices), digitized (Power 1401; CED), and stored for off-line analysis. The signals from the floccular PCs were collected from the naive animals (n = 8; n of PCs = 14) and from mice subjected to the phase-reversal learning paradigm (n = 6, n of PCs = 12) described below. Since the mice used in the eye movement study already had a pedestal used for the head fixation, the surgery was restricted to placing the craniotomy in the occipital bone. It should be noted that, with the exception of the exposure to short optokinetic stimulation, the animals subjected to the eye movement training were kept in the dark during the experiments to prevent loss of the acquired phase adaptation. Moreover, during the relocation to and from the operating room, where the craniotomy was made, mice were anesthetized in the dark and their eyes covered with a thick layer of Duratears (before the transition). The naive animals received one training session (1 h in the restrainer) before experiments to habituate to the experimental settings, but since the trained animals were accustomed to the setup they were used directly for electrophysiology without additional habituation. After the experiments the animals were killed by cervical dislocation under isoflurane anesthesia.
Eye movement recordings
Mice (8–24 weeks old) were surgically prepared under general isoflurane anesthesia by mounting a pedestal as described above. All mice used in the behavioral studies were males. Three different strains of mice were subjected to the eye movement experiments (see above, Mouse lines). After 2 d of recovery mice were placed in a restrainer with the pedestal fixed to a metal bar. The restrainer was fixed onto the turntable, which was surrounded by a cylindrical screen (diameter 63 cm) with a random-dotted pattern surrounding the turntable (diameter 60 cm). Before experiments the animals received one training session (1 h in the restrainer) to habituate to the experimental settings. Eye movements [opto-kinetic-reflex (OKR) and visual VOR in the light (V)VOR] were evoked by rotating the screen and/or turntable at different frequencies (Ac servo-motors; Harmonic Drive). The positions of table and drum were recorded by potentiometers and stored for off-line analysis. Eye movements were recorded, as previously described (Stahl et al., 2000; van Alphen et al., 2001), using an infrared CCD camera fixed to the turntable (240 Hz; ISCAN). Two table-fixed infrared emitters (maximum output 600 mW, dispersion angle 7°, peak wavelength 880 nm) illuminated the eye during the recording, and a third emitter was aligned horizontally with the camera's optical axis so as to produce a corneal reflection. The eye movement calibrations were computed as previously described (van Alphen et al., 2001), and subsequently the mice were submitted to baseline measurements and training sessions for 5 consecutive days. Phase reversal of the eye movement during the VOR was achieved by applying an in-phase stimulation on day 1, which was aimed at reducing the gain of the eye movements by subjecting the mice to 5 × 10 min periods of sinusoidal in-phase drum and table rotation at 0.6 Hz (both with an amplitude of 5°), and subsequently reversing the phase on days 2, 3, 4, and 5 by subjecting the animals to 5 × 10 min periods of sinusoidal in-phase drum and table rotation at 0.6 Hz, but with drum amplitudes of 7.5° (days 2) and 10° (days 3, 4, and 5), while the amplitude of the turntable remained 5°. The animals were kept in the dark in between all recording days. After the experiments the animals were killed by cervical dislocation under isoflurane anesthesia with the exception of those that were used for the electrophysiological recordings. Gain and phase values of the eye movements were measured in the dark and were calculated off-line using custom-made MATLAB routines (The MathWorks; Goossens et al., 2004; Hoebeek et al., 2005).
Minimal model
Definition of the minimal model.
In the minimal model, the MF activity M(t) encodes the head movement that follows the turntable (Lisberger and Fuchs, 1978; Arenz et al., 2008), which moves sinusoidally in time,
This is a simplification (Gerrits et al., 1989; Cheron et al., 1996). The GCs are assumed to respond to MF inputs with phase shifts that are uniformly distributed (Barmack and Yakhnitsa, 2008). The activity of GCs with phase shift x, G(x, t) are, therefore,
with x uniformly distributed between 0 and 2π. The PC activity P(t) is modeled as the weighted sum of the GC activities G(x),
 |
where wPG(x) denotes the synaptic weights from a GC with a phase shift x to PCs. The MVN cells receive synaptic excitation from MFs and inhibition from PCs, and their activity V(t) is simply
The eye movement is taken to be proportional to (−V).
In VOR adaptation experiments, the eyes have to follow a visual target to minimize the retinal slip. We therefore define a target MVN activity Vt, which has a target gain gt and a target phase shift φt, i.e.,
The standard VOR experiment correspond to gt = 1, φt = 0. In standard VOR adaptation experiments, gt is set to a value which is ≠ 1. Typical values are gt = 2 (gain increase, i.e., target moving in the opposite direction as the turntable), gt = 0 (gain decrease, i.e., target moving together with the turntable), or gt = −1 (or equivalently gt = 1, φt = π, i.e., target moving in the same direction but faster than the turntable) (Fig. 1B).
Figure 1.

A, VOR circuit. The MFs encode the head velocity. They project onto the GCs and to the MVN. The GCs project onto the PCs and onto the molecular INs, which in turn inhibit PCs. PCs receive excitatory inputs from CFs, which encode the error coming with a delay. Finally MVNs are inhibited by PCs and are responsible for the eye movement. In the model, we consider two plasticity sites: (1) the synaptic weights wPG from GCs to PCs at which depression is induced by costimulation of GCs and CFs, whereas stimulation of GCs alone produces potentiation and (2) synaptic weights wVM from MFs onto MVN where under MF and PC coactivation or co-inactivation depression is induced, whereas potentiation is due to sole activation of MF or PC. When the animal is placed on a turntable, MF is a cosine waveform since it encodes the head velocity. GCs, INS, and CFs are modulated in-phase with the head movement, whereas the PC is modulated in anti-phase. Since MVN is also modulated in-phase, and is mainly inhibitory, the eye movement is the inverse of the head movement, producing the VOR. In the case of the inhibitory knock-out mice, PC-Δγ2, PCs do not receive inhibition, and in the case of the GC mutant, GC-ΔKCC2, GC excitability is increased. B, VOR learning task. The mice are placed on a turntable. If the visual field is fixed, the target gain gt corresponds to 1. If the visual field turns with the table, gt = 0, and if the visual field turns twice the distance as the turn table, gt = −1, which corresponds to a phase-reversal learning.
In the minimal model, GC to PC synapses are plastic. Their efficacy wPG(x) follows the simple first-order differential equation,
where τPG is the learning time constant, V(t − δ) − Vt(t − δ) is the “error signal” and δ is the delay in the error. The delay time can be interpreted as the sum of the feedback time and the potential phase shift of the MVNs (De Zeeuw et al., 1995). The parameter τPG controls the speed of learning and is set to 15 min to reach a gain decrease of about 0.5 in the first training session. Note that in the absence of delay, this rule would minimize the error via gradient descent. It is in qualitative agreement with experimental data on plasticity at GC to PC synapses (Ito, 1989; Jörntell and Hansel, 2006; Gao et al., 2012), where CF and GC costimulation leads to depression, and GC stimulation alone leads to potentiation. Indeed, if C is written as a baseline νCF plus the delayed error signal (Marr, 1969; Albus, 1971; Soetedjo et al., 2008), C(t) = νCF − V(t − δ) + Vt(t − δ), then the learning rule can be rewritten as τPGẇPG(x) = [νCF − C(t)] G(x, t).
Dynamics of VOR adaptation in the minimal model.
To solve the dynamics analytically, we define
 |
Assuming that the timescales of the dynamics of the weights are much longer than the period of the oscillatory drive T, τPG ≫ T, the dynamics of the GC to PC weights can be expressed in terms of these two variables as follows:
 |
The gain g and phase shift φ of the motor output are as follows:
 |
Then, on timescales ∼ τPG, wc and ws converge toward their equilibrium values, wc = 1 − gt cos(φt), ws = gt sin(φt). This convergence is described by the following equations:
 |
 |
In the case φt = 0, wc goes to 1 − gt.
Reproducing the Wulff et al., 2009 protocol.
Equations 8 and 10 are solved for 200 min, which reproduces the phase-reversal training protocol (Wulff et al., 2009). During the first 50 min, the target gain is set to gt = 0. During the next 50 min the target gain is gt = −0.5, and the last 100 min the target gain is set to gt = −1. The dark times are not simulated. The learning rate τPG is set to 15 min, to qualitatively match the learning speed of the animal.
Detailed model
Dynamics of activity variables.
The MFs encode the head velocity (Arenz et al., 2008) according to the equation
 |
where and T = 1666 ms is the period of the rotation of the turntable (0.6 Hz; Fig. 1A).
The GC network is composed of N = 100 GCs, whose activity is driven by the MFs, but with a different phase shift for each cell. We also performed simulations with a larger number of GCs (N = 1666) with no noticeable difference. The distribution of phase shifts is such that there is a bias toward the phase of the MF inputs (Barmack and Yakhnitsa, 2008). The activity of GC i, Gi(t) can be written as follows:
 |
for i = 1,…, N, where G1 = 1 (for the wild-type mice), G0 = 1 and
 |
where α = 0.19.
The activity of the molecular interneuronal network is described by a single variable I(t), which is proportional to the average activity in the GC network as follows:
 |
where I0 = wIGG0 − 0.85 is an inhibitory term and wIG = 2.5 measures the strength of the synaptic weight from GCs. As a result of this parameter choice, I(t) is more modulated in phase with ipsiversive head movements than GC activity. This assumption is critical to reproduce the modulation profile of SSs of the PCs shown in Figure 2.
Figure 2.

Experimental results of the phase-reversal training. A, Gain as a function of training time (green, wild-type; blue, inhibitory knock-out PC-Δγ2, data redrawn from Wulff et al., 2009; red, GC mutant GC-ΔKCC2, data redrawn from Seja et al., 2012) of VORD (VOR in the dark; i.e., training is done in the light and eye measurement is done in the dark). The gain is relative to the initial gain. B, Phase as a function of training time of VORD. C, SS measurement during the VOR in the dark before training (black) and 3 d after training (gray). Outside the training periods the animals are kept in the dark. Left, SS peak-to-peak amplitude of the firing rate modulation. Middle, SS mean firing rate. Right, phase of the SS compared with the head movement velocity phase (*p < 0.05 t test). D, Same as C, except for the CSs.
The activity of the PC network depends on both, direct excitation from GCs, and feedforward inhibition from INs, i.e.,
 |
where wPGi are the weights from GC Gi to PC and wPI = 1 (in the case of the wild-type) is the weight from IN to PC.
Note that in this model, for the sake of simplicity, PCs receive purely vestibular information. PCs do not receive any visual information, and thus the model cannot produce an OKR. Adding fixed visual inputs to PCs (proportional to a retinal slip) to account for an imperfect OKR leads to results similar to those shown in this paper (data not shown).
The activity in MVN is described by two variables, VE and VI, representing the excitatory and inhibitory populations in that structure (Shin et al., 2011). Both variables depends on the excitatory input from MF and VE depends also on the inhibitory input from PC, i.e.,
where wVM(t), are the excitatory weights from MF to excitatory/inhibitory MVN populations, and VE0 = 2.25. The motor command is assumed to be proportional to the difference between VE(t) and VI(t),
since both excitatory and inhibitory neurons project to oculomotor motor neurons (Shin et al., 2011).
The target motor command, Vt, i.e., command that would lead to an output with the target gain gt, is defined as follows:
 |
 |
where Vt0 = 1.
The CF activity C(t) is assumed to be weakly modulated by head movement in the dark (De Zeeuw et al., 1995) and, when light is present, by contraversive retinal slip (the error signal), V(t − δ) − Vt(t − δ), where δ is the delay in this error signal. C(t) can be written as follows:
 |
where L = 1, 0 in light/dark conditions, νCF is the baseline firing rate of C, and H = 0.03 is the modulation by head movement. The assumption that C is modulated in-phase with the head movement is important to reproduce the temporal modulation of CSs of the PCs shown in Figure 2. Experimentally, it is extremely hard to directly assess whether the modulation of the CF comes from the eyes or from the head (one would have to find a way to acutely block the signals coming to the inferior olive from either the eye or the head exclusively during the dark periods to be certain of the origin of the CF signals, which to this date has not been achieved). However, CF is more likely to be attributed to the head modulation, since CSs change very little after learning (Fig. 2), but the change of the eye movements is substantial.
Dynamics of synaptic weights.
There are two learning sites, one at the GC to PC synapses and one at the MF to VE synapses. The plasticity at the GC to PC synapse is described by the following expression,
 |
where ξ is white noise with zero mean and unit variance density, σ = 0.02 is the amplitude of the noise, and αPG = 3.5 · 10−5 ms−1 is the learning rate. All synaptic weights have an upper bound at 2.85 and a lower bound at 0.85, consistent with experimental data on LTP/LTD, showing a limited range of synaptic efficacies (Le Guen and De Zeeuw, 2010; van Beugen et al., 2013). Finally, the weights slowly decay to their initial value wPGini = 1.85 with a slow decay rate αd = 4.5 · 10−6 ms−1. As already mentioned for the minimal model, the weight update is in good agreement with the plasticity seen experimentally at the GC to PC synapses, i.e., potentiation under GC stimulation and depression under CF and GC costimulation (Ito, 1989; Jörntell and Hansel, 2006; Gao et al., 2012).
Note that the model can be set up such that the lower bound of GC to PC synaptic weights is at zero, so that a significant fraction of weights are zero, consistent with Isope and Barbour (2002) and Brunel et al. (2004). With this parameter choice, other parameters of the model have to be modified in order for the model to reproduce the data (see below).
The synaptic weight from MF to VE, wVM, is decreased when MF and PC are coactive or co-inactive and increased if one of the two is active. This plasticity was observed experimentally in Menzies et al. (2010). It can be written as follows:
where αVM = 5.6 · 10−6 ms−1 is the learning rate and Pini(t) is P(t) before training. There is a hard lower bound at 0. The weight is initialized to wVMini = 0.88 so that V produces a gain of 1. Indeed, since PC is initially modulated with the head movement already, wVMini needs to be smaller than 1, to obtain a gain of 1. In the model, plasticity (Eqs. 23–24) is present all the time, irrespectively of whether it is dark or light.
Detailed model adapted for the mutant mice.
In the case of the inhibitory knock-out model (PC-Δγ2; Wulff et al., 2009), we remove the inhibition onto PC and therefore set wPI = 0 (Fig. 1A). To have the same Pini as the wild-type, we set wPGini = 1, and for V to have an initial gain of 1, we set wVMini = 1.19.
In the case of the GC mutant (GC-ΔKCC2; Seja et al., 2012), we increase the excitability of GC and therefore set G0 = 1.8 (Fig. 1A). To have the same Pini as the wild-type, we set wPGini = 1.85, and for V to have an initial gain of 1, we set wVMini = 0.7.
Simulation protocol of the detailed model and parameter setting.
The detailed model was used to reproduce the phase-reversal learning task (Wulff et al., 2009) (Fig. 1B). The table rotates at 0.6 Hz. Before the learning protocol, an initialization phase is performed: the model is simulated for 50 cycles with a target gain of 1, gt = 1, followed by two nights in the dark, i.e., 2880 cycles. Then the phase-reversal learning task starts. For the first 50 cycles, the target gain is set to gt = 0 (day 1 training), then 1440 cycles with no retinal slip (corresponding to the first night), then 50 cycles at gt = −0.5 (day 2), then 1440 cycles without retinal slip (night 2), then 50 cycles at gt = −1 (day 3), then 1440 without retinal slip (night 3), then 50 cycles at gt = −1 (day 4), and then three times 1440 cycles without retinal slip (corresponding to 3 d where the animals are kept in the dark). In the numerical simulations, Equations 23–24 are integrated with a time step of dt = 1 ms. Weight changes are updated in a batch manner at the end of every cycle.
The parameters are chosen according to the following procedure. First, since αPG controls the speed of learning, it is set so that the gain is decreased to about 0.5 during the first day of training. Second, the decay rate αd is chosen so that at the end of each night, wPG, are back to baseline. Third, the learning rate αVM is chosen so that almost all the memory is transferred after every night, but not all, as seen experimentally in the wild-type. Finally, the noise σ = 0.02 is set to reproduce the qualitative amount of forgetting of PC-Δγ2 during the first night. All the other parameters were kept fixed.
When the lower bound of GC→PC weights is set at zero, other parameters of the model have to be changed for the model to reproduce the experimental data. Basically, the mean GC to PC weights need to be sufficiently close to the lower bound, once the inhibition onto PCs is removed (for PC-Δγ2) or once the GC excitability is increased (for GC-ΔKcc2). Thus, in this case we increased inhibition (IN) in the wild-type case, and increased GC excitability in the GC-ΔKcc2 case. Both effects lower the mean GC to PC weights in the case of the mutant mice, so that the weights hit the bound at zero during learning. The simulations with these parameters give similar results as shown in this paper, but develop silent (zero weight) synapses (data not shown).
The detailed model will be posted on ModelDB (https://senselab.med.yale.edu/modeldb).
Results
VOR learning is one of the most commonly used tasks to study cerebellar learning. It is a reflexive eye movement that stabilizes images on the retina during head movement by producing an eye movement in the opposite direction. With a stable visual surrounding in the light, the eye movement compensates the head movement (visually enhanced VOR gain = 1). If the visual image is not still, for example, due to eye muscle weakness, the VOR is adapted. To study this effect in a controlled setting, mice are fixed to a turntable that rotates. Their visual field can also be rotated, leading to VOR adaptation (Fig. 1B). If the visual field rotates together with the turntable, the target VOR gain is 0. If the visual field rotates at double the speed of the turntable, the target VOR gain is −1 (phase reversal, or eye movement in the opposite direction as in the normal situation).
In this paper, we first review already published experimental results of the VOR adaptation for three types of mice: wild-types and two cell-specific mutant mice (Wulff et al., 2009; Seja et al., 2012). Additionally, for the wild-type mice, we present novel electrophysiological recordings of PCs, before and after learning. Based on both experimental and theoretical data we introduce a minimal model that accurately reflects the learning behavior. The minimal model is appealing in its analytical tractability, but it fails to reproduce electrophysiological data in wild-type mice, and behavioral data in the mutant mice. Therefore we extended the minimal model to a more detailed one that reproduces both behavioral and electrophysiological results. The detailed model makes a number of experimentally testable predictions that will be discussed below.
Experimental results: behavior and electrophysiology
On day 1, mice undergo a 50 min gain-decrease training, with target VOR gain of 0. In between the training sessions, the animals are kept in the dark. On day 2, the animals undergo another 50 min training with a target gain of gt = −0.5. On days 3 and 4, there is a 50 min training with target gain gt = −1 (phase reversal). We show here behavioral data that have already been published (Wulff et al., 2009; Seja et al., 2012). We use wild-type mice and two mutant mouse lines. The inhibitory knock-out mouse (PC-Δγ2) is missing inhibition onto PC (Wulff et al., 2009, their Materials and Methods and Results). The GC mutant (GC-ΔKCC2) has an increased GC excitability (Seja et al., 2012, their Materials and Methods and Results). The gain and the phase of the eye movement is measured in the dark, and is shown on Figure 2A and B. For the wild-type, the gain decreases during the first day, and during the three following days the phase slowly reverses to 180 degrees. The gain increases again toward the end of training (Wulff et al., 2009). In the light ((V)VOR), the animal has a gain of above 0.9, as seen in Galliano et al. (2013), their Figure 4G; in Wulff et al. (2009), their Fig. S5C; and in Seja et al. (2012), their Fig. 8C. The two mutant mice have similar qualitative behaviors during baseline motor performance and gain decrease learning, but they differ from wild-type mice in that (1) they forget their training during the first night and (2) they can never learn the phase-reversal training.
Figure 4.
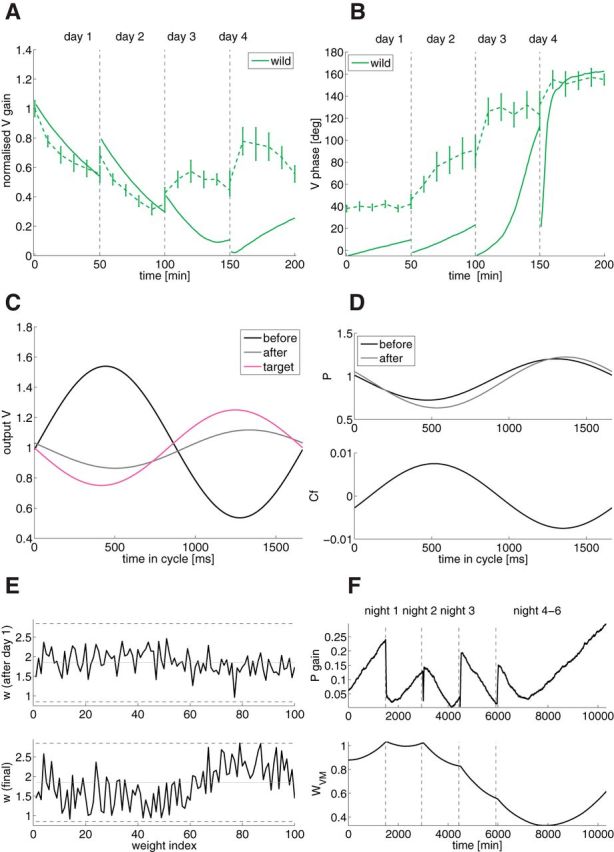
Detailed model for the wild-type mice learning the phase-reversal scenario. A, Gain as a function of training time (solid, model; dashed, experiments). B, Phase as a function of training time. C, Output V as a function of time in the cycle (black, initial value before learning; gray, final value after learning; magenta, target value). D, Top, PC SS activity P as a function of time in the cycle (black, initial value before learning; gray, after training). Bottom, CF as a function of time in the cycle in the dark. E, GC to PC weights as a function of weight index after the first day of training (top) and after the whole training (bottom). Dashed lines are the upper and lower bounds, the gray line is the initial weight. The weights are sorted by GC phase. F, Top, Gain evolution of PC as a signature of wPG plasticity across time. Bottom, wV M evolution across time.
To understand better the role of PCs in VOR adaptation training, we performed electrophysiological recordings in the wild-type mice before and after the phase-reversal training. We recorded SSs and CSs during the VOR in the dark (Fig. 2C,D). SSs are modulated in anti-phase compared with the head movement in naive animals (n = 8, n of PC = 14), and this anti-phase modulation persists after phase-reversal (n = 6; n of PC = 12) training. There is a slight, but significant, increase in the SS peak-to-peak modulation amplitude as well as in mean firing rate pointing toward the relevance of LTP (Gao et al., 2012). CSs are modulated in-phase with the head movement, and are also qualitatively similar before and after training. There is a slight decrease of the CS peak-to-peak modulation amplitude.
To better understand these experimental findings, we turned to a detailed investigation of models of the cerebellar circuits underlying VOR adaptation (Fig. 1A). We started with a minimal model that implements the standard Marr–Albus–Ito hypothesis (Marr, 1969; Albus, 1971; Fujita, 1982; Ito, 1989; Raymond and Lisberger, 1998). We showed that this model allows us to reproduce the behavioral results in wild-type mice, but falls short in reproducing the electrophysiological data in wild-type mice, and the behavioral data in mutant animals. We therefore turned to a more detailed model that includes plasticity in the MVN, feedforward inhibition to PCs, and bounded synaptic weights. We find that this detailed model reproduces qualitatively all available behavioral and electrophysiological data.
Minimal model
The minimal model consists of a simplified cerebellar circuit. The MF firing rates encode head velocity. They project both to the GCs and MVNs. GCs are modeled as cosine waveforms with the same period as the turntable, but different phases between 0 and 2π. The PC activity is modeled as the weighted sum of GCs. The CFs, projecting onto the PC, encode the retinal slip, defined as the movement of the visual image. More precisely, the CF's activation encodes an error signal, namely the difference between the actual eye movement and the target eye movement. This error comes with a delay δ. Finally, PC activity inhibits the MVN neurons.
The GC to PC synapses wPG are plastic. They are potentiated when the presynaptic GC is active and CF is inactive, and depressed under CF and GC coactivation (Coesmans et al., 2004; Belmeguenai et al., 2010). This plasticity rule is designed to reduce the error signal in the absence of delay. It is in qualitative agreement with plasticity found experimentally at the GC to PC synapses (Jörntell and Hansel, 2006; Gao et al., 2012). A protocol pairing CF and GC induces depression, whereas stimulating GC alone produces potentiation.
The model reproduces the wild-type mice behavior under VOR adaptation. As a simplifying assumption, we do not model the dark period in-between the training sessions. Figure 3A shows the gain as a function of training time. As observed experimentally (Fig. 2A), the gain decreases to about 0.5 on day 1, and increases again toward the end of the training. Figure 3B shows the phase evolution of the eye movement compared with the head movement. As shown analytically (see Materials and Methods, Minimal model), delay in the error transmitted by the CF, causes a smooth phase reversal from 0 to 180 deg. Without delay, the phase reversal is abrupt (Fig. 3B, blue line). The steepness of phase reversal directly reflects the delay in the error signal. A 100 ms delay matches the steepness seen experimentally, and happens to coincide with the expected time delay of the error feedback (Waespe and Henn, 1987; Wetmore et al., 2014). Figure 3, C and D, shows a simulation of the same training protocol, but with different frequencies of the turntable. At the end of day 1, the gain increases with increasing frequency, as shown previously (Wulff et al., 2009, their Fig. 4C, top). The steepness increase depends on the delay, and again, a delay of 100 ms best reproduces the experimental results (0, 50, 100, and 200 ms were tried). Fig. 3D shows that the phase before day 2 increases with increasing frequency, whereas the phase after day 2 decreases with increasing frequency. Again, these behaviors reproduce qualitatively experimental data (Wulff et al., 2009, their Fig. 4C, bottom).
Figure 3.

Minimal model learning a phase-reversal scenario. A, Gain as a function of training time for the minimal model with four different delays in the CF, from 0 to 200 ms (different colors). The behavioral experimental data of Figure 2 is superimposed in dashed green. B, Phase as a function of training time. C, Gain before (dashed line) and after (solid line) the first day of training as a function of frequency for different delays in the CF (different colors). D, Phase before (dashed line) and after (solid) the second day of training as a function of frequency for different delays in the CF (different colors).
We conclude that the minimal model accurately accounts for the learning behavior of the wild-type mice. It only takes into account one learning site, the GC to PC synapses, and thus PC changes must account fully for the learning. However, the electrophysiological data shows very little change in PC firing modulation (Fig. 2), at odds with the prediction of this model. This suggests the necessity to include at least one additional plasticity site. Moreover, these results are inconsistent with the mutant behavioral data, since the model does not include inhibition onto PCs, and increasing the excitability of GCs does not modify the dynamics of the model. For these reasons, the next section introduces a detailed model of cerebellar learning, which takes into account synaptic plasticity at the MF to MVN site (Miles and Lisberger, 1981; McElvain et al., 2010; Menzies et al., 2010). In addition, we also include molecular layer INs and bounds on synaptic weights to be able to capture learning impairments of the mutant mice.
Detailed model
Similarly to the minimal model, MFs encode the head velocity and GCs are modeled as cosine waveforms (Fig. 1A). However, the GC phases are distributed nonuniformly and phases close to the head movement phase are over-represented, consistent with experimental data (Barmack and Yakhnitsa, 2008). We model the molecular INs as the weighted sum of GCs. The GC to IN weights are chosen such that the IN is also modulated with the head movement, and more so than the GC. PC is the weighted sum of GC and IN. Since IN is more modulated with ipsiversive head movement than GC, PC in turn is modulated in anti-phase with the head movement, as seen experimentally (Fig. 2C; Barmack and Yakhnitsa, 2008). The CF input encodes the retinal slip coming with 100 ms delay. Its activity also depends on the head movement (modulated in-phase), matching our experimental findings (Fig. 2D) and consistent with previous studies (Barmack and Yakhnitsa, 2008; Badura et al., 2013). Because of learning at the GC to PC synapses, the modulation of CF (Fig. 2D, bottom) is in anti-phase with the modulation of PC (Fig. 2D, top). Finally, MVN receives inhibition from PCs and excitation from MFs.
In the detailed model, we consider two plasticity sites. This first one, as in the minimal model, is at the GC to PC synapses. The plasticity rule is described by Equation 23 (see Materials and Methods). It has three additional features compared with the minimal model: (1) it includes a noise term, (2) weights decay back to their initial value wPGini with a decay rate αd; (3) synaptic weights have hard lower and upper bounds.
The second plasticity site is at the wVM synapses, and is described by Equation 24 (see Materials and Methods), with a hard bound at zero. The rule produces depression if MFs and PCs are coactive or co-inactive, and potentiation if MF or PC is active alone. The learning rate αDM is set such that learning takes place first at the GC to PC synapse, and then memory is transferred to the MF to MVN synapse. This memory transfer can be interpreted as memory consolidation (Miles and Lisberger, 1981; Porrill and Dean, 2007).
Learning dynamics in the “wild-type” model
The detailed model reproduces VOR learning performed by the wild-type mice. It takes into account the dark time in between training sessions. Figure 4, A and B, shows the gain and phase evolution during learning. As already captured by the minimal model, the behavior is in good agreement with the experimental data (Fig. 2). Fig. 4E, top, shows that learning occurs first at the GC to PC synapses wPG: the wPG synapses from those GCs whose phases are similar to the head movement phase are potentiated, whereas the synapses from those GCs whose phases are opposite are depressed. At the end of training, after a couple of days in the dark (Fig. 4E, bottom), most of the memory is transferred to the wVM synapses (Fig. 4D, top). We observe a slight gain forgetting during the night (Fig. 4A), as seen experimentally. Figure 4F shows the gain evolution of P as a signature of wPG plasticity (top), and wVM evolution (bottom). This illustrates the slow transfer from wPG to wVM. Forgetting is due to the incomplete memory transfer from wPG to wVM, since the wPG are decaying slightly faster than the wVM are learning. Again, smooth phase-reversal learning is due to the 100 ms delay in the error. Figure 4C shows that the final V is close to its target Vt. Without adaptation protocol, the model has a stable gain of 1. The model cannot learn if only wVM is plastic, but wPG plasticity is necessary, because the error signal is present only at those synapses. For example, if we remove wPG plasticity, a gain decrease protocol cannot be learnt.
Contrary to the minimal model, the results of the detailed model are in agreement with the SS and CS activity before and after reversal training, measured during the VOR in the dark. As seen in Fig. 4D, the PCs are modulated in anti-phase with the head movement, before and after training. This is due to the over-representation of phases similar to the head movement phase, in GC and even more so in IN and to the fact that CF is in phase with the head movement. Moreover, the increase in peak-to-peak amplitude of the SS modulation after training is consistent with the electrophysiological recordings (Fig. 2C). This increase is due to the fact, that CF is modulated in the dark (Figs. 2D, 4D, bottom), therefore producing a very slow learning that modulates wPG, seen after a long period in the dark (3 d). CF is modulated by the head movement, which leads to an in-phase CF modulation, seen in Fig. 4D, bottom, and experimentally in the CS (Fig. 2D).
The comparison of the model and the experimental data shown in Figure 4, A and B, shows an overall good agreement. However, we emphasize that the match is not perfect. (1) The phase shift of the model starts at zero, whereas in experiments it starts at about 40 degrees. This might be due to the poor vision of the animal (see Discussion). (2) While the final values for gain and phase in the model are very close to the data, and the initial dynamics during days 1 and 2 is also very well reproduced by the model, the dynamics on days 3 and 4 are noticeably different. These differences might stem either from the fact that the model is too simplified or from a large variability in behavior across animals (compare the control in (Wulff et al., 2009, their Fig. 6g and Seja et al., 2012, their Figure 8f).
Figure 6.
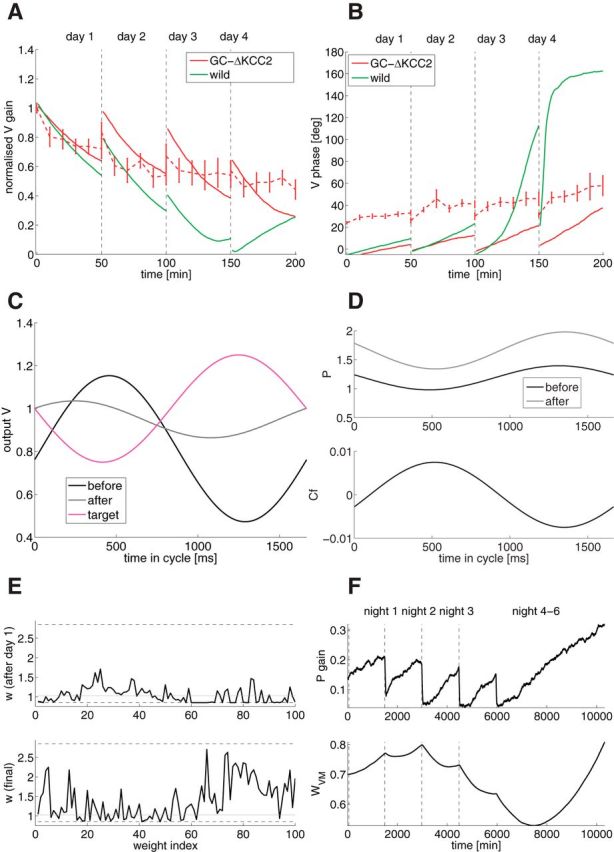
GC mutant model (model of GC-ΔKCC2 mice; Seja et al., 2012), learning the phase-reversal scenario. A, Gain as a function of training time (red, GC-ΔKCC2; solid, model; dashed, experiments; green, wild-type model). B, Phase as a function of training time. C, Output V of GC-ΔKCC2 as a function of time in the cycle (black, initial value before learning; gray, final value after learning; magenta, target value). D, Top, PC SS activity P of GC-ΔKCC2 as a function of time in the cycle (black, initial value before learning; gray, after training). Bottom, CF of GC-ΔKCC2 as a function of time in the cycle in the dark. E, GC to PC weights of GC-ΔKCC2 as a function of weight index after the first day of training (top) and after the whole training (bottom). Dashed lines are the upper and lower bounds; the gray line is the initial weight. The weights are sorted by GC phase. F, Top, Gain evolution of PC as a signature of wPG plasticity across time. Bottom, wV M evolution.
In the detailed model described above, PCs receive purely vestibular inputs, and therefore cannot produce an OKR. However, for the sake of completeness, we extended this model so that the PCs also receive fixed visual inputs (proportional to a retinal slip). The extended model accounts for an imperfect OKR (which accurately depicts poor visual acuity of mice) and leads to qualitative similar results as the ones with the detailed model (data not shown).
Learning dynamics in the inhibitory knock-out (PC-Δγ2)
To accommodate data obtained from the PC-specific inhibitory mutant mice (PC-Δγ2, i.e., no inhibition onto PCs (Wulff et al., 2009), we have adapted our model by removing inhibition onto PC (Fig. 1A). In the absence of a compensatory mechanism, PCs of the mutant mice would have a much larger firing rate than those of a wild-type. Experimental data show that this is not the case (Wulff et al., 2009). Hence, a compensatory mechanism must exist. In our model, we choose a smaller average GC→PC synaptic weights wPG for the PC-Δγ2 than for the wild-type, which is consistent with data (Wulff et al., 2009). We show now that this compensation, together with bounds on synaptic weights, is sufficient to account for all the behavioral impairments of the PC-Δγ2 mice.
Figure 5, A and B, shows the gain and phase evolution of eye movement of the PC-Δγ2 mice during reversal training. The gain decrease learning during day 1 is not impaired. During the night, however, PC-Δγ2 mice forget what they have learned. As shown in Figure 5E, top, the GC–PC synaptic weights wPG after day 1 are modulated. Because of their lower average, the weights are close to or at the lower bound. During the dark, the CFs do not encode the retinal slip anymore. The noise makes the weights wPG undergo random potentiation and depression. The weights that are far from the bounds undergo about the same amount of potentiation and depression, so that the net change is approximately zero. However, the weights closer to the bound (corresponding to the weights from the GCs whose phases are opposite to phase of the head movement) cannot undergo depression, because they cannot cross the lower bound. Those weights will in average undergo a net potentiation. This potentiation bias causes wPG to forget faster than wVM can learn, and therefore no memory consolidation can take place.
Figure 5.
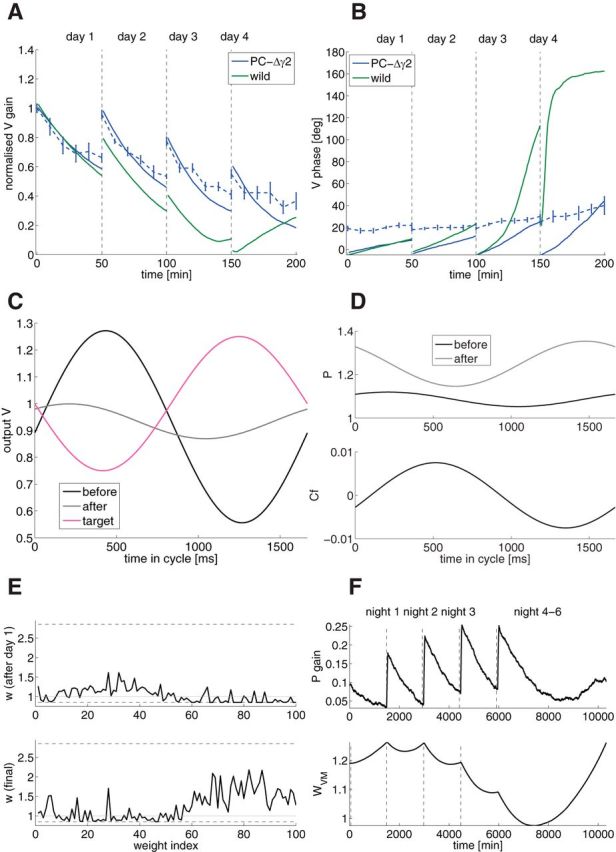
Inhibitory knock-out model (model of PC-Δγ2 mice; Wulff et al., 2009), learning the phase-reversal scenario. A, Gain as a function of training time (blue, PC-Δγ2; solid, model; dashed, experiments; green, wild-type model). B, Phase as a function of training time. C, Output V of PC-Δγ2 as a function of time in the cycle (black, initial value before learning; gray, final value after learning; magenta, target value). D, Top, PC SS activity P of PC-Δγ2 as a function of time in the cycle (black, initial value before learning; gray, after training). Bottom, CF of PC-Δγ2 as a function of time in the cycle in the dark. E, GC to PC weights of PC-Δγ2 as a function of weight index after the first day of training (top) and after the whole training (bottom). Dashed lines are the upper and lower bounds, the gray line is the initial weight. The weights are sorted by GC phase. F, Top, Gain evolution of PC as a signature of wPG plasticity across time. Bottom, wV M evolution.
In the dark, PC-Δγ2 mice forget, thus at the beginning of each training, the gain decrease has to be relearned. This, together with the hard lower bound restricting the synaptic weights wPG, implies that the phase cannot be reversed, as seen in Figure 5, B and C, where the final V is shown compared with Vt. Figure 5D, top, shows that PC activity of PC-Δγ2 mice is modulated anti-phase with the head movement. This is due to the fact that CF is modulated with the movement (Figure 5D, bottom). Therefore, during the night, the synaptic weights wPG are getting modulated in anti-phase with CF (since CF paring leads to depression, and no CF leads to potentiation), leading to a conserved antimodulation between CF and PC. Without compensation due to the CF, PC would have been modulated in-phase with the head movement, because GCs are modulated in-phase and there is no inhibition to reverse the phase (it would be the case of the weight decay term wd is bigger than the CF amplitude H). Figure 5D, bottom, shows that CF is modulated with the movement. Finally, Figure 5F shows the gain evolution of PCs as a signature of wPG plasticity (top), and the evolution of wVM. We can see that wPG learns during the training sessions, but it is only partially getting transferred to wVM. Although the qualitative behavior is well captured by the model, the phase in day 3 and 4 is quantitatively different, as in the wild-type case.
Learning dynamics in the GC mutant (GC-ΔKCC2)
In the model variant for the GC mutant mice (GC-ΔKCC2), GC firing rate increases due to an increase in excitability (Seja et al., 2012; Fig. 1A). As in the case of PC-Δγ2 mice, PC firing rates remain unchanged compared with the wild-type. In the model, this is again implemented by lower average weights wPG (Fig. 6E). For the same reasons as in the case of PC-Δγ2 mice, the model learns the gain decrease properly, forgets during the dark, and cannot learn the phase-reversal training. Figure 6A shows that the gain is learned properly the first day, and keeps decreasing with training, as seen experimentally. Figure 6B shows that the phase is never reversed, as seen on the final V of Figure 6C. Figure 6D shows that the PC is modulated in anti-phase with the movement, as seen for the wild-type, and CF is modulated. Finally, Figure 6F shows the poor learning of wPG and the transfer to wVM.
Discussion
In this paper, we have first presented electrophysiological recordings of SS and CS activity of PCs of wild-type mice, before and after VOR adaptation in the phase-reversal version of this task. These results show relatively minor changes in the modulation and phase of PC activity. These results are at odds with models that rely purely on plasticity at GC to PC synapses (Marr, 1969; Albus, 1971; Ito, 1989; Dean et al., 2002), which would produce a complete phase reversal of PC activity, to reproduce the behavioral results. However, our results are consistent with several previous studies (Broussard and Kassardjian, 2004; Kassardjian et al., 2005; Shutoh et al., 2006; Anzai et al., 2010), which indicate an almost complete transfer of plasticity in VOR adaptation from cerebellar cortex to downstream areas (Medina, 2011).
We then proceeded to study a model whose aim was to reproduce both electrophysiological and behavioral data, first in wild-type mice, and then in mutant mice that show impaired phase-reversal learning. Following the Marr—Albus–Ito model of cerebellar learning that points to the cerebellar cortex as a site of learning, we have drawn a first version of the model, the minimal model, which is similar to previously published models (Fujita, 1982). The minimal model that implements plasticity only at GC→PC synapses is able to reproduce the behavioral data, including the gradual dynamics of phase reversal, due to a delay in the error signal. However, the PC modulation in the model is at odds with the electrophysiological data.
We therefore moved to a more elaborate detailed model that also includes a plasticity site at the MF to MVN synapses (Miles and Lisberger, 1981; Pugh and Raman, 2006; McElvain et al., 2010; Medina, 2010; Menzies et al., 2010; Person and Raman, 2010; Zheng and Raman, 2010), with a slower timescale than the GC to PC synapses. In this model, GC to PC synapses learn first, but then memory is slowly transferred to the MF to MVN synapses, while the GC to PC synapses slowly decay back to their initial values. Learning at the MF to MVN synapses explains the lack of drastic changes in SS after learning. Learning at the MF to MVN happens all the time, in the light and in the dark, and in the dark by spontaneous head movements. Learning would stop when PCs and MVN are no longer covarying. This learning can be seen as a form of a consolidation mechanism. Over-representation of preferred phases similar to the head movement phase (Barmack and Yakhnitsa, 2008), both in GC and even more so in IN, as well as the CS modulation, explains the modulation of SS in anti-phase with the head movement. Modulation in CS during table stimulation in the dark is due to a small vestibular component in CF activity. The model suggests that the gradual phase shift is a signature of the delay in error signaled by CFs. The data suggest a delay of 100 ms, which coincides with the time expected for the feedback loop (Waespe and Henn, 1987), and also coincides with previous estimates based on correlating CS and SS signals in PCs (Raymond and Lisberger, 1998; Wetmore et al., 2014). The new detailed model was found to be in good agreement with both behavioral and electrophysiological data.
Finally, we tested the model by implementing two mutant mice that show severely impaired phase-reversal learning. We implemented changes in the circuit of the PC-Δγ2 mice by removing feedforward inhibition onto PCs. To keep the PC firing rates at a fixed level, we decrease the average GC to PC synapses, consistent with the previous data (Wulff et al., 2009). This change of average weights has a major influence on learning because the average weights are now close to the lower bound of synaptic efficacy. Therefore, PCs have less room to adjust their weights compared with PCs in wild-type animals. This causes a bias toward potentiation, which causes forgetting during the dark time. Therefore, the phase cannot be reversed due to both the dark-time forgetting, and the lower bounds on the GC to PC weights. The model describing the GC-ΔKCC2 mice was implemented by a higher GC excitability, and again GC to PC synapses were decreased as a compensation mechanism. As a consequence, the GC-ΔKCC2 model produced the same dynamics as the PC-Δγ2 model, and therefore an inability to learn phase reversal, just like GC-specific mouse mutants, which suffer from basic neurotransmission at part of their GC to PC synapses and a reduced basic modulation amplitude of their SS activity (Galliano et al., 2013). Therefore, our model reproduces qualitatively the behavior of mutant mice as well as wild-type mice.
Note that in both cases, the compensation mechanism (smaller average GC to PC weights) should produce automatically by itself a decrease in the coefficient of variation (CV2) of adjacent interspike intervals, because the amount of fluctuations in synaptic inputs scale with the average squared synaptic weights, consistent again with data (Wulff et al., 2009). However, our model predicts that this decrease in CV2 is not the source of behavioral impairments.
One feature that is not reproduced by the model is the phase shift of about 30–60 degrees before training. We note, however, that this large phase shift is not present in humans and nonhuman primates, where the phase shift is much smaller (Tomko et al., 1992). This phase shift might therefore be due to poor visual acuity of mice. Our model also does not include the efference copy to PCs (Raymond et al., 1996; Boyden et al., 2004), nor visual inputs to PCs (and therefore produces no OKR). These inputs could allow, under some conditions, the PCs to act as a teaching signal for learning directly at the MF to MVN, without learning at the GC to PCs. Under those conditions, the CFs would not be necessary for learning (Ke et al., 2009). For example, monkeys, which possess a much higher visual acuity than mice, due to the presence of a fovea and perform far better OKR tracking, could adapt their VOR without cortical plasticity, using basically the OKR to teach directly the vestibular nuclei. For the mice, however, there are a couple of reasons to think that cortical plasticity is necessary. (1) There is some good evidence that LTP at the GC to PC synapses is necessary for VOR adaptation (Schonewille et al., 2010), so learning at the level of PCs seems to be important. (2) The OKR performance in mice is quite poor due to their lack of fovea, resulting in poor visual perception.
Our model includes two sites of plasticity. Many other sites of plasticity have been described in the literature (Gao et al., 2012). This seems to indicate that in the VOR adaptation task, these other types of plasticity might be redundant with respect to the two sites described by our model. It will be interesting to consider in the future other mutant mice, like the PC-specific LTP and LTD knock-outs (Schonewille et al., 2010, 2011), for which additional sites of plasticity are likely to be required.
The model makes a number of additional experimentally testable predictions: It predicts that in VOR adaptation protocols in which the phase shift would be intermediate between 0 and 180 degrees (e.g., 90 degrees), transfer from PC to MVN could not be complete (because such a phase shift could not be generated by MVN alone: MVN can only control the positive or negative gain). Thus, the model predicts that PC modulation at the end of training would be significantly different from pretraining levels. This is consistent with experimental evidence, suggesting that timing is controlled by PCs, whereas amplitude is controlled by vestibular neurons (Perrett et al., 1993; De Zeeuw et al., 1995; Medina et al., 2000, 2001).
It predicts that the weight of the GC to PC synapses is smaller for GC-ΔKCC2 mice than for the wild-types, as already shown in the case of PC-Δγ2 mice (Wulff et al., 2009).
It predicts that PC average firing rate should increase during VOR adaptation protocol in PC-Δγ2 and GC-ΔKCC2 mice, because of the bias toward potentiation in those animals. These predictions are similar for the two types of mutant mice, because in both cases, we assume smaller GC to PC weights in average, which are therefore close to their lower bound.
Our model shows how, in the simple context of VOR adaptation, learning can be either fully transferred from PCs to MVN, while in others, it cannot. This is consistent with the general idea that in some motor adaptation tasks, transfer can be complete, while in others, transfer can at best be partial (Medina, 2011). Full transfer would occur in relatively simple situations where MVN is able to adjust, while it would not occur in more complex situations, where the full power of PC plasticity would be needed both in transient and steady-state conditions.
Some of the features of our model have already been introduced before. Delays in the error signals were introduced by Porrill and Dean (2007) who showed how such delays prevent learning of calibration of VOR at high frequencies. The minimal model is similar to previously introduced models, such as the adaptive filter model (Fujita, 1982), the LMS spectrum analyzer (Gluck et al., 1990), and the model of Raymond and Lisberger (1998), which also uses sinusoidal firing patterns for the GCs. Learning in the MF to MVN synapses has also been introduced in previous studies as a consolidation mechanism (Porrill and Dean, 2007; Menzies et al., 2010), and in the case of classical conditioning (Medina and Mauk, 1999), where a reduction in PC firing combined with increased input to the DCN neurons produces LTP. We also note that the current understanding of MF to MVN plasticity is incomplete, with different papers showing contradictory results (McElvain et al., 2010; Menzies et al., 2010; Person and Raman, 2010). In Porrill and Dean (2007), this additional plasticity site was shown to allow VOR calibration at much higher frequencies. Here, we argue that plasticity at this site also has the potential to free the PC plasticity site of carrying the burden of adjusting for simple gain modulation tasks, leaving this site more room to adjust for solving potentially more complex tasks.
Footnotes
This work has been supported by the Agence Nationale de la Recherche Grant ANR-08-SYSC-005 (N.B. and C.C.), by Swiss National Science Foundation Grant PA00P3_139703 (C.C.), by the Dutch Organization for Medical Sciences (C.I.D.Z.), Life Sciences (C.I.D.Z.), Senter (Neuro-Basic), and ERC-adv, CEREBNET, C7 programs of the European Community (C.I.D.Z.). We thank Boris Barbour, Vincent Hakim, Clement Léna, and Tom Schaul for fruitful discussions, as well as Rogerio de Avila Freire and Martijn Schonewille for their help with the eye movement experiments.
The authors declare no competing interests.
References
- Albus JS. A theory of cerebellar function. Math Biosci. 1971;10:25–61. doi: 10.1016/0025-5564(71)90051-4. [DOI] [Google Scholar]
- Anzai M, Kitazawa H, Nagao S. Effects of reversible pharmacological shutdown of cerebellar flocculus on the memory of long-term horizontal vestibuloocular reflex adaptation in monkeys. Neurosci Res. 2010;68:191–198. doi: 10.1016/j.neures.2010.07.2038. [DOI] [PubMed] [Google Scholar]
- Arenz A, Silver RA, Schaefer AT, Margrie TW. The contribution of single synapses to sensory representation in vivo. Science. 2008;321:977–980. doi: 10.1126/science.1158391. [DOI] [PMC free article] [PubMed] [Google Scholar]
- Badura A, Schonewille M, Voges K, Galliano E, Renier N, Gao Z, Witter L, Hoebeek FE, Chédotal A, De Zeeuw CI. Climbing fiber input shapes reciprocity of Purkinje cell firing. Neuron. 2013;78:700–713. doi: 10.1016/j.neuron.2013.03.018. [DOI] [PubMed] [Google Scholar]
- Barmack NH, Yakhnitsa V. Functions of interneurons in mouse cerebellum. J Neurosci. 2008;28:1140–1152. doi: 10.1523/JNEUROSCI.3942-07.2008. [DOI] [PMC free article] [PubMed] [Google Scholar]
- Belmeguenai A, Hosy E, Bengtsson F, Pedroarena CM, Piochon C, Teuling E, He Q, Ohtsuki G, De Jeu MT, Elgersma Y, De Zeeuw CI, Jörntell H, Hansel C. Intrinsic plasticity complements long-term potentiation in parallel fiber input gain control in cerebellar Purkinje cells. J Neurosci. 2010;30:13630–13643. doi: 10.1523/JNEUROSCI.3226-10.2010. [DOI] [PMC free article] [PubMed] [Google Scholar]
- Boyden ES, Katoh A, Raymond JL. Cerebellum-dependent learning: the role of multiple plasticity mechanisms. Annu Rev Neurosci. 2004;27:581–609. doi: 10.1146/annurev.neuro.27.070203.144238. [DOI] [PubMed] [Google Scholar]
- Broussard DM, Kassardjian CD. Learning in a simple motor system. Learn Mem. 2004;11:127–136. doi: 10.1101/lm.65804. [DOI] [PubMed] [Google Scholar]
- Brunel N, Hakim V, Isope P, Nadal JP, Barbour B. Optimal information storage and the distribution of synaptic weights: perceptron versus Purkinje cell. Neuron. 2004;43:745–757. doi: 10.1016/j.neuron.2004.08.023. [DOI] [PubMed] [Google Scholar]
- Cheron G, Escudero M, Godaux E. Discharge properties of brain stem neurons projecting to the flocculus in the alert cat. I. Medical vestibular nucleus. J Neurophysiol. 1996;76:1759–1774. doi: 10.1152/jn.1996.76.3.1759. [DOI] [PubMed] [Google Scholar]
- Coesmans M, Weber JT, De Zeeuw CI, Hansel C. Bidirectional parallel fiber plasticity in the cerebellum under climbing fiber control. Neuron. 2004;44:691–700. doi: 10.1016/j.neuron.2004.10.031. [DOI] [PubMed] [Google Scholar]
- D'Angelo E, Rossi P, Armano S, Taglietti V. Evidence for Nmda and mGlu receptor-dependent long-term potentiation of mossy fiber granule cell transmission in rat cerebellum. J Neurophysiol. 1999;81:277–287. doi: 10.1152/jn.1999.81.1.277. [DOI] [PubMed] [Google Scholar]
- Dean P, Porrill J, Stone JV. Decorrelation control by the cerebellum achieves oculomotor plant compensation in simulated vestibulo-ocular reflex. Proc Biol Sci. 2002;269:1895–1904. doi: 10.1098/rspb.2002.2103. [DOI] [PMC free article] [PubMed] [Google Scholar]
- De Zeeuw CI, Wylie DR, Stahl JS, Simpson JI. Phase relations of Purkinje cells in the rabbit flocculus during compensatory eye movements. J Neurophysiol. 1995;74:2051–2064. doi: 10.1152/jn.1995.74.5.2051. [DOI] [PubMed] [Google Scholar]
- Fujita M. Simulation of adaptive modification of the vestibulo-ocular reflex with an adaptive filter model of the cerebellum. Biol Cybern. 1982;45:207–214. doi: 10.1007/BF00336193. [DOI] [PubMed] [Google Scholar]
- Galliano E, Gao Z, Schonewille M, Todorov B, Simons E, Pop AS, D'Angelo E, van den Maagdenberg AM, Hoebeek FE, De Zeeuw CI. Silencing the majority of cerebellar granule cells uncovers their essential role in motor learning and consolidation. Cell Rep. 2013;3:1239–1251. doi: 10.1016/j.celrep.2013.03.023. [DOI] [PubMed] [Google Scholar]
- Gao Z, van Beugen BJ, De Zeeuw CI. Distributed synergistic plasticity and cerebellar learning. Nat Rev Neurosci. 2012;13:619–635. doi: 10.1038/nrn3312. [DOI] [PubMed] [Google Scholar]
- Gerrits NM, Epema AH, van Linge A, Dalm E. The primary vestibulocerebellar projection in the rabbit: absence of primary afferents in the flocculus. Neurosci Lett. 1989;105:27–33. doi: 10.1016/0304-3940(89)90006-2. [DOI] [PubMed] [Google Scholar]
- Gluck MA, Reifsnider ES, Thompson RF. Adaptive signal processing and the cerebellum: models of classical conditioning and VOR adaptation. Hillsdale, NJ: Lawrence Erlbaum Associates; 1990. pp. 131–185. [Google Scholar]
- Goossens HH, Hoebeek FE, Van Alphen AM, Van Der Steen J, Stahl JS, De Zeeuw CI, Frens MA. Simple spike and complex spike activity of floccular Purkinje cells during the optokinetic reflex in mice lacking cerebellar long-term depression. Eur J Neurosci. 2004;19:687–697. doi: 10.1111/j.0953-816X.2003.03173.x. [DOI] [PubMed] [Google Scholar]
- Hoebeek FE, Stahl JS, van Alphen AM, Schonewille M, Luo C, Rutteman M, van den Maagdenberg AM, Molenaar PC, Goossens HH, Frens MA, De Zeeuw CI. Increased noise level of Purkinje cell activities minimizes impact of their modulation during sensorimotor control. Neuron. 2005;45:953–965. doi: 10.1016/j.neuron.2005.02.012. [DOI] [PubMed] [Google Scholar]
- Isope P, Barbour B. Properties of unitary granule cell to Purkinje cell synapses in adult rat cerebellar slices. J Neurosci. 2002;22:9668–9678. doi: 10.1523/JNEUROSCI.22-22-09668.2002. [DOI] [PMC free article] [PubMed] [Google Scholar]
- Ito M. Long-term depression. Annu Rev Neurosci. 1989;12:85–102. doi: 10.1146/annurev.ne.12.030189.000505. [DOI] [PubMed] [Google Scholar]
- Jaeger D. Mini-review: synaptic integration in the cerebellar nuclei perspectives from dynamic clamp and computer simulation studies. Cerebellum. 2011;10:659–666. doi: 10.1007/s12311-011-0248-3. [DOI] [PubMed] [Google Scholar]
- Jörntell H, Hansel C. Synaptic memories upside down: bidirectional plasticity at cerebellar parallel fiber-Purkinje cell synapses. Neuron. 2006;52:227–238. doi: 10.1016/j.neuron.2006.09.032. [DOI] [PubMed] [Google Scholar]
- Kassardjian CD, Tan YF, Chung JY, Heskin R, Peterson MJ, Broussard DM. The site of a motor memory shifts with consolidation. J Neurosci. 2005;25:7979–7985. doi: 10.1523/JNEUROSCI.2215-05.2005. [DOI] [PMC free article] [PubMed] [Google Scholar]
- Ke MC, Guo CC, Raymond JL. Elimination of climbing fiber instructive signals during motor learning. Nat Neurosci. 2009;12:1171–1179. doi: 10.1038/nn.2366. [DOI] [PMC free article] [PubMed] [Google Scholar]
- Le Guen MC, De Zeeuw CI. Presynaptic plasticity at cerebellar parallel fiber terminals. Funct Neurol. 2010;25:141–151. [PubMed] [Google Scholar]
- Lisberger SG, Fuchs AF. Role of primate flocculus during rapid behavioral modification of vestibuloocular reflex. II. Mossy fiber firing patterns during horizontal head rotation and eye movement. J Neurophysiol. 1978;41:764–777. doi: 10.1152/jn.1978.41.3.764. [DOI] [PubMed] [Google Scholar]
- Marr D. A theory of cerebellar cortex. J Physiol. 1969;202:437–470. doi: 10.1113/jphysiol.1969.sp008820. [DOI] [PMC free article] [PubMed] [Google Scholar]
- McElvain LE, Bagnall MW, Sakatos A, du Lac S. Bidirectional plasticity gated by hyperpolarization controls the gain of postsynaptic firing responses at central vestibular nerve synapses. Neuron. 2010;68:763–775. doi: 10.1016/j.neuron.2010.09.025. [DOI] [PMC free article] [PubMed] [Google Scholar]
- Medina JF. A recipe for bidirectional motor learning: using inhibition to cook plasticity in the vestibular nuclei. Neuron. 2010;68:607–609. doi: 10.1016/j.neuron.2010.11.011. [DOI] [PMC free article] [PubMed] [Google Scholar]
- Medina JF. The multiple roles of Purkinje cells in sensori-motor calibration: to predict, teach and command. Curr Opin Neurobiol. 2011;21:616–622. doi: 10.1016/j.conb.2011.05.025. [DOI] [PMC free article] [PubMed] [Google Scholar]
- Medina JF, Mauk MD. Simulations of cerebellar motor learning: computational analysis of plasticity at the mossy fiber to deep nucleus synapse. J Neurosci. 1999;19:7140–7151. doi: 10.1523/JNEUROSCI.19-16-07140.1999. [DOI] [PMC free article] [PubMed] [Google Scholar]
- Medina JF, Nores WL, Ohyama T, Mauk MD. Mechanisms of cerebellar learning suggested by eyelid conditioning. Curr Opin Neurobiol. 2000;10:717–724. doi: 10.1016/S0959-4388(00)00154-9. [DOI] [PubMed] [Google Scholar]
- Medina JF, Garcia KS, Mauk MD. A mechanism for savings in the cerebellum. J Neurosci. 2001;21:4081–4089. doi: 10.1523/JNEUROSCI.21-11-04081.2001. [DOI] [PMC free article] [PubMed] [Google Scholar]
- Menzies JR, Porrill J, Dutia M, Dean P. Synaptic plasticity in medial vestibular nucleus neurons: comparison with computational requirements of VOR adaptation. PLoS One. 2010;5:e13182. doi: 10.1371/journal.pone.0013182. [DOI] [PMC free article] [PubMed] [Google Scholar]
- Miles FA, Lisberger SG. Plasticity in the vestibulo-ocular reflex: a new hypothesis. Annu Rev Neurosci. 1981;4:273–299. doi: 10.1146/annurev.ne.04.030181.001421. [DOI] [PubMed] [Google Scholar]
- Perrett SP, Ruiz BP, Mauk MD. Cerebellar cortex lesions disrupt learning-dependent timing of conditioned eyelid responses. J Neurosci. 1993;13:1708–1718. doi: 10.1523/JNEUROSCI.13-04-01708.1993. [DOI] [PMC free article] [PubMed] [Google Scholar]
- Person AL, Raman IM. Deactivation of L-type Ca current by inhibition controls LTP at excitatory synapses in the cerebellar nuclei. Neuron. 2010;66:550–559. doi: 10.1016/j.neuron.2010.04.024. [DOI] [PMC free article] [PubMed] [Google Scholar]
- Porrill J, Dean P. Cerebellar motor learning: when is cortical plasticity not enough? PLoS Comput Biol. 2007;3:1935–1950. doi: 10.1371/journal.pcbi.0030197. [DOI] [PMC free article] [PubMed] [Google Scholar]
- Pugh JR, Raman IM. Potentiation of mossy fiber EPSCs in the cerebellar nuclei by NMDA receptor activation followed by postinhibitory rebound current. Neuron. 2006;51:113–123. doi: 10.1016/j.neuron.2006.05.021. [DOI] [PubMed] [Google Scholar]
- Raymond JL, Lisberger SG. Neural learning rules for the vestibuloocular reflex. J Neurosci. 1998;18:9112–9129. doi: 10.1523/JNEUROSCI.18-21-09112.1998. [DOI] [PMC free article] [PubMed] [Google Scholar]
- Raymond JL, Lisberger SG, Mauk MD. The cerebellum: a neuronal learning machine? Science. 1996;272:1126–1131. doi: 10.1126/science.272.5265.1126. [DOI] [PubMed] [Google Scholar]
- Schonewille M, Belmeguenai A, Koekkoek SK, Houtman SH, Boele HJ, van Beugen BJ, Gao Z, Badura A, Ohtsuki G, Amerika WE, Hosy E, Hoebeek FE, Elgersma Y, Hansel C, De Zeeuw CI. Purkinje cell-specific knockout of the protein phosphatase PP2B impairs potentiation and cerebellar motor learning. Neuron. 2010;67:618–628. doi: 10.1016/j.neuron.2010.07.009. [DOI] [PMC free article] [PubMed] [Google Scholar]
- Schonewille M, Gao Z, Boele HJ, Veloz MF, Amerika WE, Simek AA, De Jeu MT, Steinberg JP, Takamiya K, Hoebeek FE, Linden DJ, Huganir RL, De Zeeuw CI. Reevaluating the role of LTD in cerebellar motor learning. Neuron. 2011;70:43–50. doi: 10.1016/j.neuron.2011.02.044. [DOI] [PMC free article] [PubMed] [Google Scholar]
- Schweizer C, Balsiger S, Bluethmann H, Mansuy IM, Fritschy JM, Mohler H, Lüscher B. The gamma 2 subunit of GABA(A) receptors is required for maintenance of receptors at mature synapses. Mol Cell Neurosci. 2003;24:442–450. doi: 10.1016/S1044-7431(03)00202-1. [DOI] [PubMed] [Google Scholar]
- Seja P, Schonewille M, Spitzmaul G, Badura A, Klein I, Rudhard Y, Wisden W, Hübner CA, De Zeeuw CI, Jentsch TJ. Raising cytosolic Clin cerebellar granule cells affects their excitability and vestibulo-ocular learning. EMBO J. 2012;31:1217–1230. doi: 10.1038/emboj.2011.488. [DOI] [PMC free article] [PubMed] [Google Scholar]
- Shin M, Moghadam SH, Sekirnjak C, Bagnall MW, Kolkman KE, Jacobs R, Faulstich M, du Lac S. Multiple types of cerebellar target neurons and their circuitry in the vestibulo-ocular reflex. J Neurosci. 2011;31:10776–10786. doi: 10.1523/JNEUROSCI.0768-11.2011. [DOI] [PMC free article] [PubMed] [Google Scholar]
- Shutoh F, Ohki M, Kitazawa H, Itohara S, Nagao S. Memory trace of motor learning shifts transsynaptically from cerebellar cortex to nuclei for consolidation. Neuroscience. 2006;139:767–777. doi: 10.1016/j.neuroscience.2005.12.035. [DOI] [PubMed] [Google Scholar]
- Soetedjo R, Kojima Y, Fuchs AF. Complex spike activity in the oculomotor vermis of the cerebellum: a vectorial error signal for saccade motor learning? J Neurophysiol. 2008;100:1949–1966. doi: 10.1152/jn.90526.2008. [DOI] [PMC free article] [PubMed] [Google Scholar]
- Stahl JS, van Alphen AM, De Zeeuw CI. A comparison of video and magnetic search coil recordings of mouse eye movements. J Neurosci Methods. 2000;99:101–110. doi: 10.1016/S0165-0270(00)00218-1. [DOI] [PubMed] [Google Scholar]
- Tomko DL, Paige GD. Linear vestibuloocular reflex during motion along axes between nasooccipital and interaural. Ann NY Acad Sci. 1992;656:233–241. doi: 10.1111/j.1749-6632.1992.tb25212.x. [DOI] [PubMed] [Google Scholar]
- van Alphen AM, Stahl JS, De Zeeuw CI. The dynamic characteristics of the mouse horizontal vestibulo-ocular and optokinetic response. Brain Res. 2001;890:296–305. doi: 10.1016/S0006-8993(00)03180-2. [DOI] [PubMed] [Google Scholar]
- van Beugen BJ, Gao Z, Boele HJ, Hoebeek F, De Zeeuw CI. High frequency burst firing of granule cells ensures transmission at the parallel fiber to Purkinje cell synapse at the cost of temporal coding. Front Neural Circuits. 2013;7:95. doi: 10.3389/fncir.2013.00095. [DOI] [PMC free article] [PubMed] [Google Scholar]
- Waespe W, Henn V. Gaze stabilization in the primate. The interaction of the vestibulo-ocular reflex, optokinetic nystagmus, and smooth pursuit. Rev Physiol Biochem Pharmacol. 1987;106:37–125. doi: 10.1007/BFb0027575. [DOI] [PubMed] [Google Scholar]
- Wetmore DZ, Jirenhed DA, Rasmussen A, Johansson F, Schnitzer MJ, Hesslow G. Bidirectional plasticity of Purkinje cells matches temporal features of learning. J Neurosci. 2014;34:1731–1737. doi: 10.1523/JNEUROSCI.2883-13.2014. [DOI] [PMC free article] [PubMed] [Google Scholar]
- Wulff P, Schonewille M, Renzi M, Viltono L, Sassoè-Pognetto M, Badura A, Gao Z, Hoebeek FE, van Dorp S, Wisden W, Farrant M, De Zeeuw CI. Synaptic inhibition of Purkinje cells mediates consolidation of vestibulo-cerebellar motor learning. Nat Neurosci. 2009;12:1042–1049. doi: 10.1038/nn.2348. [DOI] [PMC free article] [PubMed] [Google Scholar]
- Zheng N, Raman IM. Synaptic inhibition, excitation, and plasticity in neurons of the cerebellar nuclei. Cerebellum. 2010;9:56–66. doi: 10.1007/s12311-009-0140-6. [DOI] [PMC free article] [PubMed] [Google Scholar]