

Abstract
The primary motor cortex (M1) receives dopaminergic projections from the ventral tegmental area (VTA) through the mesocortical dopamine pathway. However, few studies have focused on changes in M1 neuronal activity caused by VTA activation. To address this issue, we used voltage-sensitive dye imaging (VSD) to reveal the spatiotemporal dynamics of M1 activity induced by single-pulse stimulation of VTA in anesthetized rats. VSD imaging showed that brief electrical stimulation of unilateral VTA elicited a short-latency excitatory–inhibitory sequence of neuronal activity not only in the ipsilateral but also in the contralateral M1. The contralateral M1 response was not affected by pharmacological blockade of ipsilateral M1 activity, but it was completely abolished by corpus callosum transection. Although the VTA-evoked neuronal activity extended throughout the entire M1, we found the most prominent activity in the forelimb area of M1. The 6-OHDA-lesioned VTA failed to evoke M1 activity. Furthermore, both excitatory and inhibitory intact VTA-induced activity was entirely extinguished by blocking glutamate receptors in the target M1. When intracortical microstimulation of M1 was paired with VTA stimulation, the evoked forelimb muscle activity was facilitated or inhibited, depending on the interval between the two stimuli. These findings suggest that VTA neurons directly modulate the excitability of M1 neurons via fast glutamate signaling and, consequently, may control the last cortical stage of motor command processing.
Keywords: electromyogram, intracortical microstimulation, mesocortical projection, motor learning, optical imaging, reward signaling
Introduction
The projection from the ventral tegmental area (VTA) to the primary motor cortex (M1) has attracted considerable attention because evidence suggests that VTA activation and subsequent dopamine (DA) release in the M1 are necessary for motor skill learning and in recovery of motor function after brain injury (Luft and Schwarz, 2009; Ruscher et al., 2012). Specifically, chemical ablation of DA neurons in VTA (Hosp et al., 2011) and elimination of DA terminals in the M1 (Molina-Luna et al., 2009) impair motor skill learning in rats. Using a spinal cord injury model in monkeys, a brain imaging study demonstrated that M1 activity during finger dexterity training was accompanied by increased activity in VTA and other DA-related brain areas (Nishimura et al., 2011).
DA neurons in VTA are known to increase their firing rate immediately after reward reception or reward-predicting stimuli (Schultz, 2002; Bayer and Glimcher, 2005). Changes in the VTA-DA neuron firing pattern encode temporally precise information about reward, and the reward signals potentially influence neural activity in many brain areas (Schultz, 2007; Bromberg-Martin et al., 2010). However, because DA acts as a relatively slow modulator of cortical neurotransmission, DA is unsuitable for delivering well-timed reward information. Therefore, some studies propose that corelease of glutamate from VTA-DA neurons takes on the role of fast reward signaling (Lapish et al., 2007). Short-latency neural activity generated by VTA stimulation was reported in the prefrontal cortex (PFC) (Mercuri et al., 1985; Lavin et al., 2005; Watanabe et al., 2009), but until now no reports have described the M1 response caused by VTA activation. If dopaminergic neuron-dependent fast signal transmission exists in the VTA-M1 pathway, it is appropriate to hypothesize that VTA-DA neurons transmit reward-related signals to the M1 with precise timing, in the particular situation of performing motor skill training.
Another issue to address is the projection from the VTA to the contralateral M1 hemisphere. A recent tracing study indicated that the VTA-M1 projection is mainly ipsilateral, but a small contralateral projection does exist (Hosp et al., 2011). Because bilateral VTAs compensate for each other (Majkutewicz et al., 2010), one can presume a possible reinforcement role for the contralateral projections; however, it is unknown whether VTA might induce contralateral M1 activity as is observed in the ipsilateral M1.
Therefore, in the present study, we focused on a functional projection from the VTA to M1, and we spatiotemporally characterized the M1 activity induced by VTA activation. We show that activation of unilateral VTA-DA neurons produces a fast excitatory–inhibitory sequence of neuronal activity in bilateral M1 and that the phasic modulation of M1 excitability is attributable to glutamate cotransmission by VTA-DA neurons. Finally, we show that the fast signals from the VTA to M1 are capable of modulating M1 output at the level of forelimb muscle activity.
Materials and Methods
Animals and surgical procedures.
All experimental protocols were reviewed and approved by the Committee on Animal Care and Use and by the Ethical Committee of the National Institute of Advanced Industrial Science and Technology. Adult male Wistar rats (250–350 g) were used in all experiments. Animals were housed in standard cages under a 12 h light/dark cycle with food and water ad libitum. After anesthesia with an intraperitoneal injection of ketamine (80 mg/kg) and xylazine (10 mg/kg), rats were positioned in a stereotaxic frame (Narishige). Supplemental injections of ketamine and xylazine (i.p.) were used to maintain a constant level of anesthesia, as indicated by respiration rate, heart rate, whisker movement, and foot withdrawal reflex. Craniotomy was performed over the M1 (anteroposterior, −2.0 to 4.0 mm; mediolateral, 1.5 to 5.5 mm from the bregma) and the VTA (anteroposterior, −6.0 ± 0.5 mm; mediolateral, 0.5 mm from the bregma) (Paxinos and Watson, 1998). The exposed dura were carefully removed after a dental acrylic chamber was built on the skull around the cranial window above the M1. When we performed voltage-sensitive dye imaging (VSD) imaging in the bilateral motor cortex, the cranial window and dental acrylic chamber were constructed on each hemisphere. A concentric bipolar electrode (Bio Research Center) was positioned in the VTA at a depth of 7.5 ± 0.5 mm from the brain surface. When electrical stimulation was applied to the bilateral VTA, two concentric bipolar electrodes were positioned in bilateral VTA. At the end of the experiments, a small electrolytic lesion was made by passing direct current (100 μA for 5 s) to histologically confirm the stimulus site by Nissl staining.
In vivo VSD imaging.
Thirty-two intact animals were used for in vivo VSD imaging (20 for unilateral and 12 for bilateral imaging). For in vivo VSD imaging, exposed motor cortex was stained for 1 h by VSD RH-795 (Invitrogen) dissolved at 0.8 mg/ml in ACSF containing the following (in mm): 125 NaCl, 5 KCl, 2 CaCl2, 1.25 MgSO4, 1.25 NaHPO4, 22 NaHCO3, and 10 glucose. After dye incubation, unbound dye was thoroughly washed away, and the dental acrylic chamber was sealed by a glass coverslip. The neuronal activity was recorded as fractional changes in fluorescence by a Micam01 system (Brainvision) using a tandem type epifluorescence microscope as previously reported (Iijima et al., 1996; Takashima et al., 1999). The optical signal was captured at 500 Hz with 88 × 60 pixels from 4.5 × 3.0 mm of cortex. In each trial, single-pulse electrical stimulation was applied to the VTA (300 μs in duration and 150 μA in amplitude), and 16 consecutive trials with 16 s intervals were averaged. Optical signals were expressed as fractional changes in fluorescence (ΔF/F). In the ROI analysis, ΔF/F was normalized to the maximum response value of each hemisphere (see Figs. 2 and 6). For statistical analyses of the optical responses, Kruskal–Wallis tests and post hoc pairwise comparisons were performed using Bonferroni-corrected Mann–Whitney U tests (see Figs. 1 and 2).
Figure 2.

VTA-evoked neuronal activity spreads from the CFA toward the RFA in the motor cortex. A, Initial activation sites and the direction of neural propagation. Filled circles represent the site of initial activation in each animal, and the tip of the arrow indicates the center of gravity of the activity map 6 ms after the initial activation. B, Motor representations in the M1 as plotted on a single frame of VTA-evoked neural activity. ICMS mapping was conducted immediately after VSD imaging. Colored circles indicate electrode penetration sites and the body parts moved by stimulation. C, Three ROIs selected in the motor cortex: CFA, RFA, and Vib. The position of each ROI was determined by consulting the motor maps from three rats. The red and blue contour lines indicate CFA and RFA representations, respectively. D, E, Peak amplitude and latency of VTA-evoked optical signals in three ROIs. D, The peak amplitudes of the optical signals in both forelimb areas (CFA, RFA) were greater than that in the Vib. To quantify the response amplitude without variation among animals, ΔF/F was normalized to the maximum response value of each animal (ΔF/F)norm. E, The latency-to-peak of the excitatory optical signal was significantly shorter in the CFA compared with the RFA and the Vib. **p < 0.01. Scale bar: B, 1.0 mm.
Figure 6.

Unilateral VTA stimulation elicits activation in the bilateral M1. A, Schematic view of the experimental design. After unilateral VTA stimulation, VSD imaging was performed in the bilateral M1. Red rectangles represent the imaged cortical areas. Muscimol was injected into the M1 ipsilateral to the stimulated VTA. B–E, VTA-evoked responses in the ipsilateral and contralateral M1 before muscimol injection. B, In the control, electrical stimulation of unilateral VTA elicited excitatory–inhibitory neuronal activities in the bilateral M1. C, The initial activation sites and the direction of neural propagation in the contralateral M1. The distribution pattern was similar to that in the ipsilateral M1, as shown in Figure 2A. D, Magnified and smoothed traces of the rising phase of the optical signals. The traces are from selected pixels in the area of initial activation. ΔF/F was normalized to the maximum response amplitude of each hemisphere. The contralateral response (blue) was significantly delayed compared with the ipsilateral response (black). E, The VTA-evoked response amplitude was compared between hemispheres. The optical signals were collected from the CFA of the M1, and their peak amplitude was evaluated as the value of ΔF/Fnorm. The contralateral M1 showed reduced activation compared with the ipsilateral, but the difference was not significant (p > 0.05, Mann–Whitney U test). F, VTA-evoked responses after muscimol injection. Neuronal activity in the muscimol-injected M1 (ipsilateral to the stimulated VTA) was completely abolished; however, the activity in the contralateral M1 was mostly unaffected. Arrows (pink) indicate muscimol injection sites. Traces on the right show representative optical signals obtained from the bilateral M1 before (black) and after (red) muscimol injection. Scale bars: B, F, 1.0 mm.
Figure 1.

VSD imaging of the motor cortical response after electrical stimulation of the VTA. A, Schematic view of VTA stimulation and VSD imaging. The imaged cortical area, as indicated by a red rectangle, covered the motor cortex ipsilateral to the stimulated side. The borders between M1 and adjacent areas were delineated according to the brain atlas. B, A spatiotemporal pattern of neuronal activity resulted from VTA stimulation. Single-pulse stimulation was applied at 0 ms, and the poststimulus time is shown in each image. C, The typical time course of the optical signal from M1. White triangle represents the stimulus onset. Fluorescence decrease is upward; upward or downward deflections of the signal indicate depolarization or hyperpolarization, respectively. D, E, The relationship between stimulus intensity and M1 responses as assessed by the peak amplitude and the half-width duration of the optical signals (average of five trials from one rat). The excitatory or inhibitory components of the optical signal are indicated in red or blue, respectively. D, The peak amplitude of the excitatory signal significantly increased with higher stimulus current. E, The inhibitory signal was gradually prolonged when a stronger stimulus current was applied. Data are mean ± SEM. *p < 0.05. **p < 0.01. A, Anterior; L, lateral. Scale bar: B, 1.0 mm.
Intracortical microstimulation and EMG recording.
Motor representation was confirmed using an intracortical microstimulation (ICMS) technique (n = 3 animals). A flexible tungsten microelectrode (MicroProbes for Life Sciences) was positioned perpendicular to the cortical surface with a 500 μm grid. Electrical stimulation was delivered as 12 monophasic cathodal pulses (200 μs duration at 333 Hz, 5–50 μA). In each penetration, electrical stimulation was applied at a depth of 1100–1700 μm from the cortical surface, which corresponds to layers 5 and 6 of the M1. Evoked muscle contractions and movements were identified by visual inspection and palpation. The body part with the lowest movement threshold was defined as the motor representation at that penetration, whereas the absence of detectable movement with 50 μA current intensity was defined as “no response.” As for the forelimb areas in rodents, two motor areas have been identified: the caudal forelimb area (CFA) and the rostral forelimb area (RFA). The CFA and RFA were determined by surrounding motor representations, such as vibrissae, neck, jaw, and no response areas.
In the experiments of ICMS paired with VTA stimulation (see Fig. 10), upper limb movement was assessed by recording EMG activity (n = 6 animals). The ICMS electrode was fixed at a position that showed the lowest movement threshold for elbow flexion within the CFA, and a single cathodal-current pulse (200 μs, 50–150 μA) was delivered through the electrode. The evoked EMG activity was recorded from biceps brachii with a concentric bipolar electrode inserted near the center of the muscle fibers. Subsequently, the EMG was amplified (×100), filtered (0.3–10 kHz), digitized (sampling rate: 10 kHz; PCI-6023E, National Instruments), and stored on a personal computer running LabVIEW software (National Instruments). The EMG signal was rectified and averaged over 10 trials.
Figure 10.
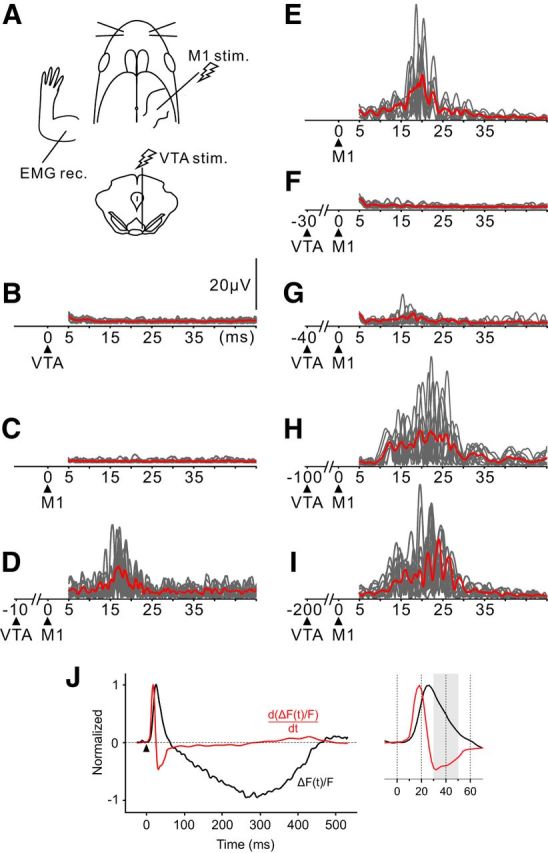
The ICMS-evoked EMG response is modulated depending on the timing of conditioning VTA stimulation. A, Schematic view of the experimental design. B, C, EMG of upper limb muscles in response to either VTA or M1 stimulation. Essentially no EMG response was observed after single-pulse stimulation to the VTA (B). Here the intensity of M1 stimulation was below the movement threshold (C). D, When the under-threshold M1 stimulation was conditioned with VTA stimulation, the EMG response was elicited. VTA stimulation preceded the ICMS by 10 ms. E, F, On the contrary, the ICMS-evoked EMG was abolished when paired with the 30 ms preceding VTA stimulation. The M1 stimulation with suprathreshold intensity evoked the EMG (E), but the muscle activity was precluded by the preceding VTA stimulation (F). G–I, The EMG response started to reappear when the interstimulus interval was set to 40 ms (G). As the interval increased, the EMG response recovered gradually and was restored by 200 ms (H, I). Gray lines indicate the EMG traces in each trial, and a red line indicates the mean EMG activity. Black triangles represent the stimulus onset. J, A possible explanation for the time-dependent suppression of EMG. Traces represent the time course of the VTA-evoked optical signal (black, the same trace as in Fig. 1C) and its time derivative (red). The magnified inset on the right represents the initial phase. Differential operations were applied to the smoothened optical signal. The period during which the time derivative signal showed a large negative value (30–50 ms after stimulation, shaded in gray) coincided with the period of strong EMG suppression (F, G).
Current source density analysis.
A silicon multiprobe electrode (Neuronexus Technologies) with 16 × 100 μm linearly separated contact sites was used to record local field potentials (LFPs) simultaneously throughout the motor cortical layers (n = 4 animals). The electrode was fixed to a micromanipulator and inserted perpendicular to the motor cortex at the following coordinates: anteroposterior, 2.0 mm; mediolateral, 3.0 mm from the bregma. LFPs were acquired with 10 kHz after single-pulse stimulation of the VTA (300 μs duration and 150 μA current intensity). Voltage signals were amplified (×1000) and filtered (bandwidth: 0.1–3 kHz) by a PBX preamplifier (Plexon), and then recorded through a Digidata 1320A interface (Molecular Devices). A set of LFPs was used for the current source density (CSD) analysis. CSD was computed as the second spatial derivative of the three adjacent sites using a standard method (Nicholson and Freeman, 1975; Mitzdorf, 1985). Contour plots of current sinks and sources were generated using the Origin software (OriginLab). The electrode tract and position were histologically verified by Nissl staining.
6-OHDA injection.
DA neurons were destroyed by 6-OHDA injection directly into the unilateral VTA (n = 14 animals). One hour before injection, anesthetized animals were treated with desipramine hydrochloride (25 mg/kg, i.p.) to protect noradrenergic cells. The skull was exposed, and a hole was drilled over the unilateral VTA to introduce a syringe for 6-OHDA (Sigma) injection. A volume of 6 μl 6-OHDA (4 μg/μl in saline containing 0.1% ascorbic acid) was delivered at 0.25 μl/min into three separate injection sites using a motorized microinjector (IMS-10, Narishige). The needle was kept in place for an additional 5 min before it was slowly retracted. 6-OHDA-treated animals were used for experiments at least 4 weeks after the injection.
Pharmacological treatments.
VTA stimulus-evoked responses were suppressed by microinjection of the GABAA receptor agonist muscimol into the motor cortex (n = 4 animals). Muscimol (Wako) was dissolved at a concentration of 1 μg/μl in saline and delivered into the cortex using a Hamilton syringe attached to a motorized microinjector (IMS-10, Narishige). A 0.1 μl injection was performed in three or four penetrations at a depth of 1 mm from the cortical surface. Injection sites were determined according to the preceding VSD imaging results. The needle was kept in place for an additional 5 min at the end of the injection to prevent backflow of muscimol over the cortical surface.
In other experiments, we applied the AMPA/kainate glutamate receptor antagonist CNQX (Sigma, 1 mm), the GABAA receptor antagonist bicuculline (Sigma, 100 μm), or the D1 receptor antagonist SCH 23390 HCl (Sigma, 100 μm) and the D2 antagonist S(±)-sulpiride (Sigma, 100 μm) onto the cortical surface (n = 3 animals each). Each pharmacological agent was dissolved in ACSF and applied into the dental acrylic chamber above the motor cortex for ∼30 min. A recovery experiment was performed after the application of CNQX by continuously rinsing the exposed cortical surface with ACSF for 2 h during recovery.
Corpus callosum (CC) transection.
The part of the CC that interconnects bilateral motor regions was transected using a wire knife (n = 4 animals). A guide cannula whose tip was curved in the caudal direction was positioned between the olfactory bulbs, and a wire (ϕ = 0.3 mm) was inserted through the cannula along the midsaggital plane such that it was positioned between the midsaggital sinus and CC (see Fig. 7A). The wire knife was gradually advanced ventrally while verifying the VTA-evoked contralateral M1 response using a surface ball electrode. We found that it was sufficient to transect the dorsal part of the CC to eliminate the contra-M1 response (see Fig. 7B). This cutting procedure allowed us to record evoked neuronal activity without massive bleeding from the midsagittal sinus. We confirmed that there was no damage to the underlying brain tissue by Nissl staining.
Figure 7.

CC transection abolishes the contralateral M1 response. A, Schematic illustration of CC transection. A wire knife with a cannula was inserted through a cranial hole drilled above the olfactory bulbs (OBs). B, Nissl-stained coronal section showing that the dorsal part of CC was cut without massive damage to the nearby cortex or underlying brain tissues. Complete transection of CC was not necessary in this experiment. Arrowheads indicate the borders between the M1 and surrounding cortical areas. C, D, Spatiotemporal dynamics of VTA-evoked responses in the bilateral M1 before and after CC transection. C, Stimulation of the right VTA (Rt-VTA) activated both the right M1 (Rt-M1, top) and the left M1 (Lt-M1, bottom) before CC scission. D, After CC section, right VTA (Rt-VTA) stimulation activated the right M1 (Rt-M1, top panels) as usual, but the neural response disappeared in the left M1 (Lt-M1, middle panels). Under this condition, the left M1 (Lt-M1) exhibited typical ipsilateral neuronal activity in response to left VTA (Lt-VTA) stimulation (bottom panels). M2, Secondary motor cortex; S1, primary somatosensory cortex; Rt/Lt, right/left. Scale bars: B, C, D, 1.0 mm.
Histology.
At the end of the experiment, animals were deeply anesthetized with pentobarbital (i.p.) and transcardially perfused with 4% PFA. The brain was removed, postfixed in the same fixative for over 24 h, and immersed in 0.1 m PBS containing 30% sucrose. The brain was cut into 30-μm-thick coronal sections using a freezing microtome (Leica SM 2000R, Leica Microsystems). The collected sections were processed for Nissl staining. Images of Nissl-stained sections were captured with a digital microscope (BZ-8100, Keyence).
Immunohistochemistry.
Coronal sections collected from the midbrain and M1 were used for tyrosine hydroxylase (TH) immunohistochemistry to stain DA cells. Sections were rinsed in 0.1 m PBS, nonspecific binding was blocked by 2% normal goat serum with 0.1% Triton X-100 in 0.1 m PBS for 60 min, and then incubated with an anti-TH rabbit monoclonal antibody (1:1000; Millipore Bioscience Research Reagents) at 4°C overnight. After washing three times with 0.1 m PBS, the sections were incubated with a biotinylated goat anti-rabbit IgG secondary antibody (1:500; PK-4001, Vector Laboratories) at room temperature for 1 h, rinsed three times with 0.1 m PBS, and incubated with the avidin-biotin complex (PK-4001, Vector Laboratories) for 1 h. Staining was achieved by incubation with DAB mixed with distilled water, buffer pH 7.5, H2O2, and nickel stock solution (SK-4100, Vector Laboratories). After staining with DAB, sections were washed in distilled water, mounted onto slides, dehydrated, cleared in xylene, and coverslips were added with mounting medium. Images of TH-stained tissues were captured with a microscope (BZ-8100, Keyence). The density of stained tissues was analyzed using ImageJ software (developed at the National Institutes of Health) by quantifying the optical density within the VTA. Optical densities were normalized by subtracting the nonspecific background staining. The optical density of TH-positive tissues in the lesioned VTA was calculated relative to the intact VTA.
We also verified the DA fibers in M1 using TH immunofluorescence staining. The staining procedure was the same as that described above, except that anti-TH mouse monoclonal (1:1000; Invitrogen) and AlexaFluor-488-conjugated goat anti-mouse IgG (1:1000; Invitrogen) antibodies were used as the primary and secondary antibodies, respectively. Coverslips were mounted using Fluoromount (DBS). After capturing fluorescence images, the coverslips were removed in 0.1 m PBS, and Nissl staining was performed to identify the cortical layers.
Results
VTA stimulation elicits excitatory–inhibitory neuronal activity in the motor cortex
VSD imaging was performed in the motor cortex to elucidate the spatiotemporal dynamics of neuronal activity after VTA stimulation (Fig. 1A). A representative example of the activity pattern and the time course of the optical signal are shown in Figure 1B and Figure 1C, respectively. Single-pulse electrical stimulation (150 μA for 300 μs) of VTA-induced excitatory neuronal activity in the motor cortex began 13.3 ± 1.3 ms (mean ± SEM, n = 10) after stimulus onset. In the following ∼20 ms, the cortical depolarization spread throughout the motor area. The excitatory response began to decrease ∼30 ms after the stimulus onset and completely disappeared ∼80 ms after stimulation. Subsequent to the excitatory response, inhibitory neuronal activity developed for 379.4 ± 10.1 ms, covering a cortical area similar to where the previous excitatory response was observed. The peak amplitude and half-width (duration at half of peak amplitude) of excitatory and inhibitory responses were assessed for the 25–150 μA stimulus current in one rat (Fig. 1D,E). The excitatory signal amplitude significantly increased with increasing stimulus intensity (25 μA vs 150 μA stimulus current, −0.063 ± 0.015% vs −0.149 ± 0.018%, p < 0.01), whereas only a slight increase was observed in the inhibitory signal amplitude (25 μA vs 150 μA stimulus current, 0.096 ± 0.009% vs 0.125 ± 0.021%, p > 0.05) (Fig. 1D). The excitatory response exhibited constant half-width duration regardless of the stimulus intensity (25 μA vs 150 μA stimulus current, 14 ± 2.6 ms vs 14 ± 1.6 ms); however, the half-width was prolonged in the inhibitory response when a stronger stimulus was applied to the VTA (25 μA vs 150 μA stimulus current, 258.5 ± 15.1 ms vs 307.2 ± 14.7 ms, p < 0.05) (Fig. 1E).
We observed that the excitatory neuronal activity first appeared in the caudolateral part of the motor cortex, after which the activity extended into the rostromedial direction in all animals (data from 10 selected animals are shown in Fig. 2A). Thus, we confirmed motor representations in the optically mapped cortical area immediately after the VSD imaging experiments (n = 3) using an ICMS technique. Figure 2B shows an example of motor representations merged with the VSD imaging results. The location of motor representations was consistent with a previous study (Gioanni and Lamarche, 1985); a minimum movement threshold was 10 μA in the jaw area and 5 μA in both forelimb and vibrissae areas. Based on ICMS maps from the three animals, three ROIs were placed over the motor cortex: CFA, RFA, and vibrissae area (Vib) (Fig. 2C). The amplitude and peak latency of the excitatory optical signal were compared among these areas (Fig. 2D,E). Figure 2D shows that both the CFA and RFA were strongly activated with similar amplitudes [RFA, 0.657 ± 0.018; CFA, 0.653 ± 0.017 (ΔF/F)norm], whereas Vib activation was significantly weaker [0.36 ± 0.019 (ΔF/F)norm, p < 0.01]. Analysis of latency-to-peak effect indicated that the optical signal in CFA peaked 23.8 ± 0.8 ms after VTA stimulation, which was significantly faster than those in RFA (27.8 ± 0.46 ms, p < 0.01) and Vib (29.8 ± 1.0 ms, p < 0.01) (Fig. 2E). These results suggest that the VTA-evoked response first appears in the CFA of the M1 and spreads toward the RFA. The CFA and RFA are thought to be equivalent to the M1 hand area and the premotor/supplementary motor area in primates, respectively (Rouiller et al., 1993).
Effects of drugs on the VTA-evoked neuronal response
VSD imaging of VTA-evoked neuronal activity was performed after the topical application of the non-NMDA glutamate receptor antagonist CNQX, the GABAA receptor antagonist bicuculline, or the D1/D2 dopamine receptor antagonists SCH 23390 and sulpiride. Figure 3A shows an example of the evoked activity before (top) and after (bottom) the application of CNQX. Both the excitatory and inhibitory neuronal activities were completely blocked after CNQX application. Partial recovery was observed after 2 h of washout (Fig. 3A, top right). Figure 3B shows the result before (top) and after (bottom) the application of bicuculline. Bicuculline enhanced the excitatory neuronal activity, with a threefold larger peak amplitude of the optical signal compared with that of the control. On the contrary, the inhibitory neuronal activity completely disappeared after bicuculline treatment. Figure 3C shows the effect of dopamine receptor antagonists on the VTA-evoked response. Blocking the DA receptors had no effect on excitatory–inhibitory neuronal activity. These results confirmed that VTA-evoked excitatory and inhibitory responses are elicited by glutamate and GABA, respectively. In addition, our data suggest that the inhibitory activity is produced by activation of GABAergic interneurons within the M1, rather than a direct GABAergic projection from the VTA (Carr and Sesack, 2000; Watanabe et al., 2009).
Figure 3.
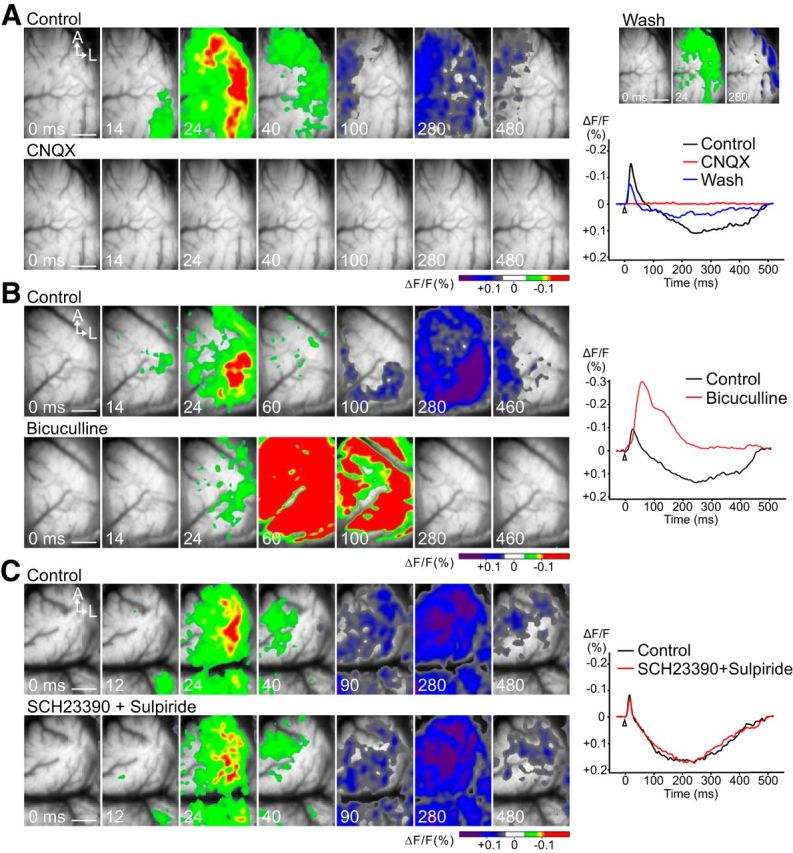
VSD imaging of VTA-evoked neuronal activity in the M1 before and after application of CNQX, bicuculline, or a D1/D2 receptor antagonist to the cortical surface. A, Neuronal activity completely disappeared after CNQX application. Top right panels, The recovered response after CNQX washout. B, Bicuculline completely eliminated inhibitory neuronal activity and greatly enhanced the excitatory response. C, The D1 receptor antagonist SCH 23390 and the D2 receptor antagonist sulpiride had no effect. VSD imaging was performed 1 h after the administration of dopamine antagonists. Traces to the right of the images represent the time course of the recorded optical signals. Scale bar, 1.0 mm.
Excitatory–inhibitory neuronal activity is abolished after lesion of dopamine neurons in VTA
To investigate the contribution of DA neurons in the neuronal activities of the M1, VSD imaging was applied to unilateral 6-OHDA-lesioned rats (n = 8; see Fig. 5). First, we examined the distribution of DA terminals within M1 of the control animals. In the normal M1, TH-positive fibers were prominent in the deep cortical layer but were detected in all other layers (Fig. 4). After unilateral 6-OHDA treatment, TH-stained sections were collected from the VTA and M1. Histological examples of VTA and M1 sections are shown in Figure 5B and Figure 5C, respectively. Densitometry confirmed significantly less TH staining in the 6-OHDA-treated VTA compared with the intact side (the density ratio of lesioned/intact VTA was 0.29 ± 0.13, p < 0.01, n = 6; Fig. 5B). Immunofluorescence staining also showed a reduction in TH positivity in the 6-OHDA-lesioned side of M1 deep layers (Fig. 5C). VSD imaging revealed that single-pulse stimulation of the lesioned VTA did not evoke any neuronal activities in M1 (Fig. 5D, top). This result strongly indicates that the VTA-evoked response in the M1 originates from DA neurons in the VTA. In this experiment, we routinely applied electrical stimulation to the contralateral forelimb (VTA-intact side) and then checked the sensorimotor response in the imaging cortex (Fig. 5A, D, bottom). The forelimb stimulation (600 μA, 1 pulse/ms) activated the caudolateral part of the imaged cortex, suggesting that this cortex was in physiologically good condition for reporting optical signals (Fig. 5D, bottom).
Figure 5.

Stimulation of 6-OHDA-treated VTA fails to evoke neuronal activity in M1. A, Schematic view of the experimental design. Electrical stimulation was applied to the 6-OHDA-treated VTA or the forelimb of the VTA-intact side. B, Micrograph of a TH-stained section, including VTA. An arrow in the 6-OHDA-administered VTA indicates the electrolytic lesion made at the stimulation site. C, Fluorescence image of a TH-stained section of M1 obtained from a 6-OHDA-lesioned rat (top). Cortical layers were delineated using Nissl staining of the same section (bottom). D, VSD imaging of neuronal activity after the stimulation of the VTA (top) or forelimb (bottom). Representative optical signals are shown on the right. No response was observed after stimulation of the 6-OHDA-treated VTA, whereas the forelimb stimulation activated the sensorimotor cortex, including the M1 and S1. The latter result indicates that diminished M1 activity in the case of VTA stimulation was not caused by damage to the imaging cortex. S1, Primary somatosensory cortex. Scale bars: B, 500 μm; C, D, 1.0 mm.
Figure 4.

Distribution of TH-positive fibers in the M1 of control rats. A, Photomicrograph of a TH-stained M1 section. B–D, Higher magnification of the regions shown in A. TH-positive fibers were rich in layer 6 and sparsely distributed in the other cortical layers. Scale bar, 100 μm.
Unilateral VTA stimulation induces excitatory–inhibitory neuronal activity not only in the ipsilateral but also in the contralateral M1 through the corpus callosum
We investigated whether unilateral VTA stimulation activates the contralateral motor area, the opposite hemisphere of the stimulus side. VSD imaging was performed in the bilateral M1 with a single-pulse stimulation to the VTA (n = 6 animals; Fig. 6A). Electrical stimulation of the VTA elicited neuronal activity not only in the ipsilateral but also in the contralateral M1 (Fig. 6B). The contralateral M1 response spread from caudolateral toward rostromedial neurons (Fig. 6C), which resembled the ipsilateral M1 response (Fig. 2A). The contralateral response appeared later than did the ipsilateral response in all animals, and the delay in peak latency was 11.7 ± 0.7 ms (n = 6) between the optical signals at the symmetrical coordinates of each hemisphere (Fig. 6D). Figure 6E shows that the peak amplitude of the optical signal was smaller in the contralateral than the ipsilateral M1 [contralateral, 0.559 ± 0.055; ipsilateral, 0.646 ± 0.069 (ΔF/F)norm]. Next, we injected the GABAA receptor agonist muscimol into the ipsilateral cortex with three or four penetrations (Fig. 6A). Muscimol injection into the ipsilateral M1 completely abolished the VTA-evoked activities in this side of the M1, but the neuronal activity in the contralateral M1 was sustained (Fig. 6F). These results indicate that the contralateral M1 response was not mediated by ipsilateral M1 neuron activity.
In subsequent experiments, we transected the CC, and VSD imaging was performed before and after CC transection (Fig. 7A). Nissl-stained sections showed that the CC was transected without damage to the underlying brain structures (Fig. 7B). Before CC transection, unilateral right-VTA stimulation induced neuronal responses in both the ipsilateral (right) and contralateral (left) M1 (Fig. 7C). After CC transection, even though the VTA-evoked response in the right M1 (ipsilateral to the stimulated VTA) remained intact (Fig. 7D, top), the neuronal activity in the left M1 (contralateral to the stimulated VTA) completely disappeared (Fig. 7D, middle panels). To determine whether the impaired response in the left M1 was the result of loss of the CC connections and not damage to this cortex, we stimulated the left-VTA instead of the right-VTA and then confirmed a normal ipsilateral response in the left M1 (Fig. 7D, bottom).
M1 layers receiving synaptic inputs from the VTA
To elucidate the laminar localization of synaptic inputs from the VTA, we conducted CSD analysis in the M1 (n = 4 animals). Laminar field potentials were recorded using 16-channel silicon probes in bilateral M1, in response to unilateral VTA stimulation. An example of voltage traces and CSD profiles is shown in Figure 8. In the M1 ipsilateral to the stimulated VTA, CSD analysis revealed three current sinks in layers 2/3, 5, and 6 immediately after stimulation (Fig. 8B). The earliest sink appeared in upper layer 5 and peaked 25.9 ± 1.9 ms after the stimulus onset. Subsequently, another weak sink was observed in layer 6. The other current sink in layer 2/3 showed a peak latency of 28.3 ± 1.3 ms, which was significantly delayed from the first sink (p < 0.01). The laminar CSD profile of the M1 response contralateral to the stimulated VTA was similar to that of the ipsilateral response (Fig. 8C), although the amplitudes of all current sinks largely decreased.
Figure 8.

CSD analysis in the bilateral M1. A, Photograph of the 16-channel electrode (left) and an example of a Nissl-stained section showing the needle track and the location of electrode contacts (right). B, C, Depth profiles of LFPs in response to VTA stimulation and corresponding CSD analyses in the ipsilateral and contralateral M1, respectively. In the CSD analyses, the size and the location of current sinks (reddish) and sources (bluish) are color-coded. The white triangle represents stimulus onset.
The contralateral M1 response also originates from dopamine neurons in the VTA
Using 6-OHDA-lesioned rats (n = 6 animals), we investigated the contribution of DA neurons in generating the contralateral M1 response. The VTA was lesioned unilaterally, and then VSD imaging was performed in the contralateral M1 after stimulation of the intact or lesioned VTA (Fig. 9A). An example of a TH-stained section is shown in Figure 9B: TH-positive neurons decreased by <20% in the lesioned side, and electrolytic lesions indicate the stimulated sites. VSD imaging revealed that electrical stimulation to the lesioned side of the VTA did not produce any neuronal response in the contralateral M1; however, typical excitatory–inhibitory neuronal activity was observed in this cortex when the intact VTA side was stimulated ipsilaterally (Fig. 9C). These results suggest that the contralateral M1 response, as well as the ipsilateral M1 response (Fig. 5), arises from VTA-DA neurons.
Figure 9.

The contralateral M1 response also arises from VTA-DA neurons. A, Schematic view of the experimental design. Unilateral 6-OHDA animals were used. Electrical stimulation was applied to 6-OHDA-treated VTA (right) or intact VTA (left). VSD imaging was performed in the left M1 (VTA-intact side). B, Photomicrograph of a TH-stained section, including electrolytic lesions at the stimulation sites (arrows in bilateral VTAs). C, Stimulation of the 6-OHDA-treated VTA failed to activate the contralateral M1 (top), although the cortex exhibited normal excitatory–inhibitory neuronal activity when the intact VTA was stimulated ipsilaterally (bottom). Traces under the images represent the time courses of the optical signals. Scale bars: B, 500 μm; C, 1.0 mm.
VTA stimulation modulates the EMG response
Finally, we investigated how VTA stimulation modulates M1 excitability when a motor command is issued. Here we used a pair-pulse stimulation protocol, in which ICMS to M1 was paired with VTA stimulation (Fig. 10A). The ICMS-evoked motor output was evaluated by recording upper limb muscle EMG. In the first situation, we verified that neither VTA stimulation nor M1 ICMS produced EMG activity (Fig. 10B,C) before applying the paired-pulse stimulation. Even though we adjusted the intensity of ICMS to just below the movement threshold, the under-threshold ICMS successfully elicited the EMG response when associated with VTA stimulation (Fig. 10D). The VTA stimulation was applied 10 ms before the ICMS in Figure 10D because the result of our VSD imaging indicated that the VTA-evoked excitatory response in the M1 started to evolve 10 ms after stimulation (Fig. 1B,C). In the second situation, the VTA stimulation was applied under the condition that M1 stimulation just above the movement threshold resulted in reproducible EMG responses (Fig. 10E). We then increased the interstimulus interval between VTA-M1 pairs and found that the ICMS-evoked EMG was completely suppressed when the interstimulus interval was 30 ms (Fig. 10F). The EMG response reappeared when the interstimulus interval was longer than 40 ms and was restored to control levels in 100–200 ms (Fig. 10G–I). Strong EMG suppression was reliably observed during the narrow time window when the conditioning VTA stimulation was preceded by 30–50 ms.
These results suggest that motor output from M1 is facilitated or inhibited, depending on the timing of VTA activation. To explain the time window of the EMG suppression by the preceding VTA stimulation, we calculated the time derivative of the VTA-induced optical signal (Fig. 10J). This is because Eriksson et al. (2008) demonstrated that the time derivative of the VSD signal was strongly correlated with the stimulus-evoked changes in the firing rate of neurons. As shown in Figure 10J, the time derivative signal was largely negative at 30–50 ms after stimulation, suggesting that the driving force of inhibition was stronger during this time window.
Discussion
The present study is the first to investigate the spatiotemporal dynamics of M1 activity after VTA stimulation. VSD imaging showed that VTA-DA neurons elicit a fast excitatory–inhibitory sequence of neuronal activity in bilateral M1, exhibiting prominent activity in forelimb motor areas. The VTA-induced M1 activity was able to modulate M1 output to the forelimb muscles.
The VTA-induced M1 response is characterized by an excitatory–inhibitory sequence
Although short-latency neural activity after DA neuron activation was reported in the PFC (Mercuri et al., 1985; Lavin et al., 2005; Watanabe et al., 2009), we present the first evidence of similar short-latency activity in the M1, as characterized by an excitatory–inhibitory sequence (Fig. 1). Because DA is thought to act as a slow modulator of cortical neurotransmission, multiple lines of evidence indicate that DA neurons corelease glutamate for fast signal transmission (Lapish et al., 2007). In the present study, the optically detected M1 response had an onset latency of ∼13 ms (Fig. 1), and the M1 response was blocked by a glutamate receptor antagonist, but not by a DA receptor antagonist (Fig. 3). Furthermore, the 6-OHDA-lesioned VTA failed to evoke M1 responses (Figs. 5 and 9). Our findings in the M1 are consistent with previous observations in the PFC (Lavin et al., 2005), suggesting that the M1 and PFC share certain characteristics common to the mesocortical DA projection system. Therefore, it seems reasonable to conclude that the fast excitatory M1 response was mediated by glutamate coreleased from VTA-DA neurons. However, several reports suggest that 6-OHDA destroys non-DA neurons (Michel and Hefti, 1990; Gorelova et al., 2012). There remains a possibility that the 6-OHDA treatment might have destroyed some non-DA neurons that might be involved in carrying the fast signals to M1. Future studies should incorporate techniques that selectively manipulate the activity of DA neurons, such as the optogenetic method to overcome this issue.
After the excitatory response, VTA stimulation induced an inhibitory response for ∼400 ms (Fig. 1). The result led us to hypothesize that M1 neurons during this period were strongly inhibited and had become difficult to fire. However, the ICMS-evoked motor output was easily produced in this inhibitory period. In contrast, motor output suppression was observed during the narrow time window when the VSD signals shifted rapidly from excitatory to inhibitory (Fig. 10). Although the inhibitory map of VSD imaging suggests that the population membrane potentials were shifted to hyperpolarized voltages, it does not directly demonstrate the strength of the driving force of the inhibition in that area (Eriksson et al., 2008). As Eriksson et al. (2008) suggested, if we assume that the driving force of the inhibition is represented as the time differential values of the VSD signals, it might well explain the existence of the EMG suppression period observed in this study (Fig. 10).
The forelimb motor area is the major target of activation
VSD imaging followed by ICMS mapping successfully demonstrated that the VTA-evoked activity was stronger in the forelimb areas of the motor cortex (Fig. 2). This observation seems to be consistent with reports by Hosp et al. (2009, 2011), who indicated that VTA-M1 DA projections help improve forelimb motor learning and affect the size of the forelimb motor representation. Furthermore, our imaging data revealed activity propagation from the CFA to the RFA (Fig. 2), which is consistent with the observation that the RFA receives strong projections from CFA layer 2/3 and/or layer 5a (Hira et al., 2013). According to our CSD analysis, the M1 receives synaptic inputs in upper layer 5 and then layer 2/3 successively after VTA stimulation (Fig. 8). Therefore, the VTA likely sends a neural signal first to the CFA, and thereafter, some processed information is relayed to the RFA via corticocortical connections.
Our CSD analysis revealed that the first current sink, presumably reflecting direct synaptic input from the VTA, occurred in upper layer 5. However, the densest DA afferents were distributed in layer 6 (Fig. 4), as reported by Descarries et al. (1987). This discrepancy may be the result of the existence of two classes of DA terminals: typical synaptic and varicose-like (nonsynaptic) terminals (Descarries et al., 2008). The synaptic DA terminals are hypothesized to be used for glutamate corelease, whereas the DA-containing varicosities accomplish volume transmission (Trudeau, 2004). Because the two types of DA terminals can be located at sites distant from each other, it is not surprising that the M1 receives fast signals from VTA in its upper layer 5 via synaptic DA terminals. This idea parallels the observation that intense vesicular glutamate transporter 2-immunopositive staining is observed in rat layer 4 and superficial 5 (Kaneko et al., 2002).
Parallel activation of the bilateral M1
Unilateral VTA stimulation induced an excitatory–inhibitory sequence in the bilateral M1 (Fig. 6). It would be expected that the evoked response in the contralateral hemisphere is mediated by the ipsilateral M1 because rich commissural connections between motor areas have been identified (Donoghue and Parham, 1983). However, our imaging results indicated that the contralateral M1 response occurred regardless of the presence of ipsilateral M1 activation (Fig. 6). In addition, CSD analysis revealed that the contralateral and ipsilateral M1 responses had similar depth profiles as did VTA stimulation (Fig. 8). These results suggest that unilateral VTA drives bilateral M1 via parallel projections. This possibility is supported by the anatomical findings of Hosp et al. (2011), who injected a retrograde tracer into the forelimb area of M1 and reported that 12% of retrogradely labeled DA neurons were located in the contralateral VTA. One could speculate that the DA projections to the contralateral hemisphere may be used for compensation in the case of unilateral VTA damage. This notion comes from the observation that a unilateral VTA lesion facilitates the activity in the opposite side of the intact VTA (Trojniar and Staszewska, 1994; Majkutewicz et al., 2010).
Functional significance of fast signaling from VTA-DA neurons to M1
According to conventional theories of DA reward signaling, the phasic activity of VTA-DA neurons encodes temporally precise information about reward or reward predictions, and then this information is transmitted to reward-related brain areas (Schultz, 1998, 2007). Roesch and Olson (2003) reported strong reward-related activity of premotor neurons in monkeys performing a memory-guided saccade task and concluded that this might be attributable to the monkey's motivation-dependent level of motor preparation or motor output. The findings of the present study, showing the presence of VTA-to-M1 signaling, suggest the possibility that the reward signals could be exploited at the most downstream processing of motor output. Because M1 activity was prominent in the forepaw areas, we speculate that the VTA-to-M1 signal is operative when rats struggle to perform skill- and dexterity-based special moves during motivation-dependent behavior (e.g., manipulating food items, such as thin pieces of pasta, with their paws). A recent study by Thabit et al. (2011) also seems to support this idea, as they reported that the reward signal modulated the excitability of the human primary motor cortex.
A possible role for the fast VTA-M1 signals is control of the precise timing of M1 neuron firing. VTA stimulation induces an immediate increase in firing of both pyramidal neurons (Lewis and O' Donnell, 2000; Seamans and Yang, 2004) and interneurons (Tseng et al., 2006) in the PFC. Supposing similar modulatory actions in the M1, the fast VTA-M1 signals may provide the temporal precision for spike timing that is necessary for coordinated motor activity in M1 neurons. The results of our EMG experiments (Fig. 10), in which the VTA activity modulated (facilitated or inhibited) the M1 output on a scale of several tens of milliseconds, could be explained in this context.
The importance of the long inhibition depicted by VSD imaging is unknown. The inhibitory force was not sufficient to abolish motor output (Fig. 10). However, we speculate that lowering the population membrane potentials might reduce the intrinsic neuronal noise in the M1. When involved with motor learning, the VTA might slightly silence the M1 for several hundreds of milliseconds to prepare for the succeeding generation of intended motor commands (Cohen and Sternad, 2009). Another possibility is that the inhibition might form the basis for generating synchronous activity in M1 neurons. Synchronous oscillations can be generated when networks of inhibitory interneurons are activated (Beierlein et al., 2000). The possible synchronous activity in M1 might encode information concerning motor learning, which could be transmitted to the dorsal striatum (Pennartz et al., 2009).
In conclusion, we showed here that DA neurons in the VTA transmit fast signals to the bilateral M1, consequently resulting in an excitatory–inhibitory M1 activity sequence. The current data could be important because they demonstrate that VTA-DA neurons, which encode reward-related information, transmit the fast signals to the last cortical stage of motor command processing. Further studies linking these data to behavioral experiments are necessary to elucidate the functional roles of fast VTA-M1 signaling and the potential impact of exploiting this signal pathway during rehabilitation of motor deficits.
Footnotes
This work was supported in part by the Ministry of Education, Culture, Sports, Science and Technology of Japan Grant-in-Aid for Scientific Research 22500375 to I.T. We thank Drs. Noriyuki Higo, Yumiko Watanabe, Fumihiro Shuto, and Setsuji Hisano for histological verification and valuable comments.
The authors declare no competing financial interests.
References
- Bayer HM, Glimcher PW. Midbrain dopamine neurons encode a quantitative reward prediction error signal. Neuron. 2005;47:129–141. doi: 10.1016/j.neuron.2005.05.020. [DOI] [PMC free article] [PubMed] [Google Scholar]
- Beierlein M, Gibson JR, Connors BW. A network of electrically coupled interneurons drives synchronized inhibition in neocortex. Nat Neurosci. 2000;3:904–910. doi: 10.1038/78809. [DOI] [PubMed] [Google Scholar]
- Bromberg-Martin ES, Matsumoto M, Hikosaka O. Dopamine in motivational control: rewarding, aversive, and alerting. Neuron. 2010;68:815–834. doi: 10.1016/j.neuron.2010.11.022. [DOI] [PMC free article] [PubMed] [Google Scholar]
- Carr DB, Sesack SR. GABA-containing neurons in the rat ventral tegmental area project to the prefrontal cortex. Synapse. 2000;38:114–123. doi: 10.1002/1098-2396(200011)38:2<114::AID-SYN2>3.0.CO;2-R. [DOI] [PubMed] [Google Scholar]
- Cohen RG, Sternad D. Variability in motor learning: relocating, channeling and reducing noise. Exp Brain Res. 2009;193:69–83. doi: 10.1007/s00221-008-1596-1. [DOI] [PMC free article] [PubMed] [Google Scholar]
- Descarries L, Lemay B, Doucet G, Berger B. Regional and laminar density of the dopamine innervation in adult-rat cerebral-cortex. Neuroscience. 1987;21:807–824. doi: 10.1016/0306-4522(87)90038-8. [DOI] [PubMed] [Google Scholar]
- Descarries L, Bérubé-Carrière N, Riad M, Bo GD, Mendez JA, Trudeau LE. Glutamate in dopamine neurons: synaptic versus diffuse transmission. Brain Res Rev. 2008;58:290–302. doi: 10.1016/j.brainresrev.2007.10.005. [DOI] [PubMed] [Google Scholar]
- Donoghue JP, Parham C. Afferent connections of the lateral agranular field of the rat motor cortex. J Comp Neurol. 1983;217:390–404. doi: 10.1002/cne.902170404. [DOI] [PubMed] [Google Scholar]
- Eriksson D, Tompa T, Roland PE. Non-linear population firing rates and voltage sensitive dye signals in visual areas 17 and 18 to short duration stimuli. PLoS One. 2008;3:e2673. doi: 10.1371/journal.pone.0002673. [DOI] [PMC free article] [PubMed] [Google Scholar]
- Gioanni Y, Lamarche M. A reappraisal of rat motor cortex organization by intracortical microstimulation. Brain Res. 1985;344:49–61. doi: 10.1016/0006-8993(85)91188-6. [DOI] [PubMed] [Google Scholar]
- Gorelova N, Mulholland PJ, Chandler LJ, Seamans JK. The glutamatergic component of the mesocortical pathway emanating from different subregions of the ventral midbrain. Cereb Cortex. 2012;22:327–336. doi: 10.1093/cercor/bhr107. [DOI] [PMC free article] [PubMed] [Google Scholar]
- Hira R, Ohkubo F, Tanaka YR, Masamizu Y, Augustine GJ, Kasai H, Matsuzaki M. In vivo optogenetic tracing of functional corticocortical connections between motor forelimb areas. Front Neural Circuits. 2013;7:55. doi: 10.3389/fncir.2013.00055. [DOI] [PMC free article] [PubMed] [Google Scholar]
- Hosp JA, Molina-Luna K, Hertler B, Atiemo CO, Luft AR. Dopaminergic modulation of motor maps in rat motor cortex: an in vivo study. Neuroscience. 2009;159:692–700. doi: 10.1016/j.neuroscience.2008.12.056. [DOI] [PubMed] [Google Scholar]
- Hosp JA, Pekanovic A, Rioult-Pedotti MS, Luft AR. Dopaminergic projections from midbrain to primary motor cortex mediate motor skill learning. J Neurosci. 2011;31:2481–2487. doi: 10.1523/JNEUROSCI.5411-10.2011. [DOI] [PMC free article] [PubMed] [Google Scholar]
- Iijima T, Witter MP, Ichikawa M, Tominaga T, Kajiwara R, Matsumoto G. Entorhinal–hippocampal interactions revealed by real-time imaging. Science. 1996;272:1176–1179. doi: 10.1126/science.272.5265.1176. [DOI] [PubMed] [Google Scholar]
- Kaneko T, Fujiyama F, Hioki H. Immunohistochemical localization of candidates for vesicular glutamate transporters in the rat brain. J Comp Neurol. 2002;444:39–62. doi: 10.1002/cne.10129. [DOI] [PubMed] [Google Scholar]
- Lapish CC, Kroener S, Durstewitz D, Lavin A, Seamans JK. The ability of the mesocortical dopamine system to operate in distinct temporal modes. Psychopharmacology (Berl) 2007;191:609–625. doi: 10.1007/s00213-006-0527-8. [DOI] [PMC free article] [PubMed] [Google Scholar]
- Lavin A, Nogueira L, Lapish CC, Wightman RM, Phillips PE, Seamans JK. Mesocortical dopamine neurons operate in distinct temporal domains using multimodal signaling. J Neurosci. 2005;25:5013–5023. doi: 10.1523/JNEUROSCI.0557-05.2005. [DOI] [PMC free article] [PubMed] [Google Scholar]
- Lewis BL, O'Donnell P. Ventral tegmental area afferents to the prefrontal cortex maintain membrane potential ‘up’ states in pyramidal neurons via D(1) dopamine receptors. Cereb Cortex. 2000;10:1168–1175. doi: 10.1093/cercor/10.12.1168. [DOI] [PubMed] [Google Scholar]
- Luft AR, Schwarz S. Dopaminergic signals in primary motor cortex. Int J Dev Neurosci. 2009;27:415–421. doi: 10.1016/j.ijdevneu.2009.05.004. [DOI] [PubMed] [Google Scholar]
- Majkutewicz I, Cecot T, Jerzemowska G, Myœliñska D, Pluciñska K, Trojniar W, Wrona D. Lesion of the ventral tegmental area amplifies stimulation-induced Fos expression in the rat brain. Brain Res. 2010;1320:95–105. doi: 10.1016/j.brainres.2010.01.009. [DOI] [PubMed] [Google Scholar]
- Mercuri N, Calabresi P, Stanzione P, Bernardi G. Electrical stimulation of mesencephalic cell groups (A9–A10) produces monosynaptic excitatory potentials in rat frontal cortex. Brain Res. 1985;338:192–195. doi: 10.1016/0006-8993(85)90267-7. [DOI] [PubMed] [Google Scholar]
- Michel PP, Hefti F. Toxicity of 6-hydroxydopamine and dopamine for dopaminergic neurons in culture. J Neurosci Res. 1990;26:428–435. doi: 10.1002/jnr.490260405. [DOI] [PubMed] [Google Scholar]
- Mitzdorf U. Current source-density method and application in cat cerebral cortex: investigation of evoked potentials and EEG phenomena. Physiol Rev. 1985;65:37–100. doi: 10.1152/physrev.1985.65.1.37. [DOI] [PubMed] [Google Scholar]
- Molina-Luna K, Pekanovic A, Röhrich S, Hertler B, Schubring-Giese M, Rioult-Pedotti MS, Luft AR. Dopamine in motor cortex is necessary for skill learning and synaptic plasticity. PLoS One. 2009;4:e7082. doi: 10.1371/journal.pone.0007082. [DOI] [PMC free article] [PubMed] [Google Scholar]
- Nicholson C, Freeman JA. Theory of current source-density analysis and determination of conductivity tensor for anuran cerebellum. J Neurophysiol. 1975;38:356–368. doi: 10.1152/jn.1975.38.2.356. [DOI] [PubMed] [Google Scholar]
- Nishimura Y, Onoe H, Onoe K, Morichika Y, Tsukada H, Isa T. Neural substrates for the motivational regulation of motor recovery after spinal-cord injury. PLoS One. 2011;6:e24854. doi: 10.1371/journal.pone.0024854. [DOI] [PMC free article] [PubMed] [Google Scholar]
- Paxinos G, Watson C. The rat brain in sterotaxic coordinates. 4th ed. San Diego: Academic; 1998. [Google Scholar]
- Pennartz CM, Berke JD, Graybiel AM, Ito R, Lansink CS, van der Meer M, Redish AD, Smith KS, Voorn P. Corticostriatal interactions during learning, memory processing, and decision making. J Neurosci. 2009;29:12831–12838. doi: 10.1523/JNEUROSCI.3177-09.2009. [DOI] [PMC free article] [PubMed] [Google Scholar]
- Roesch MR, Olson CR. Impact of expected reward on neuronal activity in prefrontal cortex, frontal and supplementary eye fields and premotor cortex. J Neurophysiol. 2003;90:1766–1789. doi: 10.1152/jn.00019.2003. [DOI] [PubMed] [Google Scholar]
- Rouiller EM, Moret V, Liang F. Comparison of the connectional properties of the two forelimb areas of the rat sensorimotor cortex: support for the presence of a premotor or supplementary motor cortical area. Somatosens Mot Res. 1993;10:269–289. doi: 10.3109/08990229309028837. [DOI] [PubMed] [Google Scholar]
- Ruscher K, Kuric E, Wieloch T. Levodopa treatment improves functional recovery after experimental stroke. Stroke. 2012;43:507–513. doi: 10.1161/STROKEAHA.111.638767. [DOI] [PubMed] [Google Scholar]
- Schultz W. Predictive reward signal of dopamine neurons. J Neurophysiol. 1998;80:1–27. doi: 10.1152/jn.1998.80.1.1. [DOI] [PubMed] [Google Scholar]
- Schultz W. Getting formal with dopamine and reward. Neuron. 2002;36:241–263. doi: 10.1016/S0896-6273(02)00967-4. [DOI] [PubMed] [Google Scholar]
- Schultz W. Behavioral dopamine signals. Trends Neurosci. 2007;30:203–210. doi: 10.1016/j.tins.2007.03.007. [DOI] [PubMed] [Google Scholar]
- Seamans JK, Yang CR. The principal features and mechanisms of dopamine modulation in the prefrontal cortex. Prog Neurobiol. 2004;74:1–58. doi: 10.1016/j.pneurobio.2004.05.006. [DOI] [PubMed] [Google Scholar]
- Takashima I, Ichikawa M, Iijima T. High-speed CCD imaging system for monitoring neural activity in vivo and in vitro, using a voltage-sensitive dye. J Neurosci Methods. 1999;91:147–159. doi: 10.1016/S0165-0270(99)00093-X. [DOI] [PubMed] [Google Scholar]
- Thabit MN, Nakatsuka M, Koganemaru S, Fawi G, Fukuyama H, Mima T. Momentary reward induce changes in excitability of primary motor cortex. Clin Neurophysiol. 2011;122:1764–1770. doi: 10.1016/j.clinph.2011.02.021. [DOI] [PubMed] [Google Scholar]
- Trojniar W, Staszewska M. Unilateral damage to the ventral tegmental area facilitates feeding induced by stimulation of the contralateral ventral tegmental area. Brain Res. 1994;641:333–340. doi: 10.1016/0006-8993(94)90163-5. [DOI] [PubMed] [Google Scholar]
- Trudeau LE. Glutamate co-transmission as an emerging concept in monoamine neuron function. J Psychiatry Neurosci. 2004;29:296–310. [PMC free article] [PubMed] [Google Scholar]
- Tseng KY, Mallet N, Toreson KL, Le Moine C, Gonon F, O'Donnell P. Excitatory response of prefrontal cortical fast-spiking interneurons to ventral tegmental area stimulation in vivo. Synapse. 2006;59:412–417. doi: 10.1002/syn.20255. [DOI] [PMC free article] [PubMed] [Google Scholar]
- Watanabe Y, Kajiwara R, Takashima I. Optical imaging of rat prefrontal neuronal activity evoked by stimulation of the ventral tegmental area. Neuroreport. 2009;20:875–880. doi: 10.1097/WNR.0b013e32832c5e98. [DOI] [PubMed] [Google Scholar]