

Abstract
The medial nucleus of the amygdala (MeA) plays a key role in innate emotional behaviors by relaying olfactory information to hypothalamic nuclei involved in reproduction and defense. However, little is known about the neuronal components of this region or their role in the olfactory-processing circuitry of the amygdala. Here, we have characterized neurons in the posteroventral division of the medial amygdala (MePV) using the GAD67-GFP mouse. Based on their electrophysiological properties and GABA expression, unsupervised cluster analysis divided MePV neurons into three types of GABAergic (Types 1–3) and two non-GABAergic cells (Types I and II). All cell types received olfactory synaptic input from the accessory olfactory bulb and, with the exception of Type 2 GABAergic neurons, sent projections to both reproductive and defensive hypothalamic nuclei. Type 2 GABAergic cells formed a chemically and electrically interconnected network of local circuit inhibitory interneurons that resembled neurogliaform cells of the piriform cortex and provided feedforward inhibition of the olfactory-processing circuitry of the MeA. These findings provide a description of the cellular organization and connectivity of the MePV and further our understanding of amygdala circuits involved in olfactory processing and innate emotions.
Keywords: amygdala, predator, reproductive, smell
Introduction
The amygdala is a heterogeneous structure best known for its role in emotional behaviors (Phelps and LeDoux, 2005; LeDoux, 2007). This understanding comes from studies of neural circuits that engage the basolateral and central amygdala in acquired emotions, particularly conditioned fear (Phelps and LeDoux, 2005; Pare and Duvarci, 2012). However, despite the well-known role of the amygdala in innate emotional behaviors, such as responses to a sexual partner, an aggressive intruder, or a predator, little is known about the neural basis of these processes in the amygdala (Newman, 1999; Nelson and Trainor, 2007; LeDoux, 2012).
The medial nucleus of the amygdala (MeA) plays a central role in generating innate emotional responses to chemosignals (Lehman et al., 1980; Fernandez-Fewell and Meredith, 1994; McGregor et al., 2004; Brennan and Zufall, 2006; LeDoux, 2012). Olfactory information from the accessory olfactory bulb is sent directly to the MeA, where it is further processed, and relayed to hypothalamic regions that control defensive and reproductive behaviors (Scalia and Winans, 1975; Canteras et al., 1995; Choi et al., 2005). The MeA can be divided into four cytoarchitectonically distinct divisions, with differences in their afferent connections, response to chemosignals, and projections to the hypothalamus (Canteras et al., 1995; Meredith and Westberry, 2004; Choi et al., 2005; Martinez-Marcos, 2009). At the posterior level, a clear functional segregation exists between the dorsal (MePD) and ventral (MePV) nuclei, with the former being primarily involved in reproductive and the latter in defensive behaviors (Meredith and Westberry, 2004; Choi et al., 2005), particularly in predator fear (Dielenberg et al., 2001; McGregor et al., 2004; Martinez et al., 2011).
Little is known about MeA neuron cell types and their functional connectivity. Neuroanatomical studies (McDonald, 1992; Swanson and Petrovich, 1998) have suggested that this region contains a homogeneous population of neurons with striatal-like features. New data, however, suggest that MeA neurons are heterogeneous and distinct from those in the striatum (Bian et al., 2008; Bupesh et al., 2011). Although recent studies have described electrophysiological properties of MeA neurons (Bian et al., 2008; Bian, 2013), they have pooled data from different MeA divisions; thus, the organization of these neurons is not clear, and their physiological, morphological, and neurochemical properties are not well understood. Moreover, although both GABAergic and putative glutamatergic neurons in this region appear to receive olfactory input (Bian et al., 2008), the role of these distinct populations in the olfactory-processing circuitry of the MeA is not known. In the current study, we have investigated the properties of MeA neurons and their connections within the posteroventral division (MePV), using the GAD67-GFP mouse (Tamamaki et al., 2003). We describe a variety of different cell types, all of which receive direct synaptic input from the accessory olfactory bulb (AOB), and show that most types of neuron, both GABAergic and non-GABAergic, project to the hypothalamus. Furthermore, we identify one class of GABAergic inhibitory interneurons that forms an interconnected network of cells and provides feedforward inhibition of the olfactory-processing circuitry of the MeA.
Materials and Methods
Slice preparation.
Acute brain slices were prepared from 35- to 50-day-old male, heterozygous GAD67-GFP (Δneo) mice (referred to as GAD67-GFP mouse here), in which enhanced green fluorescent protein (GFP) is expressed under the control of the promoter for the GABA-synthesizing enzyme, GAD67 (Tamamaki et al., 2003). These animals have normal behavior and physiology and have been widely used for targeted recording or labeling of GABAergic neurons (Polepalli et al., 2010; Sosulina et al., 2010; Suzuki and Bekkers, 2010a). The reason for the exclusive use of males in this study was to minimize the effect of sex and hormonal variations in the sexually dimorphic MeA (Rasia-Filho et al., 2004; Cooke and Woolley, 2005; Cooke et al., 2007). After deep isoflurane anesthesia, mice were decapitated in accordance with the guidelines of the University of Queensland Animal Ethics Committee. Brains were rapidly removed and placed into ice-cold, oxygenated cutting solution containing the following (in mm): 87 NaCl, 50 sucrose, 25 glucose, 25 NaHCO3, 2.5 KCl, 4 MgCl2, 0.5 CaCl2, and 1.2 NaH2PO4. Coronal slices (300 μm thick) containing the medial amygdala were cut using a vibrating microslicer (Leica VT1000S, Leica Biosystems) and incubated at 35°C for 30 min in oxygenated (bubbled with carbogen) artificial CSF (aCSF) comprising the following (in mm): 118 NaCl, 10 glucose, 25 NaHCO3, 2.5 KCl, 1.3 MgCl2, 2.5 CaCl2, and 1.2 NaH2PO4. Slices were then allowed to equilibrate at room temperature for at least 30 min before recordings were made. Drugs were bath applied at the following concentrations (in μm): 10 NBQX (Tocris Bioscience), 100 picrotoxin (Sigma).
Electrophysiology.
Slices were superfused with oxygenated aCSF maintained at 32°C–34°C. Whole-cell patch-clamp recordings were made from the soma of both GFP+ and GFP− neurons in the MePV (bregma −1.34 to bregma −1.82) (Paxinos and Franklin, 2001), using infrared differential interference contrast video microscopy with an upright microscope (BX50WI, Olympus) equipped with fluorescence attachments. Recording electrodes (3–5 mΩ) were pulled from borosilicate glass (TGC150, Harvard Apparatus) and filled with internal solution containing the following (in mm): 135 KMeSO4, 8 NaCl, 10 HEPES, 2 Mg2-ATP, 0.3 Na3-GTP, 0.3 EGTA, and 0.3% biocytin (pH, 7.3 with KOH; osmolarity, ∼ 290 mOsm). Current- or voltage-clamp recordings were made using a patch-clamp amplifier (MultiClamp 700B, Molecular Devices), low-pass filtered at 6 kHz, and digitized at 20 kHz using a data acquisition unit (ITC-16 interface, InstruTECH/HEKA) under the control of AxographX (Axograph Scientific, version 1.4.4).
Intrinsic membrane properties were measured in current clamp after adjusting bridge balance and capacitance neutralization. Firing properties were obtained in <3 min after obtaining whole-cell configuration. Membrane potential was adjusted to −60 mV by current injection, and 800 ms current step injections were delivered in 20–25 pA increments. In most cases, current injections were in the range of −200 to 400 pA. Correction for the liquid junction potential, measured to be −8 mV, was not applied to these recordings.
Accessory olfactory bulb afferents were stimulated using a concentric bipolar stimulating electrode placed in the ventral surface of the MePV, which largely contains afferents from mitral/tufted cells of the AOB (see Fig. 10) (von Campenhausen and Mori, 2000; Bian et al., 2008); however, small contributions from other putative inputs cannot be ruled out. The bipolar stimulator was made from a patch electrode (∼3–5 μm tip diameter), coated with silver paint and filled with aCSF. Paired recordings were made from neurons separated by 30–150 μm. Synaptic connections were tested by evoking an action potential (AP) in one neuron (0.05–0.1 Hz) while the postsynaptic neuron was voltage clamped at a holding potential of −40 or −60 mV. Electrical connections were tested by hyperpolarizing one neuron with a 200 pA negative current injection step while recording membrane potential responses of the other. Connections were tested in both directions.
Figure 10.

Type 2 GABAergic cells provide feedforward inhibition in the olfactory circuitry of the MePV. A, Projection neurons in the MePV receive synaptic input from the AOB. Recordings were made from GFP+ (Types 1 and 3) and GFP− (Types I and II) neurons in the cellular layer (lc). Stimulation of AOB afferents evoked EPSCs in all types of electrophysiologically identified neurons. Traces are EPSCs recorded in a Type I GFP− (black trace, left) and a Type 1 GFP+ cell (green trace, right) at −65 mV holding potential. EPSCs were blocked by the AMPA/kainate receptor antagonist NBQX (10 μm). B, A delayed IPSC was evoked in both GFP− and GFP+ neurons in response to stimulation of AOB afferents. Traces represent averaged AOB-evoked postsynaptic currents in a Type I GFP− (left, black) and a Type 1 GFP+ cell (right, green) held at −50 mV. Disynaptic IPSCs were blocked by picrotoxin (100 μm) (red traces). C, Type 2 GFP+ cells also receive direct olfactory input from AOB afferents. AOB stimulation evoked a monosynaptic EPSC (green) that was blocked by NBQX (10 μm) (red). D, Subthreshold and suprathreshold AOB-evoked responses in Type 2 GFP+ cells precede those in GFP− neurons. Paired recordings were made from a Type 2 GFP+ (green) and a GFP− cell (either Type I or Type II, black), and AOB afferents stimulated electrically (schematic). Subthreshold EPSPs were evoked with lower stimulation intensities (20–50 V) (black and dark green traces), whereas stronger stimulations (60–70 V) evoked suprathreshold responses with superimposed APs (gray and light green traces, insets). AOB-evoked APs in Type 2 cell preceded those in the GFP− cell. E, Mean subthreshold EPSPs from the pair of cells shown in D. AOB-evoked postsynaptic responses in the two neurons had distinct kinetics. F–I, Summary data from all recorded pairs. AOB-evoked EPSPs in Type 2 cells (green) had a faster onset time (F), rise time (10%–90% peak amplitude, G), and a larger peak amplitude (H). Moreover, AOB-evoked APs first appeared in Type 2 cells (I). *p < 0.05 (paired Student's t test). **p < 0.01 (paired Student's t test). ***p < 0.001 (paired Student's t test).
Electrophysiological analysis.
Only cells with a resting membrane potential more negative than −55 mV and an access resistance <20 mΩ were included in the analysis. To classify neurons electrophysiologically, the following 17 parameters were used: (1) resting membrane potential (Vrest), recorded immediately after obtaining whole-cell configuration; (2) input resistance (Rin), estimated from the slope of a linear fit to the steady-state voltage changes in response to 800 ms hyperpolarizing current steps; (3) membrane time constant (τm), derived from a single exponential fit to the falling phase of the voltage change in response to a 25 pA, 800 ms hyperpolarizing current step; (4) sag ratio, calculated as Vsteady/Vhyp, where Vhyp was the peak hyperpolarization and Vsteady the steady-state voltage response measured at the end of a 200 pA, 800 ms hyperpolarizing current step (Suzuki and Bekkers, 2010b); (5) rheobase, defined as the amplitude of the 800 ms depolarizing current step that evoked the first AP; all AP parameters were measured on the first AP at rheobase; (6) AP threshold, measured as the membrane potential (Vm) at which dVm/dt first reached 20 V/s; (7) AP latency, defined as the delay between the beginning of the current step at rheobase and the peak of the first AP; (8) AP amplitude, defined as the distance between the peak amplitude of AP and AP threshold; (9) AP half-width (HW), defined as the AP duration halfway between the AP threshold and AP peak. The peak and duration of the afterhyperpolarizations (AHPs) of single APs were measured on the first AP at rheobase. The fast AHP (fAHP) was defined as the largest hyperpolarization after the AP down slope. The medium AHP (mAHP) was defined as the largest hyperpolarization seen 10–50 ms after the AP peak; the amplitudes of (10) fast (fAHP amp) and (11) medium AHPs (mAHP amp), defined as the amplitude difference between AP threshold and the AHP peak; the latencies of (12) fast (fAHP latency) and (13) medium AHPs (mAHP latency), defined as the time difference between AP threshold and the AHP peak (Karagiannis et al., 2009); (14) AP broadening, calculated at twice-threshold current injection (2T) step as (HW2 − HW1)/HW1, where HW1 and HW2 were the half-width of the first and second APs, respectively; (15) AP amplitude accommodation, measured as (A1 − A2)/ A1, where A1 and A2 were the amplitudes of the first and second APs, respectively (Cauli et al., 2000); (16) firing frequency accommodation, defined as the averaged measurements at 2T and (2T + 25 pA) current steps and quantified as ISIlast − ISI first/ISI first, where ISI first and ISI last were the interspike intervals between the first two and the last two APs, respectively; and (17) maximal firing frequency, measured as the averaged instantaneous firing frequency during the first 200 ms response to the largest current injection step before AP failures and reduction of APs amplitude were observed.
Analysis of postsynaptic events was performed on ensemble-averaged responses from a minimum of 5 sweeps. Rise time of postsynaptic events was measured from 10% to 90% of the peak amplitude of the synaptic response. Decay time of IPSCs was measured by a single exponential fit to the current decay at a holding potential of −40 mV. Onset of AOB-evoked APs or EPSPs was measured as the delay between the stimulus delivery and the AP peak, or the foot of the EPSP, respectively.
Statistical analysis.
The above-mentioned electrophysiological parameters and the presence or absence of GFP expression were used for cluster analysis. This analysis was performed on 144 cells for which all 17 parameters could be measured. Morphological and immunohistochemical properties were not used for cluster analysis because these parameters were not obtained in every recorded cell. After standardization of data, an unsupervised hierarchical cluster analysis was performed in STATISTICA 10 (StatSoft), using Euclidean distances and Ward's method of linkage rule (Ward, 1963; Cauli et al., 2000; Karagiannis et al., 2009). The final number of clusters was determined based on the Thorndike procedure, which has been used previously to define the limit between clusters (Thorndike, 1953; Cauli et al., 2000; Sosulina et al., 2006). In this method, the average within-group distance is plotted at each stage of clustering, resulting in a drop in the average within-group distance as the number of clusters increases. The final number of clusters is then decided at the stage where the maximal drop is reached in this plot.
For comparisons between clusters, a one-way ANOVA test with a Bonferroni post hoc correction was applied. A two-tailed Student's t test was used for comparison between paired and unpaired observations. Except for cluster analysis, all statistical tests were performed in Prism 6 (GraphPad Software). Differences were considered statistically significant at p < 0.05. All results are presented as mean ± SEM.
Morphological analysis.
At the end of each recording, the patch electrode was carefully removed from the soma of the biocytin-filled cell. The slice was fixed in 4% PFA in phosphate buffer (PB) for 1 h and resectioned at 100 μm to assist penetration of the reagents and improve subsequent imaging. After a 3 × 10 min wash with 0.1 m PBS, pH 7.4, containing 0.1% Triton X-100, slices were incubated with either streptavidin-conjugated AlexaFluor-568 or -647 (1:1000, Invitrogen) for 5 h at room temperature. The visualized neuron was imaged on a confocal laser-scanning microscope (LSM510 META, Zeiss), and a 3D reconstruction of morphology was obtained off-line using Neurolucida (MBF Bioscience). Axons were distinguished from dendrites based on their small diameter, lack of tapering, lack of spines, and presence of “en passant” boutons. Neuronal reconstructions were limited to slices containing only one recorded neuron.
Morphological analysis was performed using NeuroExplorer (MBF Bioscience). Eight morphological features were quantified: soma surface area and soma volume, number of primary dendrites, number of dendritic and axonal endings, and total dendritic length. Sholl analysis (Sholl, 1953) was performed by superimposing concentric circles, centered at the soma, at 25 μm increments. The number of dendritic/axonal intersections within each circle was plotted against its radius, and dendritic/axonal field was defined as the radius of the furthest Sholl circle that contained these processes. Dendritic spines were counted manually over a 50 μm length of the proximal dendrite, starting 30–50 μm from the soma and moving distally.
Immunohistochemistry.
Mice (minimum of 3 for each primary antibody) were deeply anesthetized with urethane (1 mg/g, i.p.) and perfused transcardially with 0.1% chilled sodium nitrate in PBS, followed by 4% PFA in PB. Brains were removed and postfixed in the same fixative for 2 h at room temperature. The 50- to 100-μm-thick coronal sections containing the MeA were cut and stored in PBS with 0.05% sodium azide until further processing. For immunolabeling, slices were first washed in PBS containing Triton X-100 (0.1%–0.3%), then incubated in a 3% BSA solution made in PBS for 1 h. They were then incubated with selected primary antibodies diluted in a PBS solution containing 0.1% BSA, 0.1% Triton-X, and 0.05% sodium azide for another 48–72 h. Slices were again washed in PBS (3 × 10 min) before 3 h of incubation in the corresponding species-specific fluorescent-tagged secondary antibodies. All procedures were conducted at room temperature. After final washes in PBS (3 × 10 min), slices were briefly incubated in the nuclear stain DAPI before being mounted in 50% Glycerol in PBS and coverslipped. Slices containing retrograde tracers were mounted in saline. All fluorescence immunolabeling was visualized and imaged on a confocal laser-scanning microscope. Quantification of markers and tracers was performed on image stacks using Fiji (Schindelin et al., 2012).
The following primary antibodies were used: mouse anti-calbindin (1:5000, Sigma), rabbit anti-calbindin (1:2000, Sigma), rabbit anti-calretinin (1:5000, Swant), mouse anti-CCK (1:5000, Gordon Ohning, University of California, Los Angeles), rabbit anti-GABA (1:2000, Sigma), chicken anti-GFP (1:4000, Millipore Bioscience Research Reagents/Millipore), mouse anti-GFP (1:4000, Millipore Bioscience Research Reagents/Millipore), rabbit anti-GFP (1:4000, Millipore Bioscience Research Reagents/Millipore), mouse anti-NeuN (mouse, 1:1000, Millipore Bioscience Research Reagents/Millipore), mouse anti-parvalbumin (1:2000, Sigma), mouse anti-somatostatin (1:5000, Victoria Conlin, Vertex Pharmaceuticals), and rabbit anti-VIP (1:5000, Immunostar). Secondary antibodies (1:1000) included biotinylated donkey anti-chicken IgG (Jackson ImmunoResearch Laboratories), goat anti-mouse AlexaFluor-488, -568, and -647 (Invitrogen), and goat anti-rabbit AlexaFluor-488, -568, and -647 (Invitrogen).
Immunostaining of recorded cells was performed in a similar procedure. At the conclusion of recording, the 300-μm-thick slice was fixed and resectioned at 50 μm before being processed for immunofluorescent labeling against calbindin, calretinin, and somatostatin as described above. Only two primary antibodies were used together on each slice. Streptavidin AlexaFluor-488 or -647 (1:1000, Invitrogen) was added together with the fluorophore-conjugated secondary antibodies to visualize the biocytin-filled cells.
Retrograde tracer injection.
Retrograde tracer injections were performed on 9 wild-type C57BL6 (for immunohistochemistry) and 9 GAD67-GFP (for recording) adult male mice. After deep anesthesia with ketamine/xylazine (100/20 mg/kg, i.p.), mice were head-fixed on a stereotaxic frame and a flat skull position was achieved. Holes were drilled at the desired coordinates described below. A 30-gauge needle attached to a 2 μl Hamilton syringe was advanced to the required depth, and red or green retrobeads (0.2–0.3 μl, Lumafluor) were injected at a rate of 0.04 μl/min using a syringe pump (Pump 11 Pico Plus, Harvard Apparatus). The needle was slowly retracted 2–3 min after the completion of injection. After disinfection and closure of the incision site, the analgesic Torbugesic (2 mg/kg, Zoetis) and the antibiotic Baytril (5 mg/kg, Bayer) were injected subcutaneously to improve recovery and survival. Animals were killed 48–72 h after the surgery to perform immunohistochemistry or electrophysiological recordings on the retrogradely labeled neurons in the MeA.
The following stereotactic coordinates were used for injections: anterior hypothalamic nucleus (AHN) (anteroposterior, −0.9 mm; mediolateral, −0.4 mm; dorsoventral, −5 mm from bregma), medial preoptic nucleus (MPN) (anteroposterior, −0.1 mm; mediolateral, −0.4 mm; dorsoventral, −4.75 mm from bregma), ventral premammillary nucleus (PMv) (anteroposterior, −2.45 mm; mediolateral, −0.5 mm; dorsoventral, −5.5 mm from bregma), dorsomedial nucleus of the ventromedial hypothalamus (VMHdm) (anteroposterior, −1.5 mm; mediolateral, −0.25 mm; dorsoventral, −5.2 mm from bregma).
Results
In most regions of the mammalian brain, GABAergic and glutamatergic cells account for the majority of neurons and can be distinguished from each other based on their electrophysiological and anatomical properties (Connors and Gutnick, 1990; Sosulina et al., 2006). We used the GAD67-GFP mouse to differentiate between GABAergic and non-GABAergic neurons (Fig. 1A). Immunohistochemical studies in various brain regions have verified that GFP+ cells in this mouse are GABAergic (Tamamaki et al., 2003; Young and Sun, 2009; Suzuki and Bekkers, 2010a). Consistent with these reports, we found that almost all (93 ± 4%, 12,564 cells counted in 4 mice) GFP+ cells in the MeA were immunopositive for GABA (Fig. 1B) and hence GABAergic. Although the precise neurotransmitter identity of GFP− cells in the medial amygdala is not known, previous studies have shown that non-GABAergic projection neurons in the MeA express Vglut2 (a marker for glutamatergic neurons), suggesting that they are glutamatergic (Choi et al., 2005; Bian et al., 2008). Here, we simply refer to these two types of neurons as GFP+ and GFP−, or GABAergic and non-GABAergic cells.
Figure 1.

The majority of MePV neurons are non-GABAergic. A, Coronal section containing the amygdala from a GAD67-GFP transgenic mouse showing the distribution of GFP-expressing neurons. Dashed lines indicate the boundaries of major amygdala nuclei. Solid lines indicate MeA borders. B, GFP+ cells are GABAergic. Photomicrographs of MePV neurons show GFP expression (top), immunoreactivity to GABA antibody (middle), and their colocalization (bottom). C, D, Distribution of GFP+ cells in the posteroventral (MePV) and posterodorsal (MePD) medial amygdala. C, Photomicrographs represent NeuN-ir cells (left), GFP expression (middle), and their colocalization (right) in the MePV and MePD. There is a higher number of GFP− neurons in the MePV (red only). D, Pie charts represent the proportion of GFP+ and GFP− neuronal populations in the posterior MeA. E, MePV can be divided into a cell-sparse molecular layer (lm) and a cell-rich cellular layer (lc). Photomicrographs represent NeuN-ir neurons in the MePV (left), GFP expression (middle), and their colocalization (right). A cell-sparse region is evident in the ventral region of the MePV (lm), which contains a population of GFP+ cells with distinctively bright fluorescence (middle, arrows). GFP fluorescence of lc neurons was comparatively weak (middle, arrowheads). F, Bright GFP+ cells could be identified in acute slices. A GFP+ cell of the lm/lc border (arrow) has markedly brighter fluorescence than the neighboring cells (arrowhead). G, Schematic map of the locations of bright GFP+ cells from which recordings were made. Most of these cells were located in the molecular layer, with a few scattered in the cellular layer. M, Medial; ot, optic tract; V, ventral. Scale bars: A, 200 μm; C, 100 μm; E, 50 μm; B, F, 20 μm.
We first determined the distribution and proportion of GFP+ neurons in the posterior medial amygdala. Neuronal populations were identified using the neuronal marker NeuN, and the proportion of GFP-expressing cells was quantified. GFP+ neurons were present in both the dorsal (MePD) and ventral divisions (MePV). These neurons were more prevalent in the MePD with 66 ± 6% (of 11,631 NeuN+ cells counted in 3 mice) being GFP+, whereas in the MePV, only 32 ± 2% (of 12,339 NeuN+ cells counted in 3 mice) were GFP+ (Fig. 1C,D). Thus, consistent with previous reports (Choi et al., 2005), these results suggest a differential dominance of excitation and inhibition in the MePV and MePD, respectively. NeuN immunostaining also revealed a neuron-sparse region at the ventromedial surface of the MeA (Fig. 1E). This area has been previously described as the molecular layer of the MeA (Hall, 1972) and contains afferent fibers from the accessory olfactory bulb (von Campenhausen and Mori, 2000; Mohedano-Moriano et al., 2007). Here, we will refer to this region as the molecular layer (lm), and the rest of the MePV as the cellular layer (lc) of the MePV. Interestingly, a population of GABAergic neurons with distinctively bright GFP fluorescence was present in the molecular layer (Fig. 1E, arrows). The location and GFP fluorescence of these neurons were reminiscent of the bright GFP+ cells described as neurogliaform interneurons in layer Ia of the anterior piriform cortex (Suzuki and Bekkers, 2010b). Although these cells were relatively sparse, they could be easily identified (Fig. 1F) and were selectively targeted for recordings (Fig. 1G).
GABAergic and non-GABAergic cells have distinct intrinsic membrane properties
Whole-cell recordings were made from both GFP+ and GFP− cells in the MePV. A total of 154 neurons (75 GFP+, 79 GFP−) that met the criteria for health and stability were used for the analysis (see Materials and Methods). Of these, 15 neurons, which were mainly located in the molecular layer, were selected based on their bright GFP fluorescence (Fig. 1F,G). A range of passive and active membrane properties was observed in both GFP− and GFP+ cell populations (Tables 1 and 2). Seventeen biophysical parameters, including subthreshold membrane properties, AP waveform properties, and intrinsic firing properties, were measured and compared between the two cell populations (see Materials and Methods). To avoid a subjective and arbitrary classification, an unsupervised hierarchical cluster analysis was performed on neurons for which all these measurements were available (n = 144), using the electrophysiological properties and GFP expression as grouping parameters. Five broad clusters of neurons could be identified using the Thorndike method (Thorndike, 1953): two GFP− cell classes named Type I and Type II, and three GFP+ cell classes named Type 1, Type 2, and Type 3 (Fig. 2). A summary of the electrophysiological properties of neurons in each cluster is shown in Table 2.
Table 1.
Electrophysiological properties of GABAergic and non-GABAergic MePV cellsa
| Non-GABAergic (n = 79) | GABAergic (n = 75) | p | |
|---|---|---|---|
| Vrest (mV) | −68 ± 1 | −65 ± 1 | <0.001 |
| Rin (MΩ) | 234 ± 8 | 242 ± 10 | NS |
| τm (ms) | 20 ± 1 | 14 ± 1 | <0.0001 |
| sag ratio | 1 ± 0.003 | 0.9 ± 0.005 | <0.0001 |
| Rheobase (pA) | 90 ± 4 | 101 ± 6 | NS |
| AP threshold (mV) | −32 ± 0.5 | −35 ± 1 | <0.01 |
| AP latency (ms) | 116 ± 15 | 134 ± 18 | NS |
| AP amplitude (mV) | 76 ± 1 | 69 ± 1 | <0.001 |
| AP HW (ms) | 0.7 ± 0.01 | 0.6 ± 0.01 | <0.01 |
| fAHP amp (mV) | 20 ± 0.4 | 20 ± 0.5 | NS |
| fAHP latency (ms) | 2.2 ± 0.1 | 1.9 ± 0.1 | <0.01 |
| mAHP amp (mV) | 18 ± 0.4 | 16 ± 1 | <0.05 |
| mAHP latency (ms) | 21 ± 1 | 14 ± 1 | <0.0001 |
| AP broadening | 0.2 ± 0.02 | 0.3 ± 0.03 | <0.05 |
| AP amplitude accommodation | 0.1 ± 0.01 | 0.2 ± 0.02 | <0.01 |
| Firing frequency accommodation | 4 ± 0.4 | 1 ± 0.2 | <0.0001 |
| Maximal firing frequency (Hz) | 50 ± 2 | 70 ± 4 | <0.0001 |
aData are mean ± SEM. Definition of electrophysiological properties is explained in Materials and Methods. Unpaired Student's t test was used for statistical comparison. Statistical significance was defined as p < 0.05. n, number of cells; NS, Not significant.
Table 2.
Electrophysiological properties of MePV neuron cell typesa
| Type I (n = 42) | Type II (n = 36) | Type 1 (n = 22) | Type 2 (n = 16) | Type 3 (n = 28) | p | |
|---|---|---|---|---|---|---|
| Vrest (mV) | −72 ± 1 | −64 ± 0.5 | −63 ± 1 | −66 ± 1 | −65 ± 1 | II, 1, 2, 3 ** I |
| Rin (MΩ) | 218 ± 9 | 246 ± 13 | 305 ± 16 | 249 ± 18 | 193 ± 10 | 1 ** I, II, 3; II * 3 |
| τm (ms) | 25 ± 1 | 13 ± 1 | 20 ± 1 | 10 ± 0.5 | 13 ± 1 | I ** 1 *** II, 2, 3 |
| sag ratio | 1 ± 0.004 | 1 ± 0.003 | 0.9 ± 0.01 | 1 ± 0.004 | 0.9 ± 0.01 | I, II, 2 **** 1, 3 |
| Rheobase (pA) | 100 ± 6 | 79 ± 4 | 56 ± 7 | 113 ± 12 | 125 ± 10 | I, 2, 3 *** 1; 3 *** II |
| AP threshold (mV) | −34 ± 1 | −31 ± 1 | −31 ± 1 | −34 ± 1 | −35 ± 1 | II, 1 * 3 |
| AP latency (ms) | 166 ± 23 | 60 ± 16 | 89 ± 9 | 200 ± 45 | 169 ± 35 | I, 2, 3 ** II |
| AP amplitude (mV) | 79 ± 1 | 72 ± 1 | 70 ± 1 | 56 ± 3 | 73 ± 2 | I ** II, 1, 3 **** 2 |
| AP HW (ms) | 0.7 ± 0.02 | 0.6 ± 0.01 | 0.6 ± 0.02 | 0.6 ± 0.03 | 0.7 ± 0.03 | I, 3 * II, 1, 2 |
| fAHP amp (mV) | 19 ± 0.6 | 22 ± 0.4 | 21 ± 0.5 | 25 ± 1 | 17 ± 1 | 2 ** I, II, 1 ** 3 |
| fAHP latency (ms) | 2.5 ± 0.1 | 1.9 ± 0.1 | 1.8 ± 0.1 | 2 ± 0.1 | 2.1 ± 0.1 | I * II, 1, 2, 3 |
| mAHP amp (mV) | 18 ± 1 | 17 ± 1 | 21 ± 1 | 15 ± 1 | 14 ± 1 | 1 * I, II, 2, 3; I ** 3 |
| mAHP latency (ms) | 22 ± 2 | 19 ± 2 | 19 ± 2 | 12 ± 1 | 12 ± 1 | I *** 2, 3; II * 3 |
| AP broadening | 0.2 ± 0.01 | 0.3 ± 0.02 | 0.2 ± 0.02 | 0.3 ± 0.1 | 0.4 ± 0.1 | 3 *** I, 1; II, 2 * I |
| AP amplitude accommodation | 0.1 ± 0.01 | 0.2 ± 0.02 | 0.1 ± 0.02 | 0.2 ± 0.05 | 0.2 ± 0.02 | II, 2, 3 ** I; II, 3 * 1 |
| Firing frequency accommodation | 2 ± 0.3 | 6 ± 1 | 1 ± 0.3 | 1 ± 0.3 | 1 ± 0.2 | II ** I, 1, 2, 3 |
| Maximal firing frequency (Hz) | 42 ± 2 | 60 ± 2 | 57 ± 3 | 110 ± 6 | 53 ± 3 | 2 **** I, II, 1, 3; II, 1 ** I |
aData are mean ± SEM. Definition of electrophysiological properties is explained in Materials and Methods. One-way ANOVA test with a Bonferroni post hoc was used for statistical comparison. Statistical significance was defined as p < 0.05. n, number of cells.
*p < 0.05;
**p < 0.01;
***p < 0.001;
****p < 0.0001.
Figure 2.

Unsupervised hierarchical cluster analysis of MePV neurons based on their electrophysiological properties. Ward's cluster analysis was used on 144 neurons, including both GFP+ (green) and GFP− cells (black and gray), based on 17 electrophysiological parameters (see Materials and Methods) and GFP expression as clustering parameters. Intersections of the dendrogram with the x-axis are individual neurons. y-axis represents the average linkage distance between cells, with larger linkage distance representing a larger dissimilarity. Five broad clusters of cells could be identified: two GFP− (Type I and Type II) and three GFP+ cell groups (Type 1, Type 2, Type 3). The limit between clusters was determined based on Thorndike method (dashed line) (Thorndike, 1953).
Two electrophysiological types of non-GABAergic neurons
Type I cells (n = 42) (Fig. 3A) had the most hyperpolarized resting membrane potential (−72 ± 1 mV) and the largest membrane time constant (25 ms) among all neurons. They fired regularly spaced APs with modest spike frequency accommodation (Fig. 3A, right trace and graph) and minimal AP amplitude accommodation (Fig. 3A, inset). Their hyperpolarization-activated voltage sag was small (Fig. 3A, left), and rebound spikes were rarely observed (1 of 42).
Figure 3.
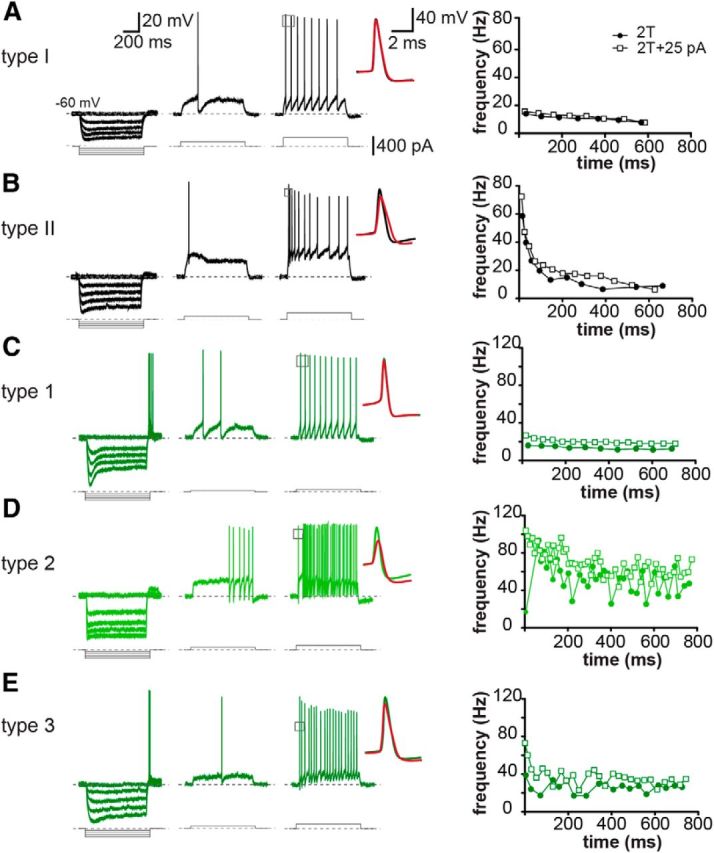
GABAergic and non-GABAergic neurons can be separated into distinct electrophysiological cell types. Traces represent responses to hyperpolarizing (left traces) or depolarizing (middle and right traces) current step injections (800 ms). Depolarization responses were evoked by threshold (T, middle traces), and twice-threshold (2T) (right traces) current injections. Inset, Overlay of the first and second APs at 2T. Graphs represent changes in instantaneous firing frequency during 800 ms depolarization in response to 2T and 2T + 25 pA current step injections. Black represents GFP− cells; dark green represents GFP+ cells; bright green represents GFP+ cells with bright fluorescence. A, Representative Type 1 GFP− cell with a small hyperpolarization-activated voltage sag (left trace), regular AP firing (right trace), and minimal spike frequency accommodation (graph). B, Representative Type II cell with a small hyperpolarization-activated voltage sag (left trace), and significant spike frequency accommodation (right trace, graph). C, Representative Type 1 GFP+ cell with a prominent hyperpolarization-activated voltage sag (left trace), regular AP firing (right trace), with little AP amplitude (inset) and firing frequency accommodation (graph). D, Representative Type 2 GFP+ cell. These cells had bright GFP fluorescence and were mainly located in the molecular layer (Fig. 1G). Hyperpolarization (left trace) revealed a lack of prominent voltage sag. In response to a near-threshold sustained depolarization, they often discharged APs with a significant delay (middle trace), and fired high-frequency APs with larger depolarizations (right trace). Type 2 cells often had irregular stuttering AP firing (right trace, graph). E, Representative Type 3 cell with a small AP afterhyperpolarization (middle traces), irregular AP firing (right trace), and little spike frequency accommodation (graph).
Type II cells (n = 36) (Fig. 3B) could be separated from Type I neurons by their smaller membrane time constant (13 ms; Table 2), strong spike frequency accommodation (Fig. 3B, graph), and more pronounced AP amplitude accommodation (Fig. 3B, inset). Many Type II neurons (19 of 36 cells) fired an initial burst of two or three APs in response to depolarizing current injections (Fig. 3B, right trace). Although similar to Type I cells, their hyperpolarization-activated voltage sag was small (Fig. 3B, left), some Type II cells displayed rebound APs at the end of hyperpolarization (13 of 36 cells).
Three electrophysiological types of GABAergic neurons
Type 1 cells (n = 22) (Fig. 3C) typically had a high input resistance and large hyperpolarization-activated voltage sag (Fig. 3C, left), suggestive of the presence of Ih current in these cells (Bian et al., 2008). Moreover, these neurons had the largest membrane time constant among GFP+ neurons (20 ms). They discharged regularly spaced APs with relatively large mAHPs and showed little spike frequency accommodation (Fig. 3C, right trace and graph). Rebound APs were frequently observed in these neurons (14 of 22 cells) (Fig. 3C, left).
Unlike Type 1 neurons, Type 2 cells (n = 16) (Fig. 3D) displayed a significant delay to the first AP for a threshold current injection (200 ± 45 ms vs 89 ± 9 ms; p = 0.008 with unpaired Student's t test; Fig. 3D, middle trace). Their APs had the smallest amplitude among all cell types and was followed by a prominent fAHP. These neurons typically fired high-frequency bursts of APs, often in an irregular stuttering pattern (Fig. 3D, right trace, graph). Moreover, most Type 2 neurons did not show a hyperpolarization-activated depolarizing sag (Fig. 3D, left), and rebound spikes were mostly absent in these cells (1 of 16). These neurons could be easily distinguished from the rest of MePV neurons as they were mostly found in the molecular layer (14 of 16), and had very bright GFP fluorescence (Fig. 1G).
Type 3 cells (n = 28) (Fig. 3E) could be distinguished from Type 1 GFP+ neurons based on their lower input resistance, smaller membrane time constant, and smaller AHPs. Most of these neurons discharged APs throughout the current injection with varying instantaneous firing frequency (Fig. 3E, right trace, graph). A small number of Type 3 cells (n = 9), however, discharged APs that were mostly clustered in the beginning of the depolarization response. On average, Type 3 neurons showed a larger AP broadening and AP amplitude accommodation compared with Type 1 cells. Hyperpolarization-activated voltage sag was commonly observed in these neurons, and some fired rebound spikes (9 of 28 cells).
It should be noted that while, on average, electrophysiological properties of GFP− and GFP+ neurons differed from each other, they could not be reliably identified as a GFP− or a GFP+ cell based on electrophysiological properties alone. For instance, AP half-width, which has been used in other brain regions to distinguish between glutamatergic principal cells and GABAergic interneurons (McCormick et al., 1985; Mahanty and Sah, 1998; Sosulina et al., 2006), differed only by a fraction of a millisecond (Fig. 3, insets; Table 1). Overall, hyperpolarization-activated voltage sag, maximal firing frequency, and firing frequency accommodation were among the most distinctive parameters. If a neuron had a large hyperpolarization-activated voltage sag (small sag ratio), it was almost always a GFP+ cell (Fig. 3C), whereas prominent spike frequency accommodation was specifically seen among GFP− neurons (Fig. 3B).
Morphological properties of MePV neurons
Biocytin-filled neurons were visualized using streptavidin-conjugated fluorescent dyes (Fig. 4A). Overall, morphological features of MePV neurons were less diverse than their physiological properties. Consistent with previous Golgi studies in cats and rats (Hall, 1972; Dall'Oglio et al., 2008), the majority of MePV neurons had small- to medium-sized ovoid-shaped somata and three to six primary dendrites that branched sparingly (Fig. 4). In most cells, at least one primary dendrite extended ventrally or medially into the molecular layer (Fig. 4A, left). Morphologies of 27 neurons (12 GFP−, 15 GFP+) were reconstructed (Fig. 4), and morphometric analysis performed using Neurolucida (Table 3).
Figure 4.
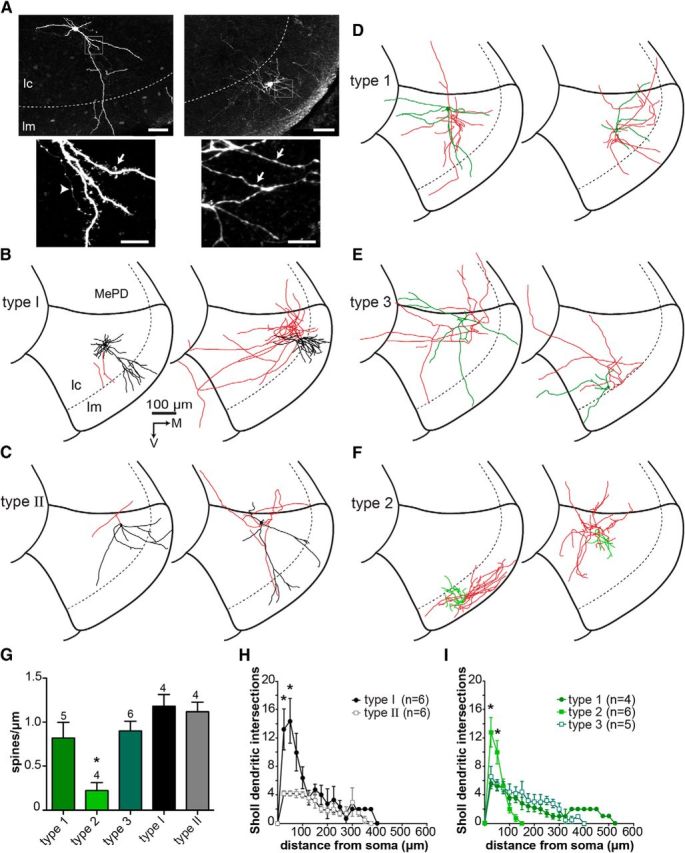
Morphological properties of MePV neurons. A, Biocytin-filled MePV neurons that were visualized using streptavidin-conjugated fluorescent dyes. Representative Type 1 (left) and Type 2 (right) GFP+ cells are shown. High-magnification photomicrographs (insets) show spiny dendrites of Type 1 (bottom left, arrow), and smooth beaded dendrites of Type 2 cell (bottom right, arrows). Axons were differentiated from dendrites based on their thin diameter and the presence of “en-passant” boutons (bottom left, arrowhead). Representative reconstructed morphologies: B, Type I GFP− cells; C, Type II GFP− cells; D, Type 1 GFP+ cells; E, Type 3 GFP+ cells; F, Type 2 GFP+ cells. Soma and dendrites are in black (GFP− cells) or green (GFP+ cells), and axons in red. G, Dendritic spine density of electrophysiologically identified cell types. Spines were counted over a 50 μm length of the dendrite and within 30–50 μm from the soma. Spine density was calculated as the number of spines per 1 μm. Type 2 GFP+ cells had significantly lower spine density than other MePV neurons. Bars represent mean ± SEM. Numbers on top of bars are the number of cells in each group. H, I, Graphs represent dendritic complexities of GFP− and GFP+ cells, respectively. Sholl analysis was performed (see Materials and Methods), and number of dendritic intersections (mean ± SEM) at each Sholl circle was plotted against the distance from the soma. H, Type I GFP− cells had a more complex dendritic arborization compared with Type II cells (see also B, C). I, Type 2 GFP+ cells had a compact dendritic tree, with more branching than Type 1 and Type 3 cells (see also F). M, Medial; V, ventral. *p < 0.05 (one-way ANOVA with Bonferroni post hoc test). Scale bars: A, 50 μm; A, insets, 10 μm.
Table 3.
Morphological properties of MePV neuronsa
| Type I (n = 6) (na = 5) | Type II (n = 6) (na = 3) | Type 1 (n = 4) (na = 3) | Type 2 (n = 6) (na = 5) | Type 3 (n = 5) (na = 5) | p | |
|---|---|---|---|---|---|---|
| Primary dendrites | 6 ± 1 | 4 ± 0.4 | 4 ± 1 | 6 ± 1 | 4 ± 0.4 | NS |
| Dendrite endings | 24 ± 4 | 8 ± 1 | 9 ± 0.5 | 25 ± 3 | 11 ± 1 | 2 * II, 1, 3; I * II, 1 |
| Dendrite total length (mm) | 2 ± 0.2 | 1 ± 0.1 | 1 ± 0.2 | 1 ± 0.1 | 1 ± 0.3 | I * II, 1, 2 |
| Dendrite Sholl field (mm) | 0.2 ± 0.04 | 0.3 ± 0.02 | 0.3 ± 0.02 | 0.1 ± 0.01 | 0.3 ± 0.02 | I, II, 1, 3 * 2 |
| Soma surface area (mm2) | 0.7 ± 0.2 | 0.4 ± 0.1 | 0.6 ± 0.2 | 0.4 ± 0.1 | 0.3 ± 0.03 | NS |
| Soma volume (mm3) | 2 ± 0.5 | 1 ± 0.3 | 2 ± 1 | 1 ± 0.2 | 1 ± 0.1 | NS |
| Axon endings | 8.6 ± 4 | 6 ± 2 | 12 ± 3 | 24 ± 5 | 9 ± 2 | 2 * I, II |
aData are mean ± SEM. Definition of morphological properties is explained in Materials and Methods. One-way ANOVA test with a Bonferroni post hoc was used for statistical comparison. Statistical significance was defined as p < 0.05. n, number of cells; na, number of cells in which axons were reconstructed; NS, not significant.
*p < 0.05.
Non-GABAergic neurons
Type I cells (n = 6) appeared to be morphologically diverse, with either pyramidal-like (Fig. 4B, left, n = 2) or multipolar (Fig. 4B, right, n = 4) spiny dendrites. Sholl analysis showed that, although the dendrites of both GFP− cell types extended 200–400 μm from the soma, Type I neurons generally had more branches than Type II cells (Fig. 4H). Type II neurons (n = 6) were more homogeneous, with the majority of cells being multipolar, with a simple dendritic arbor that branched sparingly. Axons were reconstructed in 8 GFP− cells (5 Type I, 3 Type II). Axonal projections to the neighboring regions, including MePD, cortical amygdala (CoA), and basomedial amygdala (BMA), were found in both cell types (Fig. 4B,C). Except for one Type I neuron (Fig. 4B, right), axons of most GFP− cells had a simple arborization and often appeared to have been cut during slicing, suggesting that they had rostrocaudal projections (Fig. 4B,C, left).
GABAergic neurons
Two distinct types of cell morphology were identified among GFP+ cells (Fig. 4A). Type 1 (n = 4) and Type 3 (n = 5) cells had similar morphological features and resembled Type II GFP− cells. These neurons were bipolar or multipolar, with moderately spiny dendrites and sparsely branched dendritic trees (Fig. 4D,E). Type 2 cells (n = 6) (Fig. 4F), in contrast, had distinctive morphologies with short dendrites that extended 100–150 μm from the soma and branched multiple times (Fig. 4F,I). Moreover, unlike other MePV neurons, dendrites of Type 2 cells were smooth or sparsely spiny (Fig. 4G) and often had a beaded appearance (Fig. 4A, right). Axons were reconstructed in 13 GFP+ neurons (3 Type 1, 5 Type 2, 5 Type 3). Similar to GFP− cells, axons of Type 1 and Type 3 cells extended to other regions in the CoA, MePD, and BMA (Fig. 4D,E). In contrast, Type 2 cells had a complex axonal arbor that branched locally (Fig. 4.F). Axons of Type 2 neurons in the molecular layer mostly remained in this layer (Fig. 4F, left), and those in the cellular layer mainly branched close to the cell body (Fig. 4F, right).
Cell-type-specific expression of interneuron markers
A number of calcium-binding proteins and neuropeptides have been widely used for identification and classification of GABAergic interneurons (Ascoli et al., 2008). Even though interneurons distinguished on the expression of these molecules are often physiologically and morphologically heterogeneous, some cell-type specificity has been described in different brain regions, including the amygdala (Freund and Buzsáki, 1996; Markram et al., 2004; Spampanato et al., 2011). We therefore sought to determine whether cell-type-specific expression of interneuron markers existed among the identified GABAergic cell types. Initially, we performed immunohistochemistry on perfusion-fixed slices to determine which interneuron markers are expressed in GABAergic cells of the MePV. Six commonly used markers, including the calcium-binding proteins calbindin, calretinin, and parvalbumin, and the neuropeptides somatostatin, cholecystokinin (CCK), and vasoactive intestinal polypeptide (VIP) were tested.
Consistent with previous reports (Kemppainen and Pitkänen, 2000; Real et al., 2009), calbindin-, calretinin-, and somatostatin-immunoreactive (ir) neurons were found in the MePV, whereas parvalbumin-ir and VIP-ir cells were absent, and CCK-ir cells were mainly confined to the MePD (Fig. 5A,B). Among GABAergic neurons, calbindin was the most frequent marker, with 45% of GFP+ neurons being calbindin-positive (2662 of 5895 GFP+ cells counted in 3 mice). Somatostatin was found in 18% of GFP+ cells (1344 of 9170 GFP+ cells counted in 5 mice), and calretinin was least common with 12% of GFP+ cells being calretinin-ir (587 of 4761 GFP+ cells counted in 3 mice). However, although almost all (97%) somatostatin-ir cells (1669 of 1718 cells counted in 5 mice) were GFP+, 50% of calbindin-ir (2762 of 5511 calbindin-ir cells counted in 3 mice) and only 26% of calretinin-ir cells expressed GFP (555 of 2130 calretinin-ir cells counted in 3 mice) (Fig. 5C), suggesting that, in the MeA, calbindin and calretinin may not be selective for GABAergic neurons.
Figure 5.

Expression of interneuron markers in GABAergic neurons. A, B, Photomicrographs show MeA cell immunoreactivity for calbindin, calretinin, and parvalbumin and neuropeptides somatostatin, CCK, and VIP. Calbindin-ir (A, left), calretinin-ir (A, middle), and somatostatin-ir cells (B, left) were found in the MePV, whereas parvalbumin (A, right), CCK (B, middle), and VIP (B, right) neurons were largely absent. Arrows indicate immunoreactive cells for these markers in the neighboring regions: parvalbumin in the basomedial amygdala (A, right), CCK in the MePD (B, middle), and VIP in the cortical amygdala (B, right). C, Many calbindin-ir and almost all somatostatin-ir cells in the MePV were GFP+; calretinin was mostly found in GFP− cells. Photomicrographs represent MePV-immunoreactive cells for calbindin (top left), calretinin (top middle), and somatostatin (top right), expression of GFP (middle), and their colocalization (bottom). Arrows indicate GFP+ cells immunoreactive for these markers. Arrowheads indicate calretinin-ir cells that did not express GFP. D, All three markers were found in Type 1 neurons, whereas only calbindin was found in Type 2 cells (E). Reconstructed morphology of each cell is shown on the right panel (D, E). F, Percentage distribution of interneuron markers among electrophysiologically identified GFP+ neurons. Type 3 cells were not immunoreactive for any of the three markers. Numbers on top of bars indicate total number of cells that were processed in each group. M, Medial; V, ventral. Scale bars: A, B, 100 μm; C–E, 20 μm.
We next asked which GABAergic cell types, identified electrophysiologically and morphologically, express each of these three markers. Immunohistochemistry was performed on slices containing biocytin-filled neurons that had been characterized electrophysiologically, and cell morphology was visualized as described before. Recovered neurons showed that both Type 1 and Type 2 GFP+ cells expressed calbindin (4 of 13 Type 1 cells; 4 of 15 Type 2 cells) (Fig. 5D,E), whereas somatostatin was found exclusively in Type 1 cells (5 of 13) (Fig. 5D), suggesting a cell-type-specific expression of this marker. Consistent with the low numbers of calretinin-ir GFP+ cells, calretinin was detected in only one Type 1 cell (1 of 15) (Fig. 5D). Moreover, none of the Type 3 neurons was immunoreactive for these markers (Fig. 5F). These data provide evidence for some cell-type-specific expression of interneuron markers in the MeA and further substantiate the distinction between the electrophysiologically identified GABAergic cell types.
Both non-GABAergic and GABAergic MePV neurons project to the hypothalamus
Morphological characterization of MePV neurons shows that Type 1 and Type 3 GFP+ cells are similar to GFP− cells, in that they have long spiny dendrites and axonal projections that extend beyond the MeA. These neurons also resemble GABAergic projection cells present in the central amygdala (Sun and Cassell, 1993; Cassell et al., 1999). This led us to ask whether Type 1 and Type 3 GABAergic cells are indeed projection neurons. Previous studies have identified GABAergic projection neurons in the MePD, but it is unclear whether MePV GABAergic cells are local circuit interneurons, principal neurons, or a mixture of both (Choi et al., 2005; Bian et al., 2008; Bian, 2013). It is well known that MeA neurons project to hypothalamic regions that control defensive and reproductive behaviors (Canteras et al., 1995; Choi et al., 2005; Pardo-Bellver et al., 2012). The defensive regions include the AHN and the dorsomedial nucleus of the VMHdm, whereas the reproductive regions include the MPN and the PMv (Swanson, 2000). We injected retrograde tracer beads into each of these four hypothalamic regions (Fig. 6A, top and middle) and used immunohistochemistry to determine whether retrogradely labeled MePV neurons were GABAergic (4 mice for AHN and MPN injections; 3 mice for VMHdm and PMv injections). As expected, retrogradely labeled cells from all four regions were found in both the MePV and MePD (Fig. 6A, bottom). Retrogradely labeled neurons in the MePV were found in equal proportions from all four hypothalamic regions, whereas MePD neurons appeared to preferentially project to the MPN (Fig. 6B). This result is consistent with previous reports that MePD mainly targets the reproductive nuclei of the hypothalamus (Choi et al., 2005; Pardo-Bellver et al., 2012). The apparent lack of a similar strong preference for PMv may be explained by the small size of this region and its proximity to the dorsal premammillary nucleus (PMd), which is part of the defensive control column; retrograde tracer from PMv injections often spilled over into this region and may have compromised our results (Fig. 6A, PMv). Moreover, when red and green retrobeads were injected into two different regions (either AHN and MPN or VMHdm and PMv) in the same animal, the retrogradely labeled MeA neurons were largely separate but anatomically intermingled. However, ∼20% of cells were dual labeled (131 of 698 AHN-projecting neurons colabeled from the MPN, n = 2 mice; 66 of 307 VMHdm-projecting cells colabeled from the PMv, n = 2 mice), showing that some neurons in MeA send projections to both regions (Fig. 6C).
Figure 6.
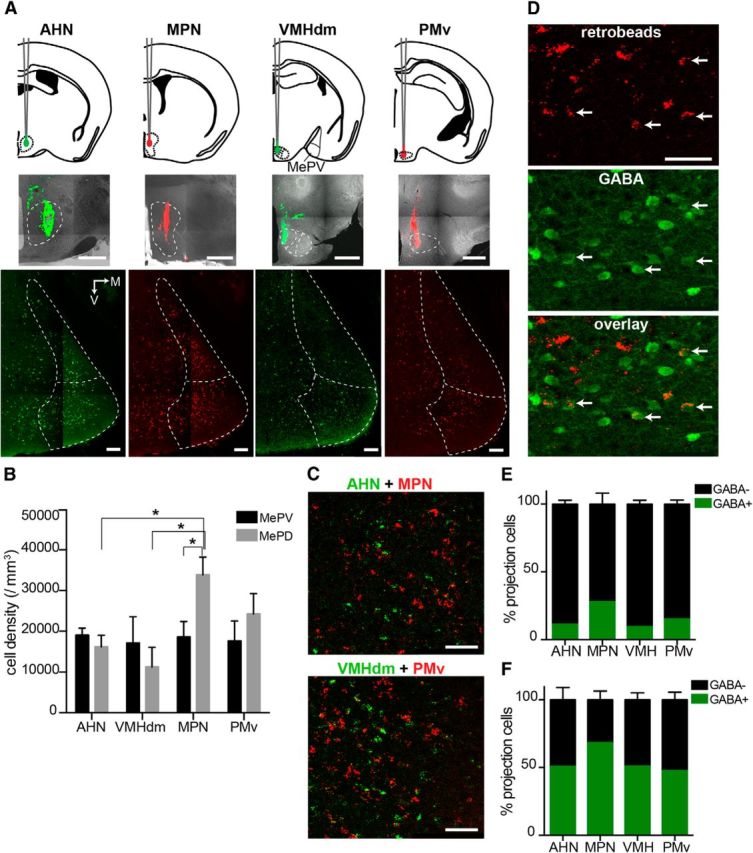
Both GABAergic and non-GABAergic cells project to the hypothalamus. A, MeA cells projecting to reproductive or defensive hypothalamic nuclei are found in both divisions of the posterior MeA. Retrograde tracers (retrobeads, 0.2–0.3 μl) were injected into AHN, MPN, VMHdm, and PMv (top and middle). Red and green tracers were used in two different regions in the same animal (AHN and MPN, or VMHdm and PMv). Photomicrographs of the MeA (bottom) show that, for all injections, retrogradely labeled cells were found in both MePV and MePD. B, Graph represents the density of retrogradely labeled cells from each region. No difference was found in the number of retrogradely labeled MePV neurons from different hypothalamic regions, whereas MePD neurons preferentially projected to the MPN. C, MePV neurons projecting to different hypothalamic nuclei were largely nonoverlapping. Photomicrographs represent retrogradely labeled neurons in the MePV from AHN (red) and MPN (green) dual injections (top), and VMHdm (red) and PMv (green) dual injections (bottom). Neurons projecting to different regions were intermingled but largely nonoverlapping. D, Some MePV projection neurons are GABAergic. Photomicrographs represent AHN-projecting MePV neurons retrogradely labeled with a tracer in AHN (top), GABA-ir cells labeled with immunohistochemistry (middle), and their colocalization (bottom). Some GABAergic neurons were labeled with the tracer, showing that there are projection cells (arrows). E, F, Distribution of GABAergic and non-GABAergic projection neurons in the MePV (E) and MePD (F). A total of 10%–30% of hypothalamus-projecting MePV neurons were GABA-ir (E). GABAergic cells in the MePD accounted for the majority of projection neurons (>50%, F). M, Medial; V, ventral. Graph bars represent mean ± SEM. *p < 0.05 with two-way ANOVA and Bonferroni post hoc test. Scale bars: A, middle, 500 μm; A, bottom, 100 μm; B, C, 50 μm.
Because both red and green tracers were injected, instead of using GFP fluorescence for identification of GABAergic neurons, GABA-ir cells were detected using immunohistochemistry in the wild-type C57Bl6 mouse. Similar results were also obtained in transgenic animals that were injected only with the red tracer, in which GFP was used to identify the GABAergic cells. Overall, 10%–30% of retrogradely labeled neurons in the MePV were GABAergic (AHN: 132 ± 13 of 1117 ± 56 cells; MPN: 240 ± 15 of 902 ± 94 cells; VMHdm: 67 ± 10 of 612 ± 54 cells; PMv: 91 ± 2 of 622 ± 23 cells; 3 or 4 mice) (Fig. 6D,E). In contrast, GABAergic neurons constitute 50%–70% of MePD projection cells (AHN: 370 ± 22 of 723 ± 19 cells; MPN: 741 ± 60 of 1154 ± 56 cells; VMHdm: 171 ± 10 of 352 ± 30 cells; PMv: 348 ± 7 of 756 ± 43 cells; 3 or 4 mice) (Fig. 6F). Given that ∼30% of all MePV neurons are GABAergic (Fig. 1D), these results indicate that a substantial portion of GABAergic neurons in this region are projection neurons.
Type 1 and Type 3 GABAergic cells are projection neurons
We next asked which electrophysiologically identified types of MePV neurons project to the hypothalamus and whether there are any cell-type-specific projections. Retrobeads were injected into either AHN (5 GAD67-GFP mice) or MPN (4 GAD67-GFP mice) (Fig. 6A) and whole-cell recordings obtained from retrogradely labeled GFP+ and GFP− neurons in the MePV (Fig. 7B,D). Both types of GFP− cells (Fig. 7A,B) as well as Type 1 and Type 3 GFP+ cells (Fig. 7C,D) were identified among the projection neurons, whereas no Type 2 cell was labeled with the tracer (Fig. 7E). Moreover, no cell-type specificity was found in the projections, with all four types of cells projecting to both AHN and MPN (Fig. 7E).
Figure 7.
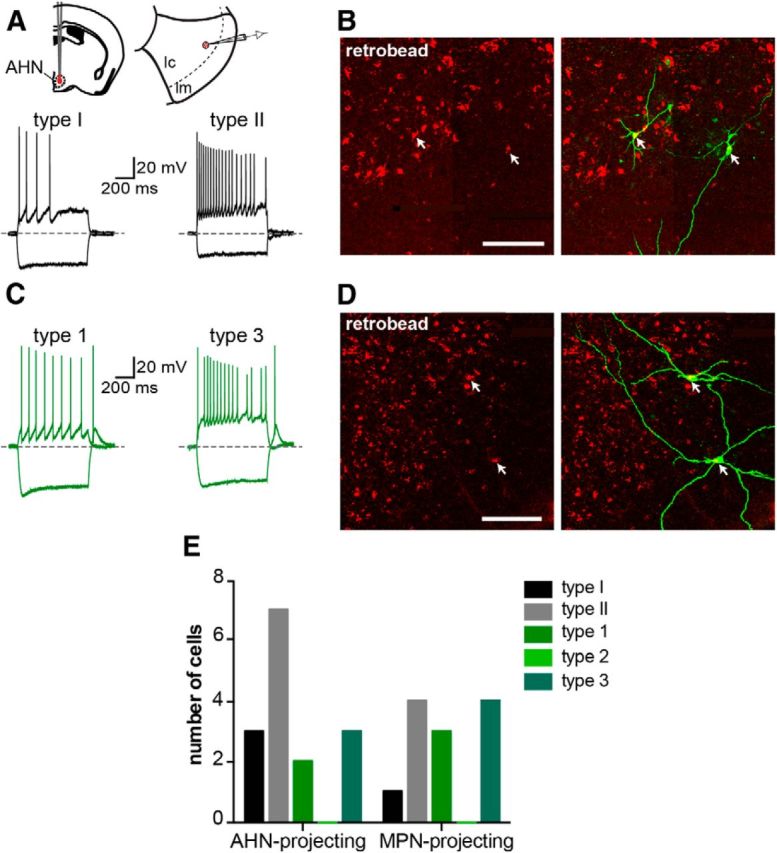
MePV neurons of different classes project to the same regions of the hypothalamus. A, Both types of GFP− cells project to AHN. Red retrobeads were injected into AHN, and recordings were made from GFP+ and GFP− retrogradely labeled neurons in the MePV (schematic). Traces represent hyperpolarization (bottom traces) and depolarization (top traces) responses of two retrogradely labeled AHN-projecting GFP− cells, identified as Type I (left) and Type II cells (right). B, Corresponding GFP− biocytin-filled neurons are shown. Photomicrographs represent retrogradely labeled neurons containing the red retrobead injected in AHN (left) and colocalization with biocytin-filled neurons (right). C, Both Type 1 and Type 3 GFP+ cells project to AHN. Traces represent hyperpolarization (bottom traces) and depolarization (top traces) responses of two retrogradely labeled AHN-projecting GFP+ cells, identified as Type 1 (left) and Type 3 cells (right). D, Corresponding GFP+ biocytin-filled neurons are shown. Photomicrographs are retrogradely labeled neurons containing the red retrobead injected in AHN (left) and colocalization with biocytin-filled neurons (right). E, With the exception of Type 2 GFP+ cells, all electrophysiologically identified MePV cell types were found among AHN- and MPN-projecting neurons. Histogram represents the number of AHN- and MPN-projecting MePV neurons that were characterized electrophysiologically. None of the retrogradely labeled cells was a Type 2 GFP+ neuron. Scale bars: B, D, 50 μm.
Type 2 GABAergic cells are local circuit interneurons
Type 2 GFP+ cells were the only MePV neurons that were not retrogradely labeled from the hypothalamus, suggesting they are likely to be local circuit neurons. Consistent with this proposal, these cells had properties typical of local inhibitory interneurons with high-frequency AP firing (Fig. 3D), smooth or sparsely spiny dendrites (Fig. 4A,G), and an axonal arbor that was confined to areas around their cell body (Fig. 4F). To verify whether Type 2 GFP+ cells are local circuit inhibitory interneurons, paired recordings were made from a Type 2 GFP+ cell and a nearby GFP− neuron, and the presence of synaptic connections between them was tested. GFP− cells were chosen as the most abundant principal neuron of the MePV (Fig. 6E). Type 2 cells were identified by their bright GFP fluorescence (Fig. 1E) and further confirmed based on their distinct electrophysiological and morphological properties (Figs. 3D and 4F). GFP− neurons were identified electrophysiologically (15 Type I, 18 Type II) and were all located in the cellular layer (Fig. 8B). Type 2 neurons were located either in the molecular layer (n = 19), at the border of the molecular and cellular layer (n = 8), or in the cellular layer (n = 6). APs were evoked in one cell by a brief current step injection (1 nA, 1 ms) while synaptic currents were recorded in the postsynaptic neuron at holding potentials of −40 mV and −60 mV to detect IPSCs or EPSCs, respectively. In 11 of 33 paired recordings (33%), APs in the presynaptic Type 2 cell evoked unitary IPSCs (uIPSCs) in the postsynaptic cell (Fig. 8A, black trace), which at −40 mV had a mean amplitude of 19 ± 3.6 pA (rise time: 2 ± 0.3 ms; decay time constant: 13 ± 2.2 ms; onset time: 2 ± 0.2 ms). Picrotoxin (100 μm, n = 3) fully blocked the uIPSC, showing that it was GABAA-receptor mediated (Fig. 8A, red trace). These inhibitory connections were made by Type 2 neurons in both the molecular and cellular layer (5 in molecular layer, 3 at border, 3 in cellular layer), and onto both types of GFP− cells (6 Type I cells, 5 Type II cells). Moreover, these connections were strictly unidirectional. In response to two successive APs (100 ms interval) in the presynaptic Type 2 cell, postsynaptic uIPSCs typically showed short-term synaptic depression (second/first uIPSC peak: 0.5 ± 0.07, n = 5) (Fig. 8C) and failed to summate temporally when evoked by a 50 Hz train of APs (Fig. 8D). Upon visualization of the biocytin-filled connected pairs (n = 3), axons of Type 2 cells were found to come in close contact with the postsynaptic cell dendrites, suggesting that Type 2 neurons are dendritic targeting interneurons (Fig. 8B).
Figure 8.
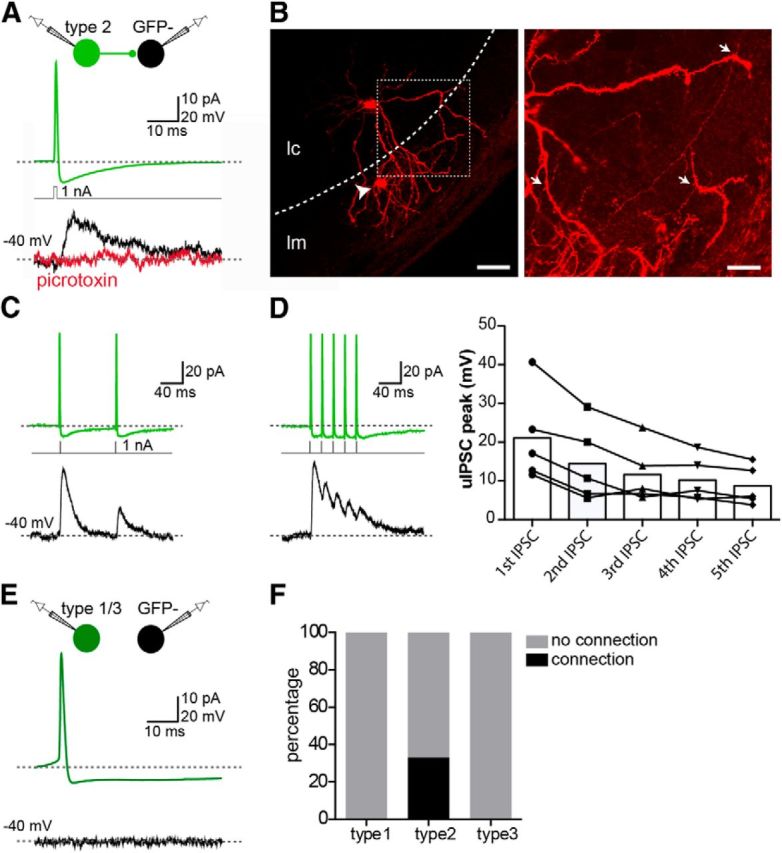
Type 2 GABAergic cells are local inhibitory interneurons. A, Type 2 GFP+ cells form GABAergic synapses onto GFP− postsynaptic cells. Paired recordings were made from a Type 2 GFP+ and GFP− neurons (either Type I or Type II) (schematic). APs were evoked in the presynaptic Type 2 cell (top trace) by a brief depolarizing current step (middle). In 11 of 33 pairs (33%), an outward current (Vh= −40 mV) was evoked in the postsynaptic GFP− cell (bottom, black trace), which could be blocked by the GABAA-receptor antagonist picrotoxin (100 μm) (bottom, red trace). B, Type 2 GFP+ cells are dendritic-targeting interneurons. Photomicrograph represents the biocytin-filled connected pair shown in A. Arrowhead indicates the presynaptic Type 2 cell located in the molecular layer. Dashed line indicates the border of the molecular (lm) and cellular layer (lc). Inset, High-magnification photomicrograph of the two cells. Arrows indicate putative sites of contact between the axon of the presynaptic Type 2 cell and the dendrites of the postsynaptic Type I cell. C, Inhibitory synapses made by Type 2 cells were depressing. Two successive APs (100 ms delay) in the presynaptic Type 2 cell (top) evoked uIPSCs showing short-term depression. D, Type 2-evoked uIPSCs failed to summate temporally. A train of APs (50 Hz) in the presynaptic Type 2 cell (top) evoked uIPSCs in the postsynaptic GFP− cell that did not summate. Graph represents the amplitude of successive uIPSCs evoked in five GFP− cells in response to a train of APs in the presynaptic Type 2 neuron. E, No synaptic connections were found between Type 1 (n = 20) or Type 3 (n = 25) GFP+ cells and GFP− neurons. Traces show a representative paired recording from a Type 1 GFP+ and a Type I GFP− cell. APs in the GFP+ cell (top) did not evoke any response in the GFP− neuron (bottom). F, Summary of results from paired recordings; 33% of recordings between a Type 2 GFP+ cell and a GFP− cell were connected, whereas no connection was found from a Type 1 (n = 20) or a Type 3 GFP+ cell (n = 25) to GFP− neurons. Scale bars: B, left, 50 μm; B, inset, 20 μm.
In addition to Type 2 cells, other GABAergic neurons might also make local inhibitory connections. Our retrograde tracing experiments showed that Type 1 and Type 3 GFP+ neurons project to the hypothalamus and are thus projection neurons. These findings, however, do not rule out recurrent inhibitory connections between these cells. To test this, paired recordings were made from a Type 1 (n = 20) or Type 3 GFP+ neuron (n = 25), and a GFP− cell (21 Type I, 24 Type II), but none was connected in either direction (Fig. 8E,F). These results suggest that, even if Type 1 and Type 3 GFP+ neurons provide local synaptic inhibition, such connections are sparse (<5% occurrence).
Type 2 GABAergic cells are chemically and electrically interconnected
In many brain regions, including the neocortex and the basolateral amygdala, GABAergic interneurons of the same class can form a network of electrically and chemically connected cells (Galarreta and Hestrin, 1999; Gibson et al., 1999; Woodruff and Sah, 2007). To test whether such interconnectivity exists among Type 2 cells, we made recordings from pairs of these neurons and tested for chemical and electrical synaptic connections between them. Because Type 2 cells in the cellular layer were sparse, recordings were made in the molecular layer or at the lm/lc border. In 7 of 12 pairs (58%), APs in the presynaptic cell evoked uIPSCs in the postsynaptic cell (peak amplitude: 12 ± 3 pA; rise time: 2 ± 0.2 ms; decay time constant: 10 ± 1.9 ms; onset time: 1 ± 0.2 ms; Vh = −40 mV) (Fig. 9A,B, black traces on left), which were blocked by picrotoxin (100 μm, n = 3) (Fig. 9A,B, red traces on left), showing that they were GABAA-receptor mediated. Three connections (43%) were bidirectional (Fig. 9A,B, left). Moreover, in 10 of 12 paired recordings (including all those with chemical synapses), Type 2 neurons were coupled by gap junctions. Thus, in voltage clamp, a brief inward current was seen in the postsynaptic cell that occurred simultaneously with the AP discharge in the presynaptic cell (Fig. 9A,B, arrow on left). Moreover, when the presynaptic cell was hyperpolarized with a negative current injection step (200 pA, 800 ms), a small hyperpolarizing voltage change was observed simultaneously in the postsynaptic cell, confirming the presence of electrical synapses (Fig. 9A,B, right). In most cells, the coupling coefficient, measured as the ratio of peak hyperpolarization in the postsynaptic cell to that in the presynaptic cell, was the same in both directions, suggesting similar strength of electrical synapses (Fig. 9D). This high probability of finding chemical and electrical synapses between Type 2 neurons further confirms that they belong to the same class of GABAergic interneurons. Furthermore, cell bodies of all electrically coupled Type 2 neurons were in close proximity of each other, with a maximum distance of 50 μm between them (Fig. 9C), whereas the only two noncoupled pairs were ∼100 μm apart. This suggests that electrical synapses are most likely dendritic or dendrosomatic.
Figure 9.

Type 2 GABAergic cells are synaptically and electrically interconnected. A, Paired recordings were made from Type 2 GFP+ cells and synaptic connections between them tested. AP evoked in the presynaptic Type 2 cell (cell 1, top left) by a brief depolarizing current step (middle), and synaptic currents recorded in the postsynaptic neuron (Vh= −45 mV; cell 2, bottom left). APs in the presynaptic cell evoked an outward current in the postsynaptic cell (black trace, bottom left), which could be blocked by picrotoxin (100 μm, red trace). In addition to the uIPSC, a transient inward current was detected in the postsynaptic cell 2 (arrow) that occurred simultaneously with APs in the presynaptic cell. Hyperpolarization of cell 1 (top right) by a negative current step injection (middle right) evoked a hyperpolarization in cell 2 (bottom right). B, Chemical and electrical synapses between Type 2 cells were reciprocal in 43% (3 of 7) and 100% (10 of 10) of connected pairs, respectively. Similar chemical and electrical synaptic connections were also observed from cell 2 to cell 1. APs in cell 2 (top left) evoked uIPSCs in cell 1 (bottom left, black) that were blocked by picrotoxin (bottom left, red). Furthermore, sustained hyperpolarization of cell 2 (top right) evoked a smaller but simultaneous hyperpolarization in cell 1 (bottom right), confirming electrical coupling. C, Electrical synapses occurred between Type 2 cells that were in close proximity of each other (maximum of 50 μm distance between cell bodies, n = 10), but absent between those that were >50 μm apart (n = 2). Photomicrograph represents the biocytin-filled pair of cells presented in A and B. Dashed line indicates the border of the molecular (lm) and cellular layers (lc). D, Strength of electrical coupling was the same in both directions. Graph represents coupling coefficient of electrically connected pairs of Type 2 cells, measured as the ratio of peak hyperpolarization in the postsynaptic cell to that in the presynaptic cell (paired Student's t test, p > 0.05). Scale bar, 50 μm.
Type 2 GABAergic cells provide feedforward inhibition in the olfactory-processing circuitry of the MePV
Identification of Type 2 cells as local inhibitory interneurons raised the question about their function in the olfactory-processing circuitry of the MePV. GABAergic interneurons are known to shape responses of principal neurons to incoming inputs by providing feedforward or feedback inhibition in various sensory processing circuits (Pouille and Scanziani, 2001; Isaacson and Scanziani, 2011). If such circuit motifs exist in the MePV, olfactory input is expected to evoke inhibitory responses in addition to excitation in principal neurons. We therefore tested the impact of inputs from the accessory olfactory bulb on both types of neuron.
In all GFP− and GFP+ principal neurons (24 Type I, 22 Type II, 13 Type 1, 12 Type 3), electrical stimulation of AOB afferents in the molecular layer (see Materials and Methods) evoked fast EPSCs that were blocked by the AMPA/kainate receptor antagonist NBQX (10 μm, n = 5; Fig. 10A A). At depolarized holding potentials (−50 to −40 mV), the EPSC was followed by an outward current (Fig. 10B, black and green traces), which was blocked by picrotoxin (100 μm, n = 10) (Fig. 10B, red traces), showing that it was a GABAA-mediated IPSC. Disynaptic inhibition was seen in 76% of GFP− neurons (peak amplitude: 34 ± 1 pA; rise time: 2.3 ± 0.3 ms; decay time constant: 16 ± 1 ms; Vh = −40 mV, n = 19), and 75% of GFP+ neurons with a similar peak amplitude and kinetics (peak amplitude: 28 ± 8 pA; rise time: 2 ± 0.5 ms; decay time constant: 14 ± 2 ms; n = 9, p > 0.05 with unpaired Student's t test). Which GABAergic cells within the MePV provide this AOB-evoked disynaptic IPSC? Type 2 GFP+ cells are one obvious candidate. AOB afferents can excite these interneurons either by direct synaptic connections (feedforward) or indirectly through glutamatergic principal neurons (feedback). Paired recordings failed to detect any synaptic connection from GFP− neurons onto Type 2 neurons (0 of 33 pairs). Although this result does not entirely rule out their occurrence, it shows that, even if GFP− to Type 2 cell connections exist, they are sparse. Moreover, as many axons of these GFP− cells appeared to be cut, it is possible that local synaptic connections were made strictly in the rostrocaudal direction and thus not detected in coronal slices. As the inhibitory input from Type 2 neurons to GFP− neurons and AOB-evoked disynaptic IPSCs had similar kinetics (rise and decay kinetics above, p > 0.05 with unpaired Student's t test), it is likely that Type 2 GFP+ neurons are feedforward interneurons for AOB afferents. In agreement with this, stimulation of AOB afferents evoked monosynaptic EPSCs in all Type 2 neurons (10 of 10) (Fig. 10C, green trace) that were blocked by NBQX (10 μm, n = 3) (Fig. 10C, red trace).
Because AOB afferents innervate both Type 2 GABAergic neurons and GFP− neurons, the timing of AOB-evoked responses in these two cell types will define how Type 2 interneurons shape olfactory-evoked response of principal cells. To test this, AOB-evoked EPSPs were recorded simultaneously in pairs of GFP+ Type 2 and GFP− neurons (n = 7 pairs: 4 with a Type I and 3 with a Type II cell) (Fig. 10D). In all recorded pairs, evoked EPSPs in Type 2 cells appeared with a shorter delay (1.6 ± 0.1 ms vs 2.9 ± 0.2 ms; n = 7, p = 0.0003 with paired Student's t test) (Fig. 10E,F), faster rise time (1.9 ± 0.3 ms vs 3.9 ± 0.5 ms; n = 7, p = 0.001) (Fig. 10E,G), and larger amplitudes (4.2 ± 0.7 mV vs 1.9 ± 0.3 mV; n = 7, p = 0.02) (Fig. 10E,H) than in GFP− cells. Moreover, Type 2 GFP+ neurons were driven to threshold by AOB afferents at shorter latencies than GFP− neurons (3.2 ± 0.9 ms vs 7.8 ± 1.8 ms; n = 5, p = 0.01) (Fig. 10D,I). These results indicate that AOB afferents will discharge Type 2 GABAergic neurons earlier than GFP− projection neurons.
Discussion
In this study, we have shown that the posteroventral division of the medial amygdala contains heterogeneous populations of GABAergic and non-GABAergic neurons. Different cell types can be identified based on electrophysiological, morphological, and neurochemical criteria, with three types of GABAergic and two types of non-GABAergic neurons. We have also identified those neurons that project to the hypothalamus and shown that one type of GABAergic neuron is a local circuit interneuron and likely provides feedforward inhibition of glutamatergic MePV neurons in response to olfactory input.
Non-GABAergic neurons
We have shown that nearly ∼70% of neurons in the MePV are non-GABAergic. Based on previous reports, it is likely that these cells are glutamatergic (Choi et al., 2005; Bian et al., 2008). Electrophysiologically, these neurons could be grouped into two populations: Type I and Type II cells (Fig. 3). These two cell types were also morphologically distinct, with Type I neurons having a bushy branched dendritic arbor whereas Type II neurons had a sparse dendritic tree (Fig. 4). Stimulation of AOB afferents evoked monosynaptic EPSCs in both cell types, and both were synaptically inhibited by Type 2 feedforward interneurons. Moreover, they had similar projections to both reproductive (MPN) and defensive (AHN) hypothalamic nuclei.
The medial amygdala is the first major point of processing inputs from the accessory olfactory bulb and thus has a similar function to that of the olfactory (piriform) cortex for inputs from the main olfactory bulb. It is therefore interesting to compare neural processing within these two chemosensory regions. The presence of two types of non-GABAergic neurons in the MePV shares similarities with glutamatergic principal cells of the piriform cortex. The main input layer of the piriform cortex (layer II) also contains two electrophysiologically and morphologically distinct cell types that receive olfactory input directly from the bulb (Haberly, 1983; Suzuki and Bekkers, 2006, 2011). Semilunar (SL) cells, similar to Type I neurons, fire regularly spaced APs in response to depolarizing current injections, whereas superficial pyramidal (SP) cells, comparable with Type II neurons, fire AP bursts at the beginning of a sustained depolarization (Suzuki and Bekkers, 2006). However, although the regular firing Type I cells have a more complex dendritic arbor than Type II neurons, the regular firing SL neurons in the piriform cortex lack basal dendrites and have fewer dendritic branches than SP cells (Haberly, 1983; Suzuki and Bekkers, 2006). SP cells in the piriform cortex receive a stronger intracortical excitatory input than do SL cells, most likely because they have more dendritic branches in layer II (Suzuki and Bekkers, 2011). It is therefore likely that Type I cells in the MePV, which similarly have more dendritic branches in the cellular layer, receive stronger inputs from sources other than the AOB than do Type II cells.
Both types of GFP− neurons were found to send projections to reproductive and defensive hypothalamic regions, with a small fraction of neurons having dual projections. Unlike the piriform cortex, these neurons do not appear to innervate local GABAergic cells (Suzuki and Bekkers, 2012). In a previous study, Bian et al. (2008) have described VMH-projecting MeA neurons, located in both MePV and MePD, to be a homogeneous population. These neurons typically had hyperpolarization-activated cationic currents (Ih), low-threshold calcium currents (IT), and pronounced firing frequency accommodation. These properties are reminiscent of our Type II neurons; however, because electrophysiological and morphological properties of these neurons were not characterized in detail and data from different MeA divisions were combined, a direct comparison with our results is not possible.
GABAergic neurons
We identified three types of electrophysiologically distinct GABAergic neurons in the MePV (Fig. 2). Of these, two (Type 1 and Type 3) were projection neurons, whereas Type 2 neurons were local circuit interneurons (Fig. 8). Type 2 neurons could be identified based on their high-frequency AP firing, sometimes stuttering, bright GFP fluorescence, preferred location in the molecular layer, and compact dendritic arbor. Paired recordings showed that these cells make GABAergic synapses onto local non-GABAergic neurons and that they receive a large, fast AOB synaptic input, suggesting that they provide feedforward inhibition for olfactory inputs.
Type 2 cells appear to share some similarities with neurogliaform cells described in the piriform cortex (Young and Sun, 2009; Suzuki and Bekkers, 2010b), neocortical layer 1 (Chu et al., 2003), and CA1 stratum lacunosum-moleculare (Price et al., 2005). Thus, neurogliaform neurons in layer Ia of the piriform cortex also have distinctively bright GFP fluorescence in the GAD67-GFP mouse (Suzuki and Bekkers, 2010b), show a stuttering discharge during sustained depolarization (Suzuki and Bekkers, 2010b), and provide feedforward synaptic inhibition for olfactory input to principal neurons (Suzuki and Bekkers, 2012). Moreover, as with neurogliaform cells in neocortical layer 1 (Chu et al., 2003) and hippocampus (Price et al., 2005), these neurons have synaptic and gap-junction connections. Such interconnected inhibitory networks are thought to generate synchronized neural activity and oscillations (Beierlein et al., 2000), which are thought to be important for olfactory coding and learning (Poo and Isaacson, 2009; Wilson and Sullivan, 2011).
The other two types of GABAergic neurons (Type 1 and Type 3) were found to be projection cells. Dendritic morphologies of both were similar to Type II non-GABAergic neurons, and their axons extended beyond the MePV (Fig. 4). Retrograde tracers injected in either AHN or MPN were found to label both Type 1 and Type 3, but not Type 2, cells. Moreover, in paired recordings, these neurons did not make any local connections. Thus, these two types of neuron do not appear to be local circuit neurons but projection cells. The physiological role of these two cell types is not clear, however. In addition to differences in electrophysiological properties, Types 1 and 3 GABAergic neurons differed in their expression of interneuron markers. Although calbindin, somatostatin, and calretinin were found in Type 1 cells, Type 3 cells were not immunoreactive for any of these markers, suggesting that they belong to a distinct neuron population (Fig. 5F). Our results differ from a previous report in the GAD67-GFP mouse, in which all VMH-projecting neurons in the MePV, and the majority of those in the MePD were described as GFP− and thus non-GABAergic (Bian et al., 2008). While this study concluded that the majority of MeA GABAergic cells were local circuit interneurons, a later study has suggested that most GABAergic neurons in the MeA are projection cells (Bian, 2013). Our results provide a resolution to this conflict, demonstrating that some GABAergic cell subtypes are projection neurons, whereas another electrophysiologically and morphologically defined subtype acts only as a local circuit interneuron.
In conclusion, we have shown that MePV, although not a cortical-like structure, contains similar GABAergic and non-GABAergic, presumably glutamatergic, neurons that can be separated into distinct cell types. With the exception of one local circuit GABAergic interneuron, each of these cell types projects to the hypothalamus. The similar downstream target of these projections raises questions about the functional significance of such wiring. Hypothalamic nuclei involved in social behaviors have been defined as either reproductive or defensive (Swanson, 2000). However, recent studies show that neurons involved in these distinct behaviors can be found in the same region in the ventrolateral VMH (Lin et al., 2011). Interestingly, those involved in fighting are suppressed during mating, suggesting activation of distinct afferent pathways during these behaviors. It is therefore possible that GABAergic and glutamatergic neurons in the MeA innervate functionally distinct cell populations in the hypothalamus. Moreover, these two MeA cell populations might be differentially involved in processing reproductive and defensive chemosignals.
Footnotes
This work was supported by the National Health and Medical Research Council of Australia and the Australian Research Council to P.S. and University of Queensland scholarship to S.K. We thank Alan Woodruff for comments on the manuscript and Peter Stratton for help with statistical analysis.
The authors declare no competing financial interests.
References
- Ascoli GA, Alonso-Nanclares L, Anderson SA, Barrionuevo G, Benavides-Piccione R, Burkhalter A, Buzsáki G, Cauli B, Defelipe J, Fairén A, Feldmeyer D, Fishell G, Fregnac Y, Freund TF, Gardner D, Gardner EP, Goldberg JH, Helmstaedter M, Hestrin S, Karube F, et al. Petilla terminology: nomenclature of features of GABAergic interneurons of the cerebral cortex. Nat Rev Neurosci. 2008;9:557–568. doi: 10.1038/nrn2402. [DOI] [PMC free article] [PubMed] [Google Scholar]
- Beierlein M, Gibson JR, Connors BW. A network of electrically coupled interneurons drives synchronized inhibition in neocortex. Nat Neurosci. 2000;3:904–910. doi: 10.1038/78809. [DOI] [PubMed] [Google Scholar]
- Bian X. Physiological and morphological characterization of GABAergic neurons in the medial amygdala. Brain Res. 2013;1509:8–19. doi: 10.1016/j.brainres.2013.03.012. [DOI] [PubMed] [Google Scholar]
- Bian X, Yanagawa Y, Chen WR, Luo M. Cortical-like functional organization of the pheromone-processing circuits in the medial amygdala. J Neurophysiol. 2008;99:77–86. doi: 10.1152/jn.00902.2007. [DOI] [PubMed] [Google Scholar]
- Brennan PA, Zufall F. Pheromonal communication in vertebrates. Nature. 2006;444:308–315. doi: 10.1038/nature05404. [DOI] [PubMed] [Google Scholar]
- Bupesh M, Legaz I, Abellán A, Medina L. Multiple telencephalic and extratelencephalic embryonic domains contribute neurons to the medial extended amygdala. J Comp Neurol. 2011;519:1505–1525. doi: 10.1002/cne.22581. [DOI] [PubMed] [Google Scholar]
- Canteras NS, Simerly RB, Swanson LW. Organization of projections from the medial nucleus of the amygdala: a PHAL study in the rat. J Comp Neurol. 1995;360:213–245. doi: 10.1002/cne.903600203. [DOI] [PubMed] [Google Scholar]
- Cassell MD, Freedman LJ, Shi C. The intrinsic organization of the central extended amygdala. Ann N Y Acad Sci. 1999;877:217–241. doi: 10.1111/j.1749-6632.1999.tb09270.x. [DOI] [PubMed] [Google Scholar]
- Cauli B, Porter JT, Tsuzuki K, Lambolez B, Rossier J, Quenet B, Audinat E. Classification of fusiform neocortical interneurons based on unsupervised clustering. Proc Natl Acad Sci U S A. 2000;97:6144–6149. doi: 10.1073/pnas.97.11.6144. [DOI] [PMC free article] [PubMed] [Google Scholar]
- Choi GB, Dong HW, Murphy AJ, Valenzuela DM, Yancopoulos GD, Swanson LW, Anderson DJ. Lhx6 delineates a pathway mediating innate reproductive behaviors from the amygdala to the hypothalamus. Neuron. 2005;46:647–660. doi: 10.1016/j.neuron.2005.04.011. [DOI] [PubMed] [Google Scholar]
- Chu Z, Galarreta M, Hestrin S. Synaptic interactions of late-spiking neocortical neurons in layer 1. J Neurosci. 2003;23:96–102. doi: 10.1523/JNEUROSCI.23-01-00096.2003. [DOI] [PMC free article] [PubMed] [Google Scholar]
- Connors BW, Gutnick MJ. Intrinsic firing patterns of diverse neocortical neurons. Trends Neurosci. 1990;13:99–104. doi: 10.1016/0166-2236(90)90185-D. [DOI] [PubMed] [Google Scholar]
- Cooke BM, Woolley CS. Sexually dimorphic synaptic organization of the medial amygdala. J Neurosci. 2005;25:10759–10767. doi: 10.1523/JNEUROSCI.2919-05.2005. [DOI] [PMC free article] [PubMed] [Google Scholar]
- Cooke BM, Stokas MR, Woolley CS. Morphological sex differences and laterality in the prepubertal medial amygdala. J Comp Neurol. 2007;501:904–915. doi: 10.1002/cne.21281. [DOI] [PubMed] [Google Scholar]
- Dall'Oglio A, Gehlen G, Achaval M, Rasia-Filho AA. Dendritic branching features of Golgi-impregnated neurons from the “ventral” medial amygdala subnuclei of adult male and female rats. Neurosci Lett. 2008;439:287–292. doi: 10.1016/j.neulet.2008.05.025. [DOI] [PubMed] [Google Scholar]
- Dielenberg RA, Hunt GE, McGregor IS. “When a rat smells a cat”: the distribution of Fos immunoreactivity in rat brain following exposure to a predatory odor. Neuroscience. 2001;104:1085–1097. doi: 10.1016/S0306-4522(01)00150-6. [DOI] [PubMed] [Google Scholar]
- Fernandez-Fewell GD, Meredith M. c-fos expression in vomeronasal pathways of mated or pheromone-stimulated male golden hamsters: contributions from vomeronasal sensory input and expression related to mating performance. J Neurosci. 1994;14:3643–3654. doi: 10.1523/JNEUROSCI.14-06-03643.1994. [DOI] [PMC free article] [PubMed] [Google Scholar]
- Freund TF, Buzsáki G. Interneurons of the hippocampus. Hippocampus. 1996;6:347–470. doi: 10.1002/(SICI)1098-1063(1996)6:4<347::AID-HIPO1>3.0.CO;2-I. [DOI] [PubMed] [Google Scholar]
- Galarreta M, Hestrin S. A network of fast-spiking cells in the neocortex connected by electrical synapses. Nature. 1999;402:72–75. doi: 10.1038/47029. [DOI] [PubMed] [Google Scholar]
- Gibson JR, Beierlein M, Connors BW. Two networks of electrically coupled inhibitory neurons in neocortex. Nature. 1999;402:75–79. doi: 10.1038/47035. [DOI] [PubMed] [Google Scholar]
- Haberly LB. Structure of the piriform cortex of the opossum: I. Description of neuron types with Golgi methods. J Comp Neurol. 1983;213:163–187. doi: 10.1002/cne.902130205. [DOI] [PubMed] [Google Scholar]
- Hall E. The amygdala of the cat: a Golgi study. Z Zellforsch Mikrosk Anat. 1972;134:439–458. doi: 10.1007/BF00307668. [DOI] [PubMed] [Google Scholar]
- Isaacson JS, Scanziani M. How inhibition shapes cortical activity. Neuron. 2011;72:231–243. doi: 10.1016/j.neuron.2011.09.027. [DOI] [PMC free article] [PubMed] [Google Scholar]
- Karagiannis A, Gallopin T, Dávid C, Battaglia D, Geoffroy H, Rossier J, Hillman EM, Staiger JF, Cauli B. Classification of NPY-expressing neocortical interneurons. J Neurosci. 2009;29:3642–3659. doi: 10.1523/JNEUROSCI.0058-09.2009. [DOI] [PMC free article] [PubMed] [Google Scholar]
- Kemppainen S, Pitkänen A. Distribution of parvalbumin, calretinin, and calbindin-D(28k) immunoreactivity in the rat amygdaloid complex and colocalization with gamma-aminobutyric acid. J Comp Neurol. 2000;426:441–467. doi: 10.1002/1096-9861(20001023)426:3<441::AID-CNE8>3.0.CO;2-7. [DOI] [PubMed] [Google Scholar]
- LeDoux J. The amygdala. Curr Biol. 2007;17:R868–R874. doi: 10.1016/j.cub.2007.08.005. [DOI] [PubMed] [Google Scholar]
- LeDoux J. Rethinking the emotional brain. Neuron. 2012;73:653–676. doi: 10.1016/j.neuron.2012.02.004. [DOI] [PMC free article] [PubMed] [Google Scholar]
- Lehman MN, Winans SS, Powers JB. Medial nucleus of the amygdala mediates chemosensory control of male hamster sexual behavior. Science. 1980;210:557–560. doi: 10.1126/science.7423209. [DOI] [PubMed] [Google Scholar]
- Lin D, Boyle MP, Dollar P, Lee H, Lein ES, Perona P, Anderson DJ. Functional identification of an aggression locus in the mouse hypothalamus. Nature. 2011;470:221–226. doi: 10.1038/nature09736. [DOI] [PMC free article] [PubMed] [Google Scholar]
- Mahanty NK, Sah P. Calcium-permeable AMPA receptors mediate long-term potentiation in interneurons in the amygdala. Nature. 1998;394:683–687. doi: 10.1038/29312. [DOI] [PubMed] [Google Scholar]
- Markram H, Toledo-Rodriguez M, Wang Y, Gupta A, Silberberg G, Wu C. Interneurons of the neocortical inhibitory system. Nat Rev Neurosci. 2004;5:793–807. doi: 10.1038/nrn1519. [DOI] [PubMed] [Google Scholar]
- Martinez RC, Carvalho-Netto EF, Ribeiro-Barbosa ER, Baldo MV, Canteras NS. Amygdalar roles during exposure to a live predator and to a predator-associated context. Neuroscience. 2011;172:314–328. doi: 10.1016/j.neuroscience.2010.10.033. [DOI] [PubMed] [Google Scholar]
- Martinez-Marcos A. On the organization of olfactory and vomeronasal cortices. Prog Neurobiol. 2009;87:21–30. doi: 10.1016/j.pneurobio.2008.09.010. [DOI] [PubMed] [Google Scholar]
- McCormick DA, Connors BW, Lighthall JW, Prince DA. Comparative electrophysiology of pyramidal and sparsely spiny stellate neurons of the neocortex. J Neurophysiol. 1985;54:782–806. doi: 10.1152/jn.1985.54.4.782. [DOI] [PubMed] [Google Scholar]
- McDonald AJ. Cell types and intrinsic connections of the amygdala. In: Aggleton JP, editor. The amygdala: neurobiological aspects of emotion, memory and mental dysfunction. New York: Wiley; 1992. pp. 67–96. [Google Scholar]
- McGregor IS, Hargreaves GA, Apfelbach R, Hunt GE. Neural correlates of cat odor-induced anxiety in rats: region-specific effects of the benzodiazepine midazolam. J Neurosci. 2004;24:4134–4144. doi: 10.1523/JNEUROSCI.0187-04.2004. [DOI] [PMC free article] [PubMed] [Google Scholar]
- Meredith M, Westberry JM. Distinctive responses in the medial amygdala to same-species and different-species pheromones. J Neurosci. 2004;24:5719–5725. doi: 10.1523/JNEUROSCI.1139-04.2004. [DOI] [PMC free article] [PubMed] [Google Scholar]
- Mohedano-Moriano A, Pro-Sistiaga P, Ubeda-Bañón I, Crespo C, Insausti R, Martinez-Marcos A. Segregated pathways to the vomeronasal amygdala: differential projections from the anterior and posterior divisions of the accessory olfactory bulb. Eur J Neurosci. 2007;25:2065–2080. doi: 10.1111/j.1460-9568.2007.05472.x. [DOI] [PubMed] [Google Scholar]
- Nelson RJ, Trainor BC. Neural mechanisms of aggression. Nat Rev Neurosci. 2007;8:536–546. doi: 10.1038/nrn2174. [DOI] [PubMed] [Google Scholar]
- Newman SW. The medial extended amygdala in male reproductive behavior: a node in the mammalian social behavior network. Ann N Y Acad Sci. 1999;877:242–257. doi: 10.1111/j.1749-6632.1999.tb09271.x. [DOI] [PubMed] [Google Scholar]
- Pardo-Bellver C, Cádiz-Moretti B, Novejarque A, Martínez-Garcia F, Lanuza E. Differential efferent projections of the anterior, posteroventral, and posterodorsal subdivisions of the medial amygdala in mice. Front Neuroanat. 2012;6:33. doi: 10.3389/fnana.2012.00033. [DOI] [PMC free article] [PubMed] [Google Scholar]
- Pare D, Duvarci S. Amygdala microcircuits mediating fear expression and extinction. Curr Opin Neurobiol. 2012;22:717–723. doi: 10.1016/j.conb.2012.02.014. [DOI] [PMC free article] [PubMed] [Google Scholar]
- Paxinos G, Franklin BJK. The mouse brain in stereotaxic coordinates. Ed 2. San Diego: Academic; 2001. [Google Scholar]
- Phelps EA, LeDoux JE. Contributions of the amygdala to emotion processing: from animal models to human behavior. Neuron. 2005;48:175–187. doi: 10.1016/j.neuron.2005.09.025. [DOI] [PubMed] [Google Scholar]
- Polepalli JS, Sullivan RK, Yanagawa Y, Sah P. A specific class of interneuron mediates inhibitory plasticity in the lateral amygdala. J Neurosci. 2010;30:14619–14629. doi: 10.1523/JNEUROSCI.3252-10.2010. [DOI] [PMC free article] [PubMed] [Google Scholar]
- Poo C, Isaacson JS. Odor representations in olfactory cortex: “sparse” coding, global inhibition, and oscillations. Neuron. 2009;62:850–861. doi: 10.1016/j.neuron.2009.05.022. [DOI] [PMC free article] [PubMed] [Google Scholar]
- Pouille F, Scanziani M. Enforcement of temporal fidelity in pyramidal cells by somatic feed-forward inhibition. Science. 2001;293:1159–1163. doi: 10.1126/science.1060342. [DOI] [PubMed] [Google Scholar]
- Price CJ, Cauli B, Kovacs ER, Kulik A, Lambolez B, Shigemoto R, Capogna M. Neurogliaform neurons form a novel inhibitory network in the hippocampal CA1 area. J Neurosci. 2005;25:6775–6786. doi: 10.1523/JNEUROSCI.1135-05.2005. [DOI] [PMC free article] [PubMed] [Google Scholar]
- Rasia-Filho AA, Fabian C, Rigoti KM, Achaval M. Influence of sex, estrous cycle and motherhood on dendritic spine density in the rat medial amygdala revealed by the Golgi method. Neuroscience. 2004;126:839–847. doi: 10.1016/j.neuroscience.2004.04.009. [DOI] [PubMed] [Google Scholar]
- Real MA, Heredia R, Labrador Mdel C, Dávila JC, Guirado S. Expression of somatostatin and neuropeptide Y in the embryonic, postnatal, and adult mouse amygdalar complex. J Comp Neurol. 2009;513:335–348. doi: 10.1002/cne.21970. [DOI] [PubMed] [Google Scholar]
- Scalia F, Winans SS. The differential projections of the olfactory bulb and accessory olfactory bulb in mammals. J Comp Neurol. 1975;161:31–55. doi: 10.1002/cne.901610105. [DOI] [PubMed] [Google Scholar]
- Schindelin J, Arganda-Carreras I, Frise E, Kaynig V, Longair M, Pietzsch T, Preibisch S, Rueden C, Saalfeld S, Schmid B, Tinevez JY, White DJ, Hartenstein V, Eliceiri K, Tomancak P, Cardona A. Fiji: an open-source platform for biological-image analysis. Nat Methods. 2012;9:676–682. doi: 10.1038/nmeth.2019. [DOI] [PMC free article] [PubMed] [Google Scholar]
- Sholl DA. Dendritic organization in the neurons of the visual and motor cortices of the cat. J Anat. 1953;87:387–406. [PMC free article] [PubMed] [Google Scholar]
- Sosulina L, Meis S, Seifert G, Steinhäuser C, Pape HC. Classification of projection neurons and interneurons in the rat lateral amygdala based upon cluster analysis. Mol Cell Neurosci. 2006;33:57–67. doi: 10.1016/j.mcn.2006.06.005. [DOI] [PubMed] [Google Scholar]
- Sosulina L, Graebenitz S, Pape HC. GABAergic interneurons in the mouse lateral amygdala: a classification study. J Neurophysiol. 2010;104:617–626. doi: 10.1152/jn.00207.2010. [DOI] [PubMed] [Google Scholar]
- Spampanato J, Polepalli J, Sah P. Interneurons in the basolateral amygdala. Neuropharmacology. 2011;60:765–773. doi: 10.1016/j.neuropharm.2010.11.006. [DOI] [PubMed] [Google Scholar]
- Sun N, Cassell MD. Intrinsic GABAergic neurons in the rat central extended amygdala. J Comp Neurol. 1993;330:381–404. doi: 10.1002/cne.903300308. [DOI] [PubMed] [Google Scholar]
- Suzuki N, Bekkers JM. Neural coding by two classes of principal cells in the mouse piriform cortex. J Neurosci. 2006;26:11938–11947. doi: 10.1523/JNEUROSCI.3473-06.2006. [DOI] [PMC free article] [PubMed] [Google Scholar]
- Suzuki N, Bekkers JM. Inhibitory neurons in the anterior piriform cortex of the mouse: classification using molecular markers. J Comp Neurol. 2010a;518:1670–1687. doi: 10.1002/cne.22295. [DOI] [PubMed] [Google Scholar]
- Suzuki N, Bekkers JM. Distinctive classes of GABAergic interneurons provide layer-specific phasic inhibition in the anterior piriform cortex. Cereb Cortex. 2010b;20:2971–2984. doi: 10.1093/cercor/bhq046. [DOI] [PMC free article] [PubMed] [Google Scholar]
- Suzuki N, Bekkers JM. Two layers of synaptic processing by principal neurons in piriform cortex. J Neurosci. 2011;31:2156–2166. doi: 10.1523/JNEUROSCI.5430-10.2011. [DOI] [PMC free article] [PubMed] [Google Scholar]
- Suzuki N, Bekkers JM. Microcircuits mediating feedforward and feedback synaptic inhibition in the piriform cortex. J Neurosci. 2012;32:919–931. doi: 10.1523/JNEUROSCI.4112-11.2012. [DOI] [PMC free article] [PubMed] [Google Scholar]
- Swanson LW. Cerebral hemisphere regulation of motivated behavior. Brain Res. 2000;886:113–164. doi: 10.1016/S0006-8993(00)02905-X. [DOI] [PubMed] [Google Scholar]
- Swanson LW, Petrovich GD. What is the amygdala? Trends Neurosci. 1998;21:323–331. doi: 10.1016/S0166-2236(98)01265-X. [DOI] [PubMed] [Google Scholar]
- Tamamaki N, Yanagawa Y, Tomioka R, Miyazaki J, Obata K, Kaneko T. Green fluorescent protein expression and colocalization with calretinin, parvalbumin, and somatostatin in the GAD67-GFP knock-in mouse. J Comp Neurol. 2003;467:60–79. doi: 10.1002/cne.10905. [DOI] [PubMed] [Google Scholar]
- Thorndike RL. Who belongs in the family? Psychometrika. 1953;18:267–276. doi: 10.1007/BF02289263. [DOI] [Google Scholar]
- von Campenhausen H, Mori K. Convergence of segregated pheromonal pathways from the accessory olfactory bulb to the cortex in the mouse. Eur J Neurosci. 2000;12:33–46. doi: 10.1046/j.1460-9568.2000.00879.x. [DOI] [PubMed] [Google Scholar]
- Ward JH. Hierarchical grouping to optimize an objective function. J Am Stat Assoc. 1963;58:236. doi: 10.1080/01621459.1963.10500845. [DOI] [Google Scholar]
- Wilson DA, Sullivan RM. Cortical processing of odor objects. Neuron. 2011;72:506–519. doi: 10.1016/j.neuron.2011.10.027. [DOI] [PMC free article] [PubMed] [Google Scholar]
- Woodruff AR, Sah P. Networks of parvalbumin-positive interneurons in the basolateral amygdala. J Neurosci. 2007;27:553–563. doi: 10.1523/JNEUROSCI.3686-06.2007. [DOI] [PMC free article] [PubMed] [Google Scholar]
- Young A, Sun QQ. GABAergic inhibitory interneurons in the posterior piriform cortex of the GAD67-GFP mouse. Cereb Cortex. 2009;19:3011–3029. doi: 10.1093/cercor/bhp072. [DOI] [PMC free article] [PubMed] [Google Scholar]