

Abstract
Whereas both GABAA receptors (GABAARs) and glycine receptors (GlyRs) play a role in control of dorsal horn neuron excitability, their relative contribution to inhibition of small diameter primary afferent terminals remains controversial. To address this, we designed an approach for quantitative analyses of the distribution of GABAAR-subunits, GlyR α1-subunit and their anchoring protein, gephyrin, on terminals of rat spinal sensory afferents identified by Calcitonin-Gene-Related-Peptide (CGRP) for peptidergic terminals, and by Isolectin-B4 (IB4) for nonpeptidergic terminals. The approach was designed for light microscopy, which is compatible with the mild fixation conditions necessary for immunodetection of several of these antigens. An algorithm was designed to recognize structures with dimensions similar to those of the microscope resolution. To avoid detecting false colocalization, the latter was considered significant only if the degree of pixel overlap exceeded that expected from randomly overlapping pixels given a hypergeometric distribution. We found that both CGRP+ and IB4+ terminals were devoid of GlyR α1-subunit and gephyrin. The α1 GABAAR was also absent from these terminals. In contrast, the GABAAR α2/α3/α5 and β3 subunits were significantly expressed in both terminal types, as were other GABAAR-associated-proteins (α-Dystroglycan/Neuroligin-2/Collybistin-2). Ultrastructural immunocytochemistry confirmed the presence of GABAAR β3 subunits in small afferent terminals. Real-time quantitative PCR (qRT-PCR) confirmed the results of light microscopy immunochemical analysis. These results indicate that dorsal horn inhibitory synapses follow different rules of organization at presynaptic versus postsynaptic sites (nociceptive afferent terminals vs inhibitory synapses on dorsal horn neurons). The absence of gephyrin clusters from primary afferent terminals suggests a more diffuse mode of GABAA-mediated transmission at presynaptic than at postsynaptic sites.
Keywords: calcitonin gene-related peptide, dorsal root ganglion, dystroglycan, isolectin B4, pain, synaptic inhibition
Introduction
Pain-related information transmitted from the periphery to the brain is regulated by ionotropic inhibition at the first afferent synapses in the spinal dorsal horn. Intrathecal administration of strychnine and bicuculline in the adult rat can replicate symptoms characteristic of neuropathic pain (Yaksh, 1989; Sherman and Loomis, 1994; Sorkin et al., 1998; Ren and Dubner, 2008), identifying GABAA receptors (GABAARs) and glycine receptors (GlyRs) as key regulators of spinal nociceptive output. Furthermore, in experimental models of neuropathic pain, hypersensitivity can be reversed through activation of specific spinal GABAAR subtypes (Knabl et al., 2008; Paul et al., 2014) and part of this GABAergic action appears to be mediated by a direct presynaptic inhibition of small diameter primary afferent terminals through the GABAAR α2 subunit (Witschi et al., 2011). However, the details of the synaptic arrangement of GABAARs/GlyRs and their anchoring protein gephyrin on these terminals remain elusive (Bardoni et al., 2013). Even less is known regarding a possible involvement of GlyRs in presynaptic control of small diameter afferents in the dorsal horn. Whereas functional evidence of presynaptic glycinergic control is lacking (Eccles et al., 1963; Jiménez et al., 1987; Maxwell and Riddell, 1999; Willis, 2006), past reports have described the expression of some GlyR subunits in the dorsal root ganglion (DRG) (Furuyama et al., 1992), suggesting that they may play a role in controlling afferent terminal excitability (Dutertre et al., 2012).
To address these issues, we conducted a quantitative analysis of the distribution of GABAAR α1/α2/α3/α5 and β3 subunits, the GlyR α1 subunit, and several proteins associated with inhibitory synapses [gephyrin/α-Dystroglycan (α-DG)/Neuroligin-2 (NL2)/Collybistin-2 (CB2)] in small diameter afferent terminals identified by calcitonin-gene-related-peptide (CGRP) immunoreactivity and binding of the isolectin-B4 (IB4). We performed light and electron microscopy immunohistochemical analyses of multiple signals. We mildly fixed the tissue slices to maximize antigen detection and to minimize false-negative detection of certain proteins in subcellular compartments. We also designed a signal detection protocol to identify structures with dimensions close to the resolution limits [point spread function (PSF)] of the laser scanning confocal system we used and to avoid biases from arbitrarily choosing intensity thresholds. Finally, we designed a quantitative analysis protocol to avoid false-positive detection of colocalization at the light microscopy level. We then performed ultrastructural analyses of the distribution of subunits for which a normal fixation protocol had little impact on detection. Finally, we analyzed mRNA expression for each of the proteins under study in primary afferent versus dorsal horn compartments.
We found that both the GlyR α1 subunit and the anchoring protein gephyrin (Fritschy et al., 2008; Tretter et al., 2012; Tyagarajan and Fritschy, 2014) were absent from small diameter primary afferent terminals. In addition, GABAAR subtypes followed a specific expression pattern; there was a lack of the presynaptic GABAAR α1 subunit and a preferential distribution of the GABAAR α2 subunit on primary afferent terminals. In contrast to the lack of presynaptic gephyrin, we found other GABAAR-associated proteins (α-DG/NL2/CB2) in small diameter primary afferents, suggesting gephyrin-free presynaptic inhibitory arrangements. The lack of gephyrin clusters on primary afferent terminals suggests a more diffuse mode of GABAA-mediated transmission at presynaptic sites.
Materials and Methods
Animals
The present study was performed in young adult male Sprague Dawley rats weighting 200–225 g (Charles River Laboratories). All experimental procedures were performed in accordance with the Care and Use of Experimental Animals from the Canadian Council on Animal Care and all experimental procedures were approved by the McGill and Laval Universities Animal Care Committees. A total of 61 rats were used in this study. Forty-four rats were processed with a mild fixation tissue protocol, six rats were processed with a regular perfusion fixation protocol, four rats were used for electron microscopy, and seven rats were used for qRT-PCR.
Antibodies and markers
Anti-GABAAR subtype-specific antibodies.
The antibodies raised against the α-GABAAR subtypes used in this study were generously provided by Dr. Jean-Marc Fritschy. These primary polyclonal antibodies were raised against synthetic peptide sequences derived from the GABAAR α1, α2, α3, and α5 subunit cDNAs and coupled to KLH (Fritschy and Möhler, 1995). The following peptide sequences were used: α1 subunit residues 1–16, α2 subunit residues 1–9, α3 subunit residues 1–15, and α5 subunit residues 1–29. All of these antibodies were raised in guinea pigs. The dilutions of the antibodies were as follows: α1 subunit, 1:20,000; α2 subunit, 1:10,000; α3 subunit, 1:10,000; and α5 subunit, 1:4000. Immunocytochemical characterization of these antibodies has been described previously (Benke et al., 1991; Benke et al., 1996). Their specificity has been evidenced by using mutant mice lacking the α1, α2, α3, and α5 subunit genes. Immunocytochemistry showed a complete absence of immunolabeling of the GABAA α1, α2, α3, and α5 subunits in α1, α2, α3, and α5 KO mice (Fritschy et al., 2006; Kralic et al., 2006). These antibodies have also been well characterized and used immunohistochemically in human tissues, including spinal cord (Bohlhalter et al., 1994; Bohlhalter et al., 1996; Waldvogel et al., 2010; Paul et al., 2012). The anti-GABAAR β3 subunit antibodies were graciously provided by Dr. Werner Sieghart (antibody raised in rabbit) or by Dr. Ryuichi Shigemoto (antibody raised in guinea pig). They were both used, and provided identical results. For more details, see Kasugai et al., 2010. These two antibodies were raised against maltose-binding protein and aa 345–408 of the rat β3 subunit, part of the large intracellular loop between putative transmembrane domains M3 and M4. Antibodies were isolated by chromatography on a fusion protein consisting of glutathione S-transferase, amino acids 345–408 of the β3 subunit, and seven histidines (Tögel et al., 1994; Slany et al., 1995; Todd et al., 1996; Kasugai et al., 2010).
GABAAR-associated protein antibodies.
To identify α-DG, a monoclonal antibody was used (clone IIH6C4, catalog #05-593; Millipore). This antibody targets a functional carbohydrate epitope on α-DG (Gee et al., 1994; Goddeeris et al., 2013), added in part by the glycosyltransferase LARGE and is essential for ligand binding (Leschziner et al., 2000; Goddeeris et al., 2013). The IIH6 antibody is highly specific for α-DG (Ervasti and Campbell, 1993; Jacobson et al., 1998; Moore et al., 2002). To detect NL2, an affinity-purified rabbit antibody was used (catalog #129203; Synaptic Systems). This affinity-purified antibody was raised against a synthetic peptide of rat NL2 (aa 732–749) coupled to KLH via an added C-terminal cysteine residue. The antibody is highly specific for NL2 and does not display any cross-reactivity with NL1, NL3, or NL4 (information provided by Synaptic Systems). To reveal CB2, we used an affinity-purified rabbit antibody (catalog #261003; Synaptic Systems). This antibody was raised against aa 4–229 of rat CB. This antibody is highly specific and only recognizes the three described splice variants of CB2 (information provided by Synaptic Systems).
Anti-glycine receptor α1 subunit and anti-gephyrin antibodies.
The GlyR α1 subunit was detected with a monoclonal antibody (mAb2b, mouse, 1:500, catalog #146111; Synaptic Systems; Pfeiffer et al., 1982; Pfeiffer et al., 1984; Schröder et al., 1991; Baer et al., 2003). This monoclonal antibody was raised against a peptide coupled to KLH corresponding to N-terminal residues 1–10 of the human α1 subunit (Durisic et al., 2012) and showed a single band of 48 kDa on Western blot (data supplied by Synaptic Systems). A mouse monoclonal antibody (Pfeiffer et al., 1984; Kirsch and Betz, 1998) raised against purified rat gephyrin was used in this study (mAb7a, 1:500, catalog #147011 and catalog #147011C3 for the mAb7a gephyrin-Oyster for double staining with the anti-GlyR mAb2b monoclonal antibody; Synaptic Systems). The antigephyrin mAb7a antibody is highly specific for immunohistochemical investigations of gephyrin, as documented by several studies using light and electron microscopy (Kneussel et al., 1999; Lorenzo et al., 2004; Schneider Gasser et al., 2006; Mukherjee et al., 2011), and as shown by the complete absence of staining in gephyrin KO mice (Feng et al., 1998; Kneussel et al., 1999; Fischer et al., 2000). This antibody does not interfere with any of the isolated domains of gephyrin involved in its own clustering nor with the GlyR and GABAAR clustering at inhibitory postsynaptic sites (Lardi-Studler et al., 2007). Because gephyrin immunolabeling identifies a protein associated with the postsynaptic membrane at inhibitory synapses, its colocalization with receptor subunits was used as a marker of the synaptic location of these receptor subunits (Lorenzo et al., 2004).
Markers of small diameter afferent terminals.
CGRP immunoreactivity was used as a specific marker of peptidergic primary afferent terminals because it is not present in any other types of axons in the dorsal horn (Rosenfeld et al., 1983; Gibson et al., 1984; Hunt and Rossi, 1985; Ju et al., 1987). The anti-CGRP antibody (1:2000, catalog #C8198; Sigma) was raised in rabbit using synthetic rat CGRP conjugated to KLH as the immunogen. This antibody specifically recognizes the CGRP C-terminal segment (aa 24–37) of rat CGRP. This antiserum shows no cross-reactivity with any other peptide except human CGRP and rat and human β-CGRP (data supplied by Sigma); staining was completely abolished when the antiserum was preabsorbed with rat CGRP (data supplied by Sigma). IB4 binding has been used as a marker of a subset of small diameter primary afferents, including all of the nonpeptidergic nociceptive terminals (Sugiura, 1989; Rice, 1993; Alvarez and Fyffe, 2000; Ribeiro-da-Silva, 2004; Fang et al., 2006). However, it should be noted that, in the rat, a small subset of primary afferents both express CGRP and bind IB4 (Priestley et al., 2002). IB4 conjugated to Alexa Fluor 488 (1:200, catalog #I21411; Invitrogen) was used in this study to label nonpeptidergic C-terminals.
Markers of inhibitory terminals.
A monoclonal mouse anti-Glutamate Acid Decarboxylase 65 (GAD65) antibody (1:1000, catalog #MAB351; Millipore) was used in this study. This antibody is an IgG2a raised against purified rat brain GAD as an immunogen; it has been tested in rat CNS and human brain and staining was absent in the presence of the immunogen (data supplied by Millipore).
Anti-KCC2 antibody.
A polyclonal antibody raised in rabbit (catalog #07-432; Millipore) was used in this study. This antibody was raised against an N-terminal His-tag fusion protein corresponding to aa 932–1043 of the rat KCC2 intracellular C terminus (Williams et al., 1999; Mercado et al., 2006). This antibody is highly specific for rat KCC2, recognizes the KCC2a and KCC2b isoforms, and does not show any sequence homology with other KCCs or cotransporters.
Control for possible antibody cross-reactivities.
Control experiments for possible antibody cross-reactivities were run by simply omitting, in a systematic manner, one of the primary antibodies in the double- or triple-staining combinations. This allowed us to exclude cross-reactivities in the multiple labeling experiments.
Secondary antibodies.
The secondary antibodies and other related reagents used in this study are listed in Tables 1 and 2.
Table 1.
Secondary antibodies for confocal microscopy
| Antibody | Company (catalog #) | Dilution |
|---|---|---|
| Donkey anti-mouse IgG-Alexa Fluor 647 | Invitrogen/Molecular Probes (A-31571) | 1:500 |
| Donkey anti-guinea pig rhodamine red X-conjugated IgG | Jackson Immunoresearch (706-296-148) | 1:500 |
| Donkey anti-rabbit rhodamine red X-conjugated IgG | Jackson Immunoresearch (711-296-152) | 1:500 |
| Donkey anti-rabbit IgG-Alexa Fluor 488 | Invitrogen/Molecular Probes (A-21206) | 1:500 |
Table 2.
Secondary antibodies for electron microscopy
| Antibody | Company (catalog #) | Dilution |
|---|---|---|
| Goat gold-conjugated anti-rabbit IgG | Nanoprobes (2004) | 1:200 |
| Goat anti-mouse IgG | MP Biomedicals (67028) | 1:50 |
| Mouse anti-HRP IgG | Medimabs (A6-2) | 1:30 |
Tissue processing and immunocytochemistry
Two main protocols of fixation were tested for all types of markers used in this study (see Mild fixation protocol and Perfusion fixation protocol, below). Classically, immunolabeling of proteins from excised CNS tissue is performed after vascular perfusion of the animal with 4% paraformaldehyde (PFA) in phosphate buffer (PB) and 2 h of immersion in the same fixative. However, GABAAR, GlyR, and gephyrin require a low PFA concentration fixation on fresh frozen tissue samples, as described previously (Schneider Gasser et al., 2006; Fritschy, 2008). This mild fixation protocol has been used previously by L.-E.L. in recent publications (Lorenzo et al., 2006; Lorenzo et al., 2007). In the present study, we combined this technique of immunolabeling with the syringe expulsion of fresh spinal cord. The use of these combined techniques made it possible to perform immunostainings on fresh after fixed L4-L5 lumbar segments of the spinal cord, in which most of the sciatic nerve afferents terminate.
Mild fixation protocol
Thirty-eight rats were anesthetized by isoflurane inhalation in an induction chamber and quickly killed by decapitation. A skin incision was made along the back of the animal. A 10 ml syringe equipped with an 18 Ga needle was filled previously with cold PBS. The extraction consisted of inserting the needle in the spinal canal at the L6-S1 level and then ejecting the whole spinal cord by a strong flow of cold PBS through the spinal canal. The spinal cord extracted in this way was immediately frozen in powdered dry ice for 1 min. The L4-L5 spinal cord segments were separated from the whole spinal cord with a cold razor blade. To keep the tissue frozen and to avoid any protein denaturation, the spinal cord segments were manipulated with cold forceps on a very cold Petri dish placed upside-down on dry ice; then, the L4-L5 spinal cord segments were placed in precooled 2 ml plastic tubes, which were stored in a −80°C freezer until further tissue processing.
Transverse, 14-μm-thick sections were cut from the frozen spinal cord with a cryostat (CM 3050S; Leica) and mounted onto gelatinin-subbed slides (Fisherbrand). They were then immersed for 10 min in freshly depolymerized 4% PFA in 0.1 m sodium PB (0.1 m), pH 7.4, and rinsed in PBS (0.01 m; 3 × 10 min). Sections were incubated for 12 h at 4°C in primary antibody mixtures diluted in PBS containing 4% normal donkey serum. Triton X-100 was never added to the solutions. After washing (3 × 10 min), the sections were immersed in a solution containing a mixture of the appropriate fluorochrome-conjugated secondary antibodies diluted in PBS, pH 7.4, containing 4% normal donkey serum (catalog # 017-000-121; Jackson Immunoresearch) for 1 h at room temperature; then, sections were quickly immersed in distilled water and coverslipped using Aquapolymount (Polysciences).
Perfusion fixation protocol
Six Wistar rats were anesthetized with Equithesin (6.5 mg of chloral hydrate and 3 mg of sodium pentobarbital in a volume of 0.3 ml, i.p., per 100 g body weight). Animals were perfused transcardially with 4% PFA in 0.1 m PB, pH 7.4, for 30 min. Spinal cord segments L4-L5 were collected, postfixed for 2 h in the same fixative, and cryoprotected by immersion in 30% sucrose in 0.1 m PB overnight at 4°C.
Transverse sections were cut at 30 μm on a sledge freezing microtome (SM2000R; Leica). Sections were collected into tissue culture plates with 24 wells, washed in PBS, pH 7.4, with 0.2% Triton (PBS+T) for 10 min, and washed twice in PBS (5 min each). The sections were then incubated for 12 h at 4°C in primary antibody mixtures diluted in PBS+T containing 4% normal donkey serum. After washing in PBS, the tissue was incubated for 2 h at room temperature in a solution containing a mixture of appropriate fluorochrome-conjugated secondary antibodies, diluted in PBS+T, pH 7.4, containing 4% normal donkey serum. Last, sections were washed for 15 min (3 × 5 min) with PBS, mounted on gelatin-subbed slides (Fisherbrand), allowed to dry overnight at 4°C, and coverslipped using Aquapolymount (Polysciences).
Electron microscopy
Four rats were anesthetized with Equithesin and perfused transcardially with a mixture of 4% PFA, 15% picric acid, and 0.1% glutaraldehyde in 0.1 m PB, pH 7.4, for 30 min, followed by the same mixture without glutaraldehyde for 30 min and then for 30 min with a solution of 10% sucrose in 0.1 m PB, pH 7.4. Spinal cord segments L4-L5 were collected and placed in 30% sucrose in 0.1 m PB overnight at 4°C. Subsequently, spinal cord segments were snap-frozen by immersion in liquid nitrogen, thawed in 0.1 m PB at room temperature, and cut into 50-μm-thick transverse sections with a Vibratome 1000 Plus (TPI). Sections were then incubated for 30 min in 1% sodium borohydride. After extensive washing (5 × 12 min) in PBS, sections were incubated in 0.5% BSA in PBS for 30 min and then in 5% normal goat serum (Invitrogen) for 30 min. Sections were then incubated at 4°C for 48 h in the mouse anti-GAD65 monoclonal antibody (1:1000, catalog #MAB351; Millipore) and the same polyclonal rabbit anti-β3 GABAAR antibody (1:100) from Dr. Werner Sieghart (Medical University of Vienna, Vienna, Austria) used for confocal microscopy diluted in PBS with 0.1% BSA. Then, sections were washed in PBS (2 × 15 min) and incubated for 2 h in goat anti-mouse IgG (1:50; Table 2). Sections were then washed again in PBS (2 × 15 min) and incubated for 12 h at 4°C in a mouse anti-horseradish peroxidase (HRP) monoclonal antibody (1:30; Medimabs; Semenenko et al., 1985). After 2 × 15 min washes, sections were incubated in HRP (5 μg ml−1, type VI, catalog #P8375; Sigma) for 2 h. Sections were washed in PBS (3 × 10 min) and the GAD65 antigenic sites were revealed by reacting the sections for 10 min at room temperature in 0.05% 3–3′diaminobenzidine tetrahydrochloride (DAB) with cobalt chloride and nickel ammonium sulfate, and then in the presence of 0.01% H2O2 (for details, see Ribeiro-da-Silva et al., 1993). The reaction was stopped by washing in PBS (3 × 10 min). Th sections were washed in 0.1% fish skin gelatin and 0.8% BSA in PBS (2 × 5 min) and then incubated in goat anti-rabbit IgG conjugated to 1 nm gold particles (1:200; Biocell) for 12 h at 4°C to label the GABAA receptor β3 subunit. Sections were washed and incubated in 2% glutaraldehyde in PBS for 10 min, washed in PBS (3 × 5 min), rinsed in distilled water (2 min), and washed in citrate buffer (3 × 5 min). Silver intensification of the gold particles was performed for 17 min using a silver enhancement kit (GE Healthcare). Sections were rinsed twice in deionized water, rinsed for 5 min in PB, and incubated in 1% osmium tetroxide (OsO4) in PB. Finally, the sections were dehydrated through ascending ethanol concentrations and propylene oxide. Sections were then flat embedded in Epon (for details, see Ribeiro-da-Silva et al., 1993). The regions of interest (ROIs) were selected using light microscopy and reembedded in Epon blocks. Ultrathin sections were cut with a Reichert ultramicrotome and collected on Formvar-coated one-slot copper grids. The sections were counterstained with uranyl acetate and lead citrate before observation on a Philips 410 LS electron microscope equipped with a Megaview II digital camera.
Confocal image segmentation and colocalization measurements
All confocal images were acquired using an Olympus Fluoview FV1000 confocal laser scanning microscope (CLSM). Confocal acquisitions were 12 bit images with a 2048 × 2048 pixel resolution and a 12.5 μs laser time of scanning per pixel. Laser power was chosen to avoid saturation. All confocal observations were performed with the same laser settings (laser power, PMT settings, image, and pixel sizes). To study the distribution of receptors in primary afferent terminals in the spinal cord (with Matlab 2010a), the first step of the quantification was to define specific regions in an image acquired with the CLSM. The fluorescent stainings were studied in specific regions by image binarization for CGRP+ and IB4+ sensory fiber terminals, inhibitory postsynaptic sites (gephyrin), and for receptor clusters (of GlyR and GABAAR subunits). The primary afferent component was defined using an object-base method (Otsu, 1979). The diameter of fine dendrites and axonic profiles in CLSM images are of the order of the PSF. For this reason, the algorithm was made to recognize structures of a disc shape with dimensions similar to that of the PSF. The disc shape filter was applied to the images to amplify structures with similar shapes and, because of this, the resulting mask was independent of low-frequency variations of diffuse signal in different spatial regions and the analysis was not biased by the choice of an arbitrary intensity threshold. Binary masks were obtained for each acquired image. Images with labeling for CGRP, IB4, gephyrin, GlyR (α1 subunit), GABAARs (α1, α2, α3, α5, and β3 subunits), α-DG, NL2, and CB2 were used for quantitative analysis.
For each pair of masks, the overlap pixel percentage was calculated as an index of structure colocalization. For each pair of masks, two overlap percentages were defined as the ratio of the number of pixels included in both masks to the area of each mask in the ROI as follows:
 |
This was computed for all subunits stated above with Matlab 2010a. Results for all immunostained sections from the same rat were averaged. This technique was applied to the lamina I (LI) and LII regions in control rats. Because CGRP+ axonal boutons are particularly abundant in LI and IB4+ boutons in LII, colocalization of each receptor subunit with CGRP was studied in LI and with IB4 in LII.
We used signal-to-noise ratio (SN) calculations to quantitatively describe the specificity of the immunostainings with the two types of fixation used here (“strong” vs “mild”). The SN was defined as the difference between the mean intensity in the mask region (signal) and outside of the mask (background noise) divided by the SD of the background region as follows:
 |
In parallel, we also quantified the number of clusters in the ROIs. The number of distinct PSF-scale structures per unit area of mask was quantified to give an index of the immunodetection sensitivity between the two types of fixation.
To test the statistical significance of staining overlap (using GraphPad Prism 6), we compared the overlap of two masks with the same area as M1 and M2, but with pixels randomly distributed in the ROI. In an ROI with N pixels, containing a subset nG of green pixels and from which a random sample of nR (red) pixels is drawn, the probability of obtaining nGR yellow pixels is given by the hypergeometric distribution (Costes et al., 2004; Béïque et al., 2011; Mesnage et al., 2011). In our case, N = Area(ROI), nG = Area(M1), and nR = Area(M2). The expected number of randomly overlapping pixels is the mean of the hypergeometric distribution, nG•nR/N. To test for a significant overlap, we calculated the probability of obtaining Area(M1∩M2) ≥ nG•nR/N. The expected percentage area of (1) containing (2) according to this distribution therefore corresponds to:
 |
For each marker, we obtained “observed (y-axis)” and “expected overlaps (x-axis)” from five to 14 animals (using, on average, five histological sections in each animal). Data were plotted in graphics using the OriginPro 8 software. For statistics comparing “Observed Area (Area M2)” versus “Expected Area (Area ROI),” matched-pair statistical tests were used. To compare composition in GABAA or GlyR subunits between CGRP and IB4, t tests were used (subtractions of observed values and expected values in CGRP were statistically compared with subtractions of observed values and expected values in IB4).
qRT-PCR
mRNA extraction and cDNA preparation.
TRIzol reagent (Invitrogen) was used to isolate total RNA from tissues. Briefly, 1 ml of TRIzol reagent was added per 50–100 mg of tissue sample. Then tissue was homogenized with a power homogenizer. The homogenized samples were incubated for 5 min at room temperature and then 0.2 ml of chloroform per 1 ml of TRIzol reagent was added. Tubes were shaken vigorously by hand for 15 s and incubated for 2–3 min at room temperature. Samples were centrifuged at 12,000 × g for 15 min at 4°C. The aqueous phase (upper layer) of the sample was transferred to a new tube and 0.5 ml of 100% isopropanol was added per 1 ml of TRIzol reagent used for homogenization. Samples were incubated at room temperature for 10 min and then centrifuged at 12,000 × g for 10 min at 4°C. Supernatants were removed from the tubes and pellets were washed with 1 ml of 75% ethanol per 1 ml of TRIzol reagent. Samples were centrifuged at 7500 × g for 5 min at 4°C. Ethanol was discarded and the RNA pellet was air dried. To measure the concentration of RNA, the RNA pellet was dissolved with DEPC H2O. Then, 1 μg of total RNA was reverse transcribed into cDNA by SuperScript III Reverse Transcriptase (Invitrogen). Oligo (dT)18 was used as a primer.
cDNA quantification.
We quantified the relative expression of the following genes: Gabra1, Gabra2, Gabra3, GPHN (gephyrin), DAG1 (α-DG), NLGN2 (NL2), and ARHGEF9 (CB2) as a function of the expression of the reference housekeeping gene TFRC (Rat Transferrin Receptor). qRT-PCRs were run in various tissues: DRG, spinal dorsal horn and brain, liver, or spleen tissue was chosen as negative control. Liver tissue was used as a control for the study of Gabra1, Gabra2, and Gabra3 mRNAs. The spleen was preferred to the liver as a negative control for GPHN because gephyrin is highly expressed in the liver compared with the spleen (Ramming et al., 2000). Gephyrin enzymatic activity is required in the liver, explaining the high level of expression in this tissue. For this reason, the spleen was chosen as a tissue control for the other GABAAR-associated proteins, DAG1, NLGN2, and ARHGEF9. Real-time quantitative PCRs were performed with an equal amount of cDNA in the LightCycler 480 system (Roche) using LightCycler 480 SYBR Green I Master (Roche). Reactions (total 20 μl) were incubated at 95°C for 5 min, followed by 45 cycles of 30 s at 95°C and 30 s at 58°C, followed by 1 min at 72°C. Water controls and a negative control containing no reverse transcriptase were included to ensure specificity. Primer efficiencies in each tissue and each experiment were integrated into the calculation of the final target/reference gene mRNA ratio using the LC480 converter and LinRegPCR software. All PCR primers are listed in Table 3 Multiple t test comparisons using the Holm-Sidak post hoc method (GraphPad Prism 6) were used for the statistical data analysis of the qRT-PCR results.
Table 3.
Real-time PCR primer sequences
| Gene | Primer name | Primer sequence | Primer range | Amplimer size (bp) |
|---|---|---|---|---|
| Gabra1 | Gabra1-F | GTCCTCTGCACTGAGAATCGC | 1620–1700 | 81 |
| Gabra1-R | CGAATTCTTTTAAGACAGAGGCAGTA | |||
| Gabra2 | Gabra2-F | TCATTTTTGCTTTGTACAGTCTGACT | 1475–1588 | 114 |
| Gabra2-R | GCAAGTGCAGGTCTCCTTTAGAG | |||
| Gabra3 | Gabra3-F | ATTTCCCGCATCATCTTCCC | 1612–1696 | 85 |
| Gabra3-R | TGATAGCGGATTCCCTGTTCAC | |||
| GPHN | GPHN-F | ACCTCTGGGCATGCTCTCTA | 512–610 | 99 |
| GPHN-R | TGAAAGCATTCCTGAGATCC | |||
| DAG1 | DAG1-F | GAATCCGCACTACCACCAGT | 1549–1640 | 92 |
| DAG1-R | CCAGGCATCAACCCTGTCGA | |||
| NLGN2 | NLGN2-F | CAGAAGGGCTGTTCCAGAAG | 1389–1490 | 102 |
| NLGN2-R | TGGCTGCCAGCAGCCGCGTG | |||
| ARHGEF9 | ARHGEF9-F | CCACCTCAGCGAGATAGGAC | 366–465 | 100 |
| ARHGEF9-R | GAGCTCCATGCAGGCATCCA | |||
| TFRC | TFRC-F | CGGCTACCTGGGCTATTGTA | 246–330 | 85 |
| TFRC-R | TTCTGACTTGTCCGCCTCTT |
Primer range numbering is based on the CDS sequence.
Results
Comparison of fixation protocols
To study the subcellular distribution of GABAARs and its relationship to the anchoring protein gephyrin, we needed an immunostaining approach that would optimally reflect the natural synaptic distribution of the receptors. This is complicated by the fact that immunodetection of GABAAR receptors can be strongly affected by fixation (Schneider Gasser et al., 2006; Fritschy, 2008). We thus first conducted a comparison of staining obtained with mild and regular fixation protocols (Fig. 1). Standard fixation was obtained using a perfusion protocol and mild fixation was achieved with on-slide postfixation for controlled short periods of time (see Materials and Methods). The two types of fixation provided comparable results for CGRP and IB4 labeling. In contrast, GABAAR, GlyR, and gephyrin immunodetection appeared sensitive to fixation, not only in signal strength (SN; Fig. 1), but also in the number of synaptic clusters detected per 100 μm2. In addition, with the perfusion fixation, random artifacts (unspecific labeling of glial cells) appeared for GlyR α1 and GABAAR α2 and α3 subunit immunolabeling (Fig. 1) as described previously (Schneider Gasser et al., 2006; Fritschy, 2008). The global intensity of gephyrin staining, as well as the number of clusters, strongly decreased in all samples with perfusion fixation, but no apparent ectopic labeling was detected (Fig. 1). For the GABAAR β3 subunit, the staining with perfusion fixation yielded comparable detection of clusters (15.3 ± 0.9/100 μm2 vs 17.6 ± 0.5/100 μm2). Consistent with this observation, it appeared insensitive to fixation conditions (comparable SNs: 2.27 ± 01.8 vs 2.24 ± 0.13; Fig. 1) in contrast to the α-subunit immunostaining. Mildly fixed spinal cord sections were also devoid of artifacts and yielded convincing clustered labeling for all of the α subunits, characteristic of the GABAAR distribution reported in the literature (Bohlhalter et al., 1994; Bohlhalter et al., 1996; Schneider Gasser et al., 2006; Fig. 1). For gephyrin, the GlyR α1 subunit, and the GABAAR α2/α3 subunits, the immunofluorescence signal was less diffuse and more intense with the mild fixation (Fig. 1). Therefore, the number of clusters detectable by this method of fixation was higher. For further quantification and to identify labeling in primary sensory terminals, we used the mild fixation protocol.
Figure 1.

Comparison of labeling obtained with two fixation protocols. Top, Micrographs of the GABAAR α2 and α3 subunits, gephyrin, of the GlyR α1 subunit and of the GABAAR β3 subunit using a mild fixation protocol with immersion of frozen sections of fresh tissue in 4% PFA for 10 min. Bottom, Same labeling with a standard 4% PFA perfusion followed by 2 h postfixation. Identical antibody concentrations and confocal laser settings were used for images obtained with both fixation protocols. For SN, the number of clusters per 100 μm2 gives an index of the cluster detection for each marker in both fixation protocols. Values are expressed as mean ± SD. Scale bar, 40 μm.
Laminar distribution of immunostaining
To establish a reference baseline for analysis of the distribution of GABAARs and GlyRs, as well as of their main anchoring protein gephyrin in small diameter primary afferent terminals, we first assessed their relative expression in LI and LII of the dorsal horn, which represent the main layers where these primary afferents terminate (Fig. 2). Concerning GABAARs, we focused on the benzodiazepine-sensitive α subunits (α1, 2, 3 and 5) and the most ubiquitous β3 subunit because these are the ones that have been shown to be present in the spinal dorsal horn (Bohlhalter et al., 1994; Alvarez et al., 1996; Bohlhalter et al., 1996; McKernan and Whiting, 1996). We also focused on the α1 subunit of the GlyR because it is the ubiquitous subunit in adult tissue (Zeilhofer, 2008). Figure 2, A–D, shows representative distribution patterns for selected subunits across the superficial laminae. Laminar limits were assessed on the basis of previously established criteria: distance from the white matter and distribution of IB4 staining in LII (Lorenzo et al., 2008).
Figure 2.
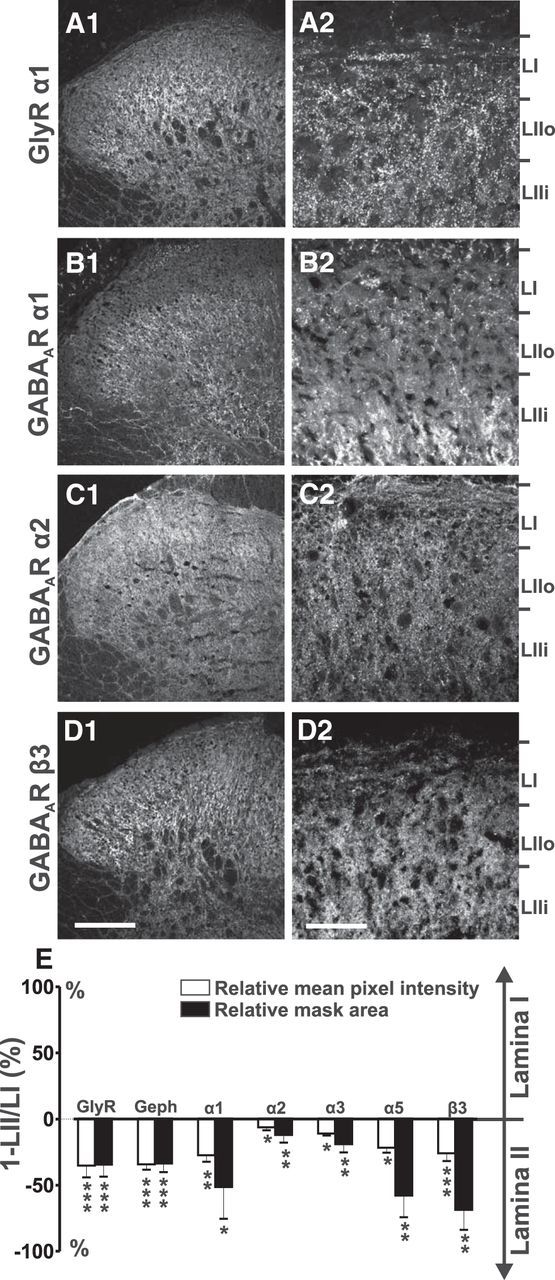
Laminar distribution of glycine and GABAA receptors in the rat superficial dorsal horn. Shown are images of spinal dorsal horn with immunostainings for the GlyR α1 subunit (A1, A2), the GABAA receptor α1 (B1, B2), α2 (C1, C2), and β3 (D1, D2) subunits. Limits of the superficial laminae were obtained based on their distance from the white matter and by comparison with the localization of the band of IB4 staining in the same optical section (data not shown), as described previously (Lorenzo et al., 2008). E, Quantification of the stainings in LI and LII. LIIi, Inner LII. Results are expressed in percentage difference (1-LII/LI) between LI and LII in the intensity and mask area for each staining. Positive values correspond to higher intensities or higher mask areas in LI, and negative values to higher intensities or higher mask areas in LII. *p < 0.05; **p < 0.01; ***p < 0.001. Data are expressed as mean ± SEM (as in all figures). For each subunit, the number of rats varied from n = 5 to n = 14. Scale bars, 175 μm (low magnification) and 40 μm (high magnification).
To perform a quantitative analysis of the relative receptor and anchoring protein expression between the two superficial laminae, LI and LII, we used two parameters: mean intensity and area occupied by the staining. Area was defined using a binary mask as described in the Materials and Methods. Data were reported as the LI/LII ratio for each of these two parameters (Fig. 2E). We found that both mean intensity and area of the staining were significantly higher in LII for all markers studied (Fig. 2E). However, this asymmetry was significantly smaller for the GABAAR α2 and α3 subunits (0.05 < p < 0.001; Fig. 2E). These findings raise the question of whether these inhibitory markers are preferentially distributed on nonpeptidergic (IB4+) afferent terminals, which predominate in LII, and not on the peptidergic (CGRP+) terminals, which predominate in LI and the outer LII (LIIo).
Quantitative analysis protocol to test for localization of inhibitory synaptic markers in primary afferent terminals
We then performed multiple labelings to measure the level of expression of inhibitory synaptic markers in defined cellular compartments. Cellular compartments studied included peptidergic (CGRP+) and nonpeptidergic (IB4+) small afferent terminals, as well as inhibitory postsynaptic sites (gephyrin+; Figs. 3, 4).
Figure 3.

Examples of the multiple labelings used in the study. Stainings for CGRP or IB4 (afferent terminals) combined with the GlyR α1 subunit (A1, A2), gephyrin (B1, B2), KCC2 (C1, C2), GABAAR α1 (D1, D2), or GABAAR α2 (E1, E2) subunits. Scale bar, 40 μm.
Figure 4.

Illustration of the method of colocalization analysis used in this study. A1, A2, Confocal images of stainings for GAD65 and IB4, known not to be colocalized. A3, Two binary masks derived from the two stainings. On the graph in A4, each point indicates the ratio value of observed versus expected overlap between the two masks for each rat (n = 8 rats). The dotted line represents the relationship for a purely random distribution of the two staining. The values obtained were not significantly higher than that expected from random distributions. B1, B4, Same type of analysis for CGRP and IB4 labelings, which are known to be colocalize in a small number of primary afferents. Both labels showed observed respective overlaps that were significantly higher than expected from random distributions (n = 12 rats). ***p < 0.001. Scale bars: A1, B1, 175 μm; A2–B3, 5 μm.
Determining whether a signal of interest is located within subcellular compartments that have dimensions on the order or smaller than that of the PSF is a challenge because the incidence of false-positives (apparent colocalization) can be high. This is especially important considering that the confocal PSF in the axial direction is significantly (typically >3-fold) larger than in the transverse axis (Cole et al., 2011). The probability of detecting false-positives is proportional to the relative area of an image occupied by each maker. We thus used a quantification approach that takes this into consideration (see Materials and Methods). Briefly, after binarization of the image to define the areas occupied by each of the markers studied, we computed an overlap pixel percentage as an index of structure colocalization (ratio of the number of pixels included in both masks to the area of each mask in a ROI). Colocalization was considered as occurring if the observed degree of pixel overlap significantly exceeded that expected from a randomly overlapping pixels given a hypergeometric distribution (see Materials and Methods).
To test the validity of this approach, we applied it to known paradigms of signal colocalization and separation. First, we studied markers of two structures known to be completely separated, but frequently apposed onto one another (Barber et al., 1978; Ma and Ribeiro-da-Silva, 1995; Mackie et al., 2003). For that, we used anti-GAD65 immunostaining to label inhibitory boutons and IB4 binding to label nonpeptidergic small afferent terminals (Fig. 4A). Analysis of labeling for these two markers revealed that the percentage of observed overlap was not significantly higher than that expected from a random distribution between the two stainings, given the relative proportion of the image they occupy (11.9 ± 0.5% vs 12.3 ± 0.4%; p = 0.35; n = 8 rats; Fig. 4A4). The second approach we used was to study markers that occur mostly on separate populations of primary afferents (Murinson et al., 2005) but are known to colocalize in a small subpopulation of them. For that we used CGRP+ and IB4+ terminals (Fig. 4B; Wang et al., 1994; Price and Flores, 2007; Lorenzo et al., 2008). In the case of CGRP and IB4 colabeling, the observed pixel overlap (percentage of IB4 staining within the CGRP mask and percentage of CGRP labeling in IB4 mask in LII) was 23.8 ± 1.9% and 22.6 ± 1.4%, respectively, significantly higher than that expected from random apparent colocalizations (8.3 ± 0.4%, p < 0.0001, and 10.7 ± 0.6%, p < 0.001; n = 12 rats). The observed level of colocalization was comparable to that reported in the literature (Wang et al., 1994; Sakamoto et al., 1999; Price and Flores, 2007; Lorenzo et al., 2008).
A third test paradigm was the use of KCC2 labeling, which is known to be absent from DRGs and synaptic terminals (Coull et al., 2003). Colabeling for KCC2 and CGRP or IB4 revealed no significant colocalization (Fig. 5A). In fact, in contrast to GAD65 immunostaining, the observed percentage of pixel overlap for KCC2 staining appeared lower than expected for IB4 labeling (p < 0.001), suggesting that KCC2 is localized away from IB4 afferents. This is consistent with the studies showing that KCC2 is distributed evenly throughout the somatodentritic regions of neurons (Doyon et al., 2011) and absent from synaptic terminals (Coull et al., 2003), in contrast to GAD65, which occurs in terminals, a significant proportion of which is known to be apposed to primary afferents (Barber et al., 1978; Mackie et al., 2003).
Figure 5.

Confirmation of the reliability of the colocalization analysis. Colocalization analysis as in Figure 4 (see also Materials and Methods) applied to labeling for KCC2 (A), known not to be expressed in primary afferents (Coull et al., 2003) and to labeling for GlyR α1 (B), known to highly associate with gephyrin clusters. ****p < 0.0001. For each marker, the numbers of rats were as follows: n = 6 for KCC2/CGRP, n = 12 for KCC2/IB4, and n = 10 for GlyR α1/gephyrin in LI and LII. Scale bar, 5 μm.
The final test we conducted was for GlyR versus gephyrin staining, because GlyRs are known to be preferentially associated with gephyrin clusters. The analysis revealed that the observed pixel overlap between GlyR α1 subunit labeling and gephyrin labeling was significantly higher than that expected from a random distribution in both LI and LII, regardless of the fact that gephyrin labeling occupied a much lower proportion of LI than of LII (p < 0.0001; Fig. 5B), consistent with previous reports (Ehrensperger et al., 2007).
These test paradigms show conclusively that the approach was sufficiently discriminative to test robustly for the expression of different inhibitory synaptic markers in small afferent terminals using a conventional CLSM technique.
Lack of GlyR and gephyrin clusters in small diameter afferent terminals
Whereas the presence of GlyR and gephyrin is undeniable in the spinal dorsal horn, the question has long remained of whether they are significantly expressed on terminals of small diameter primary afferents. To address this, we performed double and triple labelings combining markers of primary afferents (CGRP or IB4), of GlyR α1 subunits, and of gephyrin. In contrast to findings of colocalization within gephyrin clusters (Fig. 5B), GlyR α1 subunits were not colocalized with the marker of peptidergic afferent terminals (CGRP) nor with the marker of nonpeptidergic terminals (IB4; Fig. 6A). Consistent with this finding, there was no evidence of any significant presence of gephyrin labeling within these primary afferent terminals (Fig. 6B). This indicates that glycine does not contribute to presynaptic inhibition of small diameter primary afferent input to the dorsal horn. This observation is consistent with the lack of effect of glycine receptors on primary afferent depolarization (Jiménez et al., 1987; Willis and Coggeshall, 1991; Engelman and MacDermott, 2004; Zeilhofer et al., 2012). Only expression of the β subunit of the GlyR has been reported in DRG neurons (Furuyama et al., 1992).
Figure 6.

The glycine receptor α1 subunit and gephyrin clusters were not found in nociceptive primary afferents terminals. A, B, Colocalization analysis for either the GlyR α1 subunit (A) or its anchoring protein gephyrin with either CGRP or IB4 labeling (B). For each marker, the numbers of rats were as follows: n = 5 for GlyR α1/CGRP, n = 7 rats for GlyR α1/IB4, n = 5 for gephyrin/CGRP, and n = 12 rats for gephyrin/IB4. Scale bar, 5 μm.
Relative expression of GABAAR subunits in small diameter primary afferent terminals versus superficial dorsal horn neurons
Because gephyrin was not found in primary afferents of LI and LII, we could use it as a tool to differentiate expression of GABAARs in terminals of nociceptive primary afferent terminals versus dorsal horn neurons in LI and LII. Previous studies have provided evidence of GABAAR mRNA in DRG neurons (Persohn et al., 1991; Furuyama et al., 1992; Ma et al., 1993; Maddox et al., 2004) in rats and humans and of the presence of certain GABAAR subunits in mouse small diameter primary afferent terminals (Witschi et al., 2011; Paul et al., 2012). However, a thorough quantitative assessment of relative distribution of each subunit in small diameter primary afferent terminals is lacking, especially in rats.
Similar analyses to those described in the previous section were performed for all GABAAR benzodiazepine-sensitive subunits (Figs. 7, 8, 9). In addition to colocalization with CGRP and IB4, their colocalization with gephyrin was also assessed using triple stainings as a confirmation of the reliability of this approach (Figs. 7, 8, 9). The GABAAR α1 subunit was not found significantly in peptidergic CGRP+ afferents nor on nonpeptidergic IB4+ terminals (Figs. 3D2, 7A). In contrast, this subunit was significantly located in association with gephyrin clusters (p < 0.001 in LI; p < 0.0001 in LII; Fig. 7B). In contrast, the GABAAR α2 subunit was found significantly in both CGRP+ and IB4+ terminals (p < 0.0001; Fig. 8A). Interestingly, the density of this subunit was significantly higher in the IB4+ terminals than in the CGRP+ terminals (p < 0.001; Fig. 8B). As for the α1 subunit, the GABAAR α2 subunit was also localized significantly in gephyrin clusters (p < 0.01 in LI; p < 0.0001 in LII), possibly because of a direct binding between these subunits and gephyrin (Tretter et al., 2008; Mukherjee et al., 2011). Finally, the remainder of the GABAAR subunits studied, α3, α5, and β3, were significantly expressed in small afferent terminals and in gephyrin clusters, with the exception that the α5 subunit was neither significantly expressed in CGRP+ terminals nor in gephyrin clusters within LII (Fig. 9A–F).
Figure 7.

The α1 subunit of the GABAA receptor is absent from small diameter nociceptive primary afferent terminals. A, B, Top, Sets of micrographs representing triple staining for CGRP/gephyrin/GABAAR α1 subunit. Bottom, Sets of micrographs representing examples of binarized masked extracted from the confocal images above. The bottom graphs represent the colocalization analysis of observed values versus those expected from random distributions of each label. The numbers of rats for each colocalization were as follows: n = 6 for GABAAR α1/CGRP, n = 6 for α1/IB4, and n = 12 for GABAAR α1/gephyrin in LI and LII. ****p < 0.0001. Scale bar, 5 μm.
Figure 8.

Expression of the GABAAR α2 subunit in small diameter nociceptive primary afferent terminals. A, B, Triple staining of IB4/gephyrin/GABAAR α2 subunit. The bottom panels of each set or micrographs represent examples of binarized masked extracted from the confocal images above. The bottom graphs represent the colocalization analysis of observed values versus those expected from random distributions of each label. The numbers of rats used for each colocalization were as follows: n = 11 for GABAAR α2/CGRP, n = 14 for α2/IB4, and n = 14 for GABAAR α2/gephyrin in LI and LII. *p < 0.05; ***p < 0.001; ****p < 0.0001. Scale bar, 5 μm.
Figure 9.
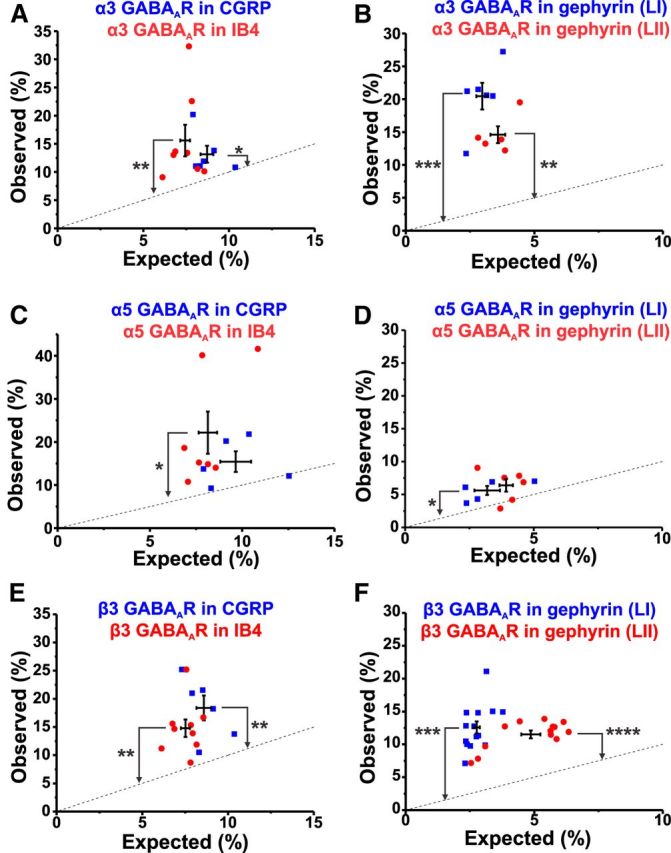
Expression of α3, α5, and β3 subunits of the GABAA receptor in nociceptive afferent terminals and inhibitory postsynaptic sites. Shown is the analysis of colocalization of the α3 subunit with CGRP/IB4 (respectively, n = 6 and 8 rats; A), or gephyrin (n = 6 in LI and 5 rats in LII; B), the α5 subunit with either CGRP/IB4 (n = 5 and 7 rats; C), or gephyrin (n = 5 in LI and 6 rats in LII; D), the β3 subunit with CGRP/IB4 (n = 6 and 9 rats; E), or gephyrin (n = 14 rats in LI and LII; F). *p < 0.05; **p < 0.01; ***p < 0.001; ****p < 0.0001.
Combining gephyrin staining as a marker of postsynaptic sites with CGRP or IB4 labeling for small diameter afferent terminals, we performed a quantitative assessment of the relative presynaptic versus postsynaptic distribution of the GABAAR subunits. We found that they were preferentially expressed postsynaptically in LI-LIIo, where CGRP+ terminals are particularly abundant (Fig. 10A). In contrast, in LII, where IB4+ terminals are more abundant, only the α1 GABAAR subunit was significantly more expressed postsynatically (Fig. 10B). In LII, the expression of the α2 and α5 GABAAR subunits was significantly more important on IB4+ primary afferents, whereas the presence of the α3 and β3 GABAAR subunits was more balanced between presynaptic and postsynaptic sites. Therefore, whereas in LI, GABAARs appear to be relatively more postsynaptically located, in LII, a more balanced presynaptic and postsynaptic distribution occurs.
Figure 10.

Relative expression of α subunits of the GABAA receptors at presynaptic versus postsynaptic sites. A, B, Mean (M) intensity of every GABAAR subunit labeling in gephyrin clusters was subtracted from that of the same subunit in CGRP in LI (A) and in IB4 in LII (B). Positive intensity unit (i.u.) values indicated preferential postsynaptic localization (gephyrin clusters), whereas negative values indicate preferential presynaptic location (CGRP+ or IB4+ afferents). *p < 0.05; **p < 0.01. Numbers of rats were that same as for Figures 7 and 8.
Electron microscopy revealed the presence of the GABAA receptor β3 subunit in the central boutons of type Ia and type IIa synaptic glomeruli
Finally, we wanted to confirm, at the ultrastructural level, the presence of GABAARs and their relationship to inhibitory synapses on small diameter primary afferent terminals. To achieve this, we used labeling for the β3 subunit because it is more ubiquitously expressed in GABAARs (Alvarez et al., 1996) and because staining for this subunit was more resistant to fixation (Fig. 1), allowing us to use a fixation protocol compatible with electron microscopy.
We used a combination of preembedding immunogold to detect the β3 subunit with DAB-based immunocytochemistry to detect GAD65+ inhibitory synaptic terminals. We found the β3 GABAARs in the central boutons of type Ia synaptic glomeruli (Fig. 11A–C), which are known to represent terminals of small diameter nonpeptidergic afferents (for description of synaptic glomeruli, see Ribeiro-da-Silva, 2004; Ribeiro-da-Silva and De Koninck, 2008). We also found the β3 subunit in the larger and lighter terminals of type II glomeruli (i.e., type IIa; Fig. 11D,E), which represent likely nonnociceptive myelinated afferents. The central boutons, which were positive for β3 GABAARs, were apposed by GAD65+ boutons (Fig. 11A–E). However, the labeling did not appear to be particularly clustered at the postsynaptic site opposite to GAD65+ boutons, in contrast to the obvious alignment of the silver-gold grains at the level of the postsynaptic thickening in axo-dendritic and axosomatic synapses (Fig. 11F–H).
Figure 11.

Ultrastructural detection of the β3 GABAAR subunit in central boutons of synaptic glomeruli and in dorsal horn neurons. A–C, β3 GABAAR subunit, detected by preembedding immunogold (arrows indicate silver-gold particles), was found in the central boutons of type Ia glomeruli (CIa), which represent the spinal terminations of nonpeptidergic nociceptive afferents (Ribeiro-da-Silva, 2004). D, E, The subunit was also found in the central boutons (CIIa) of type IIa glomeruli (thought to represent the termination of Aδ nonnociceptive afferents; Ribeiro-da-Silva, 2004). Note the presence of GAD+ boutons (labeled GAD+V2 or just V2), revealed using DAB-based immunocytochemistry, in direct apposition to the central element of synaptic glomeruli (based on their typical morphology properties; Ribeiro-da-Silva and De Koninck, 2008). E, Enlargement of the framed area in D. F–H, Representative labeling for the β3 subunit (black arrows) clustered at inhibitory synaptic sites onto dendrites and cell bodies of dorsal horn neurons. C, Cytoplasm; D, dendrite; N, nucleus; V, varicosity.
Other presynaptic GABAAR-associated proteins
Because gephyrin clusters were absent from small diameter afferent terminals, we decided to test for the presence of other GABAAR-associated proteins (Fritschy et al., 2012; Tretter et al., 2012; Tyagarajan and Fritschy, 2014). In the hippocampus and thalamus, postsynaptic NL2 appears to be associated with gephyrin via its intracellular domain and to presynaptic α/β-Neurexin via its extracellular domain (Fritschy et al., 2012; Tyagarajan and Fritschy, 2014). This complex may be associated with the α-DG/β-DG and sometimes with CB2 (Gee et al., 1994; Montanaro and Carbonetto, 2003; Renner et al., 2008; Fritschy et al., 2012).
The stainings obtained for DG, NL2, and CB2 in the rat spinal dorsal horn are illustrated in Figure 12, A–C. We found that DG and NL2 were expressed in both CGRP+ and IB4+ terminals (0.0001 < p < 0.01; Fig. 12D,E), whereas CB2 was exclusively found in CGRP+ terminals (p < 0.01; Fig. 12F). On the postsynaptic side, in the dorsal horn, only NL2 was found within gephyrin clusters (11 ± 0.7% in LI; 14.8 ± 1.8% in LII, p < 0.0001; Fig. 12H). In contrast, gephyrin+ synapses in the dorsal horn were devoid of DG (Fig. 12G) and CB2 (Fig. 12I). On the presynaptic side, GABAAR β3 subunits were associated with DG within the CGRP+ and the IB4+ terminals (5.4 ± 0.8% in CGRP and 6.8 ± 0.8% in IB4, p < 0.01; Fig. 12J). GABAA R α2 subunits were also associated with presynaptic afferent terminals positive for DG (5.3 ± 0.2%, p < 0.01; Fig. 12K).
Figure 12.
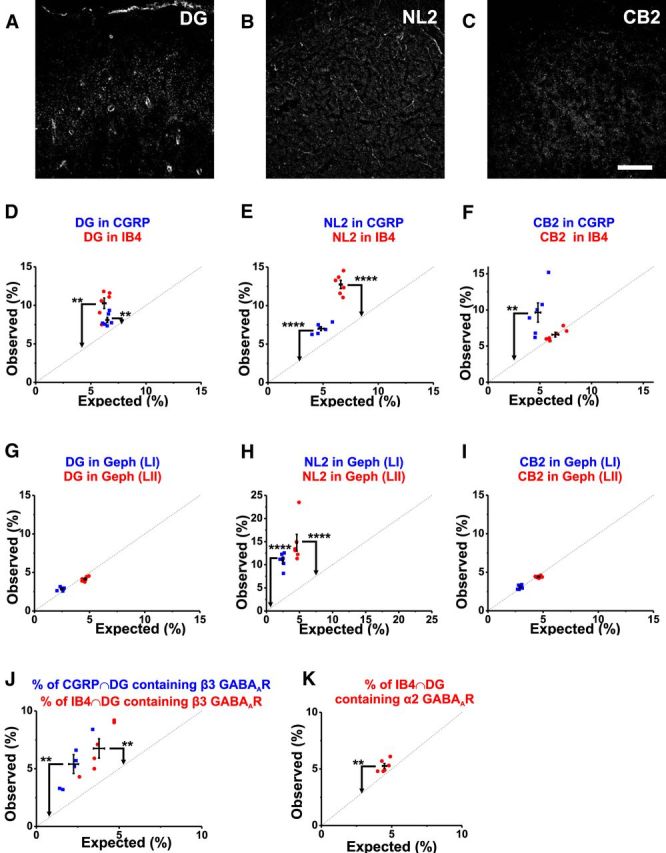
Expression of GABAAR-associated proteins in nociceptive primary afferent terminals and at inhibitory postsynaptic sites. A, Typical staining in the dorsal horn for α-DG with a minor staining of blood vessels, for NL2 (B), and for CB2 (C). D, Analysis of colocalization of α-DG with either CGRP/IB4. E, NL2 in CGRP/IB4. F, CB2 in CGRP/IB4. G, Analysis of colocalization of DG with gephyrin in LI and LII. H, Analysis of colocalization of NL2 with gephyrin. I, Analysis of colocalization of CB2 with gephyrin. J, Percentage of CGRP and DG mask intersection containing the β3 GABAAR subunit (in blue); percentage of IB4 and DG mask intersection containing the β3 GABAAR subunit (in red). K, percentage of IB4 and DG mask intersection containing the α2 GABAAR subunit. Number of rats: n = 6. **p < 0.01; ****p < 0.0001. Scale bar, 40 μm.
Quantification of mRNA encoding GABAAR subunits and associated proteins
To compare protein expression detected by immunocytochemistry with their corresponding mRNA expression, we used qRT-PCR to measure the relative expression of Gabra1, Gabra2, Gabra3, GPHN, DAG1 (DG), NLGN2, and ARHGEF9 (CB2) mRNAs as a function of the expression of the housekeeping gene TFRC. qRT-PCRs were run in various tissues, including the DRG, spinal dorsal horn, brain, liver, and spleen. Liver and spleen were chosen as negative controls (see Materials and Methods). Consistent with previous reports (Whiting et al., 1999), we found that the brain was the tissue expressing the maximal level of Gabra1 (Fig. 13A). In contrast, we found no significant Gabra1 expression in the DRG (Fig. 13A). Contrary to Gabra1, Gabra2 was the most expressed Gabra subunit in DRG (Fig. 13A) and was also well expressed in the spinal dorsal horn and brain (Fig. 13A). Gabra3 was also significantly expressed in the DRG (Fig. 13A), even though the gene was more expressed in the spinal dorsal horn (Fig. 13A). Our qRT-PCR results confirmed our immunocytochemical analysis revealing no GPHN expressed in DRGs. In contrast, GPHN was significantly expressed in the spinal dorsal horn and the brain (Fig. 13B). Contrary to GPHN, DAG1 was significantly expressed in DRGs, where we found its highest expression level (Fig. 13C). Finally, NLGN2 and ARHGEF9 were also significantly expressed in DRGs, the spinal dorsal horn, and the brain (Fig. 13D,E).
Figure 13.

qRT-PCR of mRNAs encoding α1, α2, and α3 GABAAR subunits and associated proteins. qRT-PCR of Gabra1 (A1), Gabra2 (A2), and Gabra3 (A3) in the liver (control), the DRG, the spinal dorsal horn (DH), and the brain. B, qRT-PCR of GPHN. C–E, qRT-PCR of mRNA encoding for other GABAAR-associated proteins, C, DAG1 (α-DG), D, NLGN2 (NL2), and E, ARHGEF9 (CB2), in the spleen (control), the DRG, the spinal dorsal horn and the brain. Numbers of rats were as follows: for liver, n = 3; for spleen, n = 4; for DRG, n = 4; for spinal DH, n = 4; and for brain, n = 7. For every tissue, we used the same number of animals in all experiments. Øp > 0.05; *p < 0.05; **p < 0.01; ***p < 0.001.
Discussion
The main findings of this study were as follows: (1) both CGRP+ (peptidergic) and IB4+ (nonpeptidergic) small afferent terminals were devoid of GlyR α1 subunit and of the anchoring protein gephyrin; (2) other GABAAR-associated proteins—α-DG, NL2, and CB2—were expressed in small afferent terminals; (3) the α2, α3, α5, and β3 subunits, but not the α1 subunit, of GABAARs were expressed on small diameter afferent terminals, with preferential distribution on nonpertidergic terminals; and (4) all GABAARs tested were preferentially postsynaptic in spinal LI, whereas the α2 and α5 subunits were preferentially presynaptic in LII.
Conclusive demonstration of the lack of GlyR α1 subunit and gephyrin on terminals of small diameter afferents and the presence of GABAARs and other GABAAR-associated proteins on these terminals was made possible thanks to the combination of two strategies. The first one was the use of a mild fixation protocol that was optimized to reveal GABAARs, GlyRs, and other GABAAR-associated proteins (Schneider Gasser et al., 2006; Fritschy, 2008). The second was the use of a quantitative analysis strategy of confocal images that allowed us to rule out false-positive detection of colocalization. Indeed, we considered that two proteins were significantly colocalized only when the amount of overlapping pixel was exceeding what can be expected from randomly overlapping pixels based on the relative proportion of the pictures occupied by each of the signals detected.
Mild fixation protocol is crucial for immunodetection of some antigens
It is important to emphasize the importance of the fixation protocols on the specificity of the immunostainings of gephyrin, the GlyR and GABAAR subunits, and their associated proteins. Indeed, tissue fixation and processing can have a strong impact on antigenicity by producing conformational changes of the epitopes, limiting their accessibility (epitope masking) and decreasing immunodetection (Bohlhalter et al., 1994; Bohlhalter et al., 1996; Schneider Gasser et al., 2006). Some fixation approaches translate into lower SNs and less antigenic site detection. Inappropriate fixation protocols can even generate high, nonspecific background (Schneider Gasser et al., 2006; Fritschy, 2008). Many of these differences have been studied and compared using wild-type and KO mice. For example, in a previous report, such data and their pitfalls were illustrated for the GABAAR α3 subunit (Fritschy, 2008). Therefore, we deemed it important to compare fixation protocols in the present study. In particular, we found that the SN of our immunostaining and the cluster detection provided an objective, quantitative assessment of the quality of the immunolabeling. It nevertheless remains that one cannot definitely rule out the presence of a protein from the absence of an antibody labeling due to inherent detection limits. This is why we sought to confirm our immunolabelings in sensory terminals with complementary qRT-PCR analysis from the DRG.
Absence of gephyrin and GlyR clusters in small diameter afferent terminals
We did not find any evidence of the occurrence of gephyrin clusters in small diameter primary afferent terminals in the dorsal horn. However, low levels of gephyrin mRNA and protein have been reported in DRG lysates (Paul et al., 2012). However, in our study, we referenced our measurement to that made in tissues previously shown to lack GPHN (Ramming et al., 2000). Under those conditions, our results show that GPHN detection was not significantly different from that in negative reference tissue. It is therefore possible that the levels of GPHN detection previously reported reflected background detection by the PCR primers. In any case, detection of mRNAs or proteins in DRGs is not absolute proof of the presence of the protein in terminals in the dorsal horn. Moreover, in addition to containing neurons, whole DRG lysates also contain glial cells that can be positive for markers of inhibitory neurotransmission (Müller et al., 1994; Bhat et al., 2010; Lee et al., 2011).
Our results are consistent with previous ultrastructural findings. Indeed, electron microscopic studies revealed the absence of gephyrin immunolabeling in central axonal boutons of type II glomeruli (Mitchell et al., 1993; Todd, 1996), whereas gephyrin immunogold particles were clearly visible postsynaptically in neighboring dendrites (Mitchell et al., 1993). Whereas failure to detect gephyrin in the previous study could have been ascribed to reduce gephyrin immunoreactivity from the strong fixation protocol used, our study using a mild fixation protocol confirmed the previous observations (Mitchell et al., 1993). Whereas our light microscopy approach had lower resolution than an EM analysis, our analytical algorithm prevented false-positive codetection when studying subdiffraction limited structures. It nevertheless remains possible that gephyrin is still present at very low levels in these afferents under nonclustered form. However, based on the above, we propose that, in the superficial dorsal horn, gephyrin clusters can be used as reliable markers of inhibitory postsynaptic sites.
Interestingly, in contrast to GPHN, we found significant levels of expression of three important GABAAR-associated proteins: DAG1, NLGN2, and ARHGEF9. Past data had shown that DG clustering can occur independently of gephyrin clustering in GPHN KO mice (Feng et al., 1998; Lévi et al., 2002). Our present results suggest a differential inhibitory synaptic arrangement between dorsal horn neurons and afferent terminals, suggesting an “atypical” inhibitory synaptic structure in sensory terminals compared with other central inhibitory synaptic organizations.
Consistent with the absence of gephyrin clusters, we did not find any evidence of the presence of GlyR α1 subunit in primary afferent terminals in the dorsal horn. Again, this was in contrast to previous reports of mRNA for the β subunit of GlyRs in DRG neurons (Furuyama et al., 1992). The lack of α1 subunit in the terminals argues against functional GlyR-mediated presynaptic inhibition of these afferents. The alternate α3 GlyR subunit was found to be 100% localized in gephyrin clusters in the superficial dorsal horn (Harvey et al., 2004; Zeilhofer, 2008), which, together with our finding that gephyrin clusters are exclusively postsynaptic, indicates that this subunit also does not occur in small diameter primary afferent terminals. It thus appears that glycine is not involved in presynaptic inhibition of these afferents in the spinal dorsal horn, consistent with previous physiological reports (Jiménez et al., 1987; Willis, 2006).
There appears to be an “anti-correlation” between the distribution of IB4 and KCC2 profiles, in contrast to CGRP versus KCC2 or IB4 versus GAD65. When profiles do not colocalize but are nevertheless in close apposition to one another (such as GAD65+ and IB4+ profiles), our colocalization analysis showed that the observed distribution was not different from that expected of a random overlap. However, our analysis revealed a systematic “less than expected” overlap between IB4 and KCC2 profiles. This may suggest that IB4 terminals specifically avoid KCC2-positive structures. Further experiments are required to confirm such inference.
Expression of GABAAR subunits in small diameter primary afferent terminals
Regarding the composition in GABAAR on the two populations of primary afferents we studied, we found that the GABAAR α1 subunit was absent from primary afferents, indicating that this subunit is not involved in presynaptic inhibition of these afferents. Consistent with our finding, the Gabra1 mRNA was selectively absent from rat and human DRGs (Persohn et al., 1991; Ma et al., 1993; Maddox et al., 2004) and there was a lack of staining for this subunit in mouse primary afferent terminals (Paul et al., 2012). In contrast, we found that the GABAAR α1 subunit was significantly expressed in gephyrin clusters, indicating a contribution of this subunit to postsynaptic inhibition in LI and LII. The finding of an absence of α1 GABAAR subunits in small diameter nociceptive afferent terminals is particularly important because GABAARs possessing this subunit are known to mediate sedation, at least in mice and humans (Rudolph et al., 1999; McKernan et al., 2000; Rudolph and Möhler, 2006). In contrast, we have found that the α2 GABAAR subunit was significantly expressed in small diameter primary afferent terminals, although substantially more on nonpeptidergic than on peptidergic terminals. Although nonpeptidergic C nociceptors are known to receive axoaxonic synapses from GABAergic neurons, these synapses are rarely seen on peptidergic afferents (Todd et al., 1995; Ribeiro-da-Silva and De Koninck, 2008). This would suggest that any activation of these receptors would be nonsynaptic. Furthermore, the α2 GABAAR and α5 GABAAR subunits were mainly located presynaptically in nonpeptidergic afferents of LII, consistent with its association with IB4+ terminals (Xiao et al., 2002) and in contrast to α3 subunits, which had a more balanced presynaptic and postsynaptic distribution. These findings are consistent with evidence of a major role of α2 subunits in presynaptic inhibition of nociceptive afferents in rats (Persohn et al., 1991) or mice (Witschi et al., 2011). A gephyrin-independent clustering of the α2 GABAAR had already been reported in hippocampal neurons lacking gephyrin from KO mice (Lévi et al., 2004). This finding is of particular interest in light of our observation of α2 GABAAR enrichment in afferent terminals in the absence of gephyrin. Sensory afferents may thus constitute a natural gephyrin-deficient system with which to study gephyrin-free GABAAR-mediated inhibition.
In contrast to other subunits, the α5 GABAAR subunit was present at low levels in gephyrin clusters. This is consistent with the general finding that this subunit is mainly expressed extrasynaptically, contributing to tonic inhibition (Takahashi et al., 2006).
Conclusion
Our results, together with previous findings, indicate that ionotropic presynaptic inhibition in small diameter afferents appear to be exclusively GABAAR mediated. However, the lack of gephyrin clusters in these nociceptive fiber terminals also indicates that the GABAARs localized in them are not anchored by gephyrin. Gephyrin-independent GABAAR clustering has been observed in different systems (Kneussel et al., 2001; Fritschy et al., 2012; Niwa et al., 2012; Tretter et al., 2012). However, our ultrastructural analysis suggests a lack of apparent GABAAR clustering at presynaptic sites (i.e., in afferent terminals), in contrast to postsynaptic sites (i.e., on dorsal horn neurons). The anchoring of GABAARs may thus follow different rules at presynaptic and postsynaptic levels in the dorsal horn. Nonclustered distribution of GABAARs on afferent terminals may suggest a more diffuse mode of inhibition at these inhibitory synapses, consistent with the characteristically much slower time course of GABAAR-mediated presynaptic inhibition (primary afferent depolarization) than its postsynaptic counterpart (De Koninck and Henry, 1994). In addition, our study may also open avenues to better distinguish presynaptic from postsynaptic actions of newly designed therapeutic agents, in particular, by providing clues to better differentiate the presynaptic from the postsynaptic effects of novel GABAA receptor subtype-specific benzodiazepines (Munro et al., 2013; McCarson and Enna, 2014).
Footnotes
This work was supported by Canadian Institutes of Health Research (CIHR; Grant MOP-79411 to A.R. and Grant MOP-12942 to Y.D.K.). L.E.L. is the recipient of a postdoctoral fellowship from CIHR. A.G.G. is supported by fellowships from the CIHR Neurophysics Strategic Training Program Grant. We thank Armen Saghatelyan for the use of his confocal microscope; Jean-Marc Fritschy for the generous gift of the anti-GABAA receptor α subunits antibodies; Werner Sieghart and Ryuichi Shigemoto for the gift of their anti-GABAA receptor β3 subunit antibodies; Johanne Ouellette for technical assistance with electron microscopy; and Cyril Bories, Julie Lamarche, and members of the Martin Levesque laboratory for helpful advice or comments on the manuscript.
The authors declare no competing financial interests.
References
- Alvarez FJ, Fyffe RE. Nociceptors for the 21st century. Curr Rev Pain. 2000;4:451–458. doi: 10.1007/s11916-000-0069-4. [DOI] [PubMed] [Google Scholar]
- Alvarez FJ, Taylor-Blake B, Fyffe RE, De Blas AL, Light AR. Distribution of immunoreactivity for the β2 and β3 subunits of the GABAA receptor the mammalian spinal cord. J Comp Neurol. 1996;365:392–412. doi: 10.1002/(SICI)1096-9861(19960212)365:3<392::AID-CNE5>3.0.CO;2-#. [DOI] [PubMed] [Google Scholar]
- Baer K, Waldvogel HJ, During MJ, Snell RG, Faull RL, Rees MI. Association of gephyrin and glycine receptors in the human brainstem and spinal cord: an immunohistochemical analysis. Neuroscience. 2003;122:773–784. doi: 10.1016/S0306-4522(03)00543-8. [DOI] [PubMed] [Google Scholar]
- Barber RP, Vaughn JE, Saito K, McLaughlin BJ, Roberts E. GABAergic terminals are presynaptic to primary afferent terminals in the substantia gelatinosa of the rat spinal cord. Brain Res. 1978;141:35–55. doi: 10.1016/0006-8993(78)90615-7. [DOI] [PubMed] [Google Scholar]
- Bardoni R, Takazawa T, Tong CK, Choudhury P, Scherrer G, Macdermott AB. Pre- and postsynaptic inhibitory control in the spinal cord dorsal horn. Ann N Y Acad Sci. 2013;1279:90–96. doi: 10.1111/nyas.12056. [DOI] [PMC free article] [PubMed] [Google Scholar]
- Béïque JC, Na Y, Kuhl D, Worley PF, Huganir RL. Arc-dependent synapse-specific homeostatic plasticity. Proc Natl Acad Sci U S A. 2011;108:816–821. doi: 10.1073/pnas.1017914108. [DOI] [PMC free article] [PubMed] [Google Scholar]
- Benke D, Cicin-Sain A, Mertens S, Möhler H. Immunochemical identification of the alpha 1- and alpha 3-subunits of the GABAA-receptor in rat brain. J Recept Res. 1991;11:407–424. doi: 10.3109/10799899109066418. [DOI] [PubMed] [Google Scholar]
- Benke D, Honer M, Michel C, Möhler H. GABAA receptor subtypes differentiated by their gamma-subunit variants: prevalence, pharmacology and subunit architecture. Neuropharmacology. 1996;35:1413–1423. doi: 10.1016/S0028-3908(96)00068-8. [DOI] [PubMed] [Google Scholar]
- Bhat R, Axtell R, Mitra A, Miranda M, Lock C, Tsien RW, Steinman L. Inhibitory role for GABA in autoimmune inflammation. Proc Natl Acad Sci U S A. 2010;107:2580–2585. doi: 10.1073/pnas.0915139107. [DOI] [PMC free article] [PubMed] [Google Scholar]
- Bohlhalter S, Möhler H, Fritschy JM. Inhibitory neurotransmission in rat spinal cord: co-localization of glycine- and GABAA receptors at GABAergic synaptic contacts demonstrated by triple immunofluorescence staining. Brain Res. 1994;642:59–69. doi: 10.1016/0006-8993(94)90905-9. [DOI] [PubMed] [Google Scholar]
- Bohlhalter S, Weinmann O, Möhler H, Fritschy JM. Laminar compartmentalization of GABAA-receptor subtypes in the spinal cord: an immunohistochemical study. J Neurosci. 1996;16:283–297. doi: 10.1523/JNEUROSCI.16-01-00283.1996. [DOI] [PMC free article] [PubMed] [Google Scholar]
- Cole RW, Jinadasa T, Brown CM. Measuring and interpreting point spread functions to determine confocal microscope resolution and ensure quality control. Nat Protoc. 2011;6:1929–1941. doi: 10.1038/nprot.2011.407. [DOI] [PubMed] [Google Scholar]
- Costes SV, Daelemans D, Cho EH, Dobbin Z, Pavlakis G, Lockett S. Automatic and quantitative measurement of protein-protein colocalization in live cells. Biophys J. 2004;86:3993–4003. doi: 10.1529/biophysj.103.038422. [DOI] [PMC free article] [PubMed] [Google Scholar]
- Coull JA, Boudreau D, Bachand K, Prescott SA, Nault F, Sík A, De Koninck P, De Koninck Y. Trans-synaptic shift in anion gradient in spinal lamina I neurons as a mechanism of neuropathic pain. Nature. 2003;424:938–942. doi: 10.1038/nature01868. [DOI] [PubMed] [Google Scholar]
- De Koninck Y, Henry JL. Prolonged GABAA-mediated inhibition following single hair afferent input to single spinal dorsal horn neurones in cats. J Physiol. 1994;476:89–100. [PMC free article] [PubMed] [Google Scholar]
- Doyon N, Prescott SA, Castonguay A, Godin AG, Kröger H, De Koninck Y. Efficacy of synaptic inhibition depends on multiple, dynamically interacting mechanisms implicated in chloride homeostasis. PLoS Comput Biol. 2011;7:e1002149. doi: 10.1371/journal.pcbi.1002149. [DOI] [PMC free article] [PubMed] [Google Scholar]
- Durisic N, Godin AG, Wever CM, Heyes CD, Lakadamyali M, Dent JA. Stoichiometry of the human glycine receptor revealed by direct subunit counting. J Neurosci. 2012;32:12915–12920. doi: 10.1523/JNEUROSCI.2050-12.2012. [DOI] [PMC free article] [PubMed] [Google Scholar]
- Dutertre S, Becker CM, Betz H. Inhibitory glycine receptors: an update. J Biol Chem. 2012;287:40216–40223. doi: 10.1074/jbc.R112.408229. [DOI] [PMC free article] [PubMed] [Google Scholar]
- Eccles JC, Schmidt R, Willis WD. Pharmacological studies on presynaptic inhibition. J Physiol. 1963;168:500–530. doi: 10.1113/jphysiol.1963.sp007205. [DOI] [PMC free article] [PubMed] [Google Scholar]
- Ehrensperger MV, Hanus C, Vannier C, Triller A, Dahan M. Multiple association states between glycine receptors and gephyrin identified by SPT analysis. Biophys J. 2007;92:3706–3718. doi: 10.1529/biophysj.106.095596. [DOI] [PMC free article] [PubMed] [Google Scholar]
- Engelman HS, MacDermott AB. Presynaptic ionotropic receptors and control of transmitter release. Nat Rev Neurosci. 2004;5:135–145. doi: 10.1038/nrn1297. [DOI] [PubMed] [Google Scholar]
- Ervasti JM, Campbell KP. A role for the dystrophin-glycoprotein complex as a transmembrane linker between laminin and actin. J Cell Biol. 1993;122:809–823. doi: 10.1083/jcb.122.4.809. [DOI] [PMC free article] [PubMed] [Google Scholar]
- Fang X, Djouhri L, McMullan S, Berry C, Waxman SG, Okuse K, Lawson SN. Intense isolectin-B4 binding in rat dorsal root ganglion neurons distinguishes C-fiber nociceptors with broad action potentials and high Nav1.9 expression. J Neurosci. 2006;26:7281–7292. doi: 10.1523/JNEUROSCI.1072-06.2006. [DOI] [PMC free article] [PubMed] [Google Scholar]
- Feng G, Tintrup H, Kirsch J, Nichol MC, Kuhse J, Betz H, Sanes JR. Dual requirement for gephyrin in glycine receptor clustering and molybdoenzyme activity. Science. 1998;282:1321–1324. doi: 10.1126/science.282.5392.1321. [DOI] [PubMed] [Google Scholar]
- Fischer F, Kneussel M, Tintrup H, Haverkamp S, Rauen T, Betz H, Wässle H. Reduced synaptic clustering of GABA and glycine receptors in the retina of the gephyrin null mutant mouse. J Comp Neurol. 2000;427:634–648. doi: 10.1002/1096-9861(20001127)427:4<634::AID-CNE10>3.0.CO;2-X. [DOI] [PubMed] [Google Scholar]
- Fritschy JM. Is my antibody-staining specific? How to deal with pitfalls of immunohistochemistry. Eur J Neurosci. 2008;28:2365–2370. doi: 10.1111/j.1460-9568.2008.06552.x. [DOI] [PubMed] [Google Scholar]
- Fritschy JM, Möhler H. GABAA-receptor heterogeneity in the adult rat brain: differential regional and cellular distribution of seven major subunits. J Comp Neurol. 1995;359:154–194. doi: 10.1002/cne.903590111. [DOI] [PubMed] [Google Scholar]
- Fritschy JM, Panzanelli P, Kralic JE, Vogt KE, Sassoè-Pognetto M. Differential dependence of axo-dendritic and axo-somatic GABAergic synapses on GABAA receptors containing the alpha1 subunit in Purkinje cells. J Neurosci. 2006;26:3245–3255. doi: 10.1523/JNEUROSCI.5118-05.2006. [DOI] [PMC free article] [PubMed] [Google Scholar]
- Fritschy JM, Harvey RJ, Schwarz G. Gephyrin: where do we stand, where do we go? Trends Neurosci. 2008;31:257–264. doi: 10.1016/j.tins.2008.02.006. [DOI] [PubMed] [Google Scholar]
- Fritschy JM, Panzanelli P, Tyagarajan SK. Molecular and functional heterogeneity of GABAergic synapses. Cell Mol Life Sci. 2012;69:2485–2499. doi: 10.1007/s00018-012-0926-4. [DOI] [PMC free article] [PubMed] [Google Scholar]
- Furuyama T, Sato M, Sato K, Araki T, Inagaki S, Takagi H, Tohyama M. Co-expression of glycine receptor β subunit and GABAA receptor gamma subunit mRNA in the rat dorsal root ganglion cells. Mol Brain Res. 1992;12:335–338. doi: 10.1016/0169-328X(92)90136-Y. [DOI] [PubMed] [Google Scholar]
- Gee SH, Montanaro F, Lindenbaum MH, Carbonetto S. Dystroglycan-alpha, a dystrophin-associated glycoprotein, is a functional agrin receptor. Cell. 1994;77:675–686. doi: 10.1016/0092-8674(94)90052-3. [DOI] [PubMed] [Google Scholar]
- Gibson SJ, Polak JM, Bloom SR, Sabate IM, Mulderry PM, Ghatei MA, McGregor GP, Morrison JF, Kelly JS, Evans RM. Calcitonin gene-related peptide immunoreactivity in the spinal cord of man and of eight other species. J Neurosci. 1984;4:3101–3111. doi: 10.1523/JNEUROSCI.04-12-03101.1984. [DOI] [PMC free article] [PubMed] [Google Scholar]
- Goddeeris MM, Wu B, Venzke D, Yoshida-Moriguchi T, Saito F, Matsumura K, Moore SA, Campbell KP. LARGE glycans on dystroglycan function as a tunable matrix scaffold to prevent dystrophy. Nature. 2013;503:136–140. doi: 10.1038/nature12605. [DOI] [PMC free article] [PubMed] [Google Scholar]
- Harvey RJ, Depner UB, Wässle H, Ahmadi S, Heindl C, Reinold H, Smart TG, Harvey K, Schütz B, Abo-Salem OM, Zimmer A, Poisbeau P, Welzl H, Wolfer DP, Betz H, Zeilhofer HU, Müller U. GlyR alpha3: an essential target for spinal PGE2-mediated inflammatory pain sensitization. Science. 2004;304:884–887. doi: 10.1126/science.1094925. [DOI] [PubMed] [Google Scholar]
- Hunt SP, Rossi J. Peptide- and non-peptide-containing unmyelinated primary sensory afferents: the parallel processing of nociceptive information. Philos Trans R Soc Lond Biol. 1985;308:283–289. doi: 10.1098/rstb.1985.0028. [DOI] [PubMed] [Google Scholar]
- Jacobson C, Montanaro F, Lindenbaum M, Carbonetto S, Ferns M. alpha-Dystroglycan functions in acetylcholine receptor aggregation but is not a coreceptor for agrin-MuSK signaling. J Neurosci. 1998;18:6340–6348. doi: 10.1523/JNEUROSCI.18-16-06340.1998. [DOI] [PMC free article] [PubMed] [Google Scholar]
- Jiménez I, Rudomin P, Solodkin M. Mechanisms involved in the depolarization of cutaneous afferents produced by segmental and descending inputs in the cat spinal cord. Exp Brain Res. 1987;69:195–207. doi: 10.1007/BF00247042. [DOI] [PubMed] [Google Scholar]
- Ju G, Hökfelt T, Brodin E, Fahrenkrug J, Fischer JA, Frey P, Elde RP, Brown JC. Primary sensory neurons of the rat showing calcitonin gene-related peptide immunoreactivity and their relation to substance P-, somatostatin-, galanin-, vasoactive intestinal polypeptide- and cholecystokinin-immunoreactive ganglion cells. Cell Tissue Res. 1987;247:417–431. doi: 10.1007/BF00218323. [DOI] [PubMed] [Google Scholar]
- Kasugai Y, Swinny JD, Roberts JD, Dalezios Y, Fukazawa Y, Sieghart W, Shigemoto R, Somogyi P. Quantitative localisation of synaptic and extrasynaptic GABAA receptor subunits on hippocampal pyramidal cells by freeze-fracture replica immunolabelling. Eur J Neurosci. 2010;32:1868–1888. doi: 10.1111/j.1460-9568.2010.07473.x. [DOI] [PMC free article] [PubMed] [Google Scholar]
- Kirsch J, Betz H. Glycine-receptor activation is required for receptor clustering in spinal neurons. Nature. 1998;392:717–720. doi: 10.1038/33694. [DOI] [PubMed] [Google Scholar]
- Knabl J, Witschi R, Hösl K, Reinold H, Zeilhofer UB, Ahmadi S, Brockhaus J, Sergejeva M, Hess A, Brune K, Fritschy JM, Rudolph U, Möhler H, Zeilhofer HU. Reversal of pathological pain through specific spinal GABAA receptor subtypes. Nature. 2008;451:330–334. doi: 10.1038/nature06493. [DOI] [PubMed] [Google Scholar]
- Kneussel M, Brandstätter JH, Laube B, Stahl S, Müller U, Betz H. Loss of postsynaptic GABA(A) receptor clustering in gephyrin-deficient mice. J Neurosci. 1999;19:9289–9297. doi: 10.1523/JNEUROSCI.19-21-09289.1999. [DOI] [PMC free article] [PubMed] [Google Scholar]
- Kneussel M, Brandstätter JH, Gasnier B, Feng G, Sanes JR, Betz H. Gephyrin-independent clustering of postsynaptic GABA(A) receptor subtypes. Mol Cell Neurosci. 2001;17:973–982. doi: 10.1006/mcne.2001.0983. [DOI] [PubMed] [Google Scholar]
- Kralic JE, Sidler C, Parpan F, Homanics GE, Morrow AL, Fritschy JM. Compensatory alteration of inhibitory synaptic circuits in cerebellum and thalamus of gamma-aminobutyric acid type A receptor alpha1 subunit knockout mice. J Comp Neurol. 2006;495:408–421. doi: 10.1002/cne.20866. [DOI] [PubMed] [Google Scholar]
- Lardi-Studler B, Smolinsky B, Petitjean CM, Koenig F, Sidler C, Meier JC, Fritschy JM, Schwarz G. Vertebrate-specific sequences in the gephyrin E-domain regulate cytosolic aggregation and postsynaptic clustering. J Cell Sci. 2007;120:1371–1382. doi: 10.1242/jcs.003905. [DOI] [PubMed] [Google Scholar]
- Lee M, Schwab C, McGeer PL. Astrocytes are GABAergic cells that modulate microglial activity. Glia. 2011;59:152–165. doi: 10.1002/glia.21087. [DOI] [PubMed] [Google Scholar]
- Leschziner A, Moukhles H, Lindenbaum M, Gee SH, Butterworth J, Campbell KP, Carbonetto S. Neural regulation of alpha-dystroglycan biosynthesis and glycosylation in skeletal muscle. J Neurochem. 2000;74:70–80. doi: 10.1046/j.1471-4159.2000.0740070.x. [DOI] [PubMed] [Google Scholar]
- Lévi S, Grady RM, Henry MD, Campbell KP, Sanes JR, Craig AM. Dystroglycan is selectively associated with inhibitory GABAergic synapses but is dispensable for their differentiation. J Neurosci. 2002;22:4274–4285. doi: 10.1523/JNEUROSCI.22-11-04274.2002. [DOI] [PMC free article] [PubMed] [Google Scholar]
- Lévi S, Logan SM, Tovar KR, Craig AM. Gephyrin is critical for glycine receptor clustering but not for the formation of functional GABAergic synapses in hippocampal neurons. J Neurosci. 2004;24:207–217. doi: 10.1523/JNEUROSCI.1661-03.2004. [DOI] [PMC free article] [PubMed] [Google Scholar]
- Lorenzo LE, Barbe A, Bras H. Mapping and quantitative analysis of gephyrin cytoplasmic trafficking pathways in motoneurons, using an optimized Transmission Electron Microscopy Color Imaging (TEMCI) procedure. J Neurocytol. 2004;33:241–249. doi: 10.1023/B:NEUR.0000030699.74642.7d. [DOI] [PubMed] [Google Scholar]
- Lorenzo LE, Barbe A, Portalier P, Fritschy JM, Bras H. Differential expression of GABAA and glycine receptors in ALS-resistant versus ALS-vulnerable motoneurons: possible implications for selective vulnerability of motoneurons. Eur J Neurosci. 2006;23:3161–3170. doi: 10.1111/j.1460-9568.2006.04863.x. [DOI] [PubMed] [Google Scholar]
- Lorenzo LE, Russier M, Barbe A, Fritschy JM, Bras H. Differential organization of gamma-aminobutyric acid type A and glycine receptors in the somatic and dendritic compartments of rat abducens motoneurons. J Comp Neurol. 2007;504:112–126. doi: 10.1002/cne.21442. [DOI] [PubMed] [Google Scholar]
- Lorenzo LE, Ramien M, St Louis M, De Koninck Y, Ribeiro-da-Silva A. Postnatal changes in the Rexed lamination and markers of nociceptive afferents in the superficial dorsal horn of the rat. J Comp Neurol. 2008;508:592–604. doi: 10.1002/cne.21691. [DOI] [PubMed] [Google Scholar]
- Ma W, Ribeiro-da-Silva A. Substance P- and GABA-like immunoreactivities are co-localized in axonal boutons in the superficial laminae of cat but not rat spinal cord. Brain Res. 1995;692:99–110. doi: 10.1016/0006-8993(95)00666-E. [DOI] [PubMed] [Google Scholar]
- Ma W, Saunders PA, Somogyi R, Poulter MO, Barker JL. Ontogeny of GABAA receptor subunit mRNAs in rat spinal cord and dorsal root ganglia. J Comp Neurol. 1993;338:337–359. doi: 10.1002/cne.903380303. [DOI] [PubMed] [Google Scholar]
- Mackie M, Hughes DI, Maxwell DJ, Tillakaratne NJ, Todd AJ. Distribution and colocalisation of glutamate decarboxylase isoforms in the rat spinal cord. Neuroscience. 2003;119:461–472. doi: 10.1016/S0306-4522(03)00174-X. [DOI] [PubMed] [Google Scholar]
- Maddox FN, Valeyev AY, Poth K, Holohean AM, Wood PM, Davidoff RA, Hackman JC, Luetje CW. GABAA receptor subunit mRNA expression in cultured embryonic and adult human dorsal root ganglion neurons. Brain Res Dev Brain Res. 2004;149:143–151. doi: 10.1016/j.devbrainres.2004.01.001. [DOI] [PubMed] [Google Scholar]
- Maxwell DJ, Riddell JS. Axoaxonic synapses on terminals of group II muscle spindle afferent axons in the spinal cord of the cat. Eur J Neurosci. 1999;11:2151–2159. doi: 10.1046/j.1460-9568.1999.00632.x. [DOI] [PubMed] [Google Scholar]
- McCarson KE, Enna SJ. GABA pharmacology: the search for analgesics. Neurochem Res. 2014 doi: 10.1007/s11064-014-1254-x. doi: 10.1007/s11064-014-1254-x. Advance online publication. Retrieved Feb. 15, 2014. [DOI] [PubMed] [Google Scholar]
- McKernan RM, Rosahl TW, Reynolds DS, Sur C, Wafford KA, Atack JR, Farrar S, Myers J, Cook G, Ferris P, Garrett L, Bristow L, Marshall G, Macaulay A, Brown N, Howell O, Moore KW, Carling RW, Street LJ, Castro JL, et al. Sedative but not anxiolytic properties of benzodiazepines are mediated by the GABA(A) receptor alpha1 subtype. Nat Neurosci. 2000;3:587–592. doi: 10.1038/75761. [DOI] [PubMed] [Google Scholar]
- McKernan RM, Whiting PJ. Which GABAA-receptor subtypes really occur in the brain? Trends Neurosci. 1996;19:139–143. doi: 10.1016/S0166-2236(96)80023-3. [DOI] [PubMed] [Google Scholar]
- Mercado A, Broumand V, Zandi-Nejad K, Enck AH, Mount DB. A C-terminal domain in KCC2 confers constitutive K+-Cl- cotransport. J Biol Chem. 2006;281:1016–1026. doi: 10.1074/jbc.M509972200. [DOI] [PubMed] [Google Scholar]
- Mesnage B, Gaillard S, Godin AG, Rodeau JL, Hammer M, Von Engelhardt J, Wiseman PW, De Koninck Y, Schlichter R, Cordero-Erausquin M. Morphological and functional characterization of cholinergic interneurons in the dorsal horn of the mouse spinal cord. J Comp Neurol. 2011;519:3139–3158. doi: 10.1002/cne.22668. [DOI] [PubMed] [Google Scholar]
- Mitchell K, Spike RC, Todd AJ. An immunocytochemical study of glycine receptor and GABA in laminae I-III of rat spinal dorsal horn. J Neurosci. 1993;13:2371–2381. doi: 10.1523/JNEUROSCI.13-06-02371.1993. [DOI] [PMC free article] [PubMed] [Google Scholar]
- Montanaro F, Carbonetto S. Targeting dystroglycan in the brain. Neuron. 2003;37:193–196. doi: 10.1016/S0896-6273(03)00032-1. [DOI] [PubMed] [Google Scholar]
- Moore SA, Saito F, Chen J, Michele DE, Henry MD, Messing A, Cohn RD, Ross-Barta SE, Westra S, Williamson RA, Hoshi T, Campbell KP. Deletion of brain dystroglycan recapitulates aspects of congenital muscular dystrophy. Nature. 2002;418:422–425. doi: 10.1038/nature00838. [DOI] [PubMed] [Google Scholar]
- Mukherjee J, Kretschmannova K, Gouzer G, Maric HM, Ramsden S, Tretter V, Harvey K, Davies PA, Triller A, Schindelin H, Moss SJ. The residence time of GABA(A)Rs at inhibitory synapses is determined by direct binding of the receptor alpha 1 subunit to gephyrin. J Neurosci. 2011;31:14677–14687. doi: 10.1523/JNEUROSCI.2001-11.2011. [DOI] [PMC free article] [PubMed] [Google Scholar]
- Müller T, Fritschy JM, Grosche J, Pratt GD, Möhler H, Kettenmann H. Developmental regulation of voltage-gated K+ channel and GABAA receptor expression in Bergmann glial cells. J Neurosci. 1994;14:2503–2514. doi: 10.1523/JNEUROSCI.14-05-02503.1994. [DOI] [PMC free article] [PubMed] [Google Scholar]
- Munro G, Hansen RR, Mirza NR. GABA(A) receptor modulation: potential to deliver novel pain medicines? Eur J Pharmacol. 2013;716:17–23. doi: 10.1016/j.ejphar.2013.01.070. [DOI] [PubMed] [Google Scholar]
- Murinson BB, Hoffman PN, Banihashemi MR, Meyer RA, Griffin JW. C-fiber (Remak) bundles contain both isolectin B4-binding and calcitonin gene-related peptide-positive axons. J Comp Neurol. 2005;484:392–402. doi: 10.1002/cne.20506. [DOI] [PubMed] [Google Scholar]
- Niwa F, Bannai H, Arizono M, Fukatsu K, Triller A, Mikoshiba K. Gephyrin-independent GABA(A)R mobility and clustering during plasticity. PLoS One. 2012;7:e36148. doi: 10.1371/journal.pone.0036148. [DOI] [PMC free article] [PubMed] [Google Scholar]
- Otsu N. Threshold selection method from gray-level histograms. IEEE Transactions on Systems Man and Cybernetics. 1979;9:62–66. doi: 10.1109/TSMC.1979.4310076. [DOI] [Google Scholar]
- Paul J, Zeilhofer HU, Fritschy JM. Selective distribution of GABA(A) receptor subtypes in mouse spinal dorsal horn neurons and primary afferents. J Comp Neurol. 2012;520:3895–3911. doi: 10.1002/cne.23129. [DOI] [PubMed] [Google Scholar]
- Paul J, Yévenes GE, Benke D, Lio AD, Ralvenius WT, Witschi R, Scheurer L, Cook JM, Rudolph U, Fritschy JM, Zeilhofer HU. Antihyperalgesia by alpha2-GABA receptors occurs via a genuine spinal action and does not involve supraspinal sites. Neuropsychopharmacology. 2014;39:477–487. doi: 10.1038/npp.2013.221. [DOI] [PMC free article] [PubMed] [Google Scholar]
- Persohn E, Malherbe P, Richards JG. In situ hybridization histochemistry reveals a diversity of GABAA receptor subunit mRNAs in neurons of the rat spinal cord and dorsal root ganglia. Neuroscience. 1991;42:497–507. doi: 10.1016/0306-4522(91)90392-2. [DOI] [PubMed] [Google Scholar]
- Pfeiffer F, Graham D, Betz H. Purification by affinity chromatography of the glycine receptor of rat spinal cord. J Biol Chem. 1982;257:9389–9393. [PubMed] [Google Scholar]
- Pfeiffer F, Simler R, Grenningloh G, Betz H. Monoclonal antibodies and peptide mapping reveal structural similarities between the subunits of the glycine receptor of rat spinal cord. Proc Natl Acad Sci U S A. 1984;81:7224–7227. doi: 10.1073/pnas.81.22.7224. [DOI] [PMC free article] [PubMed] [Google Scholar]
- Price TJ, Flores CM. Critical evaluation of the colocalization between calcitonin gene-related peptide, substance P, Transient receptor potential vanilloid subfamily type 1 immunoreactivities, and isolectin B(4) binding in primary afferent neurons of the rat and mouse. J Pain. 2007;8:263–272. doi: 10.1016/j.jpain.2006.09.005. [DOI] [PMC free article] [PubMed] [Google Scholar]
- Priestley JV, Michael GJ, Averill S, Liu M, Willmott N. Regulation of nociceptive neurons by nerve growth factor and glial cell derived neurotrophic factor. Can J Physiol Pharmacol. 2002;80:495–505. doi: 10.1139/y02-034. [DOI] [PubMed] [Google Scholar]
- Ramming M, Kins S, Werner N, Hermann A, Betz H, Kirsch J. Diversity and phylogeny of gephyrin: tissue-specific splice variants, gene structure, and sequence similarities to molybdenum cofactor-synthesizing and cytoskeleton-associated proteins. Proc Natl Acad Sci U S A. 2000;97:10266–10271. doi: 10.1073/pnas.97.18.10266. [DOI] [PMC free article] [PubMed] [Google Scholar]
- Ren K, Dubner R. Descending control mechanisms. In: Bushnell MC, Basbaum AI, editors. The Senses, a comprehensive reference, Vol. 5, Pain. San Diego: Elsevier Academic; 2008. pp. 723–762. [Google Scholar]
- Renner M, Specht CG, Triller A. Molecular dynamics of postsynaptic receptors and scaffold proteins. Curr Opin Neurobiol. 2008;18:532–540. doi: 10.1016/j.conb.2008.09.009. [DOI] [PubMed] [Google Scholar]
- Ribeiro-da-Silva A. Substantia gelatinosa of the spinal cord. In: Paxinos G, editor. The rat nervous system. San Diego: Elsevier Academic; 2004. pp. 129–148. [Google Scholar]
- Ribeiro-da-Silva A, De Koninck Y. Morphological and neurochemical organization of the spinal dorsal horn. In: Bushnell MC, Basbaum AI, editors. The Senses, a comprehensive reference, Vol. 5, Pain. San Diego: Elsevier Academic; 2008. pp. 279–310. [Google Scholar]
- Ribeiro-da-Silva A, Priestley JV, Cuello AC. Pre-embedding ultrastructural immunocytochemistry. In: Cuello AC, editor. Immunohistochemistry II. Chichester: Wiley; 1993. pp. 181–227. [Google Scholar]
- Rice FL. Structure, vascularization, and innervation of the mystacial pad of the rat as revealed by the lectin Griffonia simplicifolia. J Comp Neurol. 1993;337:386–399. doi: 10.1002/cne.903370304. [DOI] [PubMed] [Google Scholar]
- Rosenfeld MG, Mermod JJ, Amara SG, Swanson LW, Sawchenko PE, Rivier J, Vale WW, Evans RM. Production of a novel neuropeptide encoded by the calcitonin gene via tissue-specific RNA processing. Nature. 1983;304:129–135. doi: 10.1038/304129a0. [DOI] [PubMed] [Google Scholar]
- Rudolph U, Möhler H. GABA-based therapeutic approaches: GABAA receptor subtype functions. Curr Opin Pharmacol. 2006;6:18–23. doi: 10.1016/j.coph.2005.10.003. [DOI] [PubMed] [Google Scholar]
- Rudolph U, Crestani F, Benke D, Brünig I, Benson JA, Fritschy JM, Martin JR, Bluethmann H, Möhler H. Benzodiazepine actions mediated by specific gamma-aminobutyric acid(A) receptor subtypes. Nature. 1999;401:796–800. doi: 10.1038/44579. [DOI] [PubMed] [Google Scholar]
- Sakamoto H, Spike RC, Todd AJ. Neurons in laminae III and IV of the rat spinal cord with the neurokinin-1 receptor receive few contacts from unmyelinated primary afferents which do not contain substance P. Neuroscience. 1999;94:903–908. doi: 10.1016/S0306-4522(99)00346-2. [DOI] [PubMed] [Google Scholar]
- Schneider Gasser EM, Straub CJ, Panzanelli P, Weinmann O, Sassoè-Pognetto M, Fritschy JM. Immunofluorescence in brain sections: simultaneous detection of presynaptic and postsynaptic proteins in identified neurons. Nat Protoc. 2006;1:1887–1897. doi: 10.1038/nprot.2006.265. [DOI] [PubMed] [Google Scholar]
- Schröder S, Hoch W, Becker CM, Grenningloh G, Betz H. Mapping of antigenic epitopes on the alpha 1 subunit of the inhibitory glycine receptor. Biochemistry. 1991;30:42–47. doi: 10.1021/bi00215a007. [DOI] [PubMed] [Google Scholar]
- Semenenko FM, Bramwell S, Sidebottom E, Cuello AC. Development of a mouse antiperoxidase secreting hybridoma for use in the production of a mouse PAP complex for immunocytochemistry and as a parent cell line in the development of hybrid hybridomas. Histochemistry. 1985;83:405–408. doi: 10.1007/BF00509200. [DOI] [PubMed] [Google Scholar]
- Sherman SE, Loomis CW. Morphine insensitive allodynia is produced by intrathecal strychnine in the lightly anesthetized rat. Pain. 1994;56:17–29. doi: 10.1016/0304-3959(94)90146-5. [DOI] [PubMed] [Google Scholar]
- Slany A, Zezula J, Tretter V, Sieghart W. Rat beta 3 subunits expressed in human embryonic kidney 293 cells form high affinity [35S]t-butylbicyclophosphorothionate binding sites modulated by several allosteric ligands of gamma-aminobutyric acid type A receptors. Mol Pharmacol. 1995;48:385–391. [PubMed] [Google Scholar]
- Sorkin LS, Puig S, Jones DL. Spinal bicuculline produces hypersensitivity of dorsal horn neurons: effects of excitatory amino acid antagonists. Pain. 1998;77:181–190. doi: 10.1016/S0304-3959(98)00094-3. [DOI] [PubMed] [Google Scholar]
- Sugiura Y. Distribution of unmyelinated primary afferent fibers in the dorsal horn. In: Cervero F, Bennett GJ, Headley PM, editors. Processing of sensory information in the superficial dorsal horn of the spinal cord. New York: Plenum; 1989. pp. 15–23. [Google Scholar]
- Takahashi A, Mashimo T, Uchida I. GABAergic tonic inhibition of substantia gelatinosa neurons in mouse spinal cord. Neuroreport. 2006;17:1331–1335. doi: 10.1097/01.wnr.0000230515.86090.bc. [DOI] [PubMed] [Google Scholar]
- Todd AJ. GABA and glycine in synaptic glomeruli of the rat spinal dorsal horn. Eur J Neurosci. 1996;8:2492–2498. doi: 10.1111/j.1460-9568.1996.tb01543.x. [DOI] [PubMed] [Google Scholar]
- Todd AJ, Spike RC, Chong D, Neilson M. The relationship between glycine and gephyrin in synapses of the rat spinal cord. Eur J Neurosci. 1995;7:1–11. doi: 10.1111/j.1460-9568.1995.tb01014.x. [DOI] [PubMed] [Google Scholar]
- Todd AJ, Watt C, Spike RC, Sieghart W. Colocalization of GABA, glycine, and their receptors at synapses in the rat spinal cord. J Neurosci. 1996;16:974–982. doi: 10.1523/JNEUROSCI.16-03-00974.1996. [DOI] [PMC free article] [PubMed] [Google Scholar]
- Tögel M, Mossier B, Fuchs K, Sieghart W. gamma-Aminobutyric acidA receptors displaying association of gamma 3-subunits with beta 2/3 and different alpha-subunits exhibit unique pharmacological properties. J Biol Chem. 1994;269:12993–12998. [PubMed] [Google Scholar]
- Tretter V, Jacob TC, Mukherjee J, Fritschy JM, Pangalos MN, Moss SJ. The clustering of GABA(A) receptor subtypes at inhibitory synapses is facilitated via the direct binding of receptor alpha 2 Subunits to gephyrin. J Neurosci. 2008;28:1356–1365. doi: 10.1523/JNEUROSCI.5050-07.2008. [DOI] [PMC free article] [PubMed] [Google Scholar]
- Tretter V, Mukherjee J, Maric HM, Schindelin H, Sieghart W, Moss SJ. Gephyrin, the enigmatic organizer at GABAergic synapses. Front Cell Neurosci. 2012;6:23. doi: 10.3389/fncel.2012.00023. [DOI] [PMC free article] [PubMed] [Google Scholar]
- Tyagarajan SK, Fritschy JM. Gephyrin: a master regulator of neuronal function? Nat Rev Neurosci. 2014;15:141–156. doi: 10.1038/nrn3670. [DOI] [PubMed] [Google Scholar]
- Waldvogel HJ, Baer K, Eady E, Allen KL, Gilbert RT, Möhler H, Rees MI, Nicholson LF, Faull RL. Differential localization of gamma-aminobutyric acid type A and glycine receptor subunits and gephyrin in the human pons, medulla oblongata and uppermost cervical segment of the spinal cord: an immunohistochemical study. J Comp Neurol. 2010;518:305–328. doi: 10.1002/cne.22212. [DOI] [PubMed] [Google Scholar]
- Wang H, Rivero-Melián C, Robertson B, Grant G. Transganglionic transport and binding of the isolectin B4 from Griffonia simplicifolia I in rat primary sensory neurons. Neuroscience. 1994;62:539–551. doi: 10.1016/0306-4522(94)90387-5. [DOI] [PubMed] [Google Scholar]
- Whiting PJ, Bonnert TP, McKernan RM, Farrar S, Le Bourdellès B, Heavens RP, Smith DW, Hewson L, Rigby MR, Sirinathsinghji DJ, Thompson SA, Wafford KA. Molecular and functional diversity of the expanding GABA-A receptor gene family. Ann N Y Acad Sci. 1999;868:645–653. doi: 10.1111/j.1749-6632.1999.tb11341.x. [DOI] [PubMed] [Google Scholar]
- Williams JR, Sharp JW, Kumari VG, Wilson M, Payne JA. The neuron-specific K-Cl cotransporter, KCC2–antibody development and initial characterization of the protein. J Biol Chem. 1999;274:12656–12664. doi: 10.1074/jbc.274.18.12656. [DOI] [PubMed] [Google Scholar]
- Willis WD. John Eccles' studies of spinal cord presynaptic inhibition. Prog Neurobiol. 2006;78:189–214. doi: 10.1016/j.pneurobio.2006.02.007. [DOI] [PubMed] [Google Scholar]
- Willis WD, Coggeshall RE. Sensory mechanisms of the spinal cord. New York: Plenum; 1991. [Google Scholar]
- Witschi R, Punnakkal P, Paul J, Walczak JS, Cervero F, Fritschy JM, Kuner R, Keist R, Rudolph U, Zeilhofer HU. Presynaptic {alpha}2-GABAA receptors in primary afferent depolarization and spinal pain control. J Neurosci. 2011;31:8134–8142. doi: 10.1523/JNEUROSCI.6328-10.2011. [DOI] [PMC free article] [PubMed] [Google Scholar]
- Xiao HS, Huang QH, Zhang FX, Bao L, Lu YJ, Guo C, Yang L, Huang WJ, Fu G, Xu SH, Cheng XP, Yan Q, Zhu ZD, Zhang X, Chen Z, Han ZG, Zhang X. Identification of gene expression profile of dorsal root ganglion in the rat peripheral axotomy model of neuropathic pain. Proc Natl Acad Sci U S A. 2002;99:8360–8365. doi: 10.1073/pnas.122231899. [DOI] [PMC free article] [PubMed] [Google Scholar]
- Yaksh TL. Behavioral and autonomic correlates of the tactile evoked allodynia produced by spinal glycine inhibition: effects of modulatory receptor systems and excitatory amino acid antagonists. Pain. 1989;37:111–123. doi: 10.1016/0304-3959(89)90160-7. [DOI] [PubMed] [Google Scholar]
- Zeilhofer HU. Glycine receptors. In: Bushnell MC, Basbaum AI, editors. The Senses, a comprehensive reference, Vol. 5, Pain. San Diego: Elsevier Academic; 2008. pp. 381–385. [Google Scholar]
- Zeilhofer HU, Wildner H, Yévenes GE. Fast synaptic inhibition in spinal sensory processing and pain control. Physiol Rev. 2012;92:193–235. doi: 10.1152/physrev.00043.2010. [DOI] [PMC free article] [PubMed] [Google Scholar]