

Abstract
The olivo-cerebellar system is crucial for smooth and well timed execution of movements based on sensory and proprioceptive cues. The inferior olive (IO) plays a pivotal role in this process by synchronizing its activity across neurons internally through connexin36 gap junctions and providing a timing and/or learning signal to the cerebellum. Even though synchrony achieved through electrical coupling in IO cells is generally thought to be important in timing motor output, a direct relation between timing of movement and synchrony of olivary discharges has never been demonstrated within functional microcomplexes using transgenics. Here we combined in vivo, two-photon calcium imaging of complex spikes in microcomplexes of Purkinje cell (PC) dendrites with high-speed filming of tail, trunk, and limb movements in awake wild-type and connexin36-deficient mice. In wild types at rest, functional clusters of PCs were poorly defined with synchrony correlations that were relatively small and spatially limited to mediolateral distances of ∼50 μm, whereas during locomotion synchrony of the same PCs increased in strength and extended over distances spanning multiple microzones that could be correlated to specific components of sharp and well bounded movements. Instead, connexin36-deficient mice exhibited prolonged and desynchronized complex spike activity within PC microcomplexes both at rest and during behavior. Importantly, the mutants also showed concomitant abnormalities in the execution of spinocerebellar reflexes, which were significantly slower and more gradual than in wild-type littermates, particularly following sensory perturbations. Our results highlight the importance of modulation of synchronous activity within and between cerebellar microcomplexes in on-line temporal processing of motor output.
Keywords: complex spike, connexin36, in vivo, microzone, motor control, olivo-cerebellar system
Introduction
The cerebellum's structured neural circuitry assists processing of proprioceptive and sensory cues and execution of phasic reflexes (Bloedel and Bracha, 1995). Its two main input channels, the mossy fiber and climbing fiber (CF) pathways, converge in the Purkinje cell (PC) layer, where mossy fibers modulate PC intrinsic simple spike firing indirectly and CFs directly elicit complex spikes (CSs) in PCs (Eccles et al., 1964). PCs receive input from a single CF and synapse onto cerebellar nuclei (CN) neurons that project back to the source of that CF (Andersson and Hesslow, 1987; De Zeeuw et al., 1997). Consequently, the cerebellum is said to consist of microcomplexes or microzones (Ito, 1997; Bengtsson and Hesslow, 2006): functional ensembles spanning mediolateral distances of several tens to a few hundred micrometers (Oscarsson, 1979; Ozden et al., 2009), falling well within the bounds of cerebellar zones of ∼1 mm (Oscarsson, 1979; Apps and Garwicz, 2005).
Within the inferior olive (IO) cerebellar microcomplexes are thought to be dynamically grouped (Llinás, 2009; Lefler et al., 2013). Its cells are extensively and exclusively coupled through connexin36 gap junctions (Belluardo et al., 2000; Condorelli et al., 2000; Van Der Giessen et al., 2006) located in glomeruli (Sotelo et al., 1974; De Zeeuw et al., 1995, 2003). IO glomeruli receive input from chemical synapses that may regulate the extent to which IO cells are coupled at that locus (de Zeeuw et al., 1990), since olivary gap junctions mediate synchrony (Long et al., 2002). Synchronous IO discharges are likely important (Welsh et al., 1995; Ivry, 1996; Lang, 2001; Ozden et al., 2012; Schweighofer et al., 2013) and the IO may dynamically group microcomplexes to shape-specific spatiotemporal CS patterns (Lang, 2001). Multi-electrode approaches have shown that synchronous CS discharges over distances of 250–2000 μm can be related to motor control (Welsh et al., 1995; Lang et al., 1999). However, it is unclear to what extent cerebellar microzone dynamics (i.e., within distances of 200 μm) are correlated to motor behavior. This question is relevant as synchrony and dynamic regulation are particularly important within clusters of gap-junction coupled olivary neurons feeding into smaller microcomplexes (De Zeeuw et al., 2011).
We combined in vivo two-photon calcium imaging with high-speed filming of wild-type (WT) and connexin36-deficient mice on a transparent disk treadmill to correlate spatiotemporal CS patterns with tail, trunk, and limb movements. Calcium imaging has already been used to investigate PC CS activity through the large dendritic calcium transients elicited by CF firing (Miyakawa et al., 1992; Sullivan et al., 2005; Ozden et al., 2009). In our experiments we monitored up to ∼50 PCs simultaneously in medial zone lobule V of cerebellar cortex, where receptive fields for tail, trunk, and proximal limbs are found (Provini et al., 1968; Eccles et al., 1968b; Jörntell et al., 2000; Ghosh et al., 2011; Ozden et al., 2012; Witter et al., 2013). This allowed us to investigate differences in CS firing between Cx36−/− mice and WT littermates within microzones with high spatial acuity and relate this to observed movements.
Materials and Methods
All animal and experimental procedures were approved by the Animal Experimentation and Ethics Committee of the Royal Netherlands Academy of Arts and Sciences. A total of 21 mice between 2 and 6 months of age and of either sex were used for the current study, divided into experimental groups of Cx36−/− mice (11 animals: 5 females and 6 males) and WT littermates (10 animals: 3 females and 7 males) bred on a C57BL/6 background.
Headplate surgery.
A stainless steel plate with a circular cutout was mounted on the mouse skull using dental cement (Super Bond C&B; Sun Medical). To attach the plate, mice were anesthetized with isoflurane (2%, IsoFlo; Abbott) and placed in a stereotactic frame, on a temperature-controlled heating blanket with a thermistor to maintain body temperature at 37°C. Eye ointment was applied to the eyes to keep them moist and lidocaine HCl was applied topically to the site of incision. A skin incision was made from bregma extending beyond lambda after which skin was parted and neck muscles were partially removed at the border of the interparietal and occipital bone. The plate was centered at the midline 2 mm caudal of lambda. The placement of the circular cutout was located above zone A of lobule V of the cerebellum. After surgery, mice were allowed to recover for at least 2 d, during which time their wellbeing was monitored.
Craniotomy and dye loading.
After headplate surgery and recovery, a dental drill was used to thin the skull at the headplate's circular cutout and fine tweezers (tip inserted at lambda) were used to lift the thinned portion of the skull exposing the cerebellar cortex. Tissue was then bolus loaded with OGB-1/AM (Invitrogen; O6807) as described previously (Stosiek et al., 2003; Sullivan et al., 2005; Ozden et al., 2009). OGB-1/AM was dissolved in pluronic in DMSO (4 μl) and diluted in 76 μl of aCSF (150 mm NaCl, 2.5 mm KCl, and 10 HEPES 10, pH 7.4). Agarose (2%) and a cover glass held down by a custom-designed clamp attached to the headplate were used to stabilize the brain during imaging.
Experimental setup.
A commercially available two-photon microscope (TriM Scope II; LaVision BioTec) was used in conjunction with a Chameleon Ultra II tunable, infrared pulsed laser (Coherent) set at 800 nm. A 20×, 1.0 NA objective (XLUMPLSLN; Olympus) was used in all experiments.
Mice were head fixed during the experiments, but could locomote at will on a custom-built treadmill. This treadmill consisted of a transparent Plexiglas disk (of 260 mm diameter) secured on a ball bearing, which allowed disk rotation around a central axis. We used an optical computer mouse or a magnetic encoder (both 1 kHz polling) to report disk movement as relative linear, or angular displacement, respectively. A shaft-mounted electromagnetic clutch was implemented along the rotational axis to provide sensory perturbations to the mouse when engaged for brief durations (50 ms). We used an infrared-sensitive camera (frame rate: 100 Hz) to capture images of the mouse from below, through the transparent disk treadmill.
During the experiments, white noise was continuously played through a speaker located directly behind the mouse at 68 dB in combination with ambient noise measured at the mouse's location. In addition, tone stimuli could be generated at a frequency of 8 kHz at 75 dB measured at the mouse's location.
Behavioral analysis.
Camera data were screened for small behavioral “twitches” using an approach described previously (Witter et al., 2013). This approach uses a reference frame coinciding with a trigger, establishes pixel variance levels in frames up to 200 ms before the trigger, and performs a variance-corrected comparison between the reference frame and the subsequent frames. This way, minute postural changes that would be missed using more conventional approaches such as the mean difference between frames could be detected while still correcting for camera sensor noise and movements caused by the animal at rest, e.g., due to breathing.
To test for statistical significance of responses and response differences, we used the Ansari–Bradley test, which assesses the likelihood that two samples derive from the same distribution or from distributions with differing dispersion characteristics. As differences in median values can lead to false results using this test, we performed the test only on median-corrected data. Trials in which movement was detected were tested against bootstrapped data. In addition, direct comparisons between the experimental groups were made to test for differences in twitch execution. For an indication of effect size of a Cx36 deficiency on mean twitch values, we used Glass' Δ as a measure to compare WT and Cx36−/− groups, taking the WT values as the control group for the variance estimate. A value >1 was considered a large effect.
Calcium transients, signal analysis, and hyperacuity.
The cerebellar cortex was imaged with the fast scan direction aligned transversely, to ensure that the respective timing of signals in ensembles of the sagittally oriented PC dendrites would be recorded with the highest possible fidelity. Calcium imaging data were analyzed using spatial independent component analysis (ICA) to extract dendrite masks. Dendrite masks were automatically thresholded (using mean pixel intensity and 5 SDs) and after removal of overlap of pixels used to calculate the changes in fluorescence ΔF/F for individual PC dendrites. See Figure 1 for an overview of the imaging experiment dendrite isolation and a sample of the data.
Figure 1.
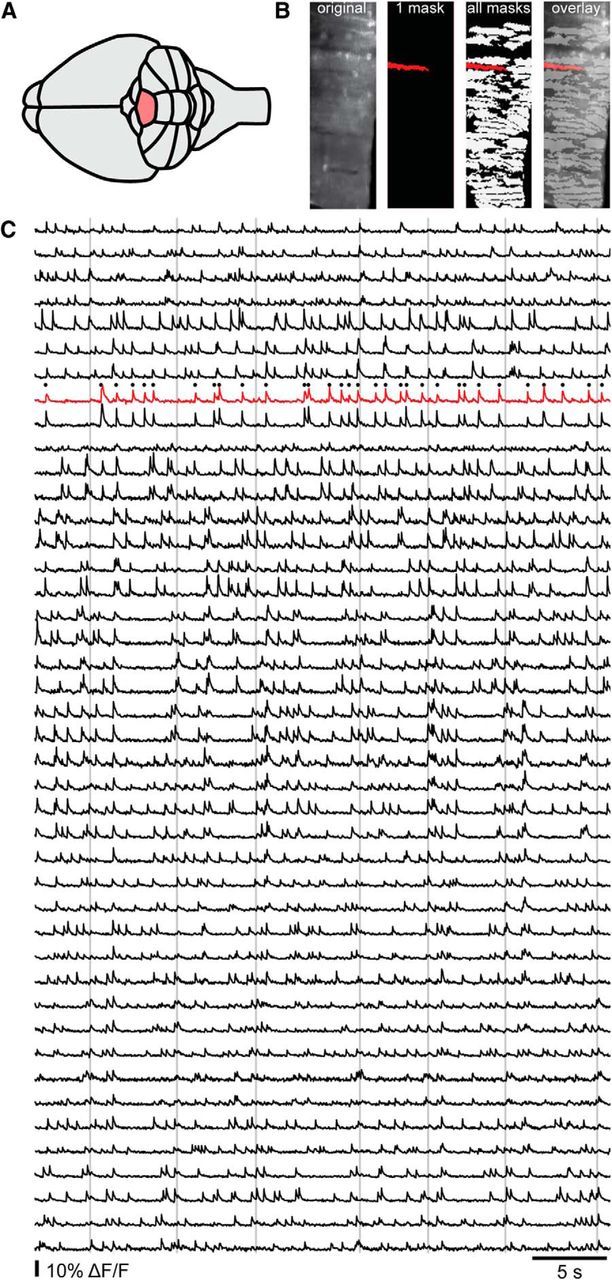
Overview of imaging data acquisition. A, Imaging experiments were performed in lobule V (shaded). B, Raw imaging data (first image) were processed using spatial ICA, the results of which yielded individual masks corresponding to active PC dendrites that were then used to isolate the fluorescence signal (second image). Thus, we could monitor large fields of dendrites (third and fourth images) and extract the signals for each individual PC (red overlaid on all masks). C, ΔF/F signals from the FOV in B. The red trace corresponds with the single PC dendrite mask that was labeled red in B, with detected events indicated by black dots. The vertical lines indicate times at which sensory perturbations occurred.
Detection of CS events from calcium transients was performed using a method previously described (Ozden et al., 2012), which had an estimated detection accuracy of >91% for our data. To obtain this estimate, we tested the algorithm on a substantial mock dataset, which was generated based on our entire original dataset. For every trace of our original data, we generated a mock counterpart of 50 min in which events were randomly inserted at a mean rate of 1 Hz using a Poisson process. To estimate the signal-to-noise levels in the mock traces we calculated for every corresponding original ΔF/F trace (1) the mean and SD of that trace and (2) the mean and SD of the portion of the trace exceeding a threshold of mean + 2 SDs as established in step 1. The event amplitudes in the mock traces were randomly taken from the peak amplitude distribution calculated in (2) and convolved with an exponential decay function, after which Gaussian noise as determined in (1) was added to the trace (Vogelstein et al., 2010). Due to the biases introduced in calculating the noise and signal variance levels, the signal-to-noise ratios were deliberately underestimated. Furthermore, the random Poisson spiking allowed for a closer temporal spacing of events than possible for CSs. This provided us with a worst-case estimate of the performance of the algorithm on our dataset. Under these adverse conditions it achieved a detection accuracy of 91%, with a higher chance of false positives (6%) than false negatives (3%). False positives tended to occur following a uniform distribution, leading us to believe that these will not have a significant effect on our averaged values. False negatives tended to occur when an event had already been detected directly prior (typically one or two frames distance), which could occur more readily in the mock data traces due to higher noise levels and randomized Poisson spiking than in our original data. We deemed the performance of the algorithm satisfactory, especially considering that it would perform better on our actual data.
To look at event correlations between dendrites within the same field of view (FOV), the Pearson correlation coefficient was calculated using the (binary) detected event matrices to prevent high correlation values due to locally correlated noise. Events between dendrites that occurred within 30 ms of each other were considered to be coactive. As the imaging frame rates we used were either 30 ms/frame or 15 ms/frame, we defined coactivity as taking place in the same frame or in the same or subsequent frame, respectively.
To be able to determine absolute latencies of response times in calcium transients to stimuli despite the relatively low imaging frame rate, a hyperacuity algorithm was used on the binary traces representing CS event occurrences during stimulation trials. The algorithm mapped traces to 1 kHz resolution, keeping the original data bins (of 15 or 30 ms duration) intact but aligning them to a stimulus trigger, which was logged at 1 kHz. Once realigned with millisecond precision, we could thus improve the estimate of time of occurrence over other methods such as binning of data through averaging multiple realigned event representation traces of low temporal resolution (Fig. 2A–C). The algorithm's reconstruction of triggered event timing was highly accurate provided that the number of traces used to generate the response delay estimate was at least equal to the number of milliseconds per imaging frame (Fig. 2D). In our experiments, the number of trials was well over the 100 required for an estimated error of 0 ms for both experimental groups (WT, n = 246; Cx36−/−, n = 317).
Figure 2.
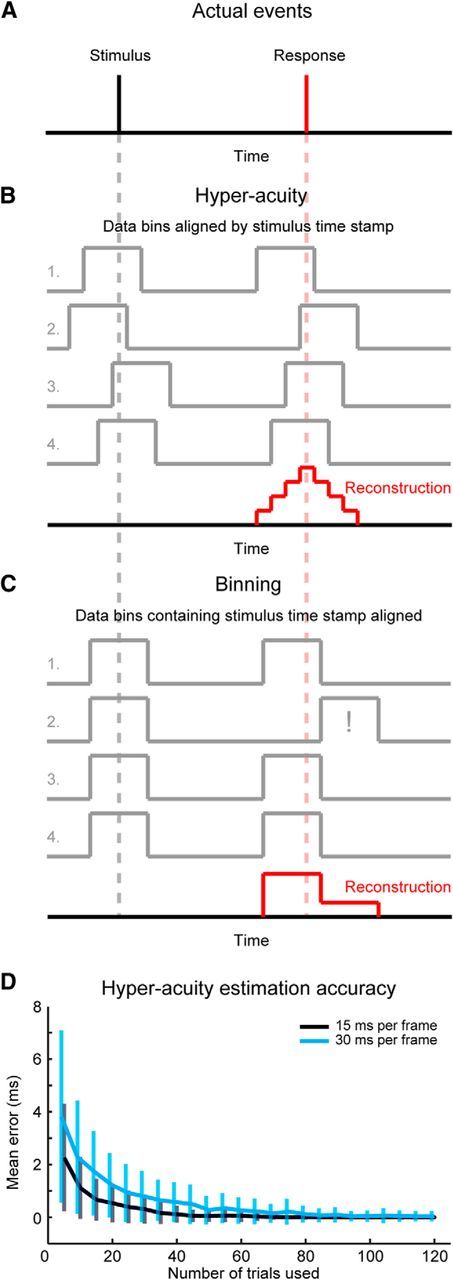
Hyperacuity algorithm overview (A) schematic illustrating the hyperacuity algorithm concept. Top, Stimulus (black) and stimulus response (red) are shown as brief events. Their timings are illustrated throughout with the black and red dashed lines, respectively. B, If the timing of the stimulus is logged at a higher frequency than the data used to detect the response (effectively binning the original data), but the low-frequency data gathering is time stamped with high enough temporal precision, the low temporal resolution data can be aligned to the stimulus. In other words, it can then be determined when (how early or late) during a data bin the stimulus occurred and the traces can be aligned accordingly. This allows for a subresolution estimation of the peak response by averaging multiple stimulus-response trials, shown by averaging the four data traces of low temporal resolution shown in the middle. C, If a binning approach is used, the high temporal resolution trace of the stimulus is used to identify the data bins during which it occurred and these data bins are aligned. This potentially allows for traces that no longer correspond to actual events, such as illustrated in trace 2 (see the data bin containing the response indicated by the exclamation mark and note the same trace aligned differently in B). The final reconstructed response obtained from averaging the four traces provides a poor estimate of the timing of the peak response. D, Test results of the hyperacuity algorithm applied to computer-generated low temporal resolution traces of 15 ms per frame (black trace) and 30 ms per frame (blue trace), where the stimulus and triggered response were known with millisecond precision. For every data point, 100 simulations were run to obtain the mean and SD. Error is defined as mean estimation difference (in milliseconds) from the actual response time. Error bars indicate SD. As can be seen in the plot, an average estimation error of <1 ms was obtained when the number of trials used was equal to the frame time in milliseconds.
To measure effect size of calcium transient responses to stimuli we used Glass's Δ. A value >1 was considered a large effect. For the calculations of effect size of responses within groups, we used the baseline samples as the control condition. For the comparison between WT and Cx36−/− animals, we used the WT group's data as the control condition.
Results
Treadmill behavior comparison
Both WT and Cx36−/− mice spent most of the time on the treadmill sitting still, but also frequently exhibited bouts of walking or running. Bouts of locomotion varied substantially in duration within both groups, though on average WT animals walked for slightly longer periods of time than their Cx36-deficient littermates (WT durations of locomotion bouts, mean ± SD: 18 ± 10 s; Cx36−/− durations of locomotion bouts, mean ± SD: 15 ± 10 s, p < 0.05, two-tailed t test). The small differences between experimental groups could be caused by differences in animal size, as Cx36−/− animals are generally smaller than their WT littermates (Kistler et al., 2002). No differences in locomotion parameters such as stride length and base of support were found.
General CS firing properties
At rest and in the absence of any stimuli, CS firing rates were highly similar for both Cx36−/− and WT animals, as is apparent from their overlapping interspike interval (ISI) distributions (Fig. 3A). The cumulative distributions of ISIs did not differ significantly between the groups [Kolmogorov–Smirnov (K–S) test, p = 0.9]. Both groups had a mean ± SD CS firing rate of 0.8 ± 0.3 Hz averaged per trace (and a population median firing rate of 1.1 Hz, as derived from the ISIs).
Figure 3.
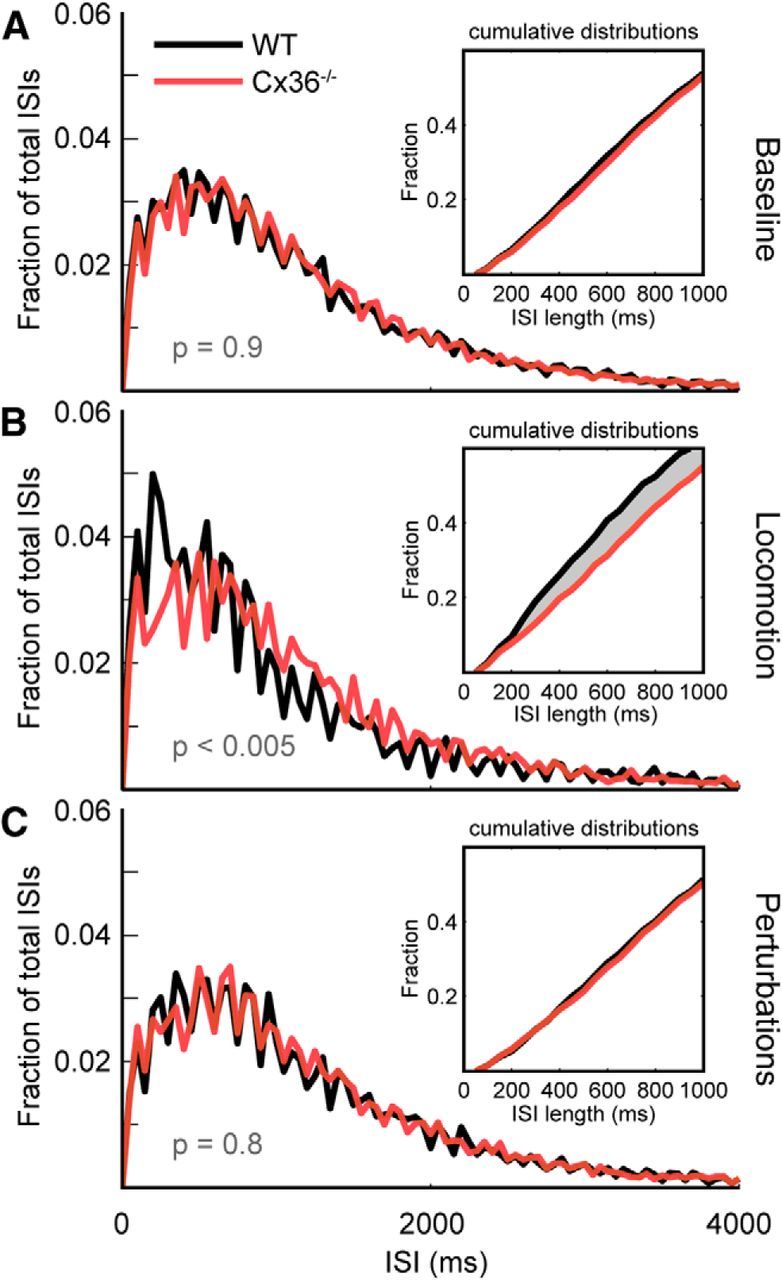
ISI interval distributions for experimental conditions. A, Baseline condition (nCx = 11 animals, nWT = 10 animals). Distributions of ISIs are highly similar for both WT and Cx36−/− mice (p = 0.9, K–S test). B, During locomotion, CS activity correlated with behavior showed significantly different ISI distributions between experimental groups (p < 0.005, K–S test, nCx = 7 animals, nWT = 6 animals). WT animals show a shift toward shorter ISIs compared with Cx36−/− mice. See also the shaded area indicating the difference between the cumulative distributions shown in the inset. C, Trials in which sensory perturbations were presented at a mean rate of 0.2 Hz yielded no significant difference between Cx36−/− animals and WT littermates (nCx = 11 animals, nWT = 10 animals).
During locomotion, CS ISI distributions were markedly different between the experimental groups. As seen in Figure 3B, the distribution of ISIs was considerably wider in Cx36−/− mice compared with that in WT littermates (K–S test, p < 0.005). The shift in ISI distributions yielded different median firing rates between the experimental groups (Cx36−/−: 1.1 Hz vs WT: 1.4 Hz), while the mean firing rates averaged per trace remained the same for both groups (mean ± SD: 0.9 ± 0.4 Hz for both groups).
The disk-based treadmill was fitted with a magnetic coupling device located along the rotational axis that, when engaged for a brief period (50 ms), produced disk vibrations of sufficient saliency to act as sensory perturbations, which triggered reflexive movements. Sensory perturbations provided us with a condition that was more temporally bound than ongoing locomotion (Gellman et al., 1983), facilitating temporal analyses of movements. ISI distributions taken from full traces during which sensory perturbations were provided at a mean rate of 0.2 Hz were highly similar to baseline (Fig. 3C). This indicated that an effect, if present, would be temporally bounded and brief. For both Cx36−/− mice and WT littermates the mean ± SD. firing rates for these traces including perturbations were 0.8 ± 0.3 Hz, with a median firing rate of 1.0 Hz derived from the ISIs from both groups (K–S test, p = 0.8).
In a previous study, the occurrence of doublets, multiple CS events within a time window of 200 ms, in Cx36−/− mice was quantified (Van Der Giessen et al., 2008). These doublets occurred at low rates and were found to have a higher chance of occurring in Cx36−/− than WT animals. The mechanism behind the increased doublet occurrence following from a Cx36 deficiency is not yet fully understood. It could be due to increased excitability and tendency to fire rebound spikes in IO cells of Cx36−/− mice (De Zeeuw et al., 2003). However, this provides only a partial explanation as we previously found that population profiles from pooled single-unit recordings show two distinct latencies for IO firing in response to a stimulus, of which the later response's likelihood is increased in Cx36−/− mice and includes cells that did not fire during the first response (Van Der Giessen et al., 2008). This indicates a network effect through the olivo-cerebellar loop, rather than a purely cell-intrinsic phenomenon in the IO, and is supported by recent findings on CS modulation through olivo-cerebellar network effects (Chaumont et al., 2013; Witter et al., 2013).
In our experiments in awake mice at rest and without external stimuli, we found no difference in doublet firing between WT and Cx36−/− mice: for both groups 7% of all ISIs was smaller than 200 ms. Interestingly, for locomotion trials the probability of doublet occurrence increased for both groups, but the WT animals showed the highest percentage of ISIs smaller than 200 ms (WT: 12% vs Cx36−/−: 9%). As could be expected when considering the similarity in ISI distributions between baseline and perturbation conditions, we found no difference between Cx36−/− and WT doublet probability when analyzing entire traces. However, when considering only calcium transients occurring up to 1000 ms after a perturbation, the fraction of doublets increased markedly for both animal groups, but was highest in Cx36−/− animals (WT: 20% vs Cx36−/−: 28%), in line with previous findings (Van Der Giessen et al., 2008).
Spatial correlations
We investigated correlations between CS activity in PC dendrites within the same FOV. Results obtained by Ozden et al. (2009) through the use of intra-olivary mefloquine injections showed a marked decrease in CS correlations between PC dendrites in anesthetized animals to the point that correlations were virtually absent. In our experiments, CS activity in awake Cx36−/− mice was similar to that of WT littermates under baseline conditions (baseline p = 0.6, repeated-measures ANOVA; Fig. 4A). Since concerted CS activity likely has behavioral correlates (Welsh et al., 1995; Ivry, 1996; Lang, 2001; Schweighofer et al., 2013) and since CS activity can be generated intrinsically by the olivo-cerebellar system (Chaumont et al., 2013; Witter et al., 2013) as well as through sensory stimulation (Eccles et al., 1968a), we investigated CS activity during locomotion as well as during sensory perturbations. Significant differences between the experimental groups became apparent, both when the animals were locomoting and when they were subjected to sensory perturbations (Fig. 4).
Figure 4.

Spatial correlations of CS activity for experimental conditions. A, Baseline condition (nCx = 11 animals, nWT = 10 animals); shaded areas indicate SD and dashed lines indicate maximum of the mean local correlation calculated for the corresponding 10 μm bin. Correlated CS activity between pairs of PC dendrites shows the same inverse relationship with mediolateral distance separation in both experimental groups. B, During locomotion, correlated CS firing between PCs is significantly higher in WT animals when compared with Cx36−/− littermates (p < 0.001, nCx = 7 animals, nWT = 6 animals). Shaded areas indicate SD, and dashed lines indicate maximum of the mean local correlation calculated for the corresponding 10 μm bin. C, In trials with sensory perturbations, correlated CS firing between PCs is significantly higher in WT animals when compared with Cx36-deficient littermates (p < 0.005, nCx = 11 animals, nWT = 10 animals). Shaded areas indicate SD, and dashed lines indicate maximum of the mean local correlation calculated for the corresponding 10 μm bin. D, During sensorimotor processing, correlation values are greatly increased in WT mice (top) and markedly less so in Cx36−/− mice (bottom). E, CS correlations of dendrites with respect to a center dendrite (in white and indicated with an arrowhead) in WT during baseline, locomotion, and sensory perturbations. Correlations are an average of five randomly selected data points, projected on dendrite masks. During locomotion (middle) or perturbations (bottom), correlations become both higher and more widely spread when compared with baseline (top) in WT mice. F, Same as E, but for Cx36−/− mice. During locomotion (middle) or perturbations (bottom), correlations may increase somewhat, but stay mostly local. G, Two examples of pairwise dendrite correlation matrices for extracted events (i.e., binary data) from the perturbation condition, plotted as heat maps. Left, WT example (same dataset as presented in Fig. 1). Right, Cx36−/− example. Top, Correlation matrices for dendrite pairs with the diagonal showing the identity condition. Dendritic correlations tend to remain fairly low in both animal groups. However, WT correlations can be high between dendrites that are relatively far apart (such as the example indicated by circle 1). This was not observed in Cx36−/− animals. Moreover, WT dendritic correlations often show localized hot spots such as the one indicated by circle 2, which are less pronounced in Cx36−/− animals. Bottom, Columnwise-sorted correlation values, identity values excluded. From these plots it is readily apparent that correlation coefficient distributions can be largely similar, but the highest scores (possibly even spanning larger mediolateral distances) are only attained in WT.
During locomotion, spatial correlations in WT animals reached significantly higher values over mediolateral distances than in Cx36−/− animals (p < 0.001, repeated-measures ANOVA; Fig. 4B). This difference was also present when the animals were exposed to sensory perturbations (p < 0.005, repeated-measures ANOVA; Fig. 4C) despite the similarity in ISI distributions for that experimental condition when considering full traces. Together, these findings suggest an effect on spatiotemporal patterning of CS activity (Fig. 4D–G).
To determine whether these differences in spatiotemporal activity patterns were due to stable differences in spatial grouping of active dendrites, we performed meta-k-means clustering on our data (Ozden et al., 2008) and compared the number of dendrites per cluster between groups and for all experimental conditions.
Clustering outcomes were often variable within and between FOVs for both Cx36-deficient and WT animals. The Dunn index value used as a criterion in the clustering procedure to attain good cluster separation yielded variable outcomes for values lower than 0.8, even during baseline conditions. For values of 0.8 and higher, clustering results became more stable (though never fully stable) with higher values showing a trend of larger fractions of dendrites not assigned to a cluster. Mean cluster sizes did not differ significantly per condition and within groups for Dunn index values of 0.8 and 0.9. We therefore pooled the data of these clustering runs for further analysis. The mean number of dendrites per cluster was similar for both groups under baseline conditions. During sensorimotor processing (i.e., locomotion and perturbation trials) the cluster sizes followed a trend in that they were consistently elevated over baseline levels in WT but not in Cx36−/− animals. However, only the number of dendrites per cluster during perturbation trials tested was significantly larger in WT animals than in Cx36−/− mutants (Fig. 5, mean ± SD, Cx36−/− 4.8 ± 5.6 dendrites; WT 7.7 ± 8.5 dendrites; p = 0.02, Wilcoxon rank-sum test).
Figure 5.
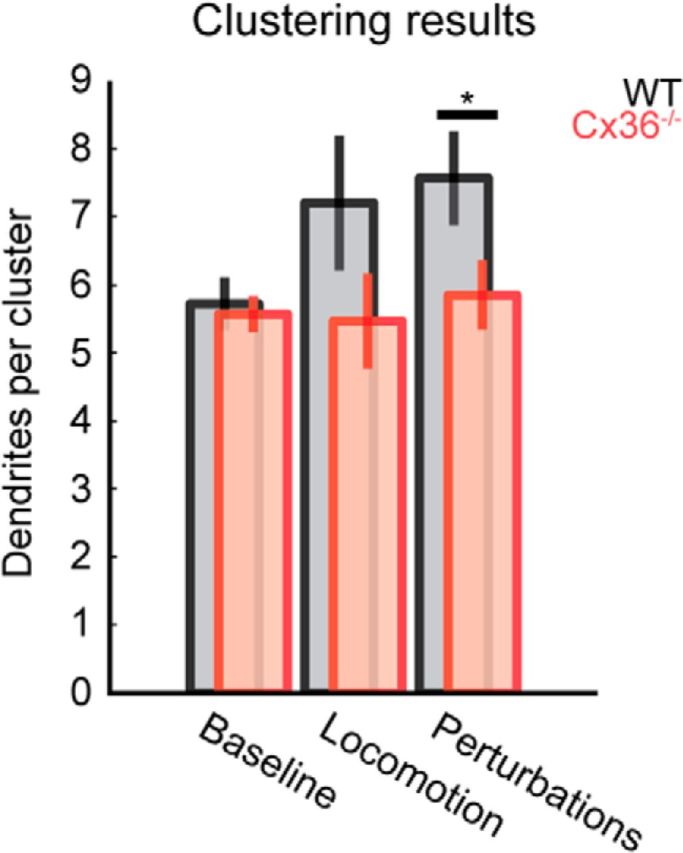
Comparison of number of dendrites assigned to clusters by meta-k-means clustering. Data presented as mean ± SEM. Cluster sizes show a trend of increasing during sensorimotor processing in WT animals. In Cx36−/− mice, cluster sizes remain similar across conditions. For perturbation trials, the difference between Cx36−/− and WT animals reached statistical significance (p < 0.05) and was higher than baseline in WT animals (p < 0.05).
In summary, we made three main observations regarding the spatial correlations of CS activity during baseline and sensorimotor processing conditions (i.e., locomotion and perturbation conditions): (1) CS correlations are similar for Cx36−/− mice and WT littermates during baseline conditions (Fig. 4A); (2) correlations over mediolateral distances are reduced in Cx36−/− mice when compared with WT littermates during sensorimotor processing (Fig. 4B,C); (3) the cluster size does not change during sensorimotor processing in Cx36−/− mice, whereas there is a significantly larger cluster size in WT animals during perturbation trials and there is an overall trend for increased cluster size in WT animals during sensorimotor processing (Fig. 5).
Triggered CS responses
A previous study has shown a substantial CS coactivation in PC dendrites at locomotion onset (Ozden et al., 2012). We also investigated CS coactivation triggered to locomotion onset (nCx = 7 animals, nWT = 6 animals). In addition to the increased spatial correlation between calcium transients and a minor increase in CS firing (both mentioned previously), CS coactivation of PCs was increased significantly in a time window starting ∼100 ms before disk motion onset with the highest coactivation attained ∼15 ms before disk motion (WT fraction of coactive dendrites 0.11; Cx36−/− fraction of coactive dendrites 0.13). No substantial coactivation was observed when triggering to termination of disk motion.
In response to sensory perturbations, all mice showed strong long-latency PC coactivations (p < 10−308, for both WT and Cx36−/− groups, two-sided K–S test on 200 ms data blocks prestimulus and poststimulus) with similar timing for the maximum response. For both groups the increase in CS firing was large when compared with baseline mean and variance levels, but largest in WT animals (effect sizes: WT Glass's Δ = 7, Cx36−/− Glass's Δ = 3). The center of the first peak in the response profile (first response latency) was 53 ms for both groups, but the CS response profiles differed substantially (p < 10−80, two-sided K–S test on 200 ms data blocks post stimulus; Fig. 6A). In Cx36-deficient mice, the perturbation-triggered coactivation was initially weaker and followed by a more pronounced second component ∼60 ms after the first peak (i.e., doublets and delayed responses) compared with WT mice, which showed a strong first response with a second component only weakly present. A millisecond to millisecond comparison using a two-sided K–S test revealed that the only significant differences between the coactivation profiles of the groups were centered on the peak responses (first peak p < 0.001; second peak p < 0.0001), with no significant differences in baseline activity. The effect size of Cx36 deficiency on the mean CS coactivation levels following a perturbation was large (Glass's Δ = 2).
Figure 6.

Differences in CS response profiles and spinocerebellar reflex execution. Shaded areas indicate SD. A, Perturbation-triggered CS coactivation response profile comparison. Both animal groups show a primary and secondary response component at 53 and 113 ms post trigger (indicated by the dashed lines), but the profiles differ substantially: the WT shows a high first coactivation followed by a smaller secondary coactivation whereas the Cx36−/− mutant shows a spread activation with two peaks of similar size (nCx = 11 animals, nWT = 10 animals). B, Tone-triggered CS coactivation response profile comparison. Shaded areas indicate SD. Auditory nonstartle stimuli did not evoke a CS response (nCx = 11 animals, nWT = 10 animals). C, Example traces of calcium transients before and after a sensory perturbation. Gray line indicates the occurrence of the sensory perturbation. Note the spread activation and occurrence of doublets in Cx36−/− animals when compared with WT littermates. D, Twitch detection example taken from a WT animal. The sensory perturbation occurs at 0 ms. After 60 ms, the algorithm detects a significant change in camera footage marking it as a twitch trial. In a comparison of the corresponding frame and the frame at the time at the trigger, a small deflection of the tail can be seen (see inset). The continuation of the twitch is a postural adjustment involving multiple muscle groups, as shown in a similar comparison of frames using a frame 160 ms after the trigger (see insets). E, Comparison of twitch execution profiles. Shaded areas indicate SD. Both groups show a similar timing of twitch onsets at ∼50 ms after the trigger (indicated by dashed line, WT p < 0.05, Cx36−/− p < 0.0005, Ansari–Bradley test). The execution of the twitch is significantly different between the groups (p < 10−308, Ansari–Bradley test).
Since activation of the magnetic coupling of the disk setup also generated a distinctive sound, we wanted to ascertain to what extent auditory stimulation could affect the recorded CS activity. To our knowledge, olivary projections to medial areas of lobule V have never been shown to encode for auditory input, though use of a “clap” stimulus loud enough to cause startle responses has been reported to evoke CS activity in mice in this region (Ozden et al., 2012). We did not expect a CS response to a nonstartle auditory stimulus and verified this by playing a tone stimulus at times when the mouse was not moving, after which we investigated PC coactivation using the tone onset as a trigger. The tone stimulus did not elicit any behavioral responses, nor did it elicit coactivation of PCs as shown in the averaged trace for tone-triggered coactivation (Fig. 6B).
Reflexes and neural correlates
Next, we investigated potential correlations between stimuli and resulting neural activity and small behavioral motor responses we refer to as twitches. Whereas locomotion is a cyclic pattern with some variation in cycle length upon which the olivo-cerebellar system acts via proprioceptive and sensory cues that are largely unknown, a twitch is generally an immediate spinocerebellar response to a controllable external event, thus facilitating further analysis. We used an automated detection algorithm described previously (Witter et al., 2013) to analyze the camera images of the mouse behavior and mark the presence of twitches (Fig. 6D). Careful inspection of a subset of the twitch detection data showed that twitches were predominantly detected in the tail, hind limbs, and front limbs with no significant differences between Cx36−/− and WT mice. Whereas tone stimuli elicited neither behavioral nor neuronal responses, sensory perturbations generally did. Furthermore, the mean twitch response probability for sensory perturbations was similar for both groups (Cx36−/−: 65 ± 19% vs WT: 68 ± 14%, mean ± SD).
Not only did the neural responses differ between WT and Cx36-deficient mice (Fig. 6A,C), the execution of twitches was also different. The onset of the motor response for both groups was similarly timed at ∼50 ms (WT p < 0.05, Cx36−/− p < 0.0005, Ansari–Bradley test against bootstrapped data), coinciding with the first response in the calcium transient profiles. The WT animals showed a response pattern with a sharp onset (Fig. 6E). In individual twitches of WT mice we generally observed a biphasic response profile (Fig. 6D), but this was largely lost in the population average (Fig. 6E). The consistent sharpness present in the WT response was lost in Cx36−/− animals, which showed a more diffuse onset followed by a gradual execution and more variability in the timing of the response (Fig. 6E). The difference between the groups in twitch execution was highly significant after the first 10 ms of the twitch onset (60 ms post trigger, p < 10−308, Ansari–Bradley test). The effect on the mean twitch response was small (Glass's Δ = 0.1), indicating that the timing and reproducibility of twitch responses rather than, e.g., movement amplitude was affected in Cx36−/− animals.
The CS responses could be a correlate of the maximal twitch velocity, as their profiles seemed to coincide (Fig. 7). An alternative explanation might be that the initial part of the twitch was mediated by the spinal cord, which normally also shows Cx36 expression (Matsumoto et al., 1988). After the initial part of the twitch, CS volleys fired by PCs might then modulate movement with a delay through rebound firing in the CN, which could explain the similarity in shape between the observed CS coactivations and twitch velocity profiles 80 ms later (Fig. 7).
Figure 7.
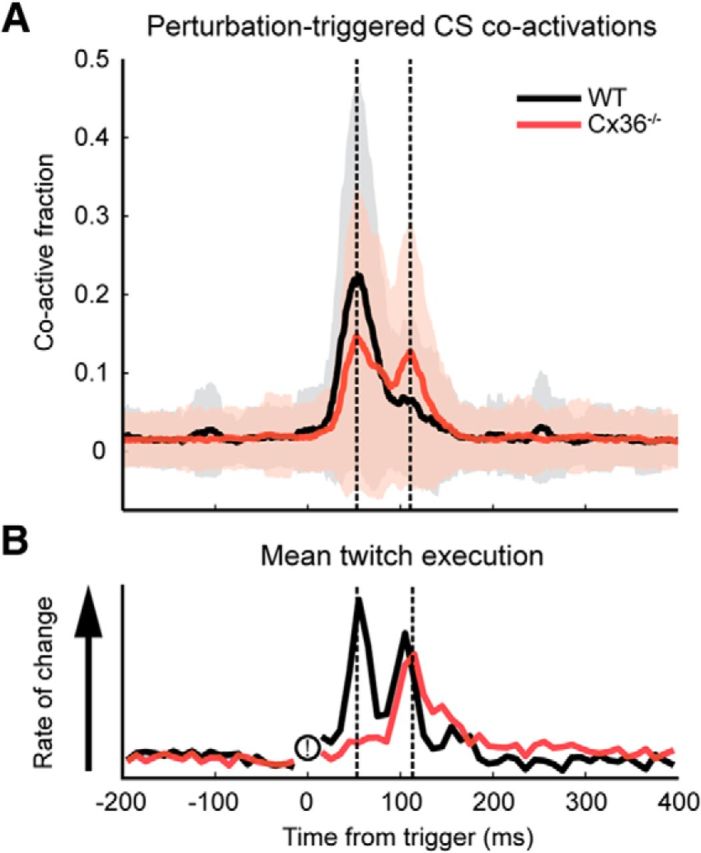
Timing aspects of the CS response and the rate of change in the camera data logging the twitch response. Perturbation occurs at 0 ms. A, Population averages of the calcium transient response, with the dashed lines indicating the peak responses at 53 and 113 ms poststimulus. B, The mean rate of change of the twitch execution for WT and Cx36−/− animals (i.e., derivative traces of the mean twitch responses plotted in Fig. 6E). The dashed lines again indicate the peak CS responses at 53 and 113 ms.
We have demonstrated a difference in PC population firing of CSs separated by observed behavior, but so far the trigger was a sensory perturbation or onset of disk motion. Though these triggers showed an increased chance of concerted CS generation in PC dendrites correlated with behavior, the question to what extent motor events can be predicted on the basis of CS coactivations still remained. Since such synchronous CF activity is thought to be important for motor behavior (Welsh et al., 1995; Ivry, 1996; Lang, 2001; Schweighofer et al., 2013), we investigated whether substantial PC CS coactivations in zone A of lobule V had behavioral correlates under baseline conditions (i.e., when the mouse was at rest without external stimuli). Indeed, when selecting coactivations larger than 25% as a trigger, twitches could often be detected in the camera frames immediately after the frame coinciding with the onset of the two-photon imaging frame used for triggering. Even though the distributions of coactivations larger than 25% of the population of PC dendrites within a FOV were similar in both groups (meanCx = 35%, SDCx = 10%, medianCx = 31% and meanWT = 35%, SDWT = 10%, medianWT = 32%), the probability of detecting a twitch based on coactive PC dendrites was significantly different between Cx36−/− and WT animals (Cx36−/− 0.32 vs WT 0.45, p < 0.01, nCx = 323 and nWT = 198 triggers). Twitch execution shape between WT and Cx36−/− animals when triggered to CS coactivations did not test as significantly different (p = 0.3, Ansari–Bradley test).
Since the twitch detection algorithm uses a reference frame and a correction for the variance in pixel values in frames preceding the reference frame, its accuracy in detecting a twitch starting before the trigger might be compromised. To exclude this possibility, we repeated the experiment with the trigger points shifted 100 ms before coactivations exceeding 25% of the dendrites within the FOV (Fig. 8). This yielded the same twitch detection probabilities mentioned earlier with the twitch onset timed around CS coactivation of PCs.
Figure 8.

Twitch detection using PC dendritic coactivations >25% as a putative event marker. A, Example of the method and a detected twitch. The trigger point (indicated by dashed line number 1) is set to 100 ms before the coactivation. In other words, the coactivation used to detect a twitch occurs 100 ms after the trigger point used by the algorithm (indicated by dashed line number 2). In this example a twitch is detected 140 ms after the trigger, i.e., up to 40 ms after the coactivation (indicated by dashed line number 3). The reference frame comparisons with insets to the right show that the detected twitch is a tail movement. B, Average twitch profile of WT data for all triggers (time of coactivation indicated by the dashed line, n = 198). Shaded area indicates SD. C, Average twitch profile of Cx36−/− data (time of coactivation indicated by the dashed line, n = 323). Note the increases in variance, due to Cx36−/− doublet firing (multiple triggers in rapid succession), surrounding the time of coactivation. Shaded area indicates SD.
Discussion
Neurons in the IO prominently express Cx36 (Condorelli et al., 1998, 2000), from which dendrodendritic gap junctions are formed (De Zeeuw et al., 1995, 2003). These were predicted four decades ago to be essential for the timing of motor output (Llinas et al., 1974; Sotelo et al., 1974). Remarkably, so far the phenotype of Cx36-deficient mice has appeared relatively mild with little sign of impaired motor performance (Kistler et al., 2002). Mainly when subjected to sophisticated motor tasks, such as eyeblink conditioning or the Erasmus Ladder test, did these animals show impairments in motor timing of a conditioned response (Van Der Giessen et al., 2008). Yet here, despite the redundancy generally inherent to biological systems, by using a novel transparent treadmill setup, we show that Cx36−/− mice have deficits that cannot be compensated for in the timing of their spinocerebellar reflexes. Moreover, we have been able to simultaneously visualize with high spatial acuity the CS activity of neighboring PCs in cerebellar microcomplexes involved in the coordination of these reflexes.
Spatial organization of CS activity
Previously, multi-electrode approaches revealed CS synchrony in sagittal bands along CF projections (Lou and Bloedel, 1992; Bosman et al., 2010), but these approaches lack the spatial resolution attained with two-photon calcium imaging, which allows the visualization of PC ensembles spanning mediolateral distances that fall well within a microzone (Oscarsson, 1979; Chen et al., 1996). In such PC ensembles concerted activity in pairs of dendrites was inversely correlated with distance (Ozden et al., 2009). We demonstrate that coupling through Cx36 appears essential for state-dependent changes in PC coactivation during sensorimotor processing. Our data showed significantly different response profiles between WT and Cx36−/− mice and a significant increase in correlated CS activity in WT over Cx36−/− mice immediately following a sensory perturbation. Differences in correlation values between experimental groups for perturbation trials cannot be readily explained by mismatches in firing rates (de la Rocha et al., 2007), as ISI distributions and the mean firing rates were similar for both groups. Despite the significant effects on CS correlations, the ISI distributions even remained similar to baseline conditions as sensory perturbations occurred at low frequencies during rest. The observation that correlation values increased significantly in WT animals despite the low frequency of perturbations highlights the prominent impact of Cx36 gap-junctional coupling. The correlations between dendrites over mediolateral distances in Cx36-deficient mice appeared fairly invariant with respect to our experimental conditions (Fig. 4D, bottom), whereas WT animals showed increased correlations during sensorimotor processing (Fig. 4D, top). Thus, even though CS firing rates remained similar in Cx36−/− animals when compared with WT littermates and even though there was no detectable effect of Cx36 deficiency on CS activity under baseline conditions, the spatiotemporal patterning in functional ensembles of PCs alters during sensorimotor processing in that CS synchrony increases dynamically and prominently in a system with coupled olivary neurons, but not without.
Performing meta-k-means clustering (Ozden et al., 2008) on our data provided no clear indication of stable clustering patterns of dendrites. This could be due to the fact that necessary assumptions for this method are that grouping of dendrites is fairly stable throughout the recording and that the recording is sufficiently long (Ozden et al., 2012). Locomotion and twitch responses were generally brief. Furthermore, we studied an area involved in postural motor processes and our baseline condition may not be behaviorally invariant, but rather a fluid succession of minute postural adjustments. This possibility is supported by our finding that spontaneous coactivations during baseline conditions can be used as a predictor for small movements. We surmise that in behaving animals, clusters of dendrites within microcomplexes can vary in size depending on the region of cerebellar cortex and the animal's behavioral state, similarly to interzonal clusters (Welsh et al., 1995). Interestingly, during sensorimotor processing WT animals on average have more dendrites per cluster within a FOV than Cx36−/− mutants. This may reflect the ability of WT animals to recruit and group separate microcircuits as needed through olivary gap junctions, which is lost in Cx36−/− mice.
Temporal patterns and behavior
Synchronous CS discharges have been proposed to play a functional role in the onset of motion and/or coordination of muscle activity (Welsh et al., 1995; Ivry, 1996; Lang, 2001; Schweighofer et al., 2013) and Cx36 gap junctions mediate IO synchrony (Long et al., 2002) as well as coherence of harmaline-induced muscle tremor (Placantonakis et al., 2004). To find out to what extent sensory-evoked synchronous volleys of IO discharges can elicit motor responses we studied correlates of CS coactivity and motor behavior. Using treadmill motion as a trigger we found correlated CS coactivations preceding locomotion, but no correlates for its termination.
The controllable sensory perturbations and the temporally bounded twitch response they could evoke provided us with a means to carefully investigate differences in spatiotemporal CS patterning during sensorimotor processing and movement onset. The CS response profile differences we recorded following a sensory perturbation shed light on the observed differences in spatial correlations between dendrites. Following a perturbation, WT animals showed an immediate and well timed primary CS response spread across many dendrites after which a small secondary response generally occurred. The CS responses in Cx36−/− animals, on the other hand, were more localized and poorly timed, with a strong secondary response in part due to an increased occurrence of doublets compared with that in WT littermates.
The temporal execution of a twitch also differed: whereas the twitch execution in WT animals had a sharp onset, it was gradual and less consistent in Cx36−/− mice. Olivary gap junctions synchronize CS firing (Long et al., 2002; De Zeeuw et al., 2003), likely leading to tightly timed strong inhibition in the CN, followed by rebound firing during the typical PC CS pause. Such rebound firing can cause motor responses (Witter et al., 2013). A temporally spread CS volley could theoretically lead to a reduced or slow motor response as its impact on CN neurons would be reduced (Schweighofer et al., 2013), providing a possible explanation for both the difference in twitch execution between the groups and the lower chance of detecting twitches based on coactivations in Cx36−/− animals compared with WT littermates. Further inconsistencies in late twitch execution as observed in Cx36−/− mutants with respect to WT littermates could be due to on-line adjustments, which in turn also suffer from timing inaccuracies.
Whether the timing of neural signals involved in spinocerebellar reflexes deteriorates solely in the IO cannot be deduced with absolute certainty, since Cx36 gap junctions are also expressed upstream of the IO in the spinal tract (Matsumoto et al., 1988) and downstream in interneurons of the cerebellum (Dugué et al., 2009; Vervaeke et al., 2010). Given the low levels of expression of Cx36 in the spinal cord, it seems likely that temporal shifts in the spinal signals to the IO are initially small. It should be noted that activity within the olivo-cerebellar system can theoretically be maintained through recurrent connections (Kistler and De Zeeuw, 2002), potentially leading to temporal error propagation during reverberating olivo-cerebellar processing.
Functional implications
The subthreshold oscillations (Llinás and Yarom, 1981a,b) and extensive gap-junctional coupling in networks of olivary cells have given rise to theories of clock function and synchrony for motor performance mediated by the IO in cerebellar processing (Llinás, 2009; Lefler et al., 2013). Seemingly counter to this school of thought are the motor learning hypotheses that regard the IO primarily as a nucleus providing a signal to guide cerebellar learning (Marr, 1969; Albus, 1971). Reports on connexin36 gap-junction knock-outs have so far seemed to indicate a role for olivary electrical coupling in motor learning with little effect on on-line motor control (Van Der Giessen et al., 2008; van Essen et al., 2010).
We now demonstrate that a connexin36 deficiency affects timing of CS activity and motor responses directly, as evident from CS activity within distances up to 150 μm and temporal execution of spinocerebellar reflexes. Our results indicate that learning of timed responses may be impaired not only by lack of olivary connexin36-mediated modulation of cerebellar plasticity (Mathy et al., 2009; Bazzigaluppi et al., 2012; De Gruijl et al., 2012; Rasmussen et al., 2013), but also by timing inaccuracies in CS activity and movements arising directly from a lack of connexin36 gap-junctional coupling. Recent findings also provide evidence for short- and long-term modulation of olivary coupling strength, giving rise to nuanced functional hypotheses for olivary coupling (De Gruijl et al., 2014; Lefler et al., 2014; Mathy et al., 2014; Turecek et al., 2014). Possibly, the IO forms functional ensembles through Cx36 gap junctions to execute timed reflexes via synchronized spiking, the occurrence of which is used to drive cerebellar learning. The cerebellum would aim to override or avoid network states that triggered IO reflexes (De Gruijl et al., 2014). Thus, IO synchrony could both drive cerebellar learning (Van Der Giessen et al., 2008; De Gruijl et al., 2012) and mediate reflex-like movements as we have shown in the current study.
Footnotes
This work was supported by the Dutch Organization for Medical Sciences (ZonMw; C.I.D.Z.); Life Sciences (ALW; C.I.D.Z.); Senter (Neuro-Basic); and ERC-adv, CEREBNET, and C7 programs of the European Community (C.I.D.Z.). We thank J. Plugge for her expert technical assistance.
The authors declare no competing financial interests.
References
- Albus JS. A theory of cerebellar function. Math Biosci. 1971;10:25–61. doi: 10.1016/0025-5564(71)90051-4. [DOI] [Google Scholar]
- Andersson G, Hesslow G. Activity of Purkinje cells and interpositus neurones during and after periods of high frequency climbing fibre activation in the cat. Exp Brain Res. 1987;67:533–542. doi: 10.1007/BF00247286. [DOI] [PubMed] [Google Scholar]
- Apps R, Garwicz M. Anatomical and physiological foundations of cerebellar information processing. Nat Rev Neurosci. 2005;6:297–311. doi: 10.1038/nrn1646. [DOI] [PubMed] [Google Scholar]
- Bazzigaluppi P, De Gruijl JR, van der Giessen RS, Khosrovani S, De Zeeuw CI, de Jeu MTG. Olivary subthreshold oscillations and burst activity revisited. Front Neural Circuits. 2012;6:91. doi: 10.3389/fncir.2012.00091. [DOI] [PMC free article] [PubMed] [Google Scholar]
- Belluardo N, Mudò G, Trovato-Salinaro A, Le Gurun S, Charollais A, Serre-Beinier V, Amato G, Haefliger JA, Meda P, Condorelli DF. Expression of connexin36 in the adult and developing rat brain. Brain Res. 2000;865:121–138. doi: 10.1016/S0006-8993(00)02300-3. [DOI] [PubMed] [Google Scholar]
- Bengtsson F, Hesslow G. Cerebellar control of the inferior olive. Cerebellum. 2006;5:7–14. doi: 10.1080/14734220500462757. [DOI] [PubMed] [Google Scholar]
- Bloedel JR, Bracha V. On the cerebellum, cutaneomuscular reflexes, movement control and the elusive engrams of memory. Behav Brain Res. 1995;68:1–44. doi: 10.1016/0166-4328(94)00171-B. [DOI] [PubMed] [Google Scholar]
- Bosman LW, Koekkoek SK, Shapiro J, Rijken BF, Zandstra F, van der Ende B, Owens CB, Potters JW, de Gruijl JR, Ruigrok TJ, De Zeeuw CI. Encoding of whisker input by cerebellar Purkinje cells. J Physiol. 2010;588:3757–3783. doi: 10.1113/jphysiol.2010.195180. [DOI] [PMC free article] [PubMed] [Google Scholar]
- Chaumont J, Guyon N, Valera AM, Dugué GP, Popa D, Marcaggi P, Gautheron V, Reibel-Foisset S, Dieudonné S, Stephan A, Barrot M, Cassel JC, Dupont JL, Doussau F, Poulain B, Selimi F, Léna C, Isope P. Clusters of cerebellar Purkinje cells control their afferent climbing fiber discharge. Proc Natl Acad Sci U S A. 2013;110:16223–16228. doi: 10.1073/pnas.1302310110. [DOI] [PMC free article] [PubMed] [Google Scholar]
- Chen G, Hanson CL, Ebner TJ. Functional parasagittal compartments in the rat cerebellar cortex: an in vivo optical imaging study using neutral red. J Neurophysiol. 1996;76:4169–4174. doi: 10.1152/jn.1996.76.6.4169. [DOI] [PubMed] [Google Scholar]
- Condorelli DF, Parenti R, Spinella F, Trovato Salinaro AT, Belluardo N, Cardile V, Cicirata F. Cloning of a new gap junction gene (Cx36) highly expressed in mammalian brain neurons. Eur J Neurosci. 1998;10:1202–1208. doi: 10.1046/j.1460-9568.1998.00163.x. [DOI] [PubMed] [Google Scholar]
- Condorelli DF, Belluardo N, Trovato-Salinaro A, Mudò G. Expression of Cx36 in mammalian neurons. Brain Res Rev. 2000;32:72–85. doi: 10.1016/S0165-0173(99)00068-5. [DOI] [PubMed] [Google Scholar]
- De Gruijl JR, Bazzigaluppi P, de Jeu MT, De Zeeuw CI. Climbing fiber burst size and olivary sub-threshold oscillations in a network setting. PLoS Comput Biol. 2012;8:e1002814. doi: 10.1371/journal.pcbi.1002814. [DOI] [PMC free article] [PubMed] [Google Scholar]
- De Gruijl JR, Sokół PA, Negrello M, De Zeeuw CI. Modulation of electrotonic coupling in the inferior olive by inhibitory and excitatory inputs: integration in the glomerulus. Neuron. 2014;81:1215–1217. doi: 10.1016/j.neuron.2014.03.009. [DOI] [PubMed] [Google Scholar]
- de la Rocha J, Doiron B, Eric Shea-Brown E, Josiæ K, Reyes A. Correlation between neural spike trains increases with firing rate. Nature. 2007;448:802–806. doi: 10.1038/nature06028. [DOI] [PubMed] [Google Scholar]
- de Zeeuw CI, Holstege JC, Ruigrok TJ, Voogd J. Mesodiencephalic and cerebellar terminals terminate upon the same dendritic spines in the glomeruli of the cat and rat inferior olive: an ultrastructural study using a combination of [3H]leucine and wheat germ agglutinin coupled horseradish peroxidase ant. Neuroscience. 1990;34:645–655. doi: 10.1016/0306-4522(90)90171-Y. [DOI] [PubMed] [Google Scholar]
- De Zeeuw CI, Hertzberg EL, Mugnaini E. The dendritic lamellar body: a new neuronal organelle putatively associated with dendrodendritic gap junctions. J Neurosci. 1995;15:1587–1604. doi: 10.1523/JNEUROSCI.15-02-01587.1995. [DOI] [PMC free article] [PubMed] [Google Scholar]
- De Zeeuw CI, Van Alphen AM, Hawkins RK, Ruigrok TJ. Climbing fibre collaterals contact neurons in the cerebellar nuclei that provide a GABAergic feedback to the inferior olive. Neuroscience. 1997;80:981–986. doi: 10.1016/S0306-4522(97)00249-2. [DOI] [PubMed] [Google Scholar]
- De Zeeuw CI, Chorev E, Devor A, Manor Y, Van Der Giessen RS, De Jeu MT, Hoogenraad CC, Bijman J, Ruigrok TJ, French P, Jaarsma D, Kistler WM, Meier C, Petrasch-Parwez E, Dermietzel R, Sohl G, Gueldenagel M, Willecke K, Yarom Y. Deformation of network connectivity in the inferior olive of connexin 36-deficient mice is compensated by morphological and electrophysiological changes at the single neuron level. J Neurosci. 2003;23:4700–4711. doi: 10.1523/JNEUROSCI.23-11-04700.2003. [DOI] [PMC free article] [PubMed] [Google Scholar]
- De Zeeuw CI, Hoebeek FE, Bosman LW, Schonewille M, Witter L, Koekkoek SK. Spatiotemporal firing patterns in the cerebellum. Nat Rev Neurosci. 2011;12:327–344. doi: 10.1038/nrn3011. [DOI] [PubMed] [Google Scholar]
- Dugué GP, Brunel N, Hakim V, Schwartz E, Chat M, Lévesque M, Courtemanche R, Léna C, Dieudonné S. Electrical coupling mediates tunable low-frequency oscillations and resonance in the cerebellar Golgi cell network. Neuron. 2009;61:126–139. doi: 10.1016/j.neuron.2008.11.028. [DOI] [PubMed] [Google Scholar]
- Eccles J, Llinas R, Sasaki K. Excitation of cerebellar Purkinje cells by the climbing fibres. Nature. 1964;203:245–246. doi: 10.1038/203245a0. [DOI] [PubMed] [Google Scholar]
- Eccles JC, Provini L, Strata P, Táboríková H. Analysis of electrical potentials evoked in the cerebellar anterior lobe by stimulation of hindlimb and forelimb nerves. Exp Brain Res. 1968a;6:171–194. doi: 10.1007/BF00235123. [DOI] [PubMed] [Google Scholar]
- Eccles JC, Provini L, Strata P, Táboríková H. Topographical investigations on the climbing fiber inputs from forelimb and hindlimb afferents to the cerebellar anterior lobe. Exp Brain Res. 1968b;6:195–215. doi: 10.1007/BF00235124. [DOI] [PubMed] [Google Scholar]
- Gellman R, Houk JC, Gibson AR. Somatosensory properties of the inferior olive of the cat. J Comp Neurol. 1983;215:228–243. doi: 10.1002/cne.902150210. [DOI] [PubMed] [Google Scholar]
- Ghosh KK, Burns LD, Cocker ED, Nimmerjahn A, Ziv Y, El Gamal AE, Schnitzer MJ. Miniaturized integration of a fluorescence microscope. Nat Methods. 2011;8:871–878. doi: 10.1038/nmeth.1694. [DOI] [PMC free article] [PubMed] [Google Scholar]
- Ito M. Cerebellar microcomplexes. Int Rev Neurobiol. 1997;41:475–487. doi: 10.1016/S0074-7742(08)60366-9. [DOI] [PubMed] [Google Scholar]
- Ivry RB. The representation of temporal information in perception and motor control. Curr Opin Neurobiol. 1996;6:851–857. doi: 10.1016/S0959-4388(96)80037-7. [DOI] [PubMed] [Google Scholar]
- Jörntell H, Ekerot C, Garwicz M, Luo XL. Functional organization of climbing fibre projection to the cerebellar anterior lobe of the rat. J Physiol. 2000;522:297–309. doi: 10.1111/j.1469-7793.2000.00297.x. [DOI] [PMC free article] [PubMed] [Google Scholar]
- Kistler WM, De Zeeuw CI. Dynamical working memory and timed responses: the role of reverberating loops in the olivo-cerebellar system. Neural Comput. 2002;14:2597–2626. doi: 10.1162/089976602760407991. [DOI] [PubMed] [Google Scholar]
- Kistler WM, De Jeu MT, Elgersma Y, Van Der Giessen RS, Hensbroek R, Luo C, Koekkoek SK, Hoogenraad CC, Hamers FP, Gueldenagel M, Sohl G, Willecke K, De Zeeuw CI. Analysis of Cx36 knock-out does not support tenet that olivary gap junctions are required for complex spike synchronization and normal motor performance. Ann N Y Acad Sci. 2002;978:391–404. doi: 10.1111/j.1749-6632.2002.tb07582.x. [DOI] [PubMed] [Google Scholar]
- Lang EJ. Organization of olivocerebellar activity in the absence of excitatory glutamatergic input. J Neurosci. 2001;21:1663–1675. doi: 10.1523/JNEUROSCI.21-05-01663.2001. [DOI] [PMC free article] [PubMed] [Google Scholar]
- Lang EJ, Sugihara I, Welsh JP, Llinás R. Patterns of spontaneous Purkinje cell complex spike activity in the awake rat. J Neurosci. 1999;19:2728–2739. doi: 10.1523/JNEUROSCI.19-07-02728.1999. [DOI] [PMC free article] [PubMed] [Google Scholar]
- Lefler Y, Torben-Nielsen B, Yarom Y. Oscillatory activity, Phase differences and Phase resetting in the inferior olivary nucleus. Front Syst Neurosci. 2013;7:22. doi: 10.3389/fnsys.2013.00022. [DOI] [PMC free article] [PubMed] [Google Scholar]
- Lefler Y, Yarom Y, Uusisaari MY. Cerebellar inhibitory input to the inferior olive decreases electrical coupling and blocks subthreshold oscillations. Neuron. 2014;81:1389–1400. doi: 10.1016/j.neuron.2014.02.032. [DOI] [PubMed] [Google Scholar]
- Llinás R, Yarom Y. Properties and distribution of ionic conductances generating electroresponsiveness of mammalian inferior olivary neurones in vitro. J Physiol. 1981a;315:569–584. doi: 10.1113/jphysiol.1981.sp013764. [DOI] [PMC free article] [PubMed] [Google Scholar]
- Llinás R, Yarom Y. Electrophysiology of mammalian inferior olivary neurones in vitro. Different types of voltage-dependent ionic conductances. J Physiol. 1981b;315:549–567. doi: 10.1113/jphysiol.1981.sp013763. [DOI] [PMC free article] [PubMed] [Google Scholar]
- Llinás RR. Inferior olive oscillation as the temporal basis for motricity and oscillatory reset as the basis for motor error correction. Neuroscience. 2009;162:797–804. doi: 10.1016/j.neuroscience.2009.04.045. [DOI] [PMC free article] [PubMed] [Google Scholar]
- Llinas R, Baker R, Sotelo C. Electrotonic coupling between neurons in cat inferior olive. J Neurophysiol. 1974;37:560–571. doi: 10.1152/jn.1974.37.3.560. [DOI] [PubMed] [Google Scholar]
- Long MA, Deans MR, Paul DL, Connors BW. Rhythmicity without synchrony in the electrically uncoupled inferior olive. J Neurosci. 2002;22:10898–10905. doi: 10.1523/JNEUROSCI.22-24-10898.2002. [DOI] [PMC free article] [PubMed] [Google Scholar]
- Lou JS, Bloedel JR. Responses of sagittally aligned Purkinje cells during perturbed locomotion: synchronous activation of climbing fiber inputs. J Neurophysiol. 1992;68:570–580. doi: 10.1152/jn.1992.68.2.570. [DOI] [PubMed] [Google Scholar]
- Marr D. A theory of cerebellar cortex. J Physiol. 1969;202:437–470. doi: 10.1113/jphysiol.1969.sp008820. [DOI] [PMC free article] [PubMed] [Google Scholar]
- Mathy A, Ho SS, Davie JT, Duguid IC, Clark BA, Häusser M. Encoding of oscillations by axonal bursts in inferior olive neurons. Neuron. 2009;62:388–399. doi: 10.1016/j.neuron.2009.03.023. [DOI] [PMC free article] [PubMed] [Google Scholar]
- Mathy A, Clark BA, Häusser M. Synaptically-induced long-term modulation of electrical coupling in the inferior olive. Neuron. 2014;81:1290–1296. doi: 10.1016/j.neuron.2014.01.005. [DOI] [PMC free article] [PubMed] [Google Scholar]
- Matsumoto A, Arnold AP, Zampighi GA, Micevych PE. Androgenic regulation of gap junctions between motoneurons in the rat spinal cord. J Neurosci. 1988;8:4177–4183. doi: 10.1523/JNEUROSCI.08-11-04177.1988. [DOI] [PMC free article] [PubMed] [Google Scholar]
- Miyakawa H, Lev-Ram V, Lasser-Ross N, Ross WN. Calcium transients evoked by climbing fiber and parallel fiber synaptic inputs in guinea pig cerebellar Purkinje neurons. J Neurophysiol. 1992;68:1178–1189. doi: 10.1152/jn.1992.68.4.1178. [DOI] [PubMed] [Google Scholar]
- Oscarsson O. Functional units of the cerebellum-sagittal zones and microzones. Trends Neurosci. 1979;2:143–145. doi: 10.1016/0166-2236(79)90057-2. [DOI] [Google Scholar]
- Ozden I, Lee HM, Sullivan MR, Wang SS. Identification and clustering of event patterns from in vivo multiphoton optical recordings of neuronal ensembles. J Neurophysiol. 2008;100:495–503. doi: 10.1152/jn.01310.2007. [DOI] [PMC free article] [PubMed] [Google Scholar]
- Ozden I, Sullivan MR, Lee HM, Wang SS. Reliable coding emerges from coactivation of climbing fibers in microbands of cerebellar Purkinje neurons. J Neurosci. 2009;29:10463–10473. doi: 10.1523/JNEUROSCI.0967-09.2009. [DOI] [PMC free article] [PubMed] [Google Scholar]
- Ozden I, Dombeck DA, Hoogland TM, Tank DW, Wang SS. Widespread state-dependent shifts in cerebellar activity in locomoting mice. PLoS One. 2012;7:e42650. doi: 10.1371/journal.pone.0042650. [DOI] [PMC free article] [PubMed] [Google Scholar]
- Placantonakis DG, Bukovsky AA, Zeng XH, Kiem HP, Welsh JP. Fundamental role of inferior olive connexin 36 in muscle coherence during tremor. Proc Natl Acad Sci U S A. 2004;101:7164–7169. doi: 10.1073/pnas.0400322101. [DOI] [PMC free article] [PubMed] [Google Scholar]
- Provini L, Redman S, Strata P. Mossy and climbing fibre organization on the anterior lobe of the cerebellum activated by forelimb and hindlimb areas of the sensorimotor cortex. Exp Brain Res. 1968;6:216–233. doi: 10.1007/BF00235125. [DOI] [PubMed] [Google Scholar]
- Rasmussen A, Jirenhed DA, Zucca R, Johansson F, Svensson P, Hesslow G. Number of spikes in climbing fibers determines the direction of cerebellar learning. J Neurosci. 2013;33:13436–13440. doi: 10.1523/JNEUROSCI.1527-13.2013. [DOI] [PMC free article] [PubMed] [Google Scholar]
- Schweighofer N, Lang EJ, Kawato M. Role of the olivo-cerebellar complex in motor learning and control. Front Neural Circuits. 2013;7:94. doi: 10.3389/fncir.2013.00094. [DOI] [PMC free article] [PubMed] [Google Scholar]
- Sotelo C, Llinas R, Baker R. Structural study of inferior olivary nucleus of the cat: morphological correlates of electrotonic coupling. J Neurophysiol. 1974;37:541–559. doi: 10.1152/jn.1974.37.3.541. [DOI] [PubMed] [Google Scholar]
- Stosiek C, Garaschuk O, Holthoff K, Konnerth A. In vivo two-photon calcium imaging of neuronal networks. Proc Natl Acad Sci U S A. 2003;100:7319–7324. doi: 10.1073/pnas.1232232100. [DOI] [PMC free article] [PubMed] [Google Scholar]
- Sullivan MR, Nimmerjahn A, Sarkisov DV, Helmchen F, Wang SS. In vivo calcium imaging of circuit activity in cerebellar cortex. J Neurophysiol. 2005;94:1636–1644. doi: 10.1152/jn.01013.2004. [DOI] [PubMed] [Google Scholar]
- Turecek J, Yuen GS, Han VZ, Zeng XH, Bayer KU, Welsh JP. NMDA receptor activation strengthens weak electrical coupling in mammalian brain. Neuron. 2014;81:1375–1388. doi: 10.1016/j.neuron.2014.01.024. [DOI] [PMC free article] [PubMed] [Google Scholar]
- Van Der Giessen RS, Maxeiner S, French PJ, Willecke K, De Zeeuw CI. Spatiotemporal distribution of Connexin45 in the olivocerebellar system. J Comp Neurol. 2006;495:173–184. doi: 10.1002/cne.20873. [DOI] [PubMed] [Google Scholar]
- Van Der Giessen RS, Koekkoek SK, van Dorp S, De Gruijl JR, Cupido A, Khosrovani S, Dortland B, Wellershaus K, Degen J, Deuchars J, Fuchs EC, Monyer H, Willecke K, De Jeu MT, De Zeeuw CI. Role of olivary electrical coupling in cerebellar motor learning. Neuron. 2008;58:599–612. doi: 10.1016/j.neuron.2008.03.016. [DOI] [PubMed] [Google Scholar]
- van Essen TA, van der Giessen RS, Koekkoek SK, Vanderwerf F, De Zeeuw CI, van Genderen PJ, Overbosch D, de Jeu MT. Anti-malaria drug mefloquine induces motor learning deficits in humans. Front Neurosci. 2010;4:191. doi: 10.3389/fnins.2010.00191. [DOI] [PMC free article] [PubMed] [Google Scholar]
- Vervaeke K, Lorincz A, Gleeson P, Farinella M, Nusser Z, Silver RA. Rapid desynchronization of an electrically coupled interneuron network with sparse excitatory synaptic input. Neuron. 2010;67:435–451. doi: 10.1016/j.neuron.2010.06.028. [DOI] [PMC free article] [PubMed] [Google Scholar]
- Vogelstein JT, Packer AM, Machado TA, Sippy T, Babadi B, Yuste R, Paninski L. Fast nonnegative deconvolution for spike train inference from population calcium imaging. J Neurophysiol. 2010;104:3691–3704. doi: 10.1152/jn.01073.2009. [DOI] [PMC free article] [PubMed] [Google Scholar]
- Welsh JP, Lang EJ, Suglhara I, Llinás R. Dynamic organization of motor control within the olivocerebellar system. Nature. 1995;374:453–457. doi: 10.1038/374453a0. [DOI] [PubMed] [Google Scholar]
- Witter L, Canto CB, Hoogland TM, de Gruijl JR, De Zeeuw CI. Strength and timing of motor responses mediated by rebound firing in the cerebellar nuclei after Purkinje cell activation. Front Neural Circuits. 2013;7:133. doi: 10.3389/fncir.2013.00133. [DOI] [PMC free article] [PubMed] [Google Scholar]